
I am sharing with you something I learnt over the years and have read recently too. This migth help many of us, investors in the current market situations.
How do we know when a bear market ends and a bull market begins?
What is 'the line in the sand' that tells us that a bear market has come to an end and a bull market has resumed?
Some lines are clear in the stock market. Like declaring a bear market when stocks fall 20% from a prior high. But it’s less clear when the line is crossed the other way. Like when a bear becomes a new bull.
There isn’t a widely accepted definition. But to declare an end to this bear market, I have my own measures… including a time-tested indicator with a great track record over the last two decades.
So today let’s talk about moving averages. I’ll go over why I use them, plus the specific average that could signal an end to this bear market…
How to Spot a Change in Trend
A moving average is an indication of trend. It tells you if prices are generally moving higher or lower over a trailing period.
Moving averages are closely followed because they can signal a change in the stock market’s direction. If an index like the S&P 500 has seen a period of rising prices but then suddenly crosses below a moving average – that’s an early warning signal of a change in trend.
While you can look at any trailing period you want, many investors focus on intermediate-term time frames like the popular 50-day moving average (MA).
But when it comes to signaling an end to this bear market, my focus is on one key moving average that’s had a track record of success during prior busts…
When Bust Turns to Boom
The 200-day MA measures the “big picture” prevailing trend since it averages prices over a longer time frame.
And when it comes to bear markets, the 200-day MA becomes one of my go-to indicators for spotting a potential change in trend.
Just look at how things unfolded during the last two prolonged bear markets that occurred during the 2000 “dot-com” bust and 2008 financial crisis. Those episodes were notable due to the magnitude of the price decline and their length of time.
During those downtrends, the S&P 500 never sustained a cross above the 200-day MA until the true bottom was established.
Here’s the S&P 500 and the 200-day MA (yellow line) during the dot-com bear market… between 2000 and 2003
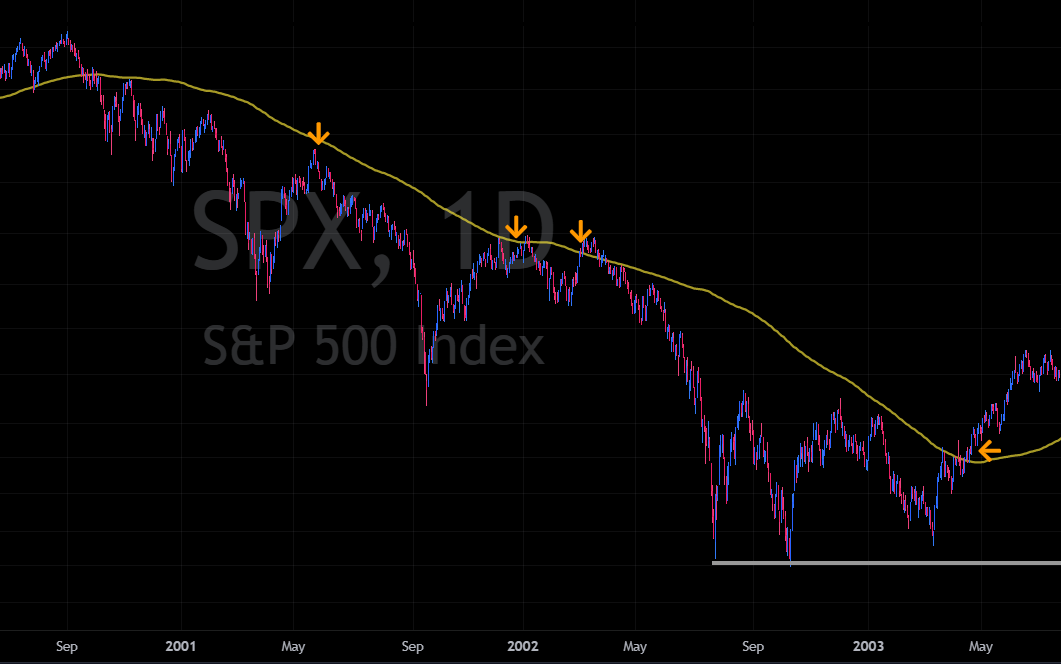
The arrows show the attempts at testing the 200-day MA. But ultimately, those attempts failed.
It wasn’t until 2003 (left facing arrow) that the index achieved escape velocity.
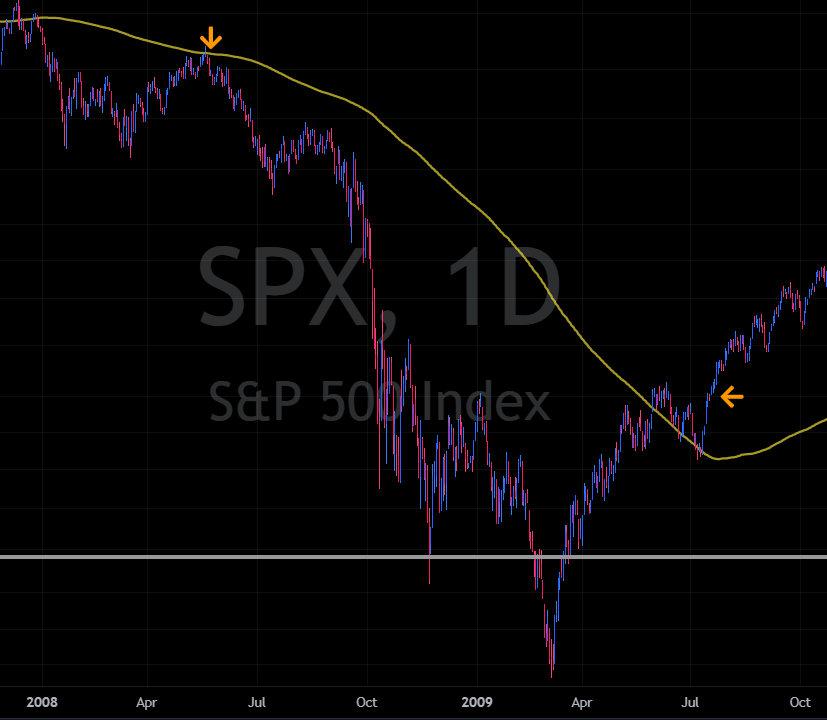
During the financial crisis in 2008, the index never crossed above the 200-day MA until the bottom was seen.
Now take a look at what’s happened this year…
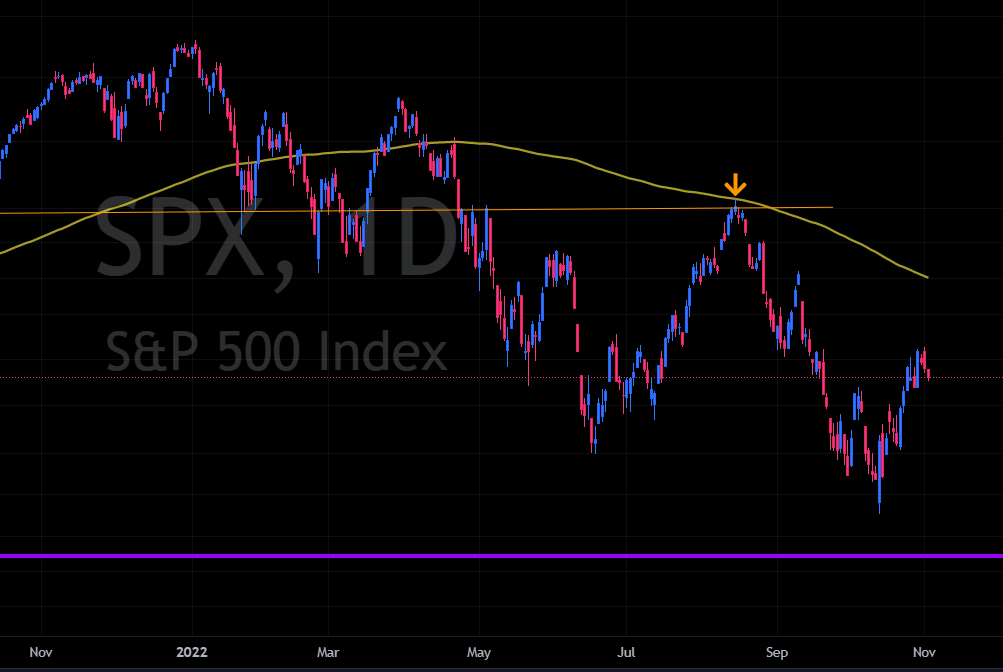
Ever since falling into bear market territory, the S&P 500 tested the 200-day MA once and failed (Orange down facing arrow).
And with the recent rally, we could be gearing up for another critical test at the 200-day MA – which sits just 5% above the current price.
If the S&P 500 can sustain a cross above the 200-day MA, then that’s a great sign the big-picture trend is changing for the better.
But if the index fails at that level, then prepare for the next wave of selling.
Wait until the 200MA is decisively reclaimed before being fully confident that the bear market is over!
Until then, all rallies are considered to be bear market rally, in my view.
Happy Learning and Successful Investing.
Disclaimer: This material is intended for educational purposes only, and is not recommendations to buy or sell any financial instruments or products. Do your own due diligence and make your own decision. The value of your investments can rise as well as fall. Capital is at risk when investing in any financial products. You could get back less than you invested. Past performance may not be indicative of future results.