Before we get into more strategies, let's go back to one of the basic analysis, which is the CANDLESTICK PATTERNS. In this topic I'm going to focus on the green candlesticks. But first, what do those mean?
Candlesticks: Candlesticks determine the BUYING/SELLING POWER of the market at a certain period of time. Whether you set your timeframe hourly, daily, weekly, monthly, or even timeframes within 15minutes, 30minutes, etc. With this strategy, you get to understand what is happening to the market. You'll know if more people are buying or if more people are selling. There are two types of candlesticks. Green and Red.
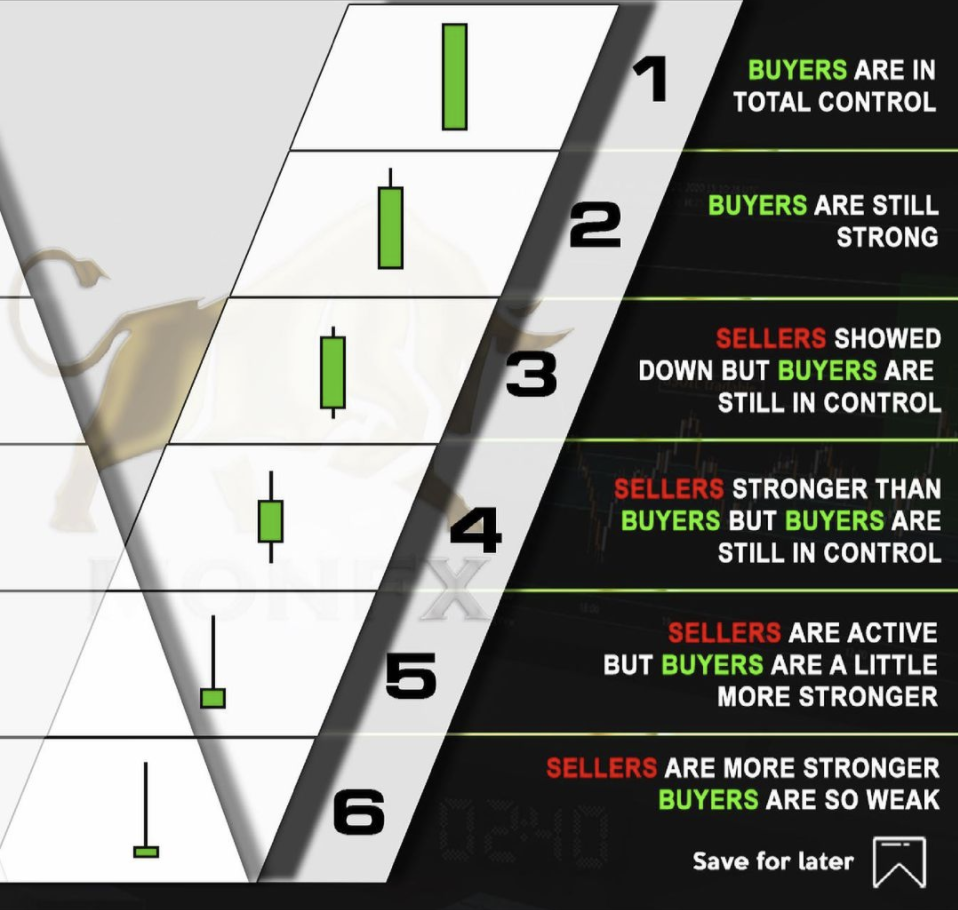
• A green candlestick means that the opening price on that timeframe was lower than the closing price that timeframe (i.e. the price moved up)
• Red candlestick means that the opening price was higher than the closing price that timeframe (i.e. the price moved down)
For this topic let's focus on the GREEN CANDLESTICK
The formation of candles has numerous variations. It's important you understand what each type of candlestick means. Check the figure below to understand every type of candle and the level of buying power.

🚀🚀🚀 How I use candlesticks (Explained like we're 5) 🚀🚀🚀
What I ALWAYS do when reading the candles, I determine the strength of the BUYING or SELLING power. I use the timeframes: Daily, Hourly, 30mins
After determining the buying/selling power, I check the recent transactions on how much has been bought or sold in the market. For crypto, you can do this by checking the token's contract address and check how many have bought or sold during a specific period of time, and how much has been bought and sold.
After determining whether more have bought or sold, I check the latest news about it. In crypto, most tokens have group chats, pages, and websites. So I visit all of those and see what has been announced recently, and what has been discussed.
Lastly, once I have all the information I need that's when I use my other strategies with the candlestick, to add more confluence in making my decision. I use Support & Resistance lines, and Triangles to support my theory whether it is a buy or a sell.
________________________________________________________________________
Did you guys find my explanation easy to understand? Try it out, let me know what you guys think, let me know what you guys are going to BUY in. You can practice in Investagram to see if this strategy works. AND if you liked this content, please do buy me a cup of virtual coffee, just click the button. This will really help fuel my work to provide all of you with all the strategies that I use. Cheers! ☕️☕️
My hot trades:
I am currently looking in buying into a few alt-coins. These are:
PUFFYDOG coin
CHANGE token
FEG token
BONFIRE token
Check these out and buy into the stock along with me! Good luck and enjoy!
