
To subscribe to this daily newsletter (2 reports daily during the week, and one report on Sunday), follow the link below to get started with as little as $10/month!
https://www.buymeacoffee.com/bitcoincharts
LIMITED TIME SPECIAL OFFER: To those that missed the lifetime membership offer, there are still 4 left! $108 (same price as an annual membership) for lifetime access to our market reports. DM me on Twitter for more info!
I recommend reading these reports on the Buy Me A Coffee platform for optimal formatting.
You will find the content below in this order:
1. Definitions
2. The Good
3. The Bad
4. CME Gaps
5. Key Levels
6. Final Thoughts
DEFINITIONS
Liquidity zones are high volume levels that offer support and resistance
Hidden bearish divergence: creating a lower high in price, with a higher high on the oscillators. This signals a possible trend continuation down.
Bearish divergence: higher high in price, lower high on the oscillators. This signals a possible trend reversal down.
Hidden bullish divergence: creating a higher low in price, with a lower low on the oscillators. This signals a possible trend continuation up.
Bullish divergence: creating a lower low in price, with a higher low on the oscillators. This signals a possible trend reversal up.
SR flip: turning old resistance into support, and vice-versa.
Fractal: recurring geometric pattern.
THE GOOD
Daily Timeframe
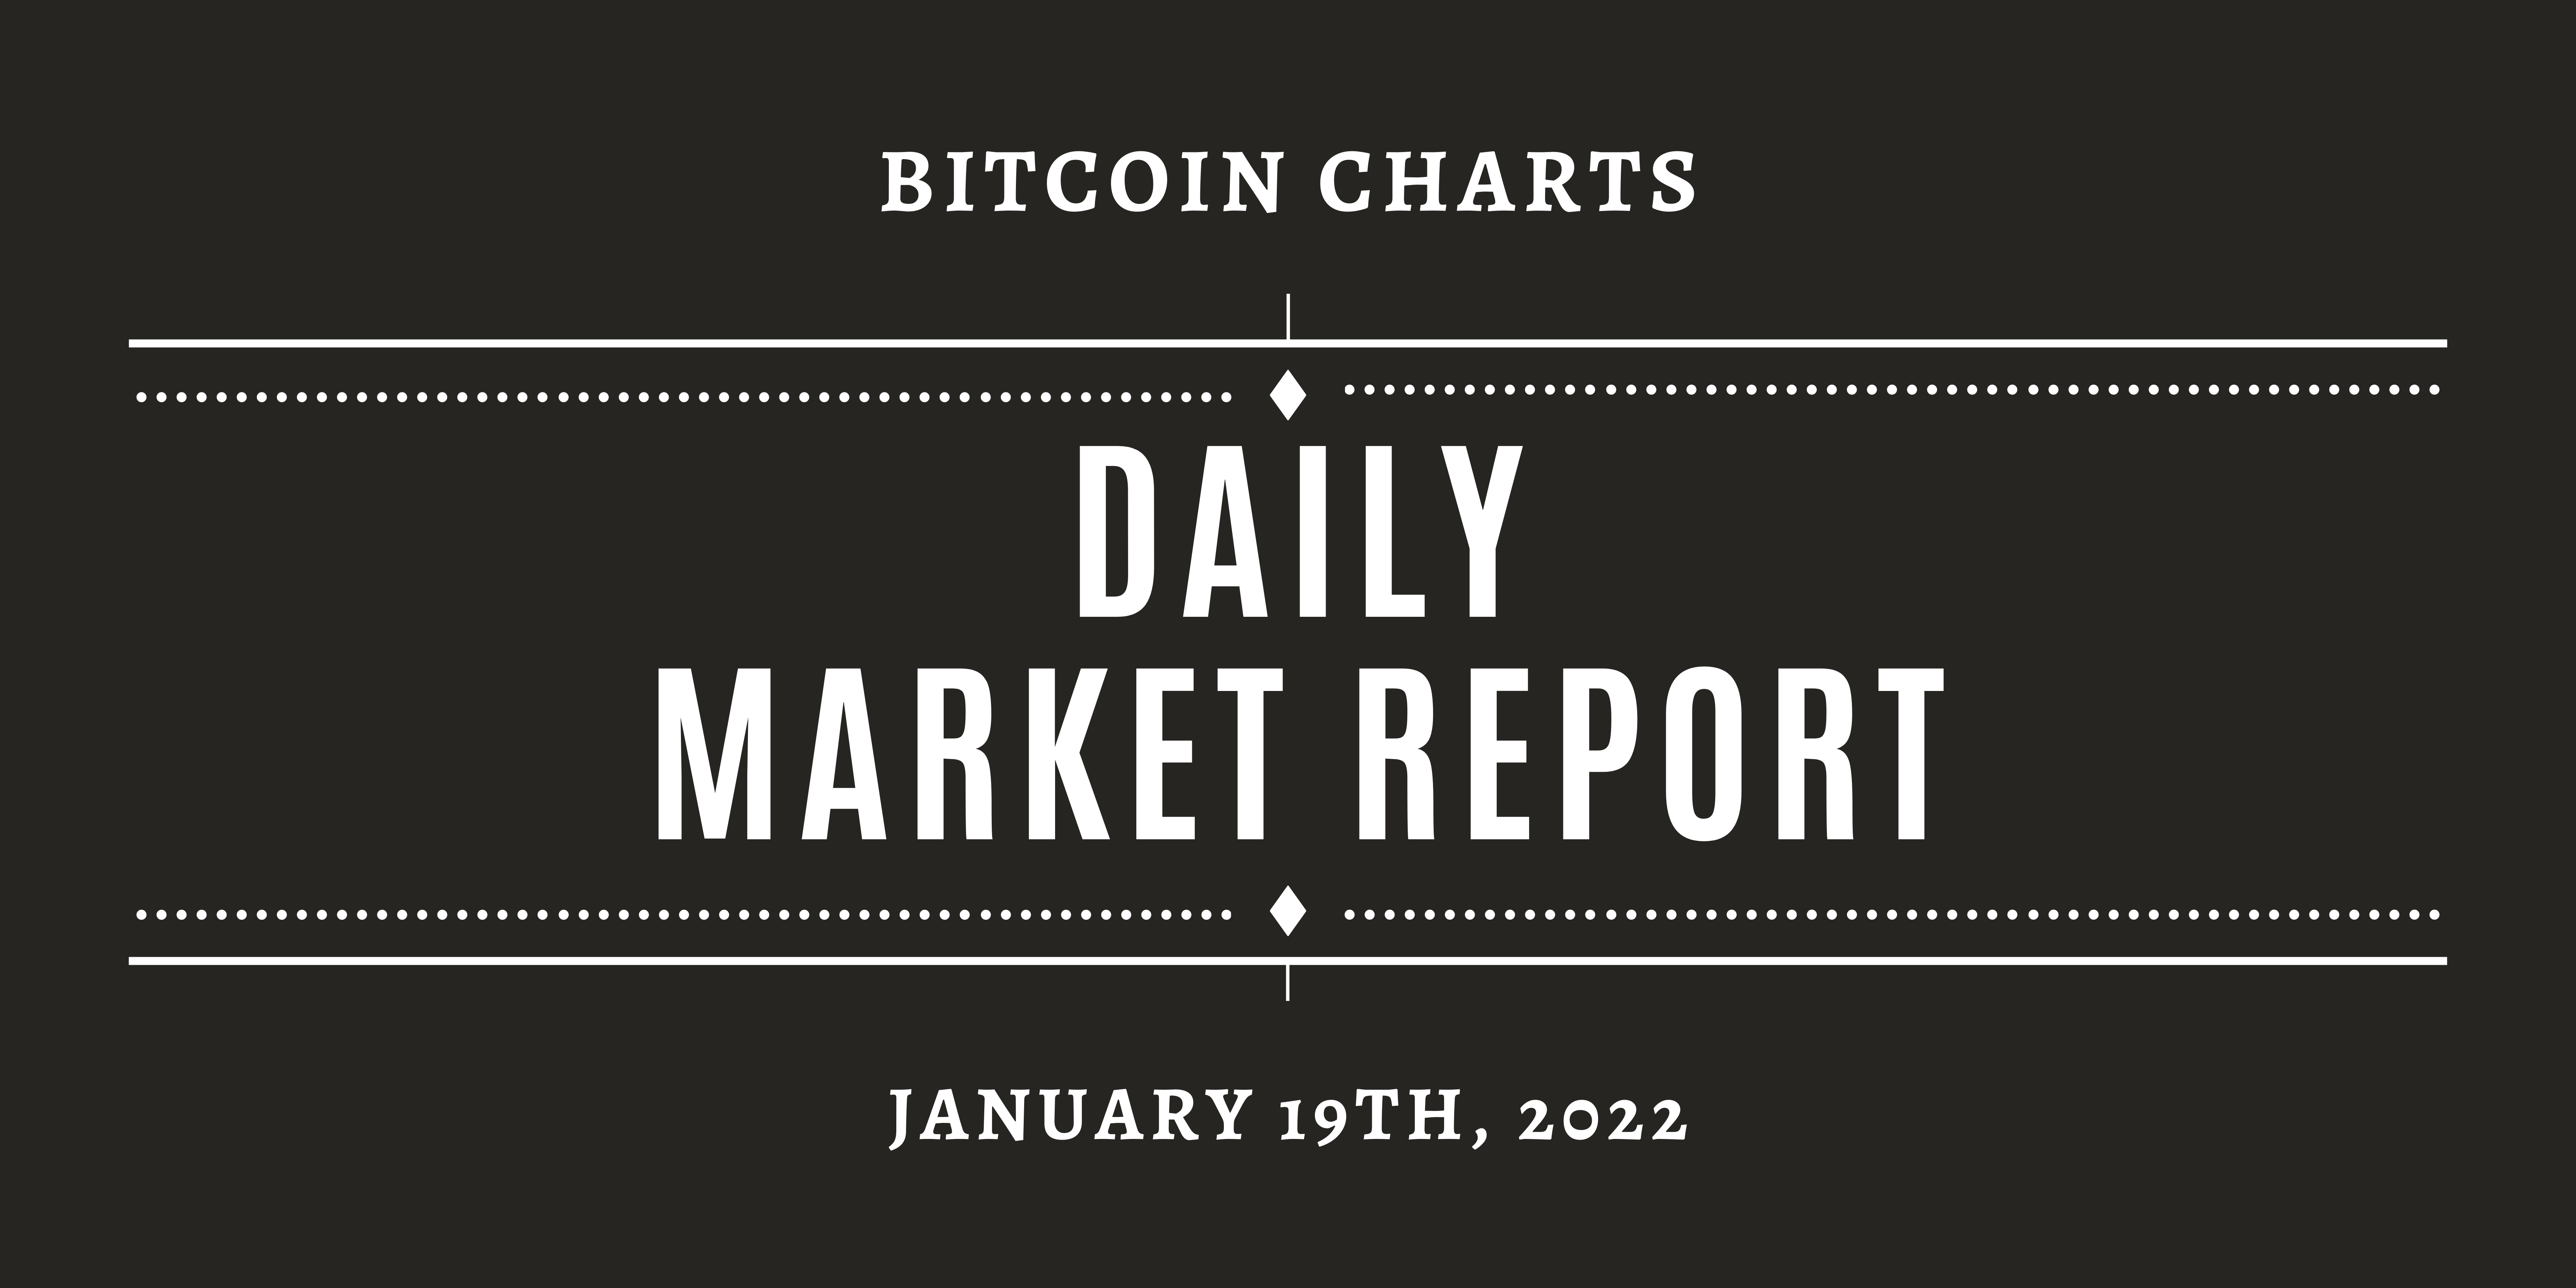
Key Liquidity Zone (LQZ)
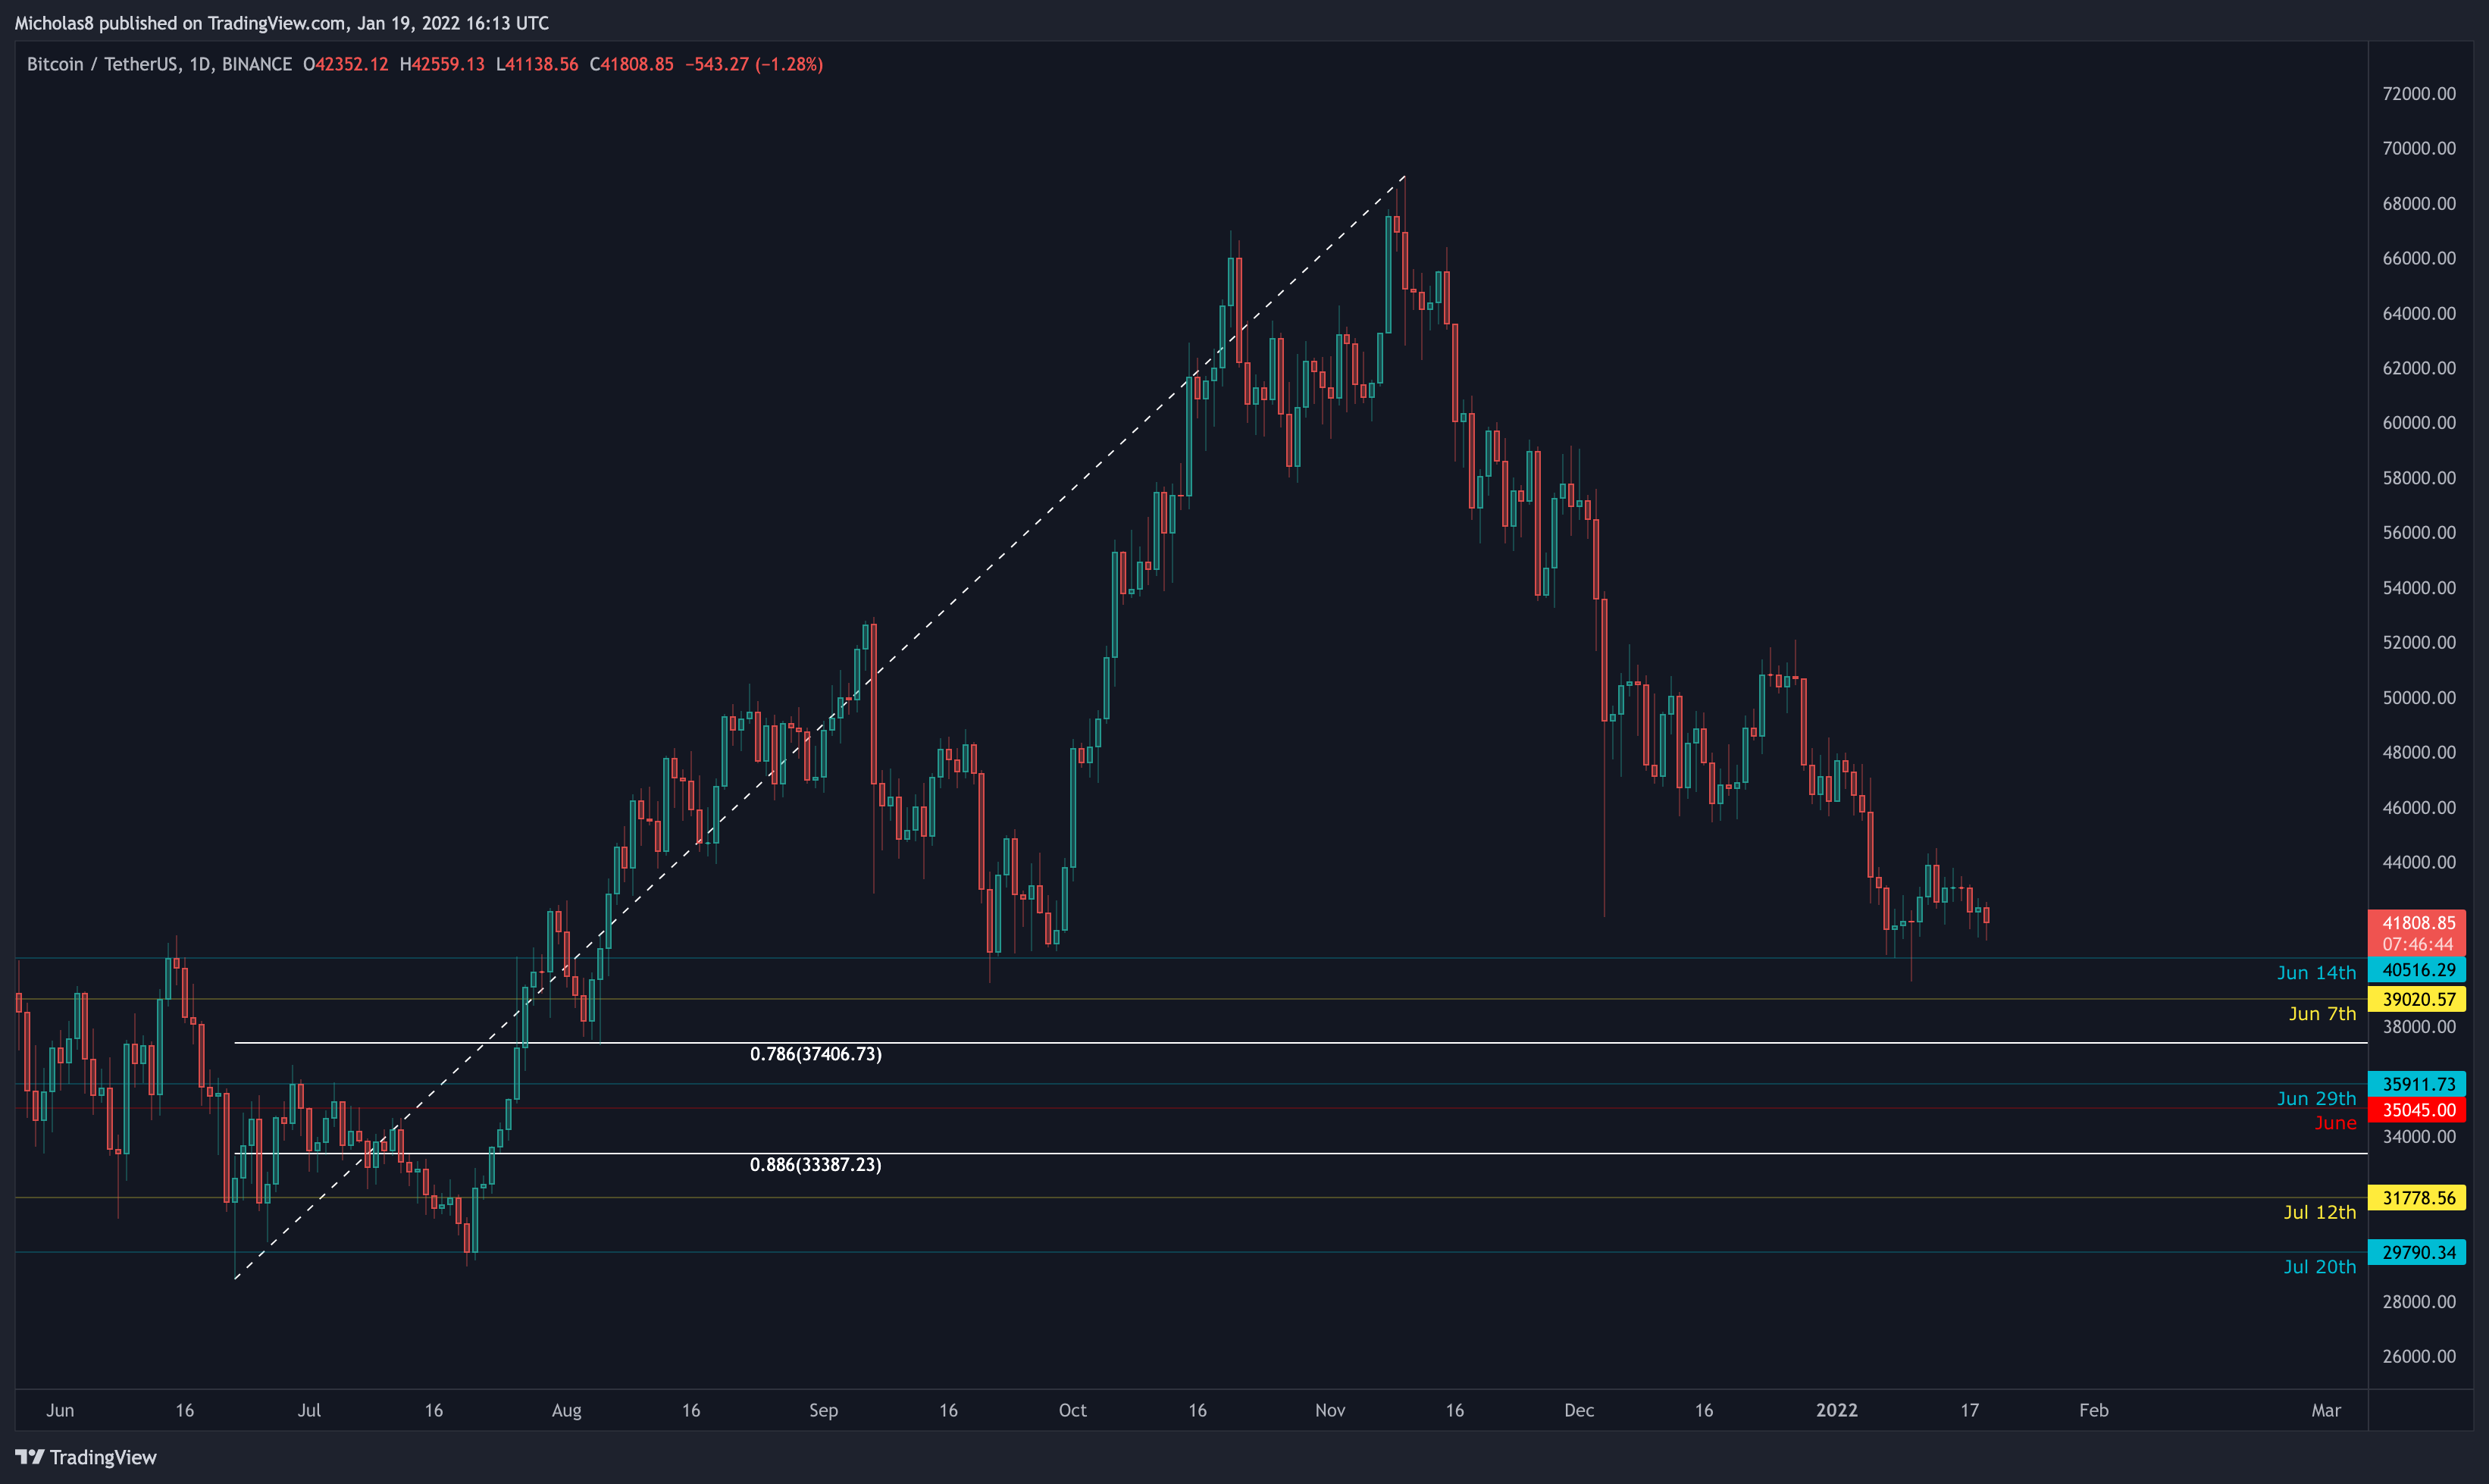
Zone 1: Sitting between 33.9k and 35.2k, Bitcoin is still trading above this Key Daily Liquidity Zone. As long Bitcoin remains above this zone, we can expect it to act as support.
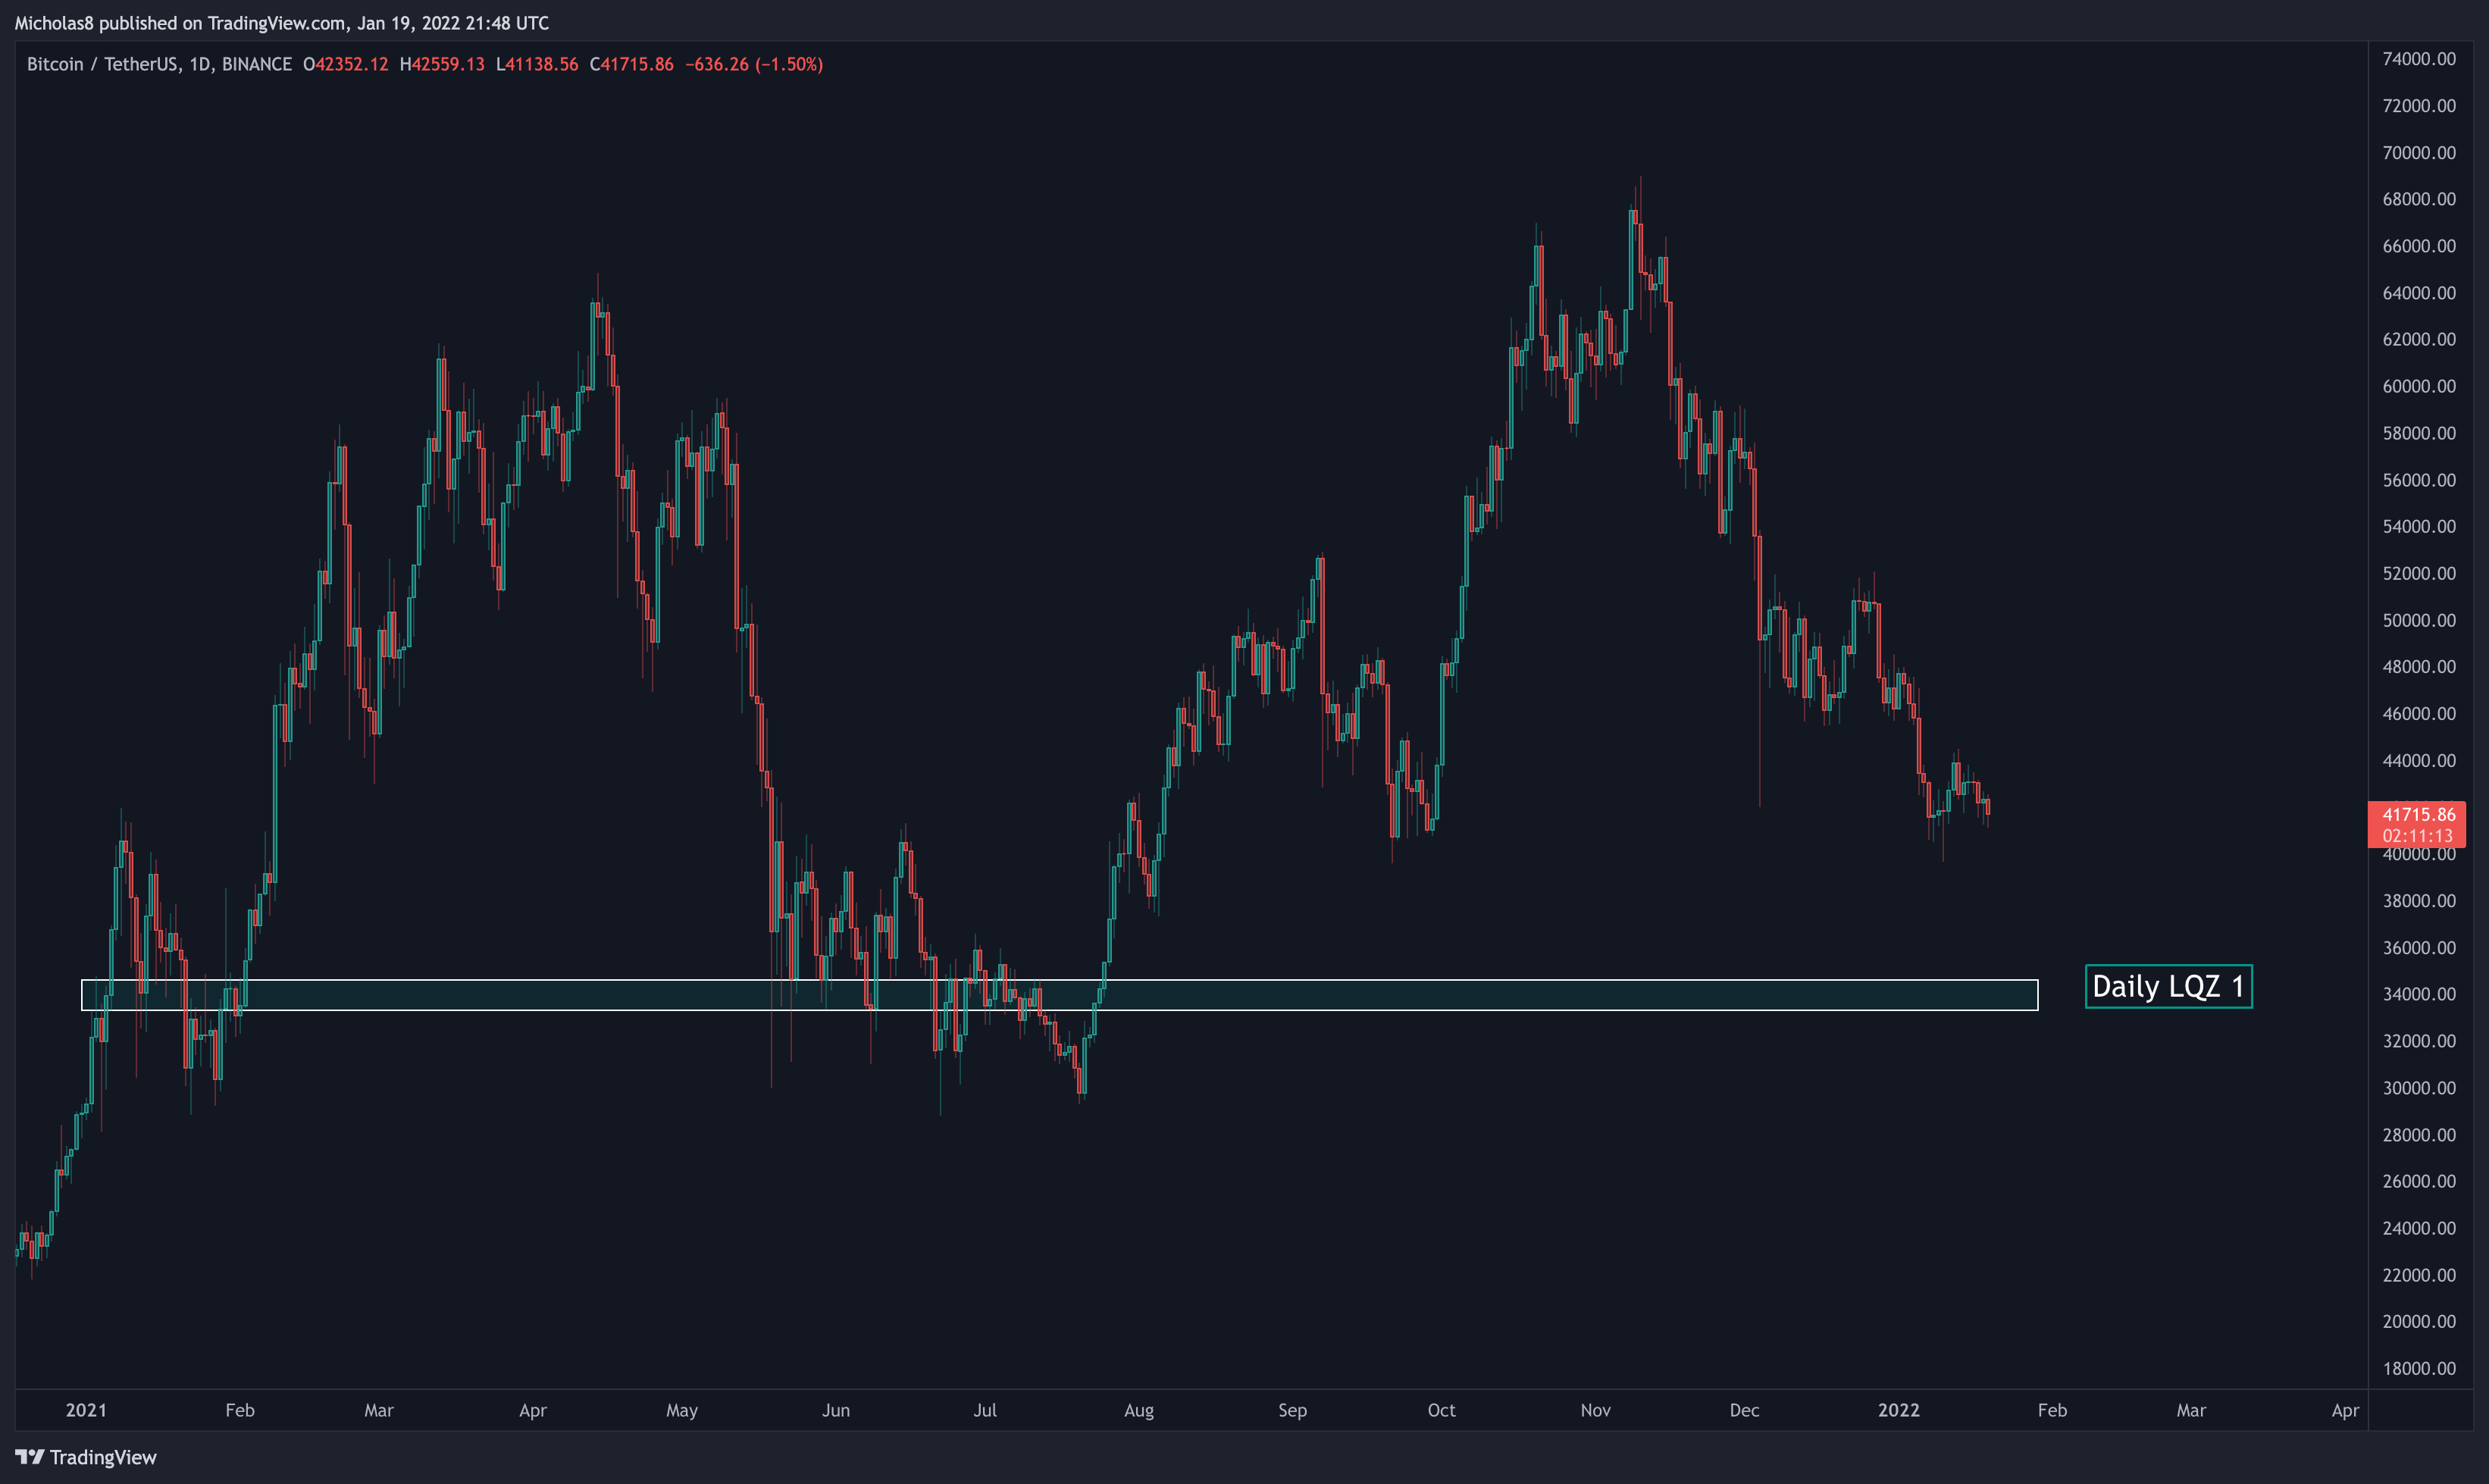
Divergences
Bullish Divergence
Bitcoin has lower lows in price, with higher lows in the MACD. This is a bullish divergence, which signals a possible trend reversal up.
Invalidation: Lower low in price and in the MACD.
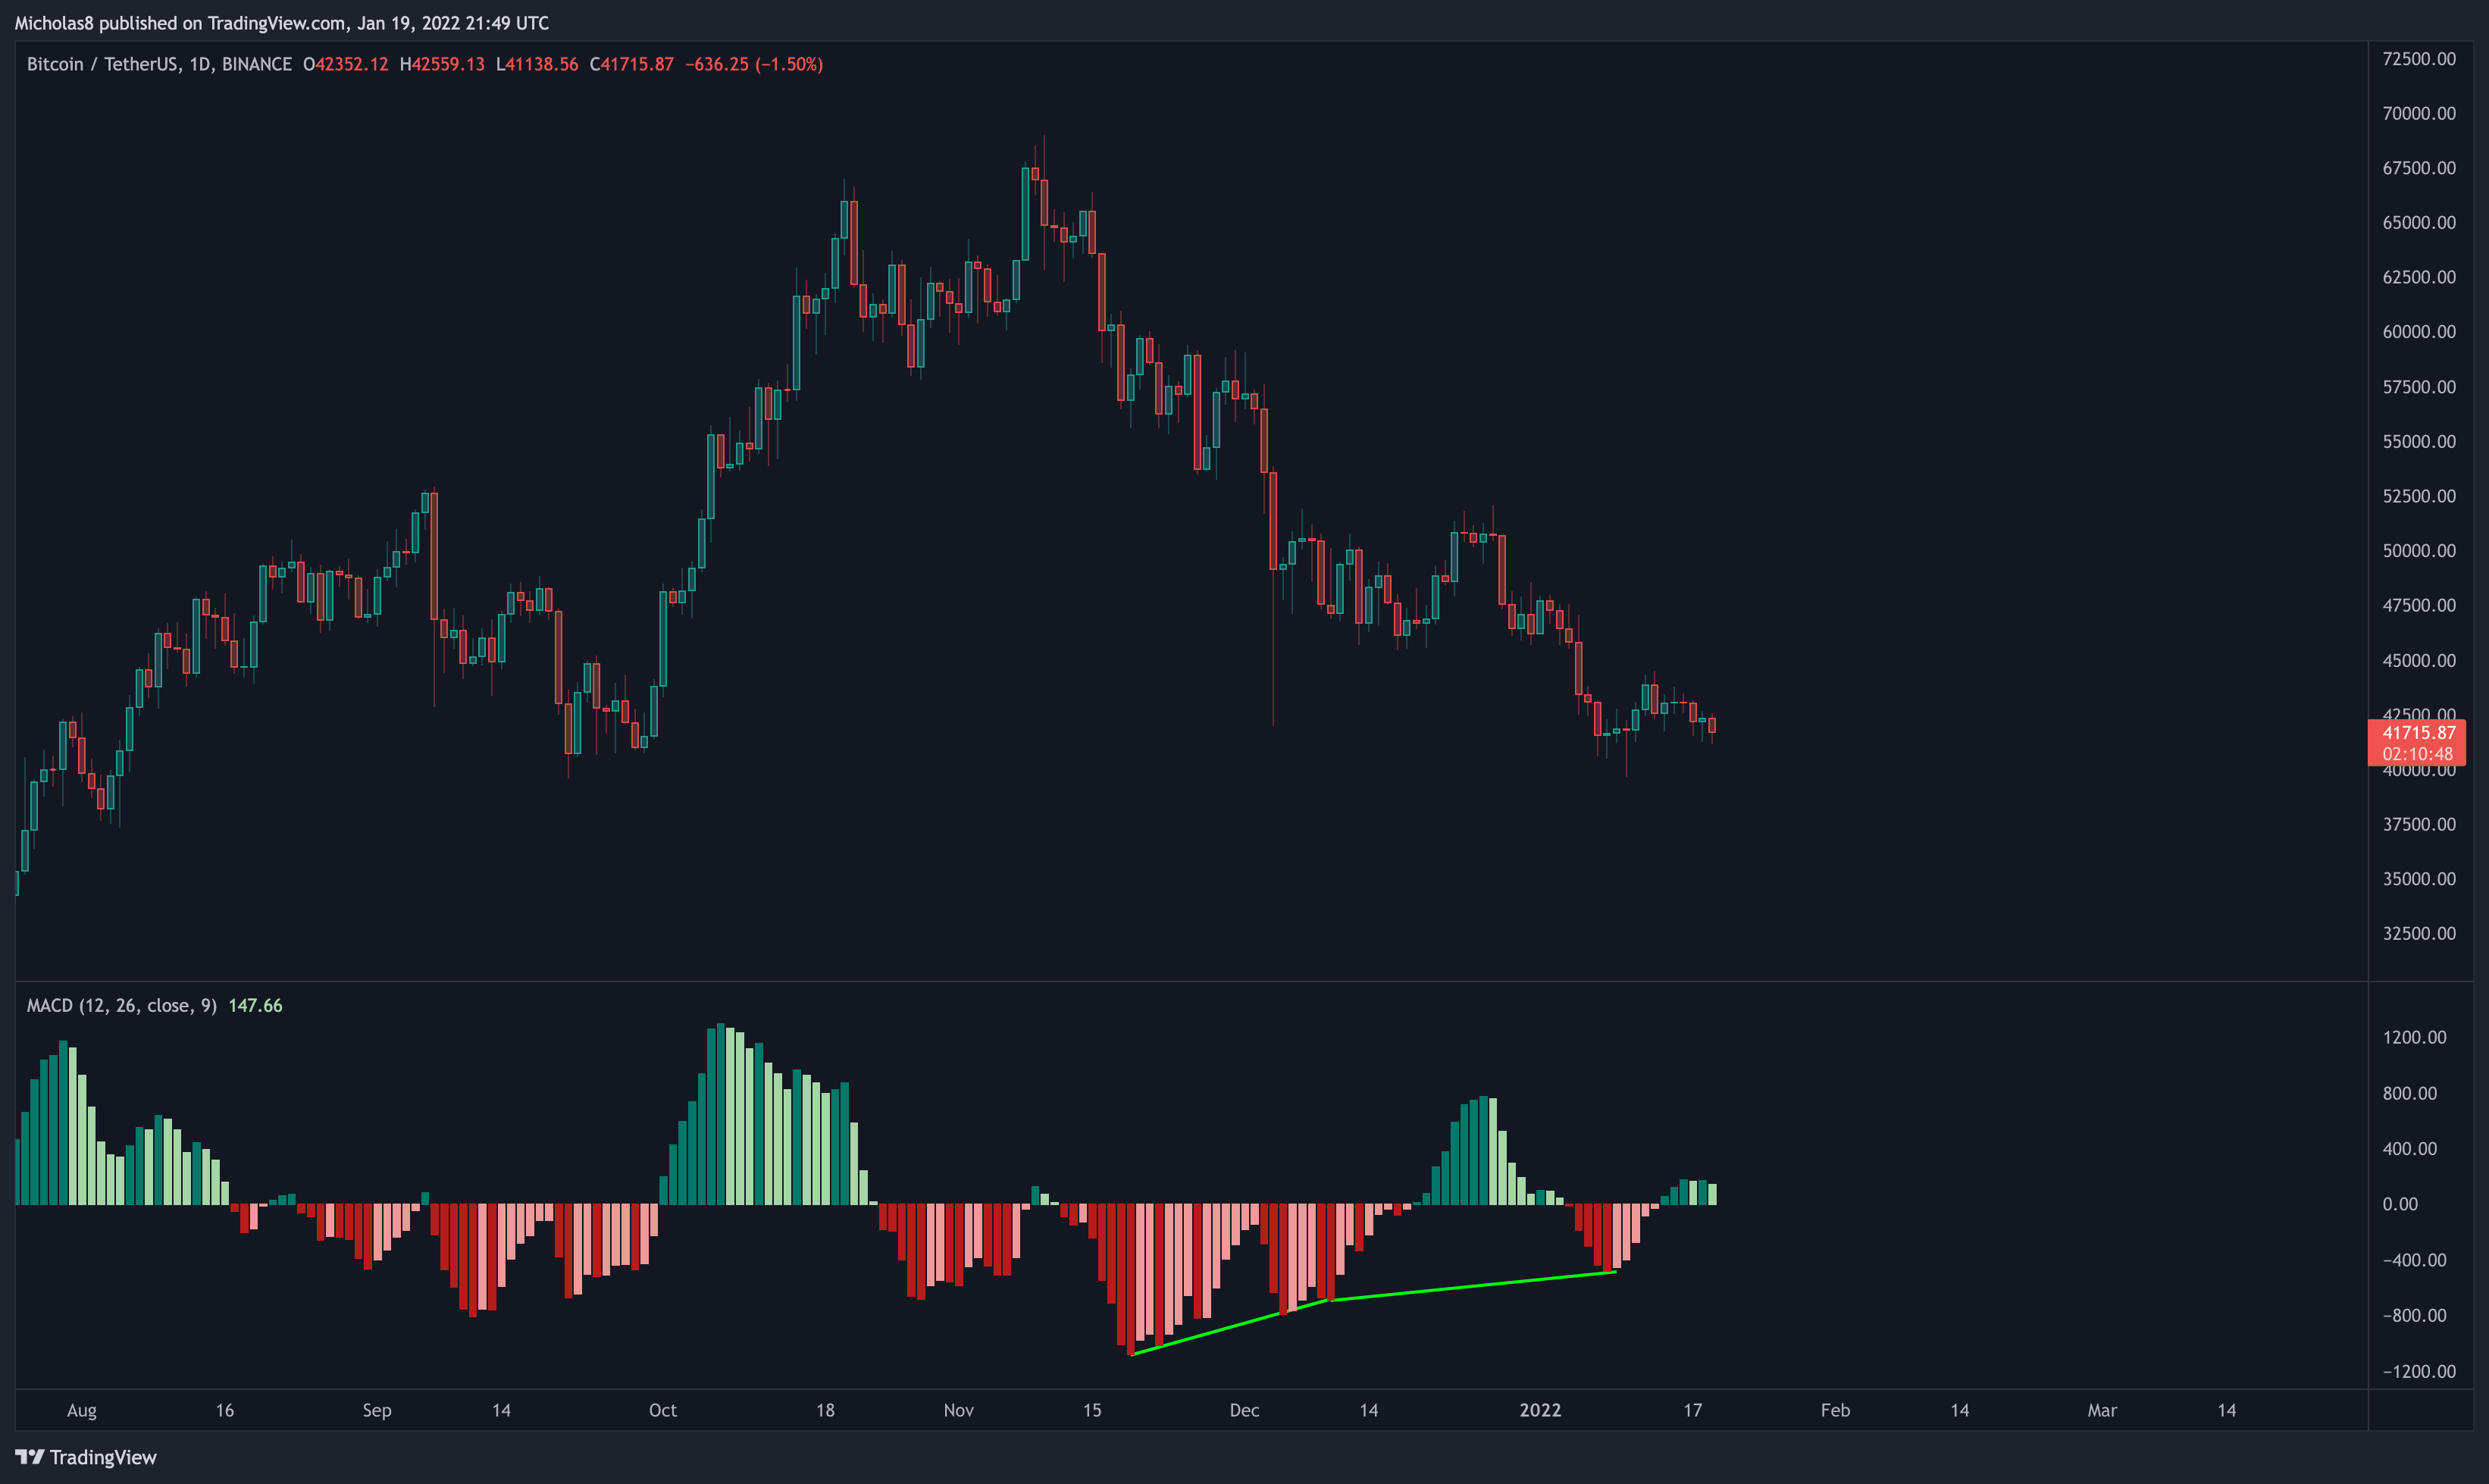
Patterns
*Be sure to map out all of your Key Levels and Fibonacci Levels as well as they are likely to be points of resistance and/or rejection when in confluence with divergences.
Falling Wedge
4H Timeframe
Key Liquidity Zone (LQZ)
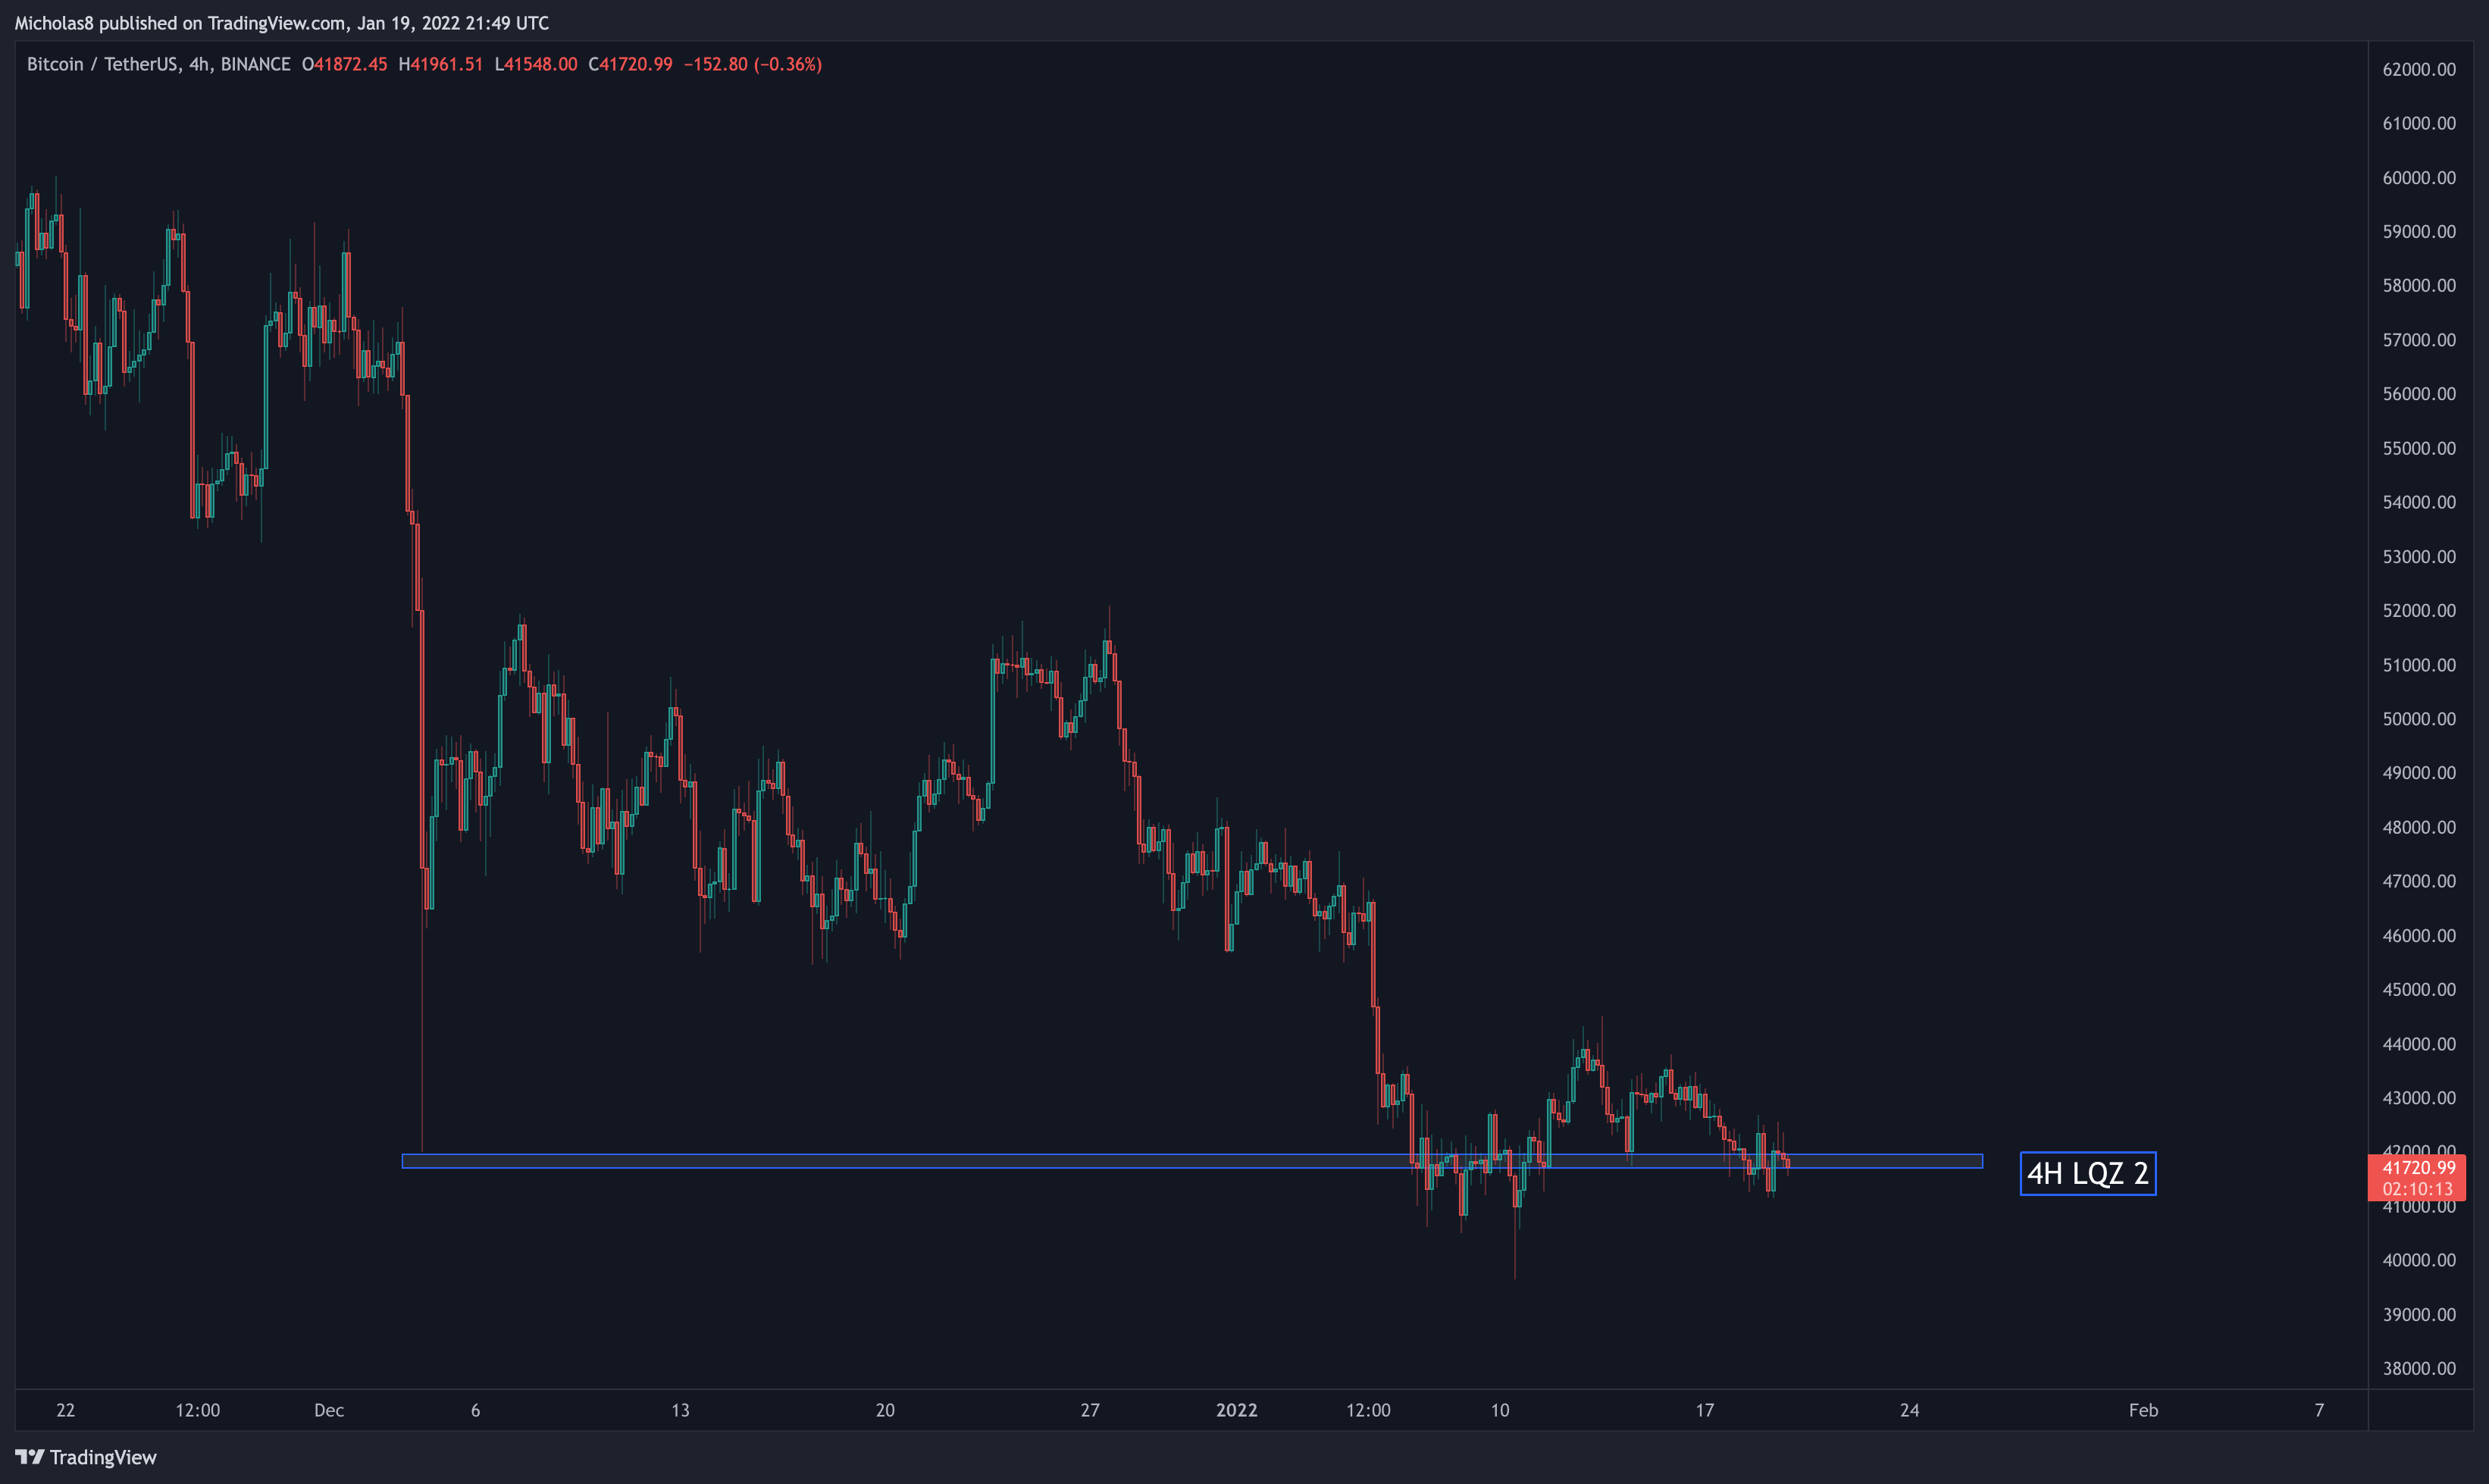
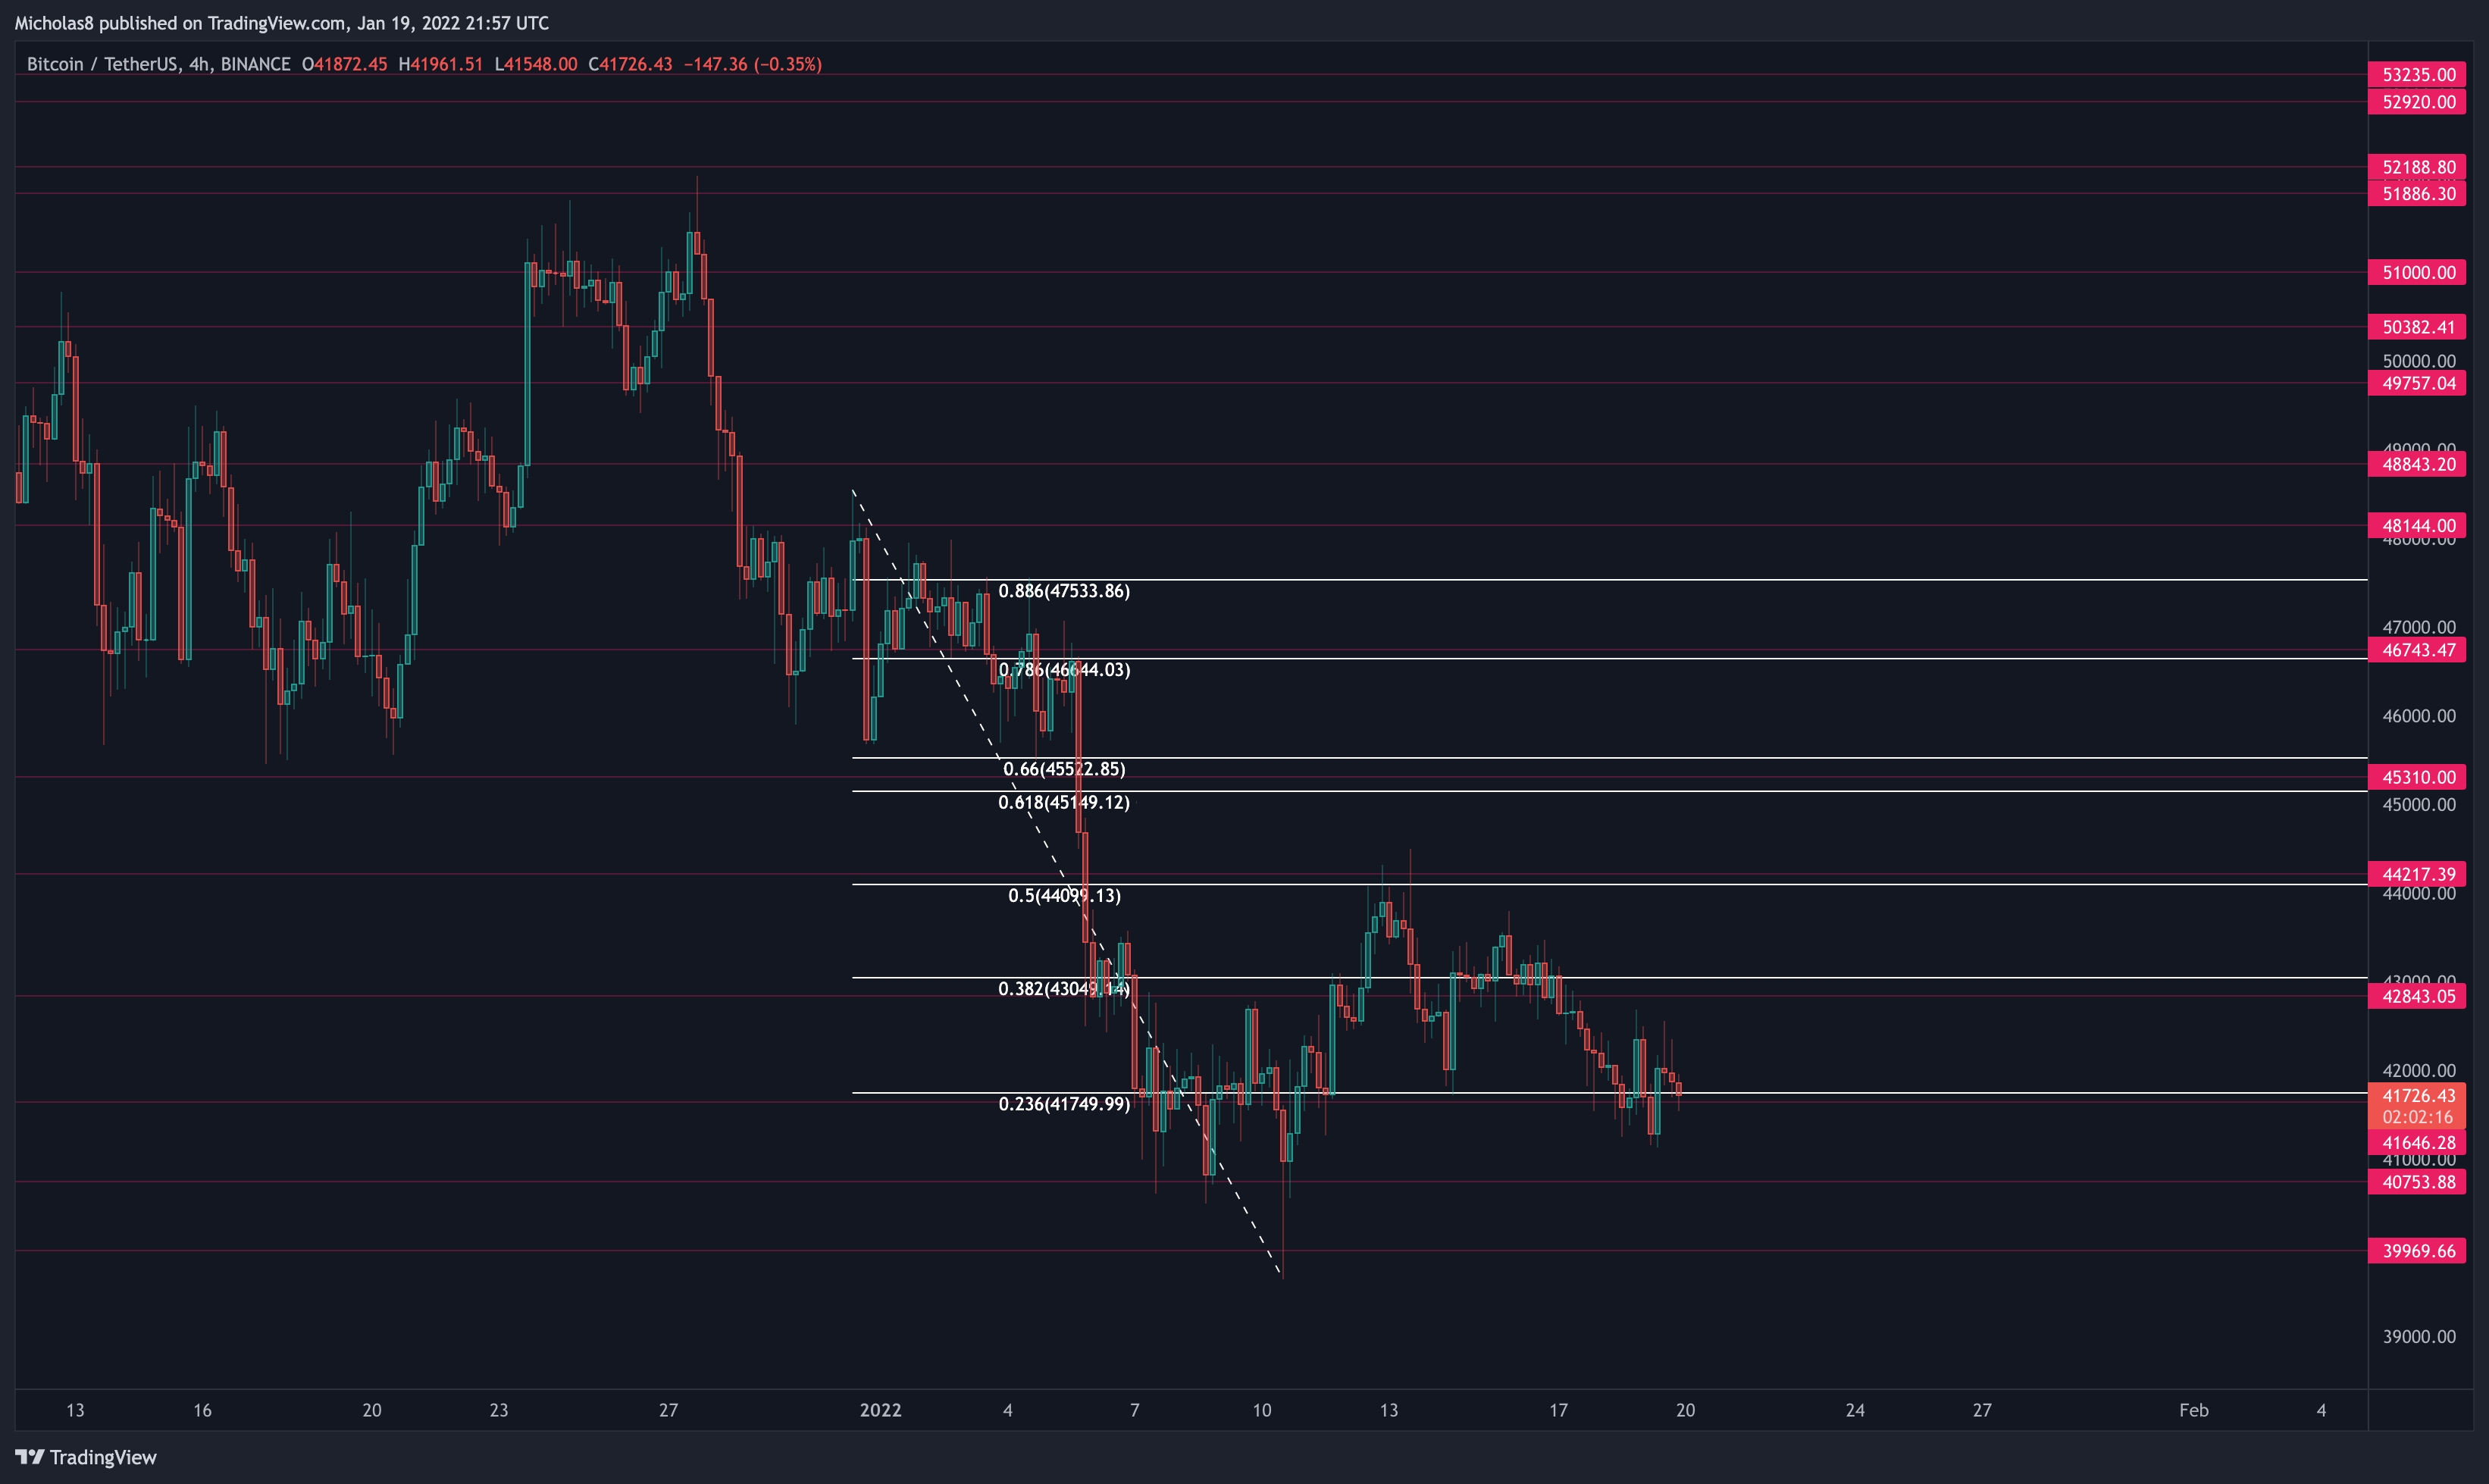
Zone 2: There is a LQZ at 41.7k-42k which Bitcoin has risen above.
Implications: Ideally, this serves as support moving forward.
Divergences
Bullish Divergence
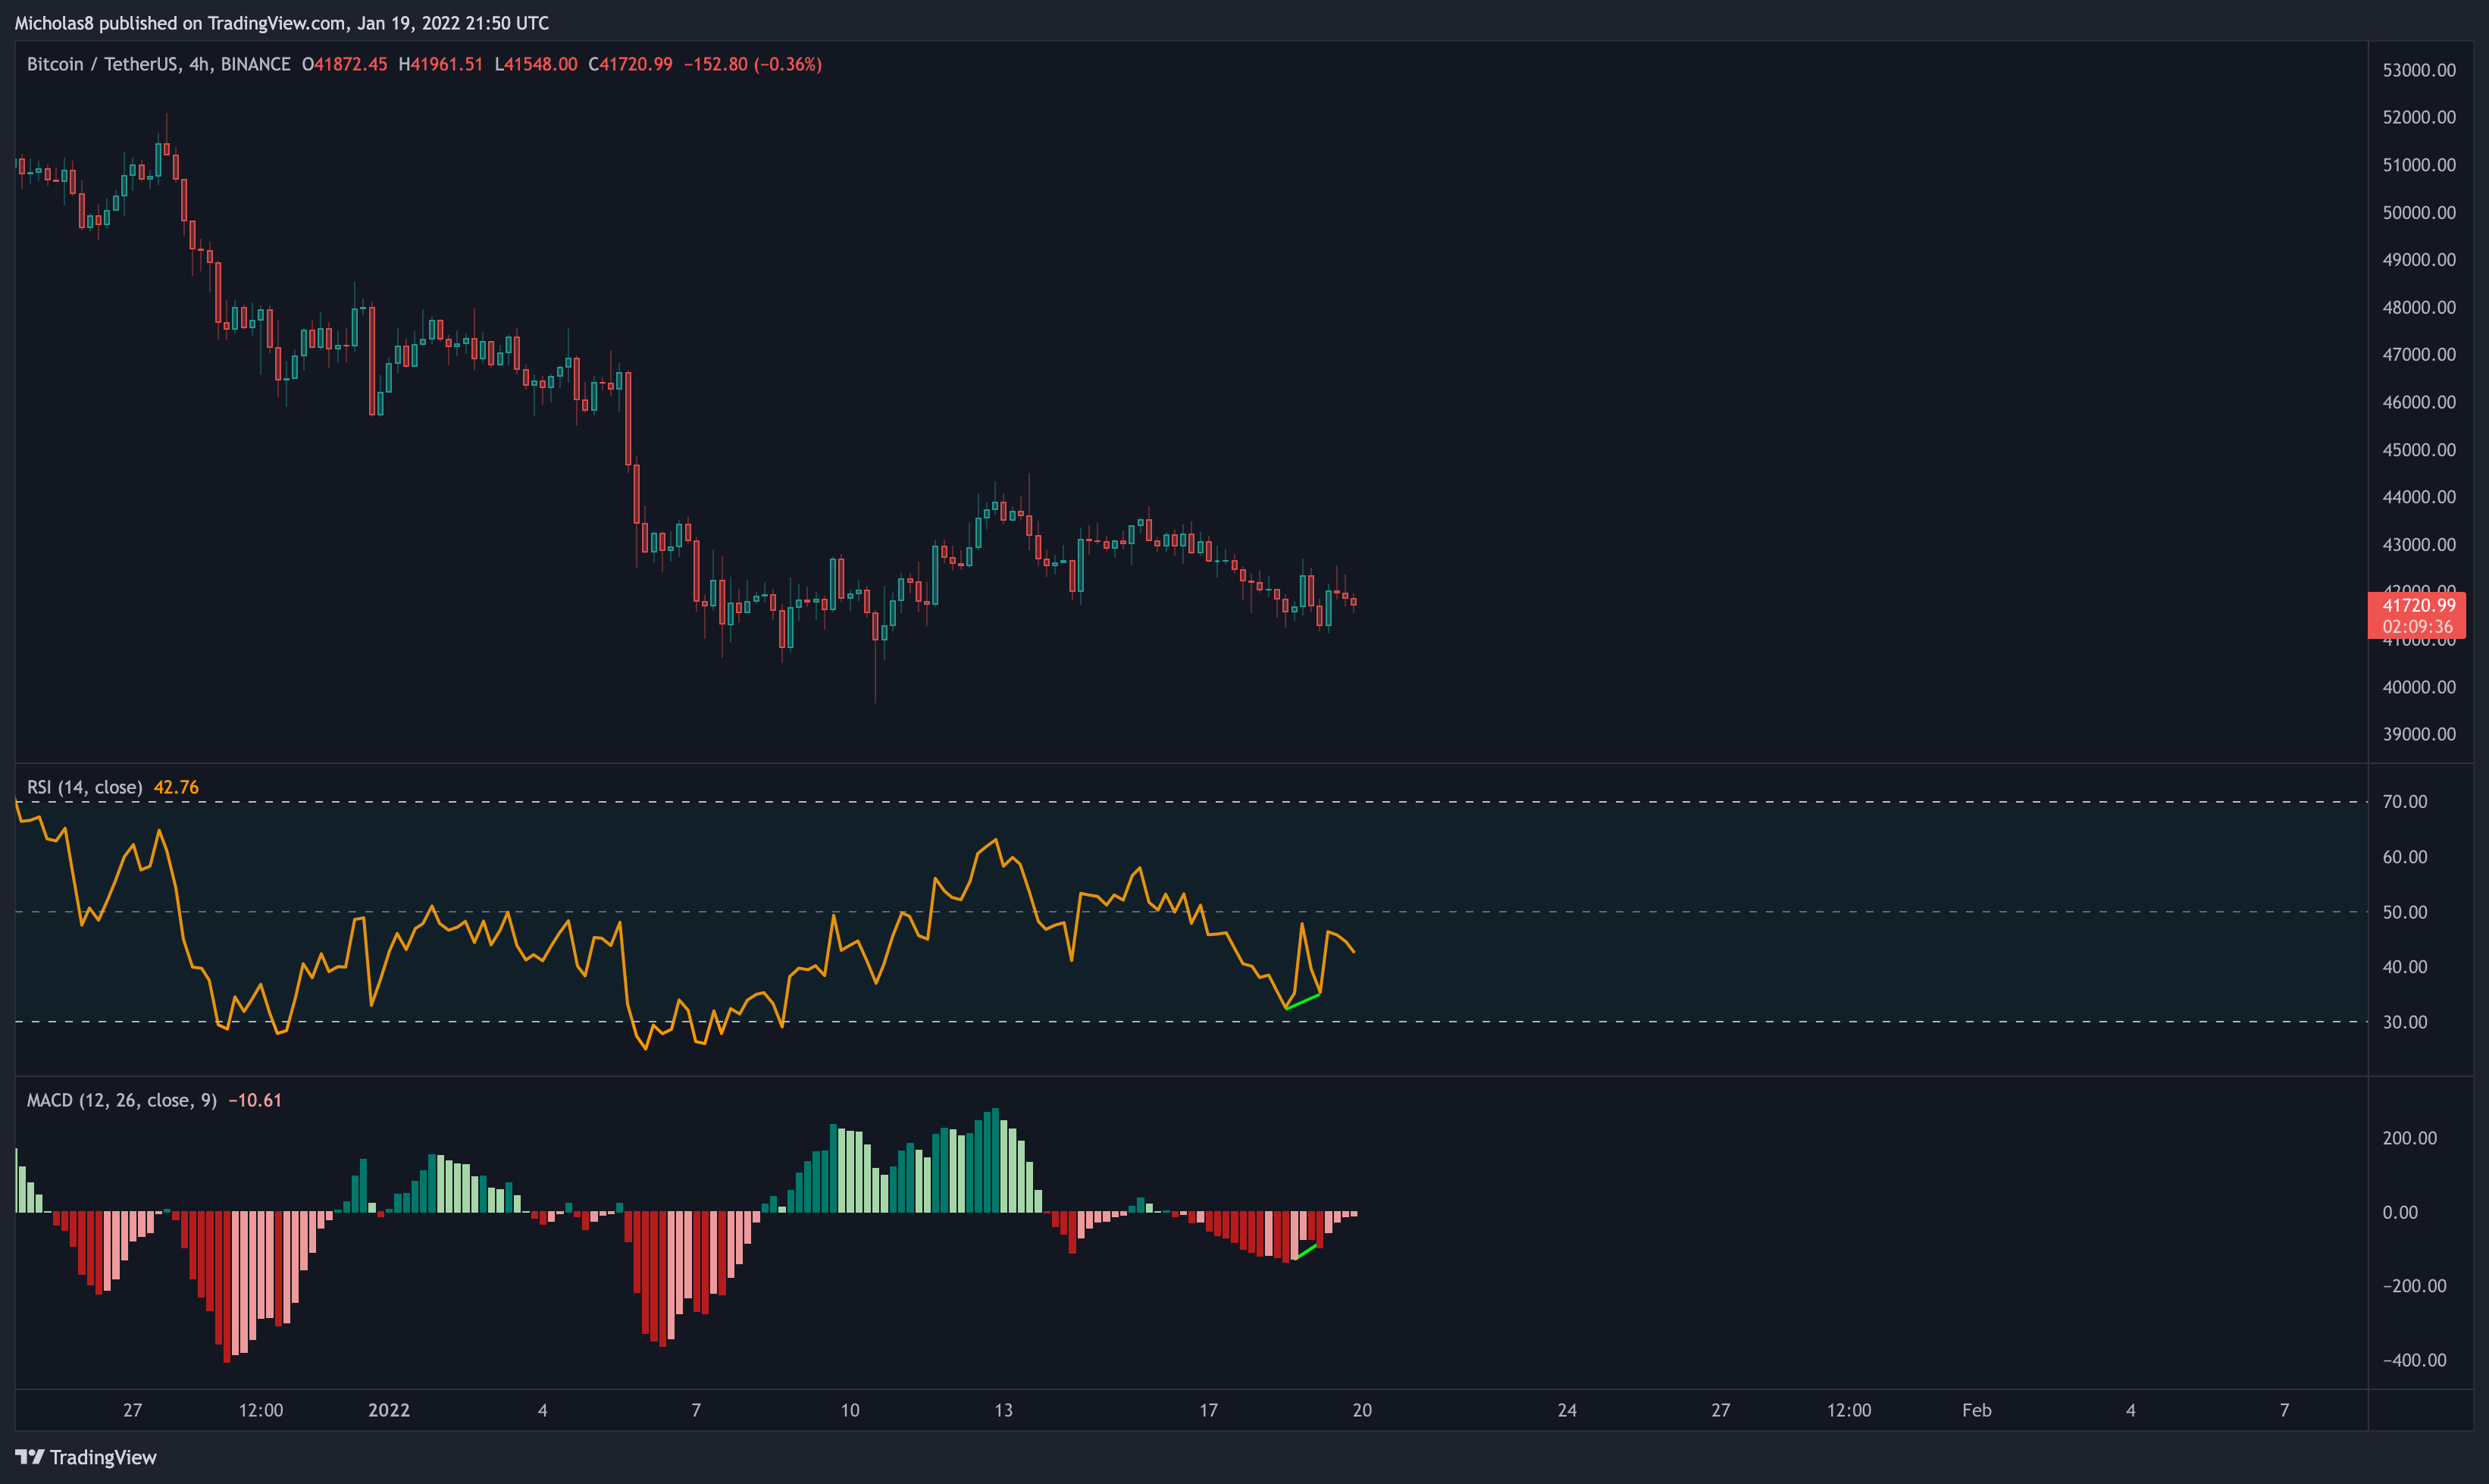
Bitcoin has a lower low in price, with a higher low in the RSI/MACD. This is a bullish divergence, which signals a possible trend reversal up.
Invalidation: Lower low in price and in the RSI/MACD.
1H Timeframe
Divergences
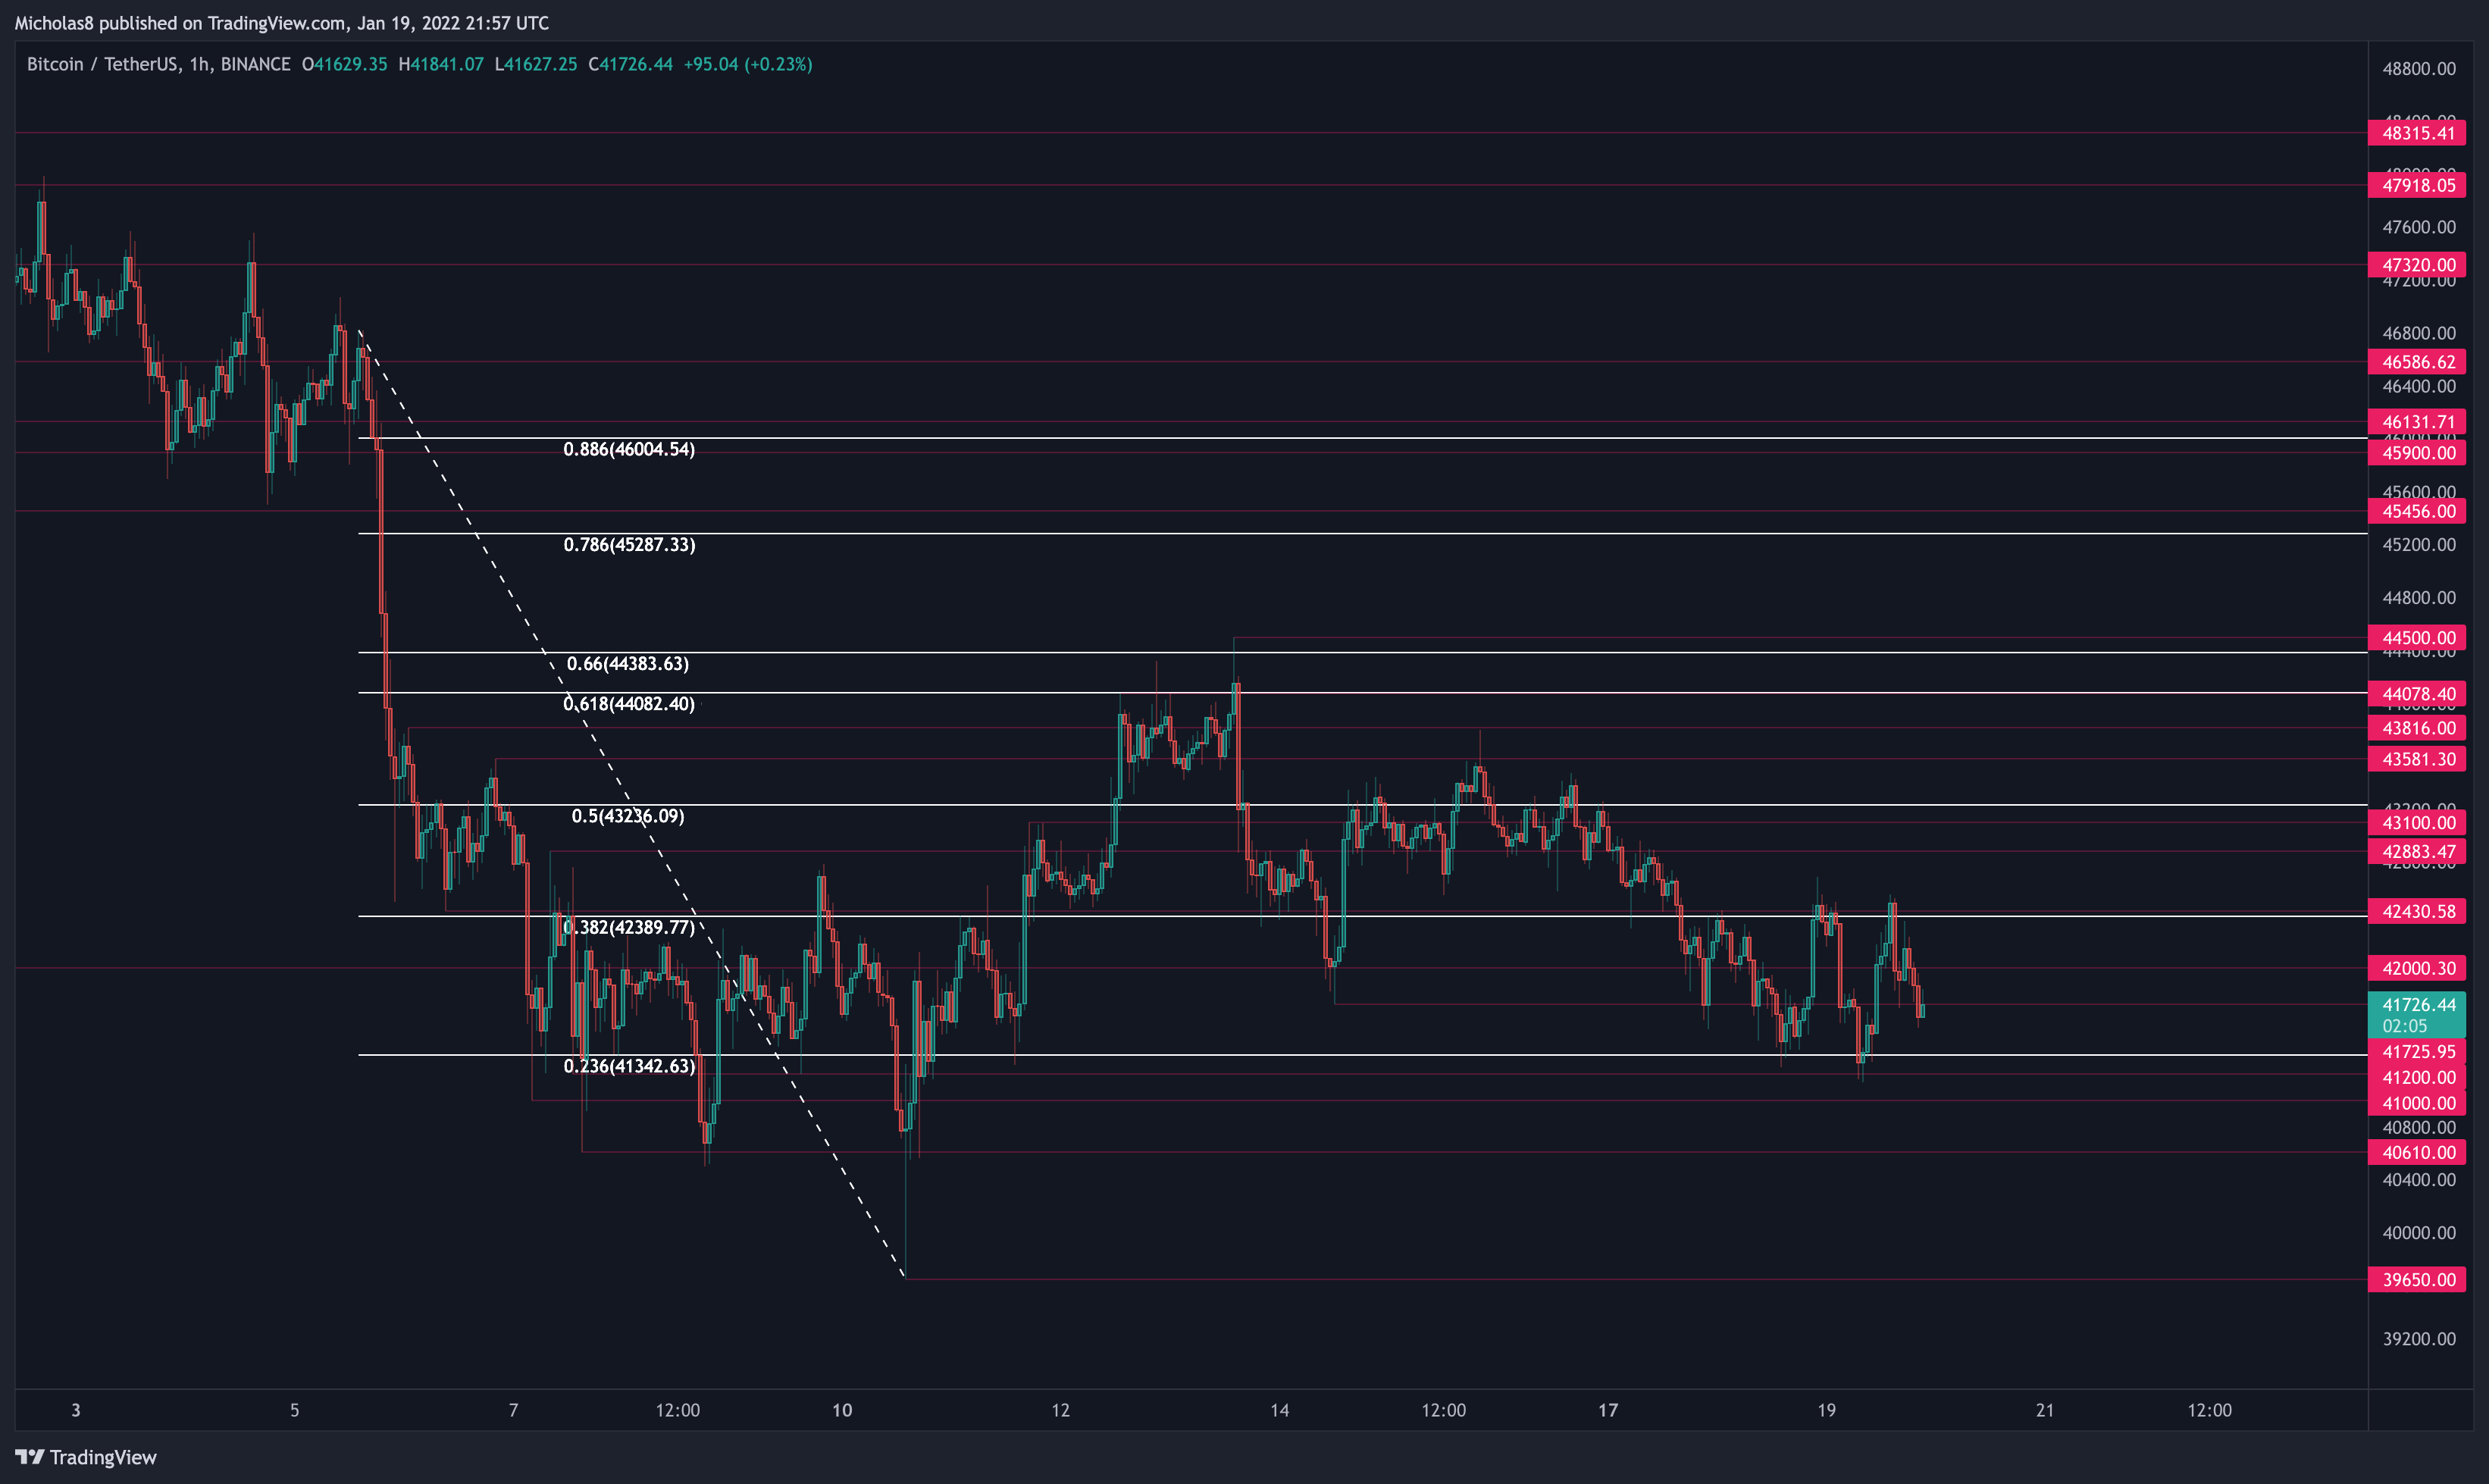
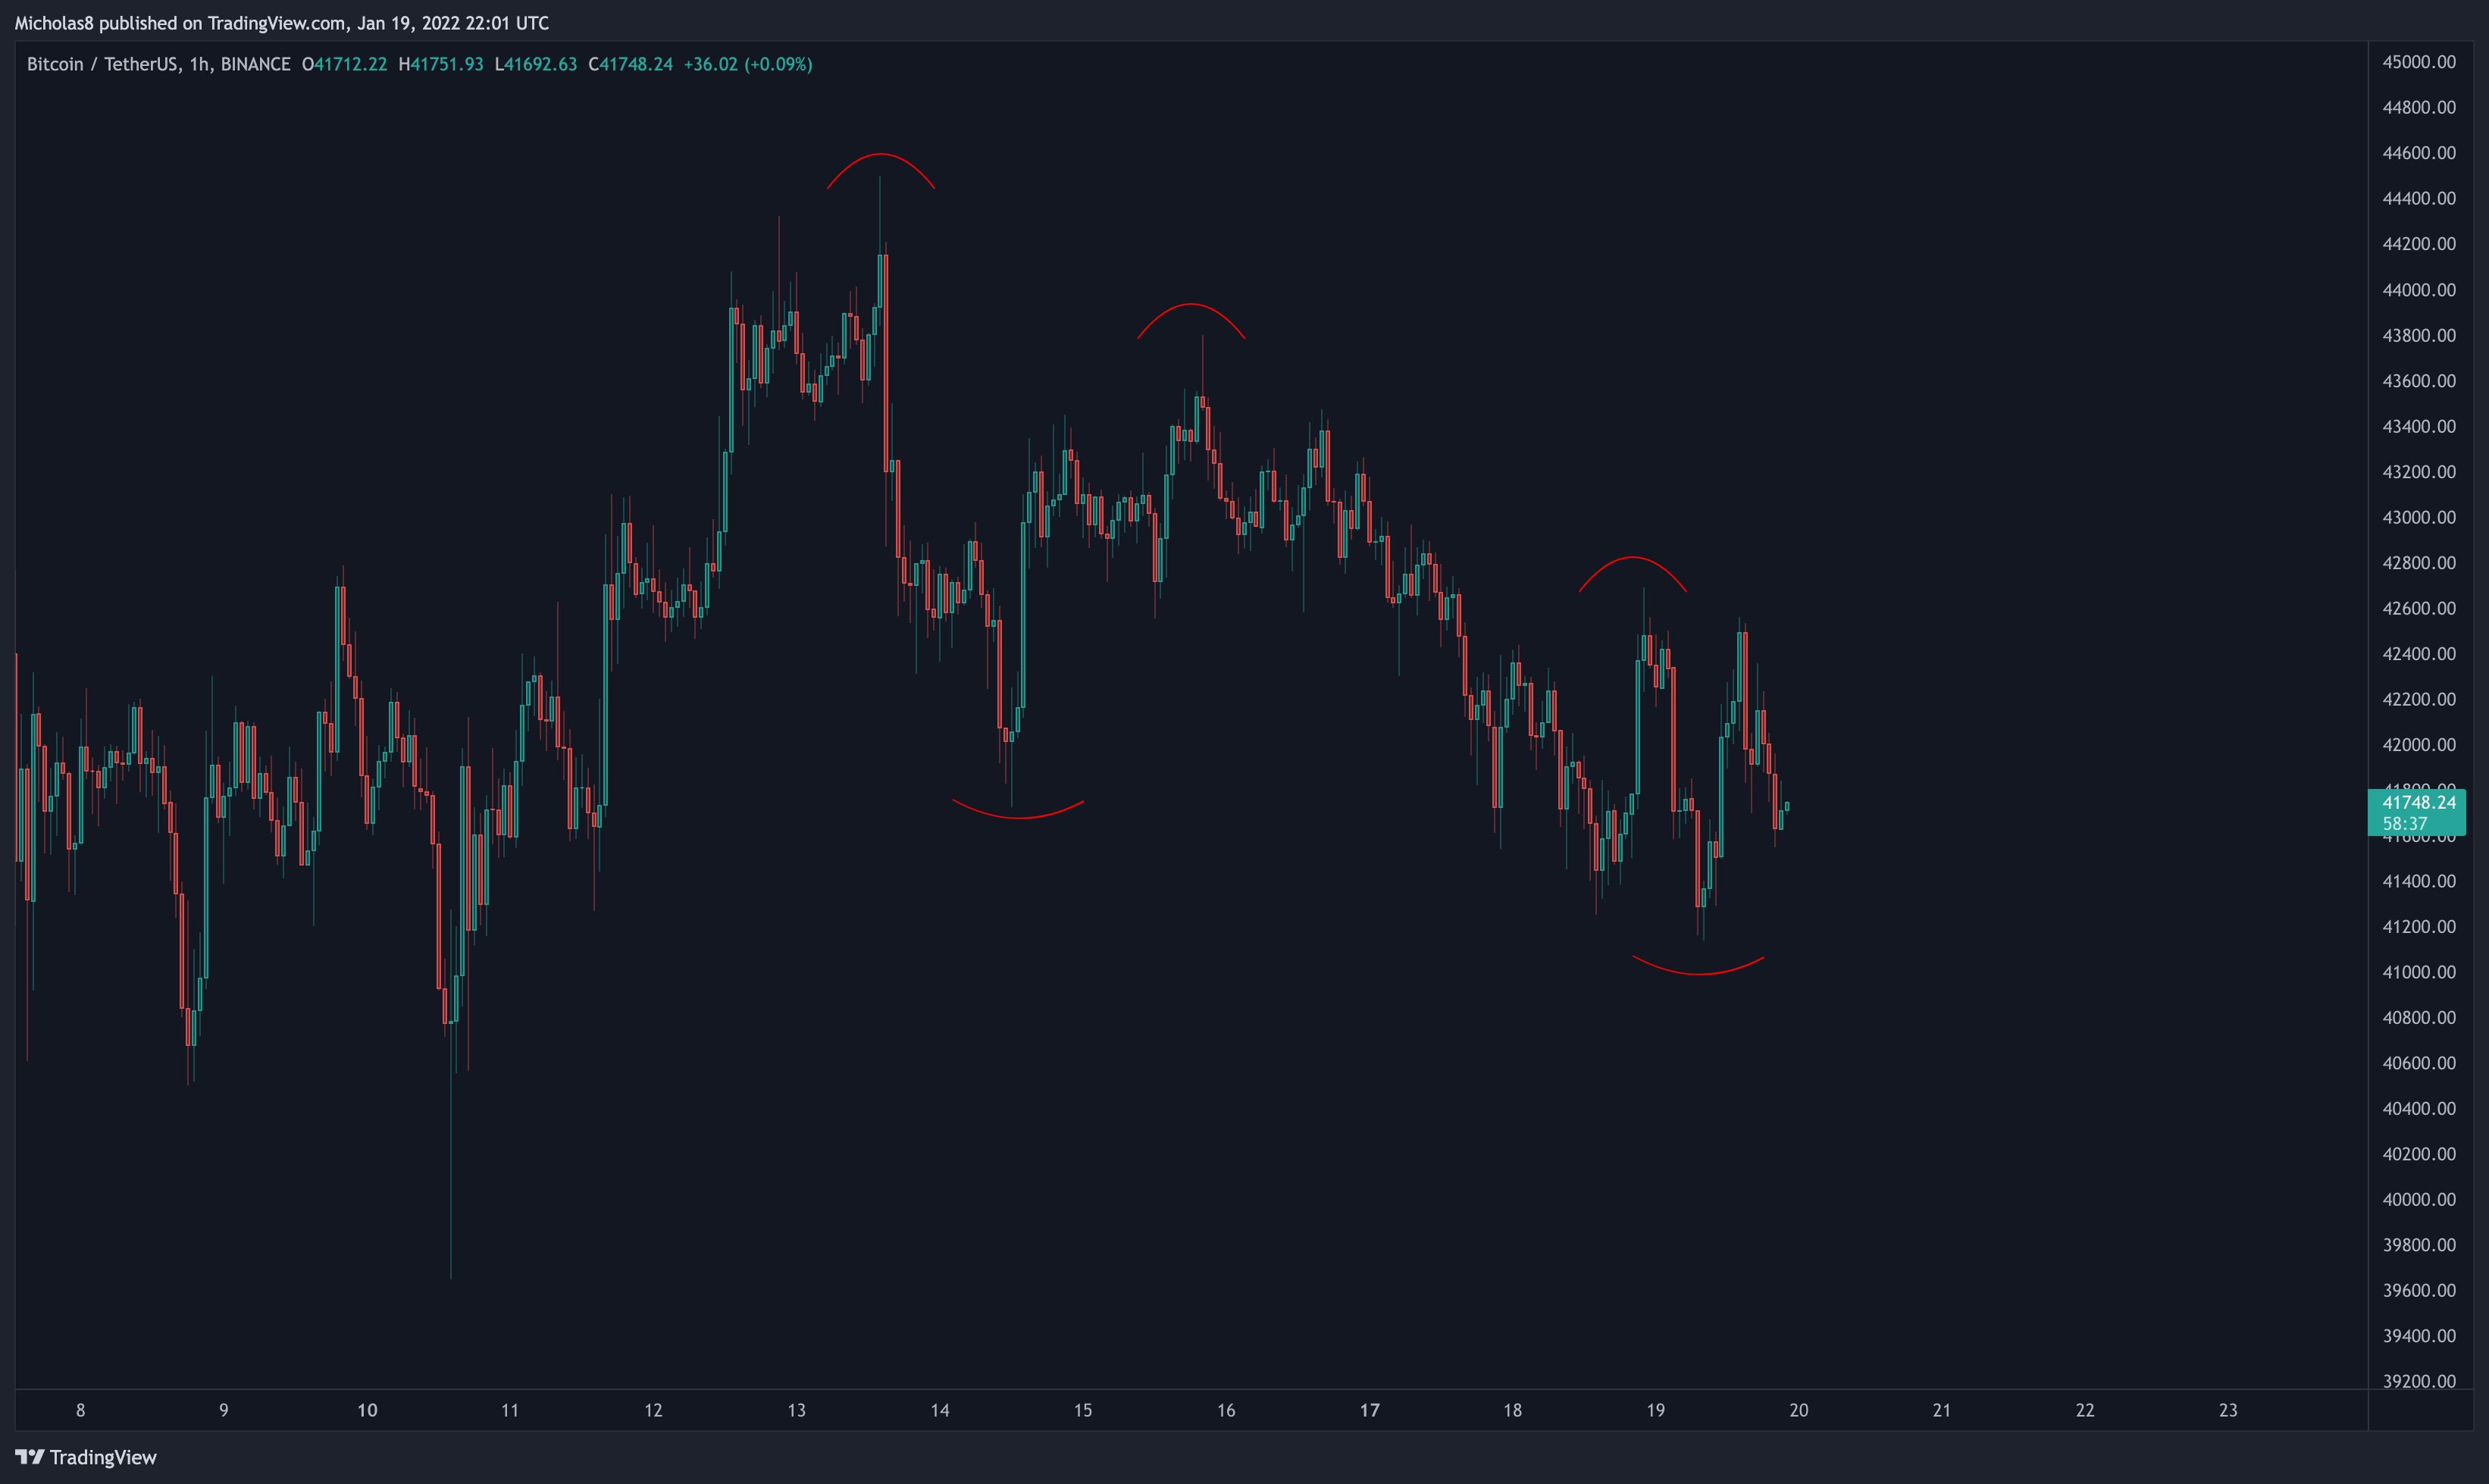
Bullish Divergence
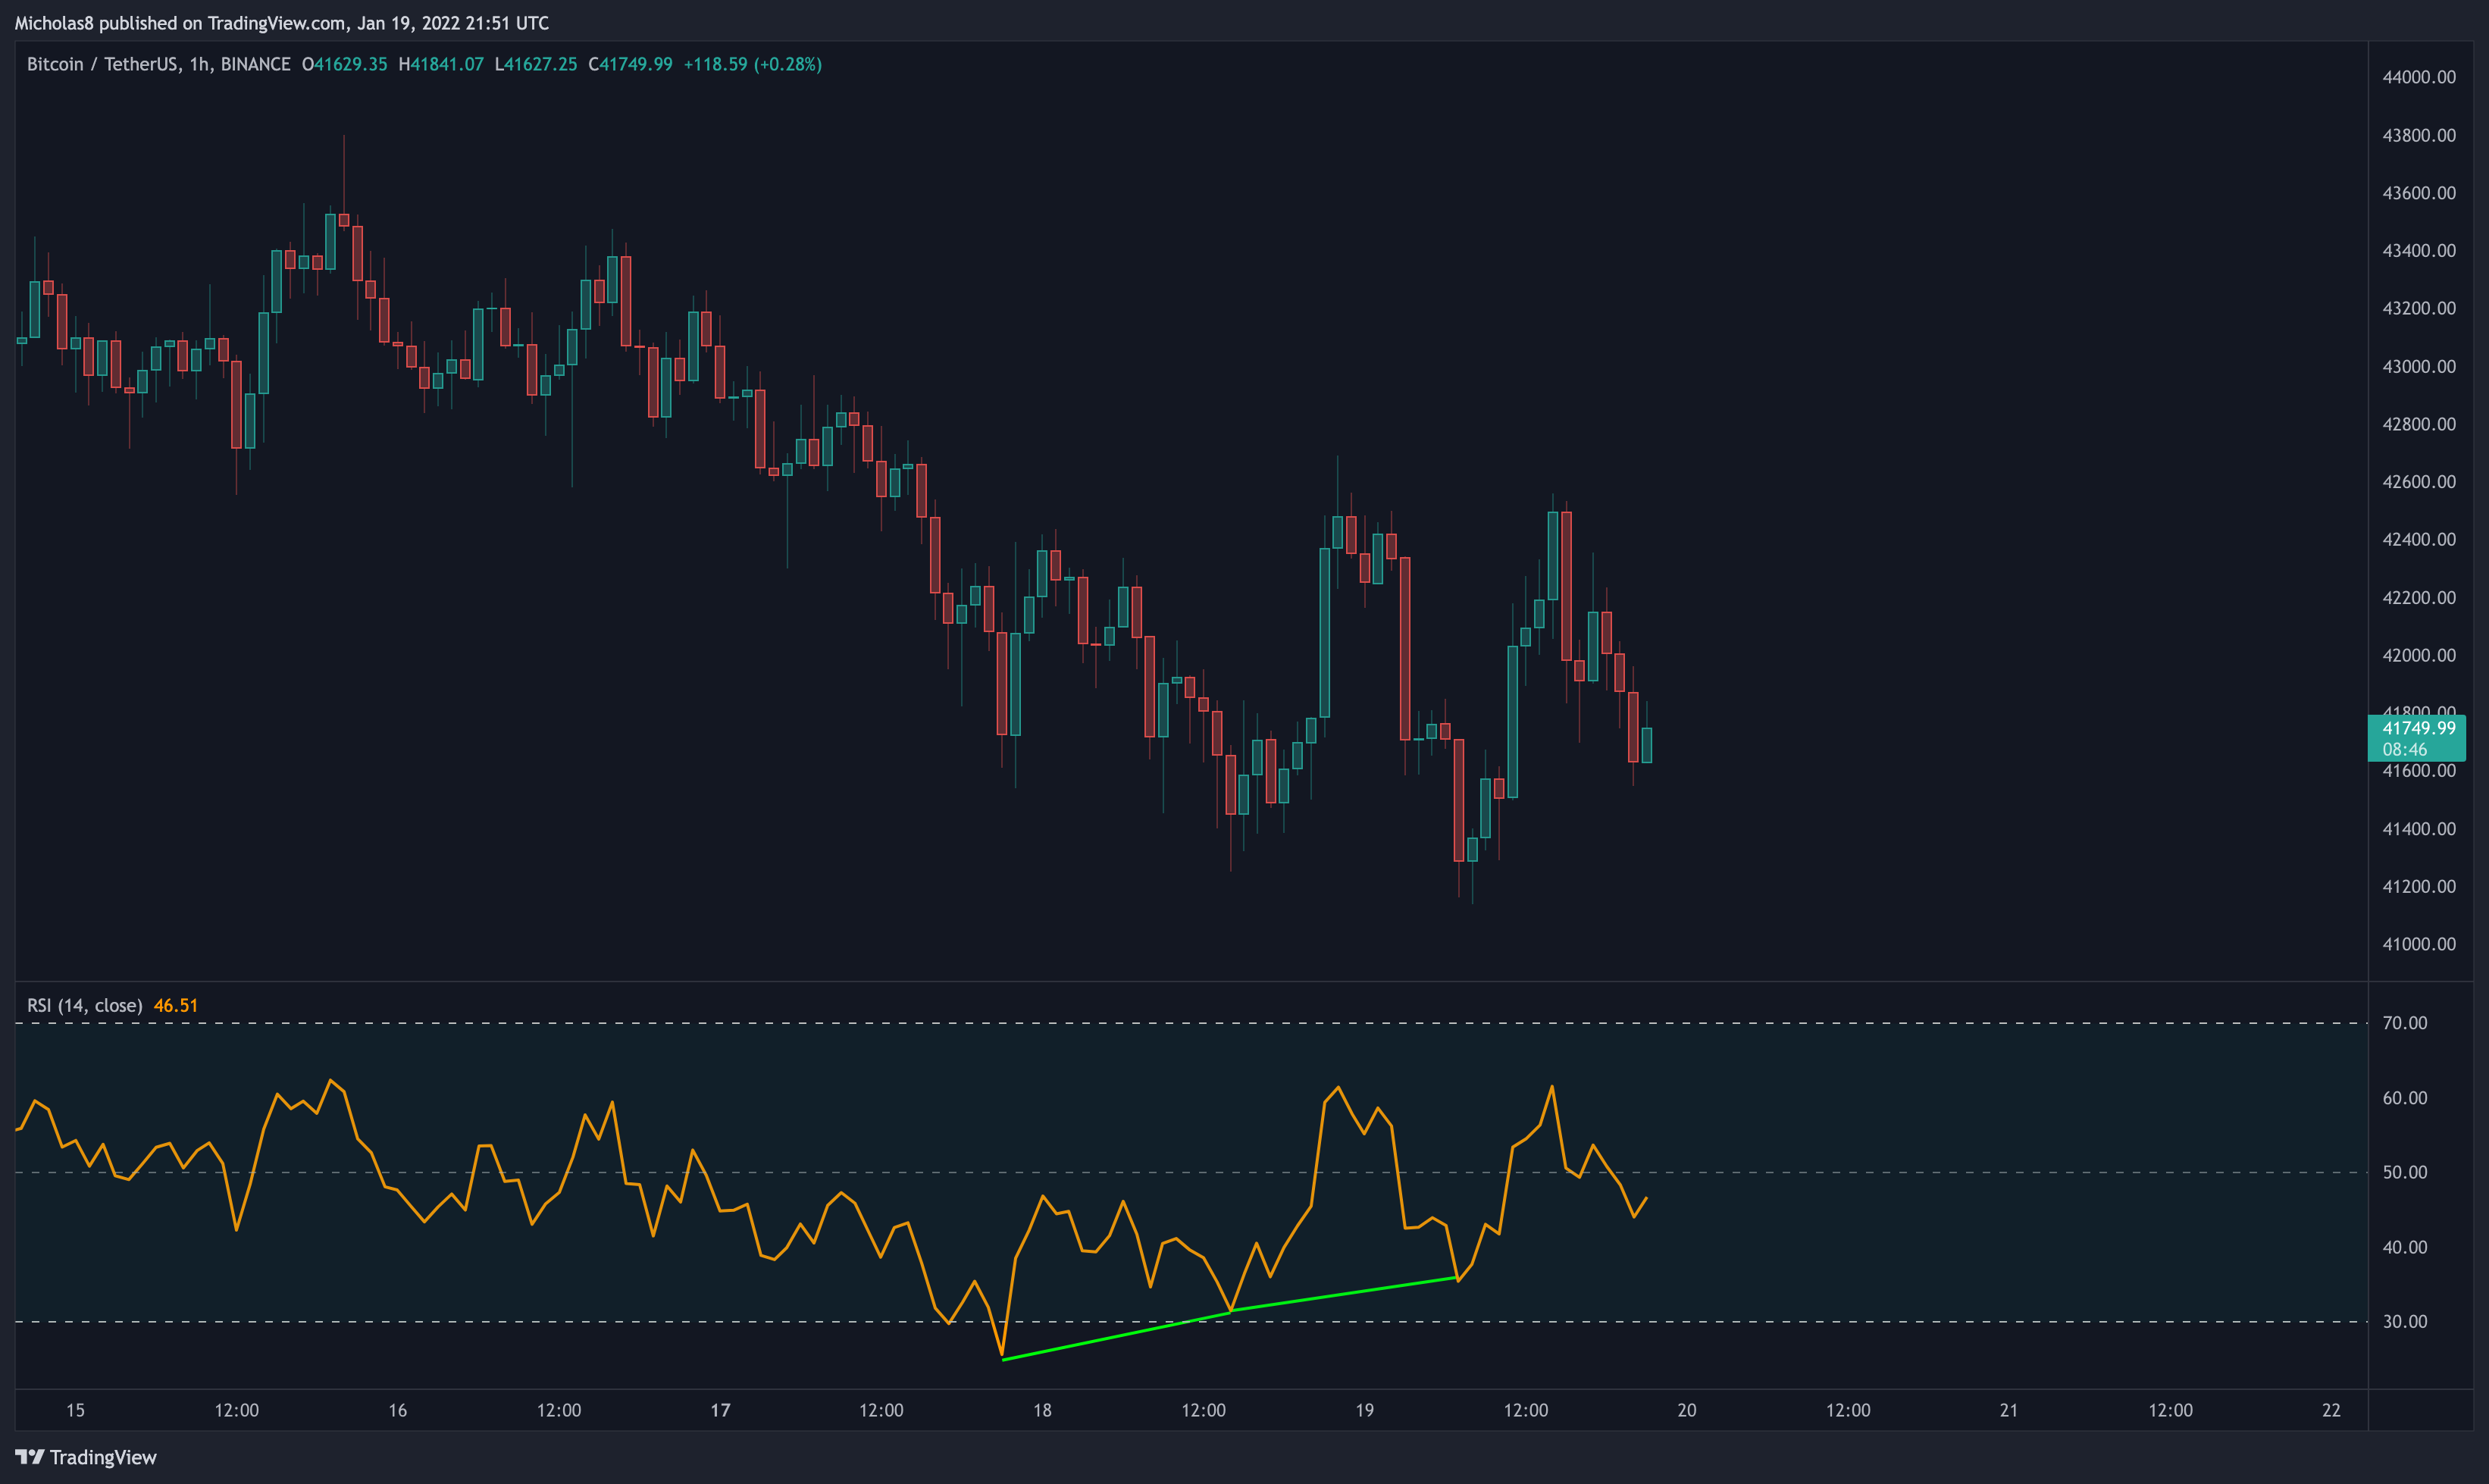
Bitcoin has a lower low in price, with a higher low on the RSI. This is a bullish divergence, which signals a possible trend reversal up.
Invalidation: Lower low in price and in the RSI.
THE BAD
Daily Timeframe
Bearish Market Structure
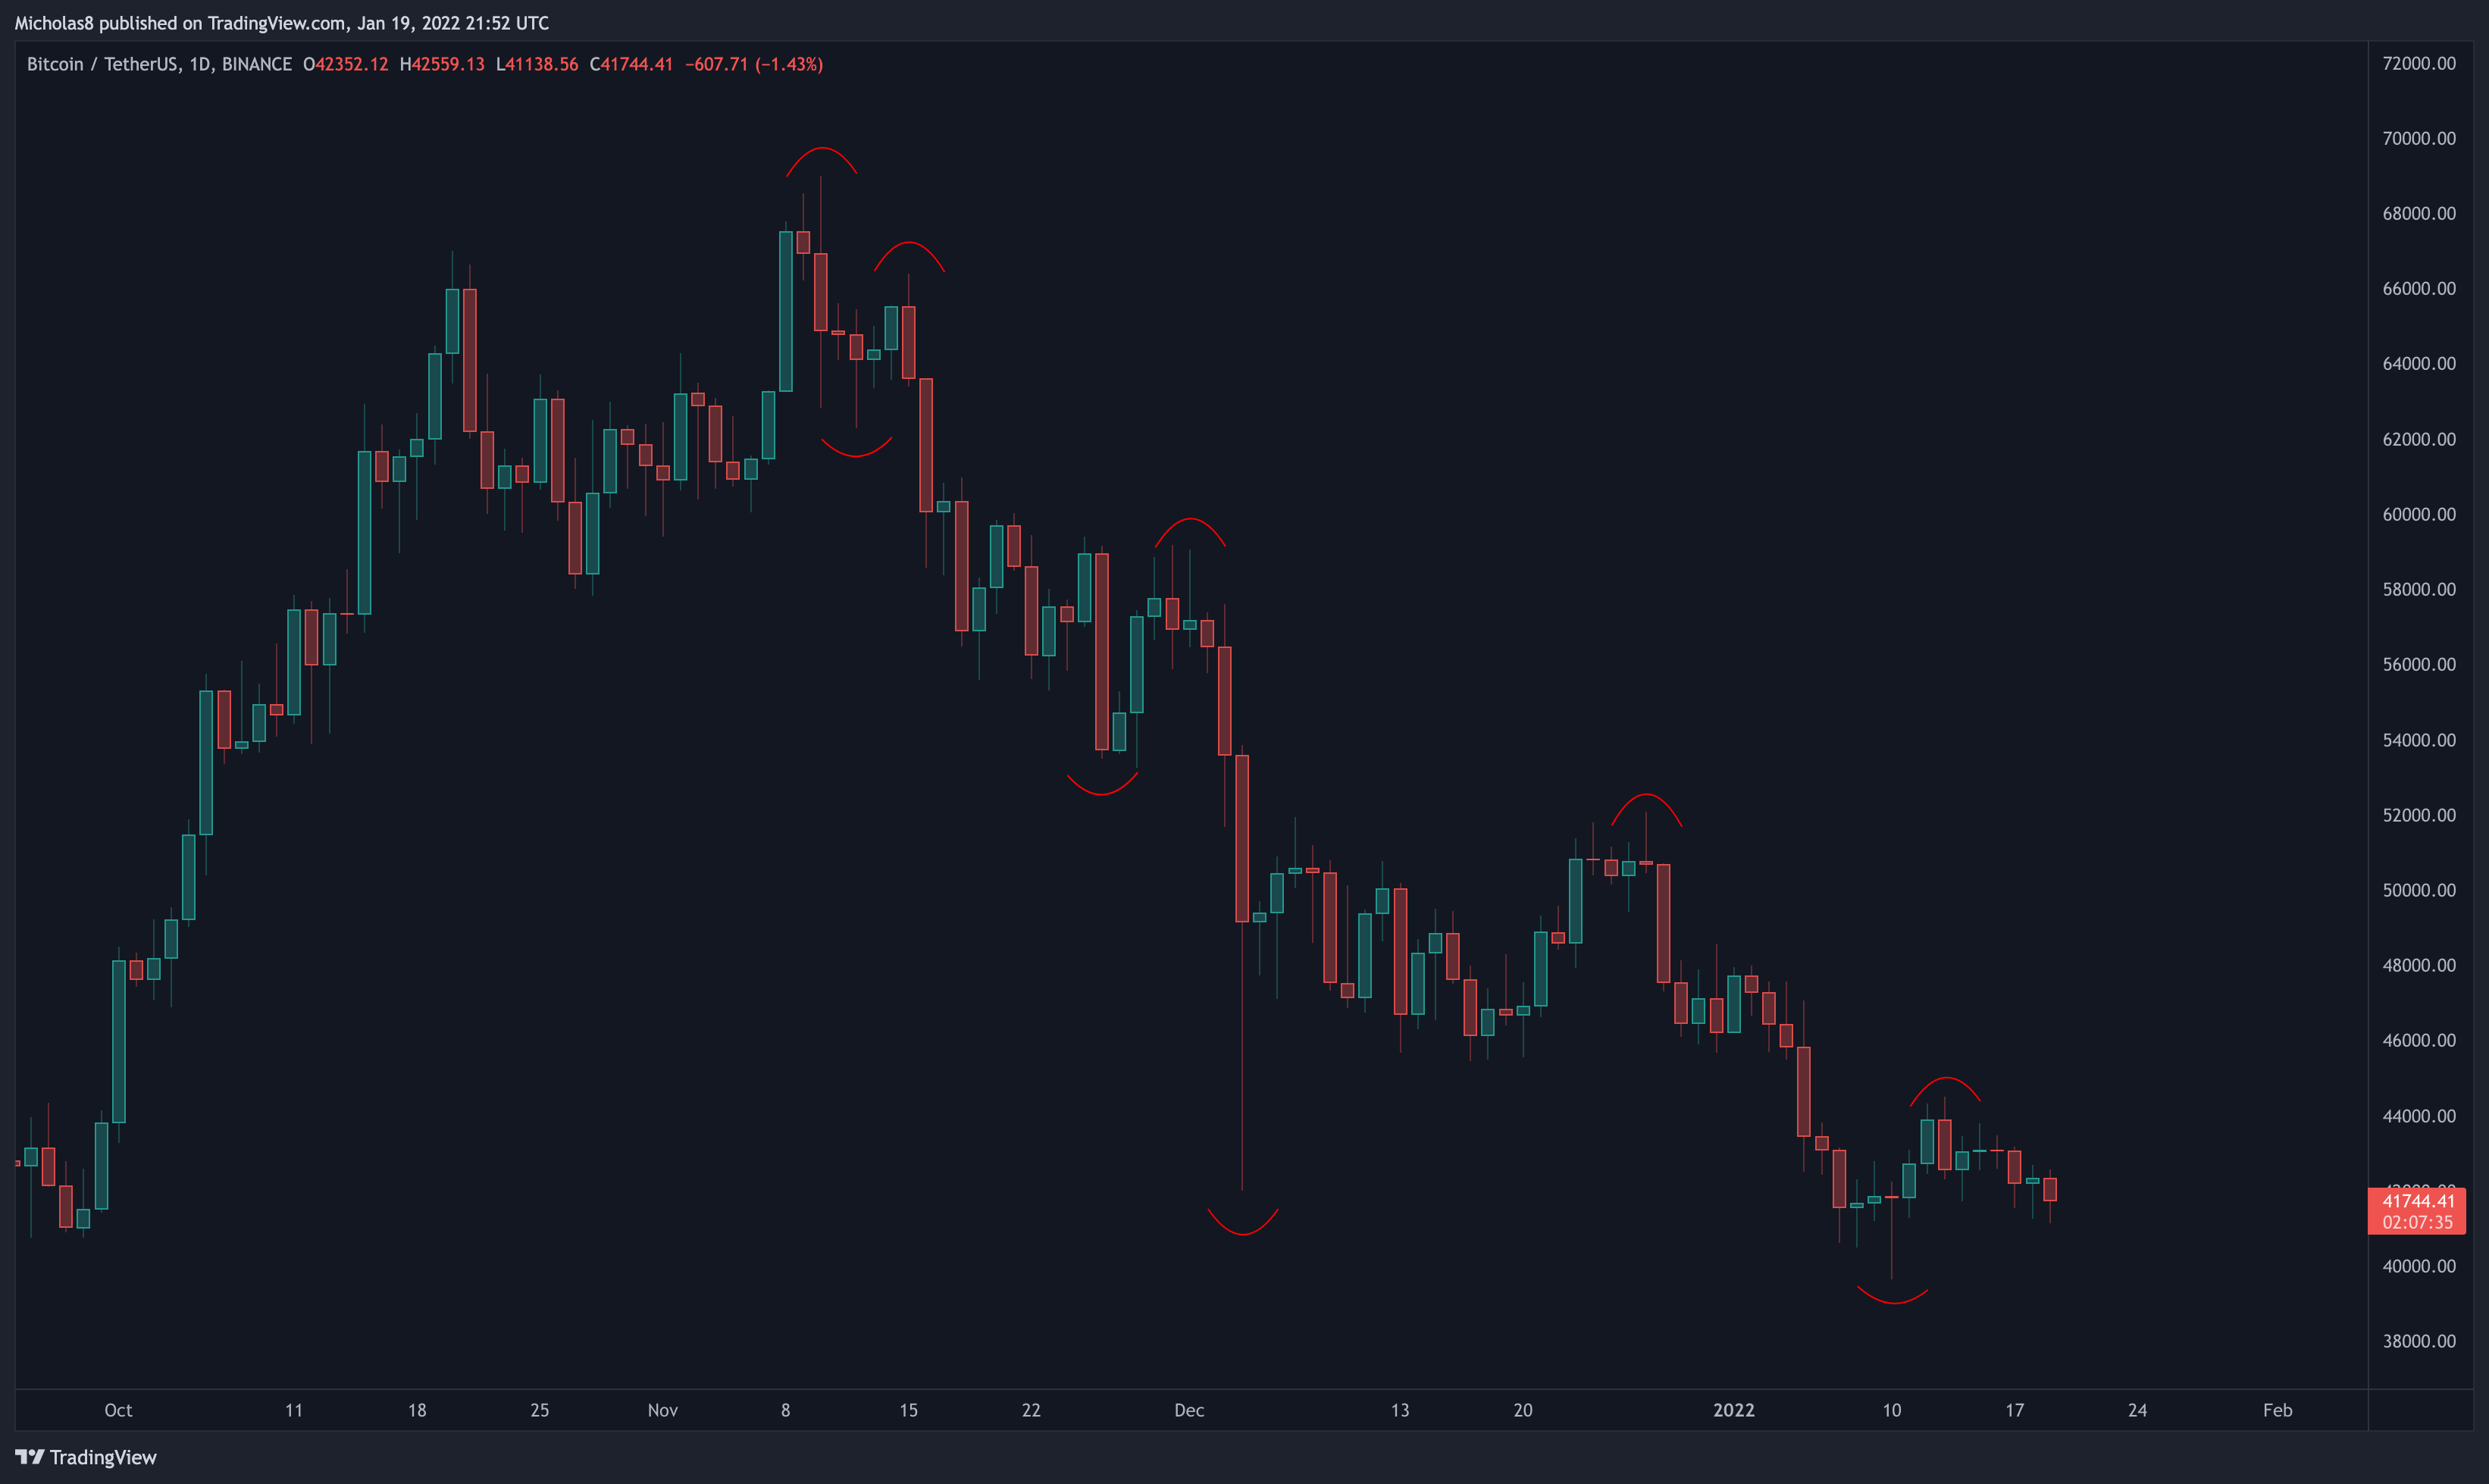
Bitcoin has lost the micro higher high and higher low structure it was attempting to form. We also saw that potential new higher low be taken out, and we've created a new lower low. Until Bitcoin can create a meaningful higher low and higher high, it's reasonable to expect continued downside.
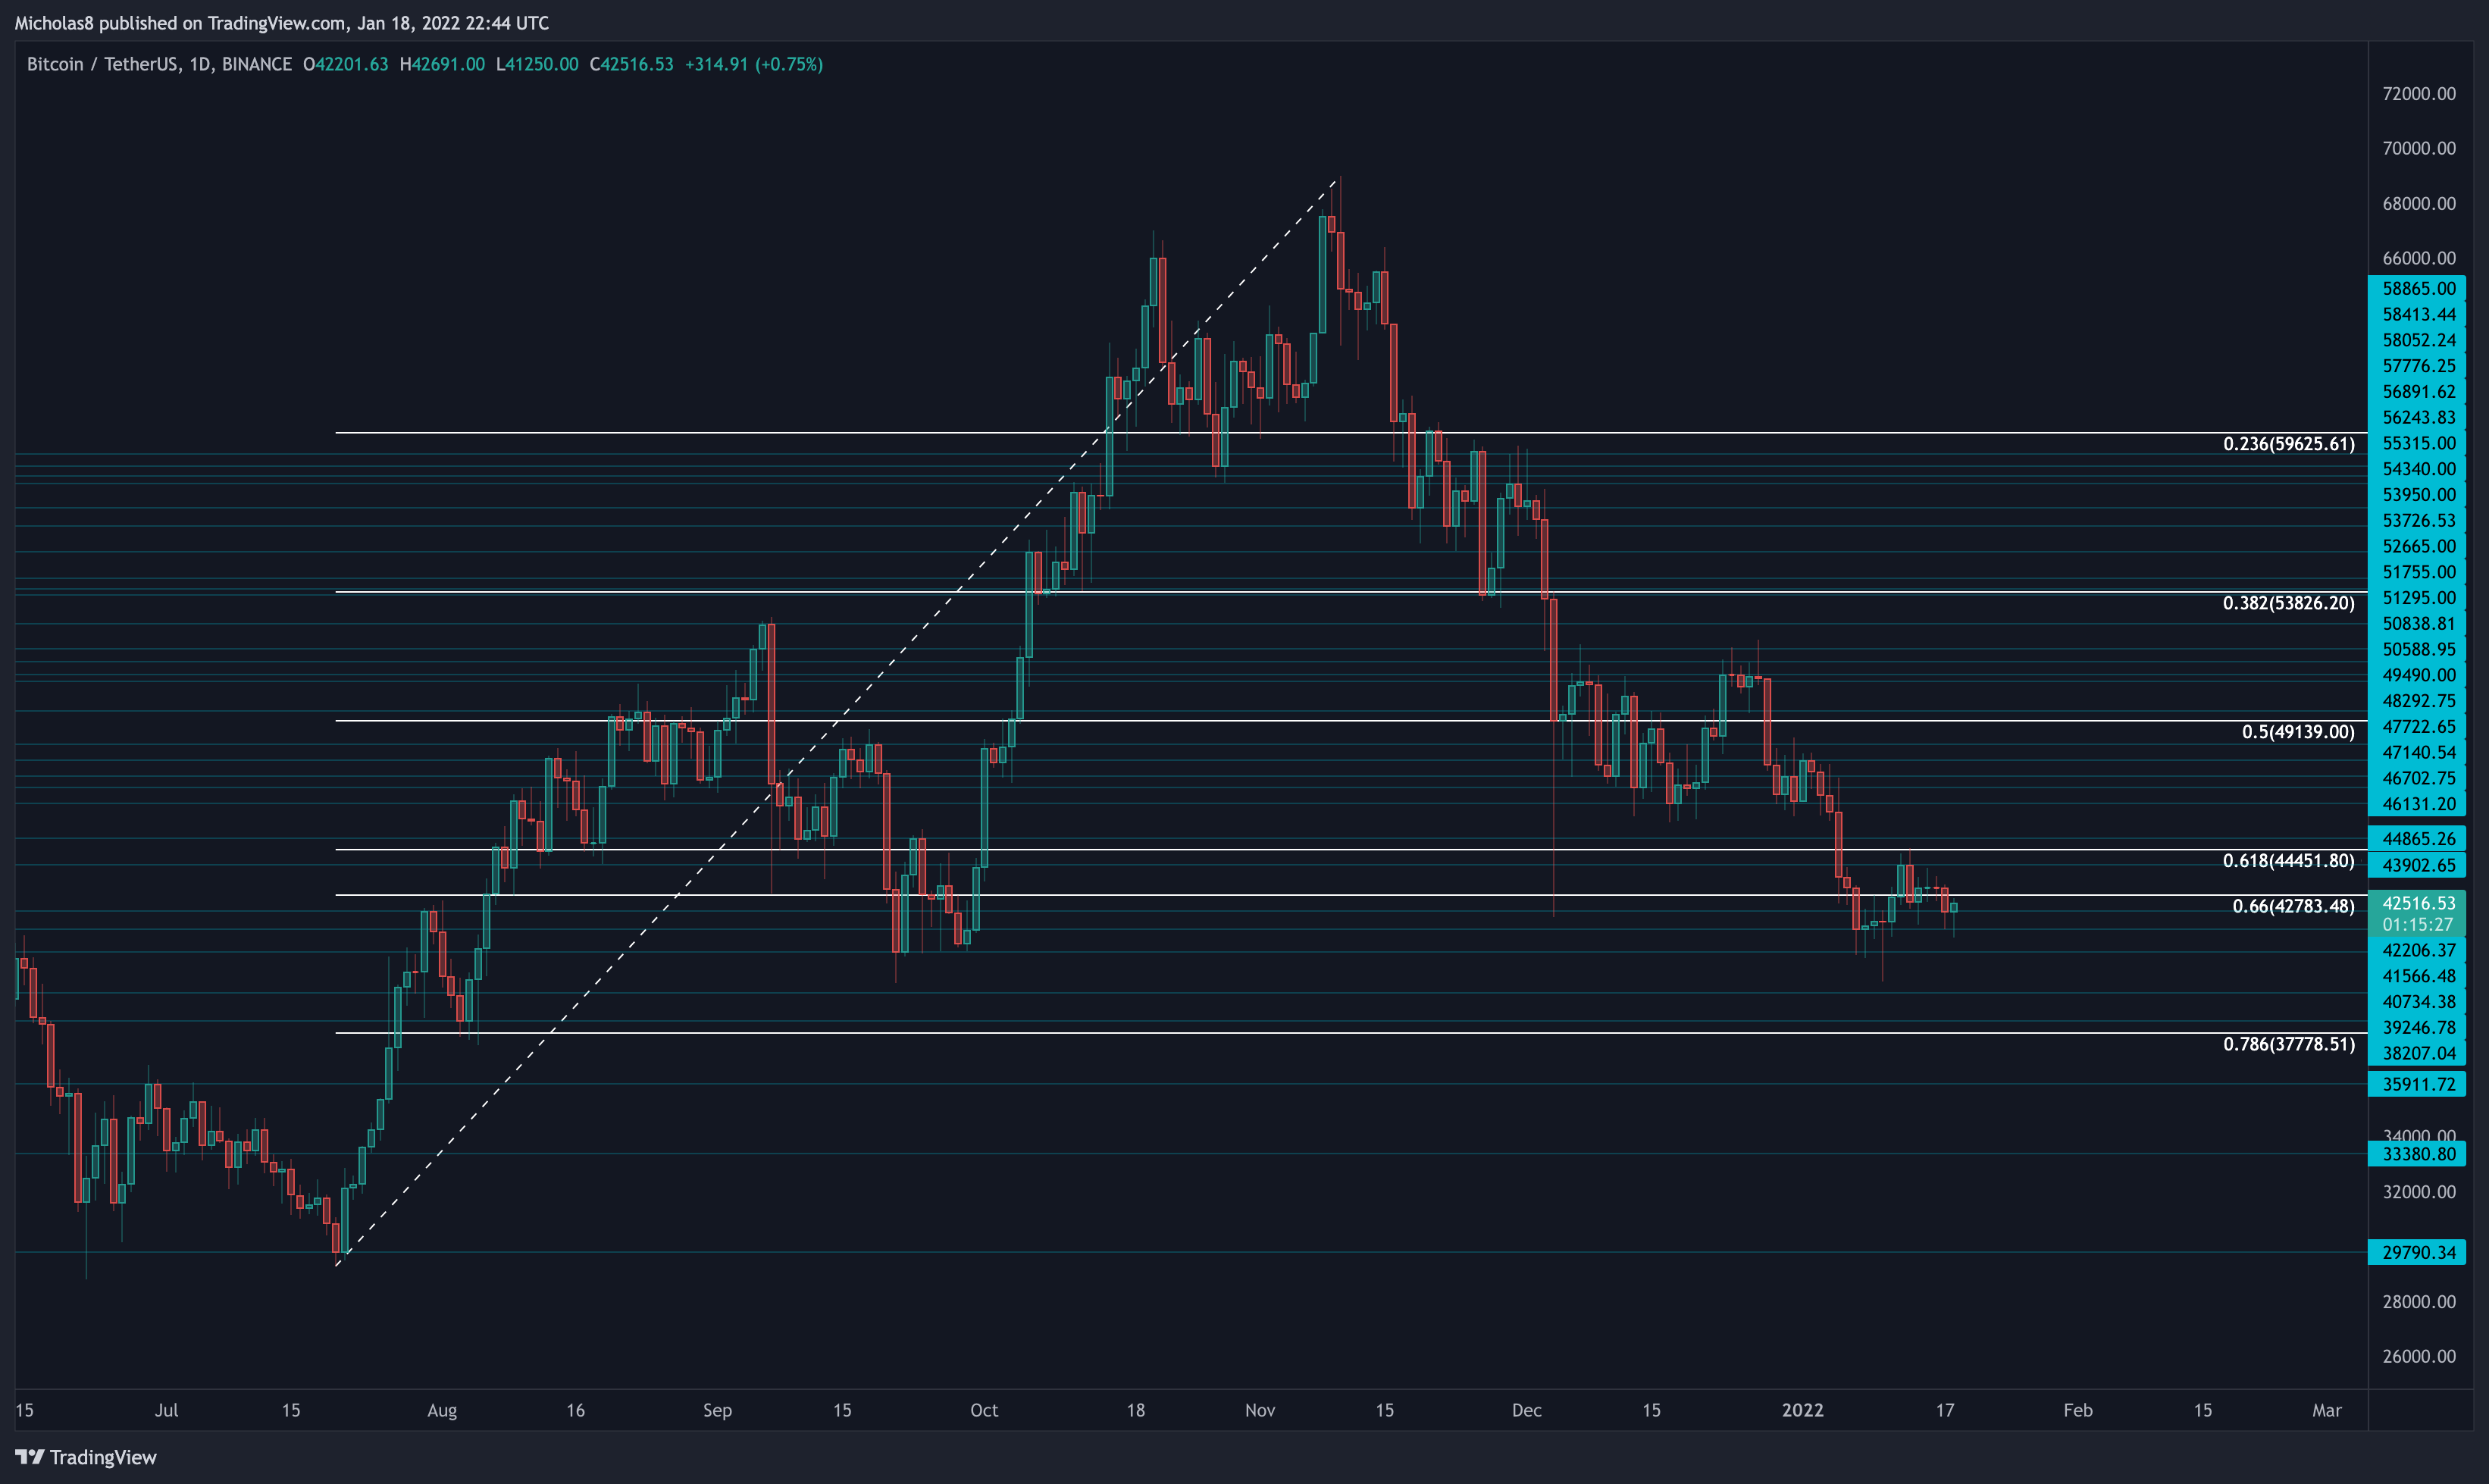
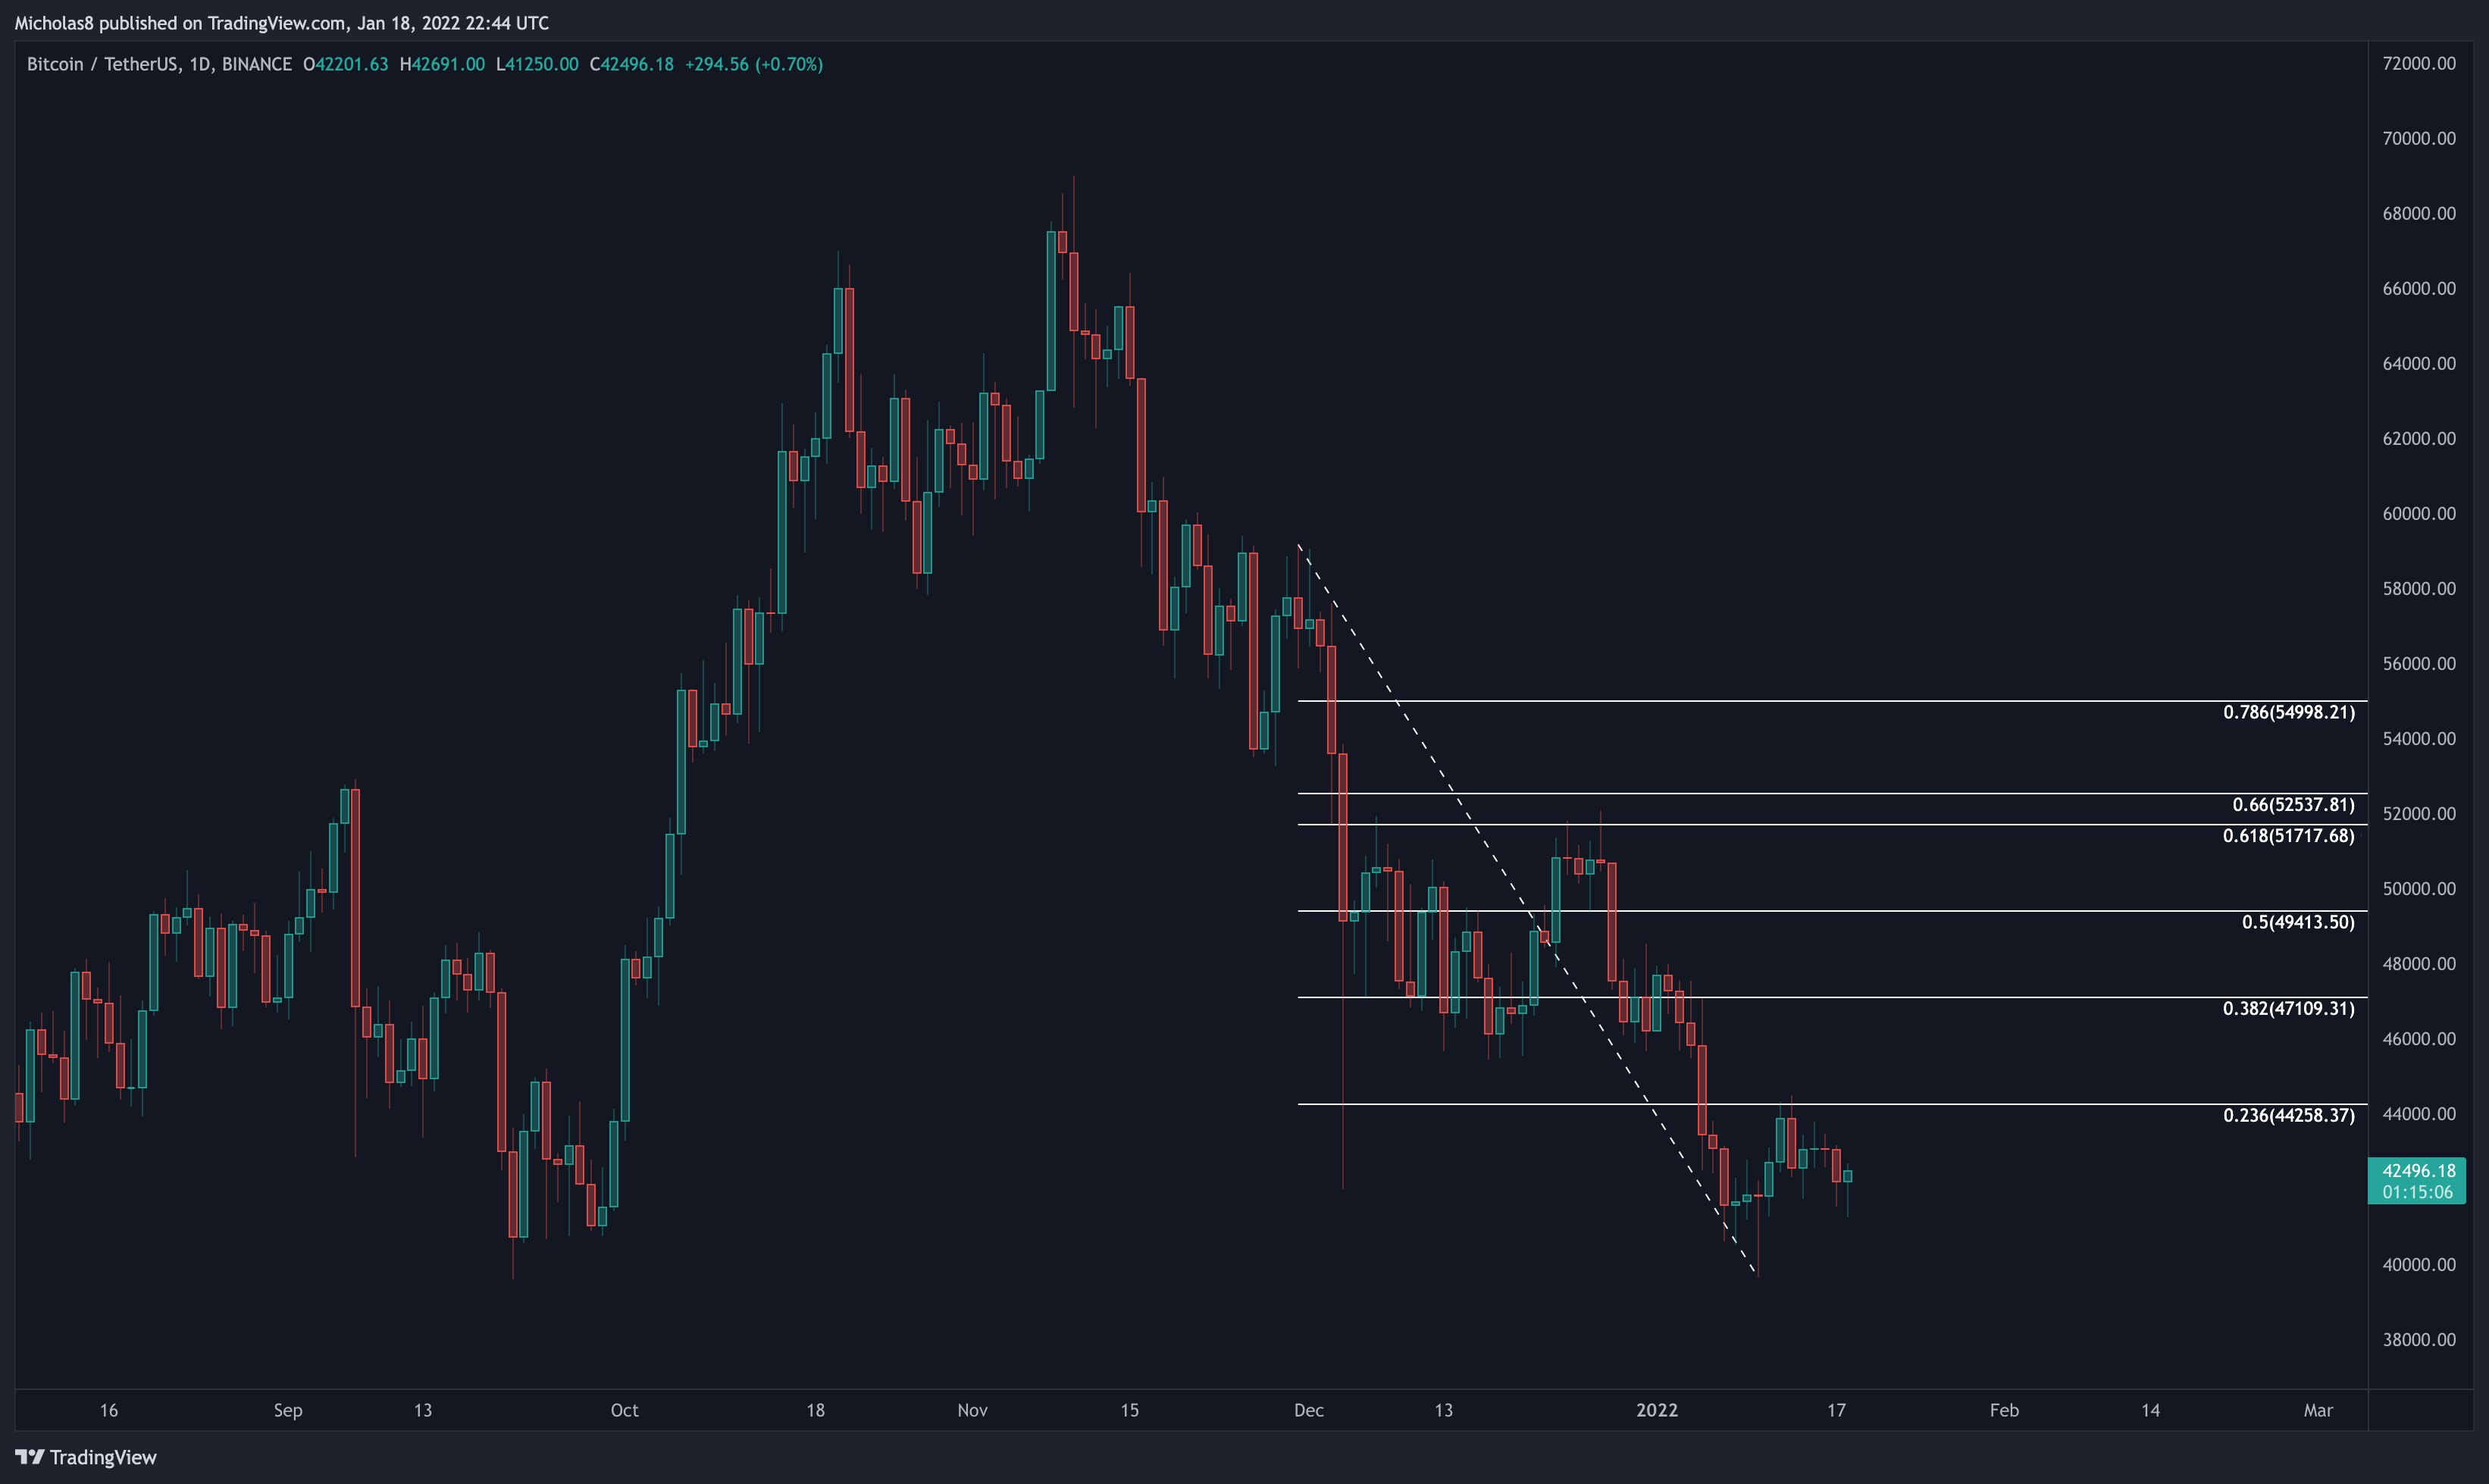
Logarithmic Curve
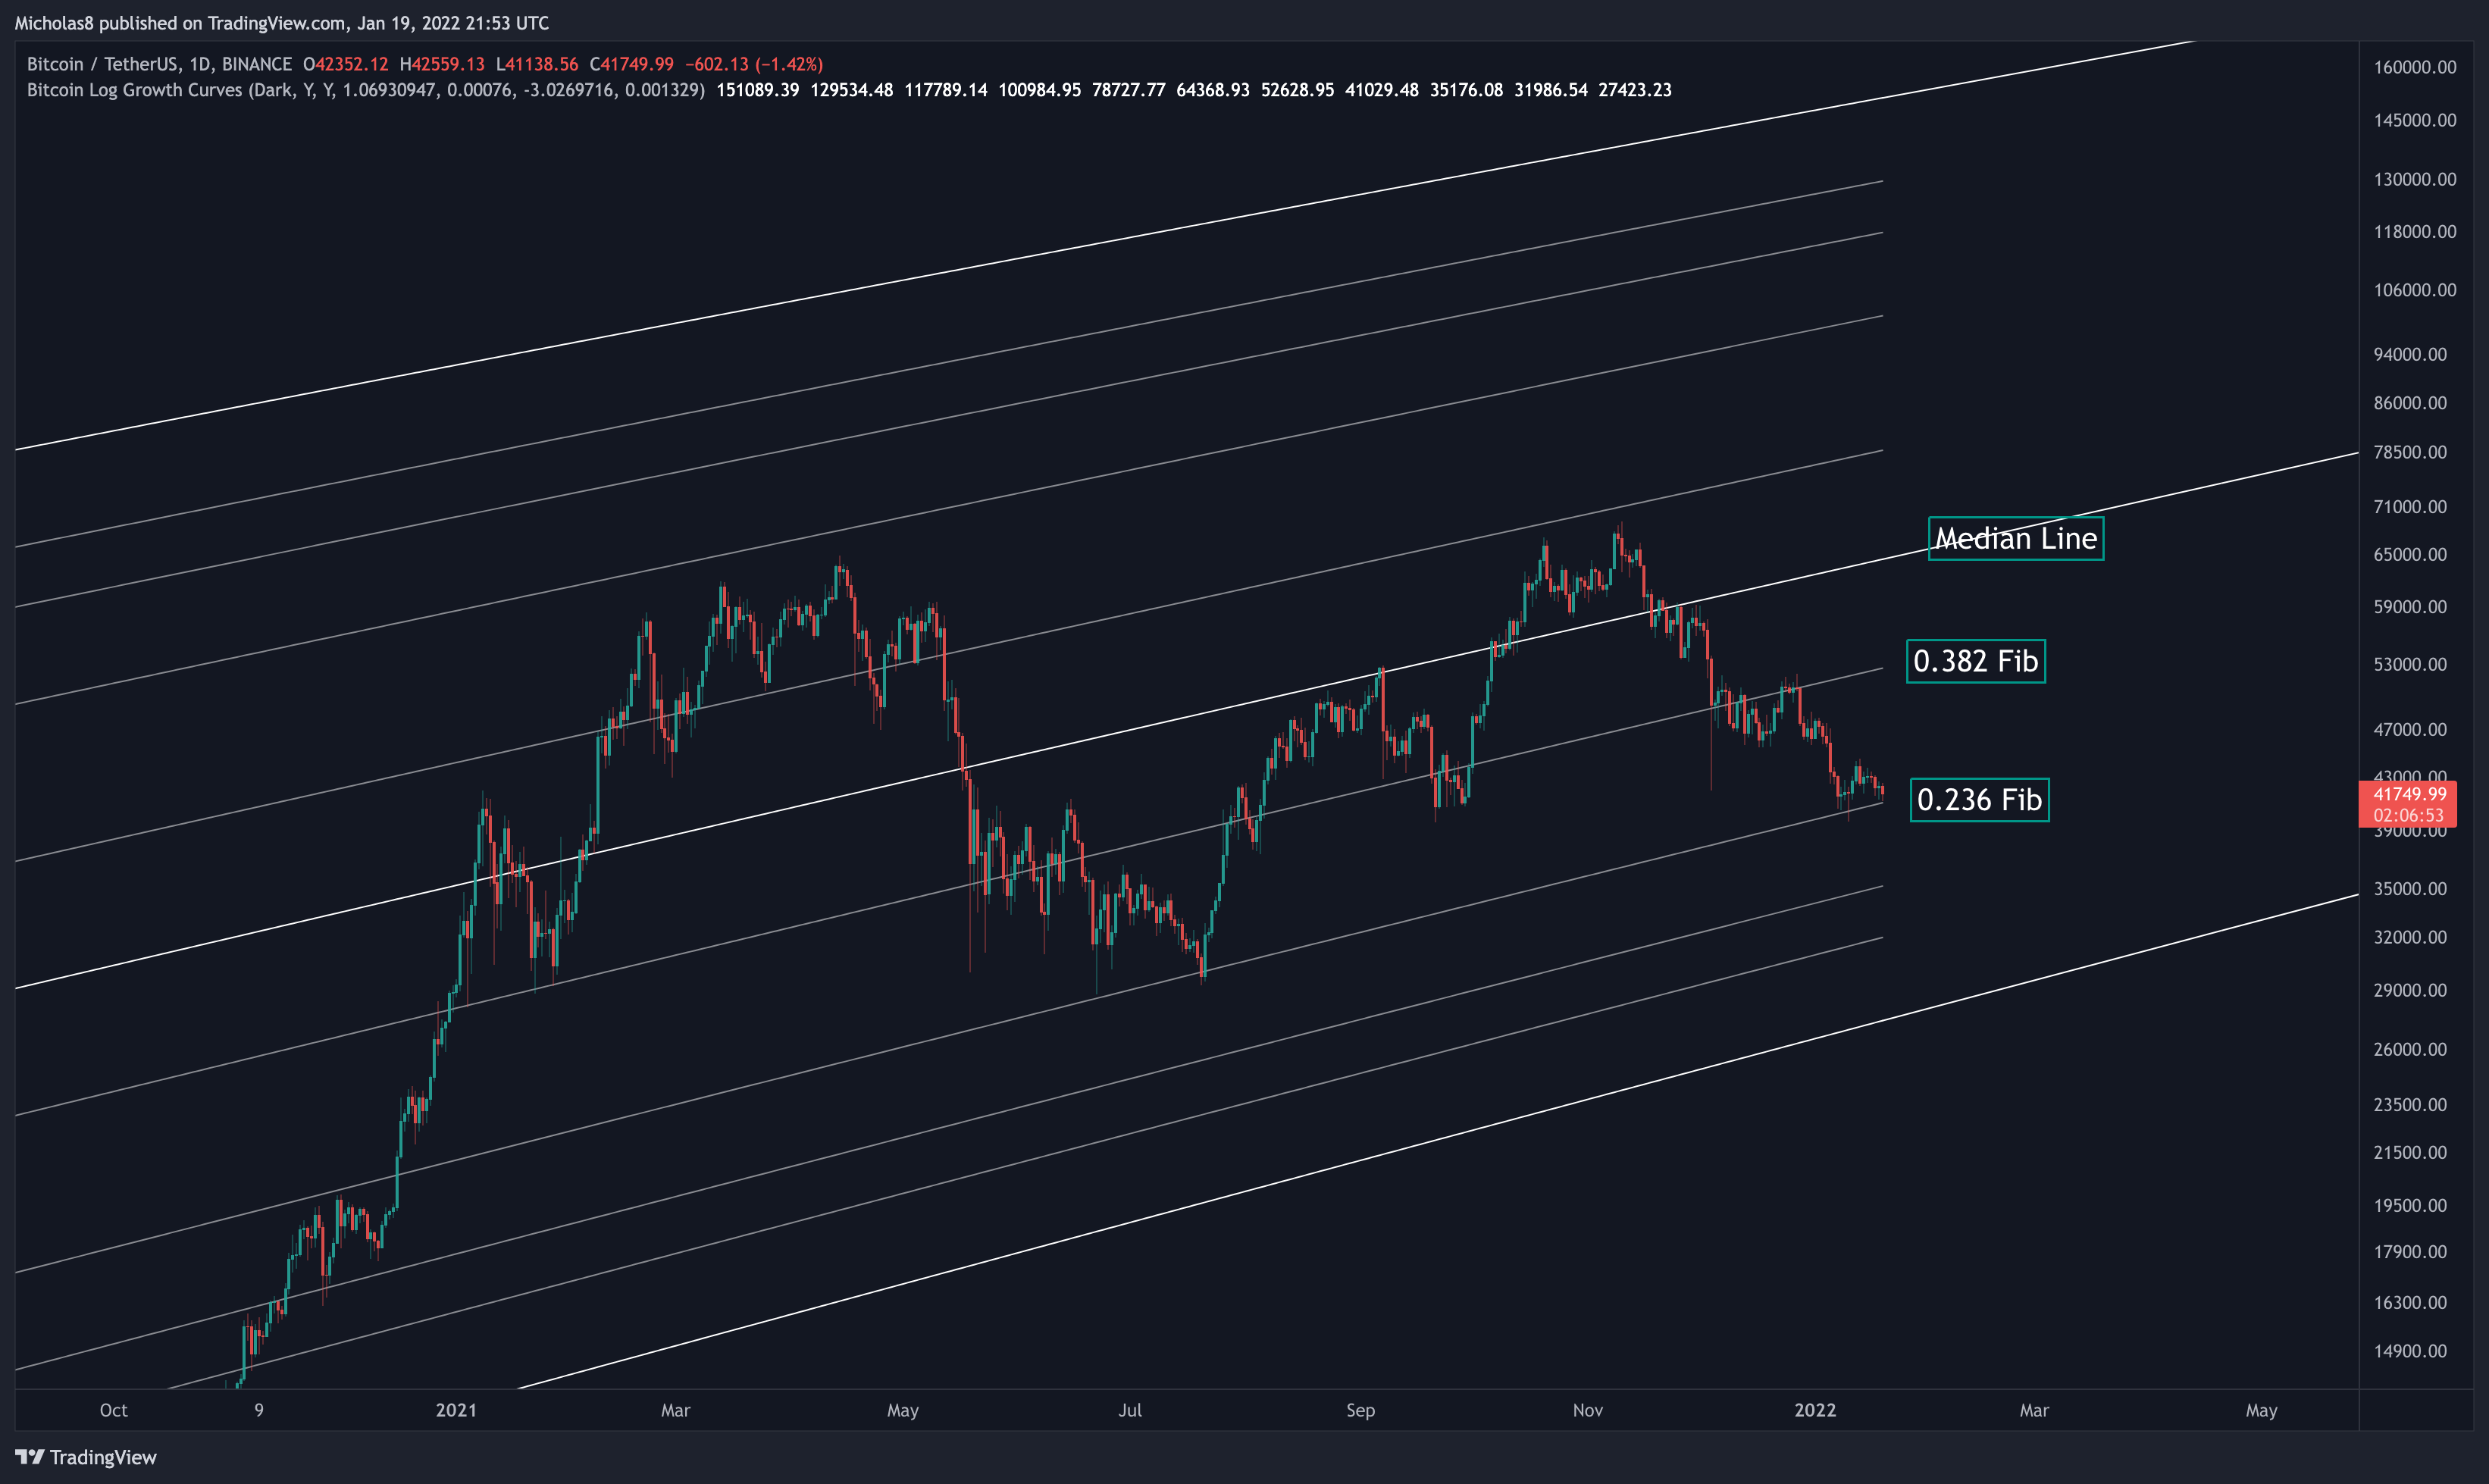
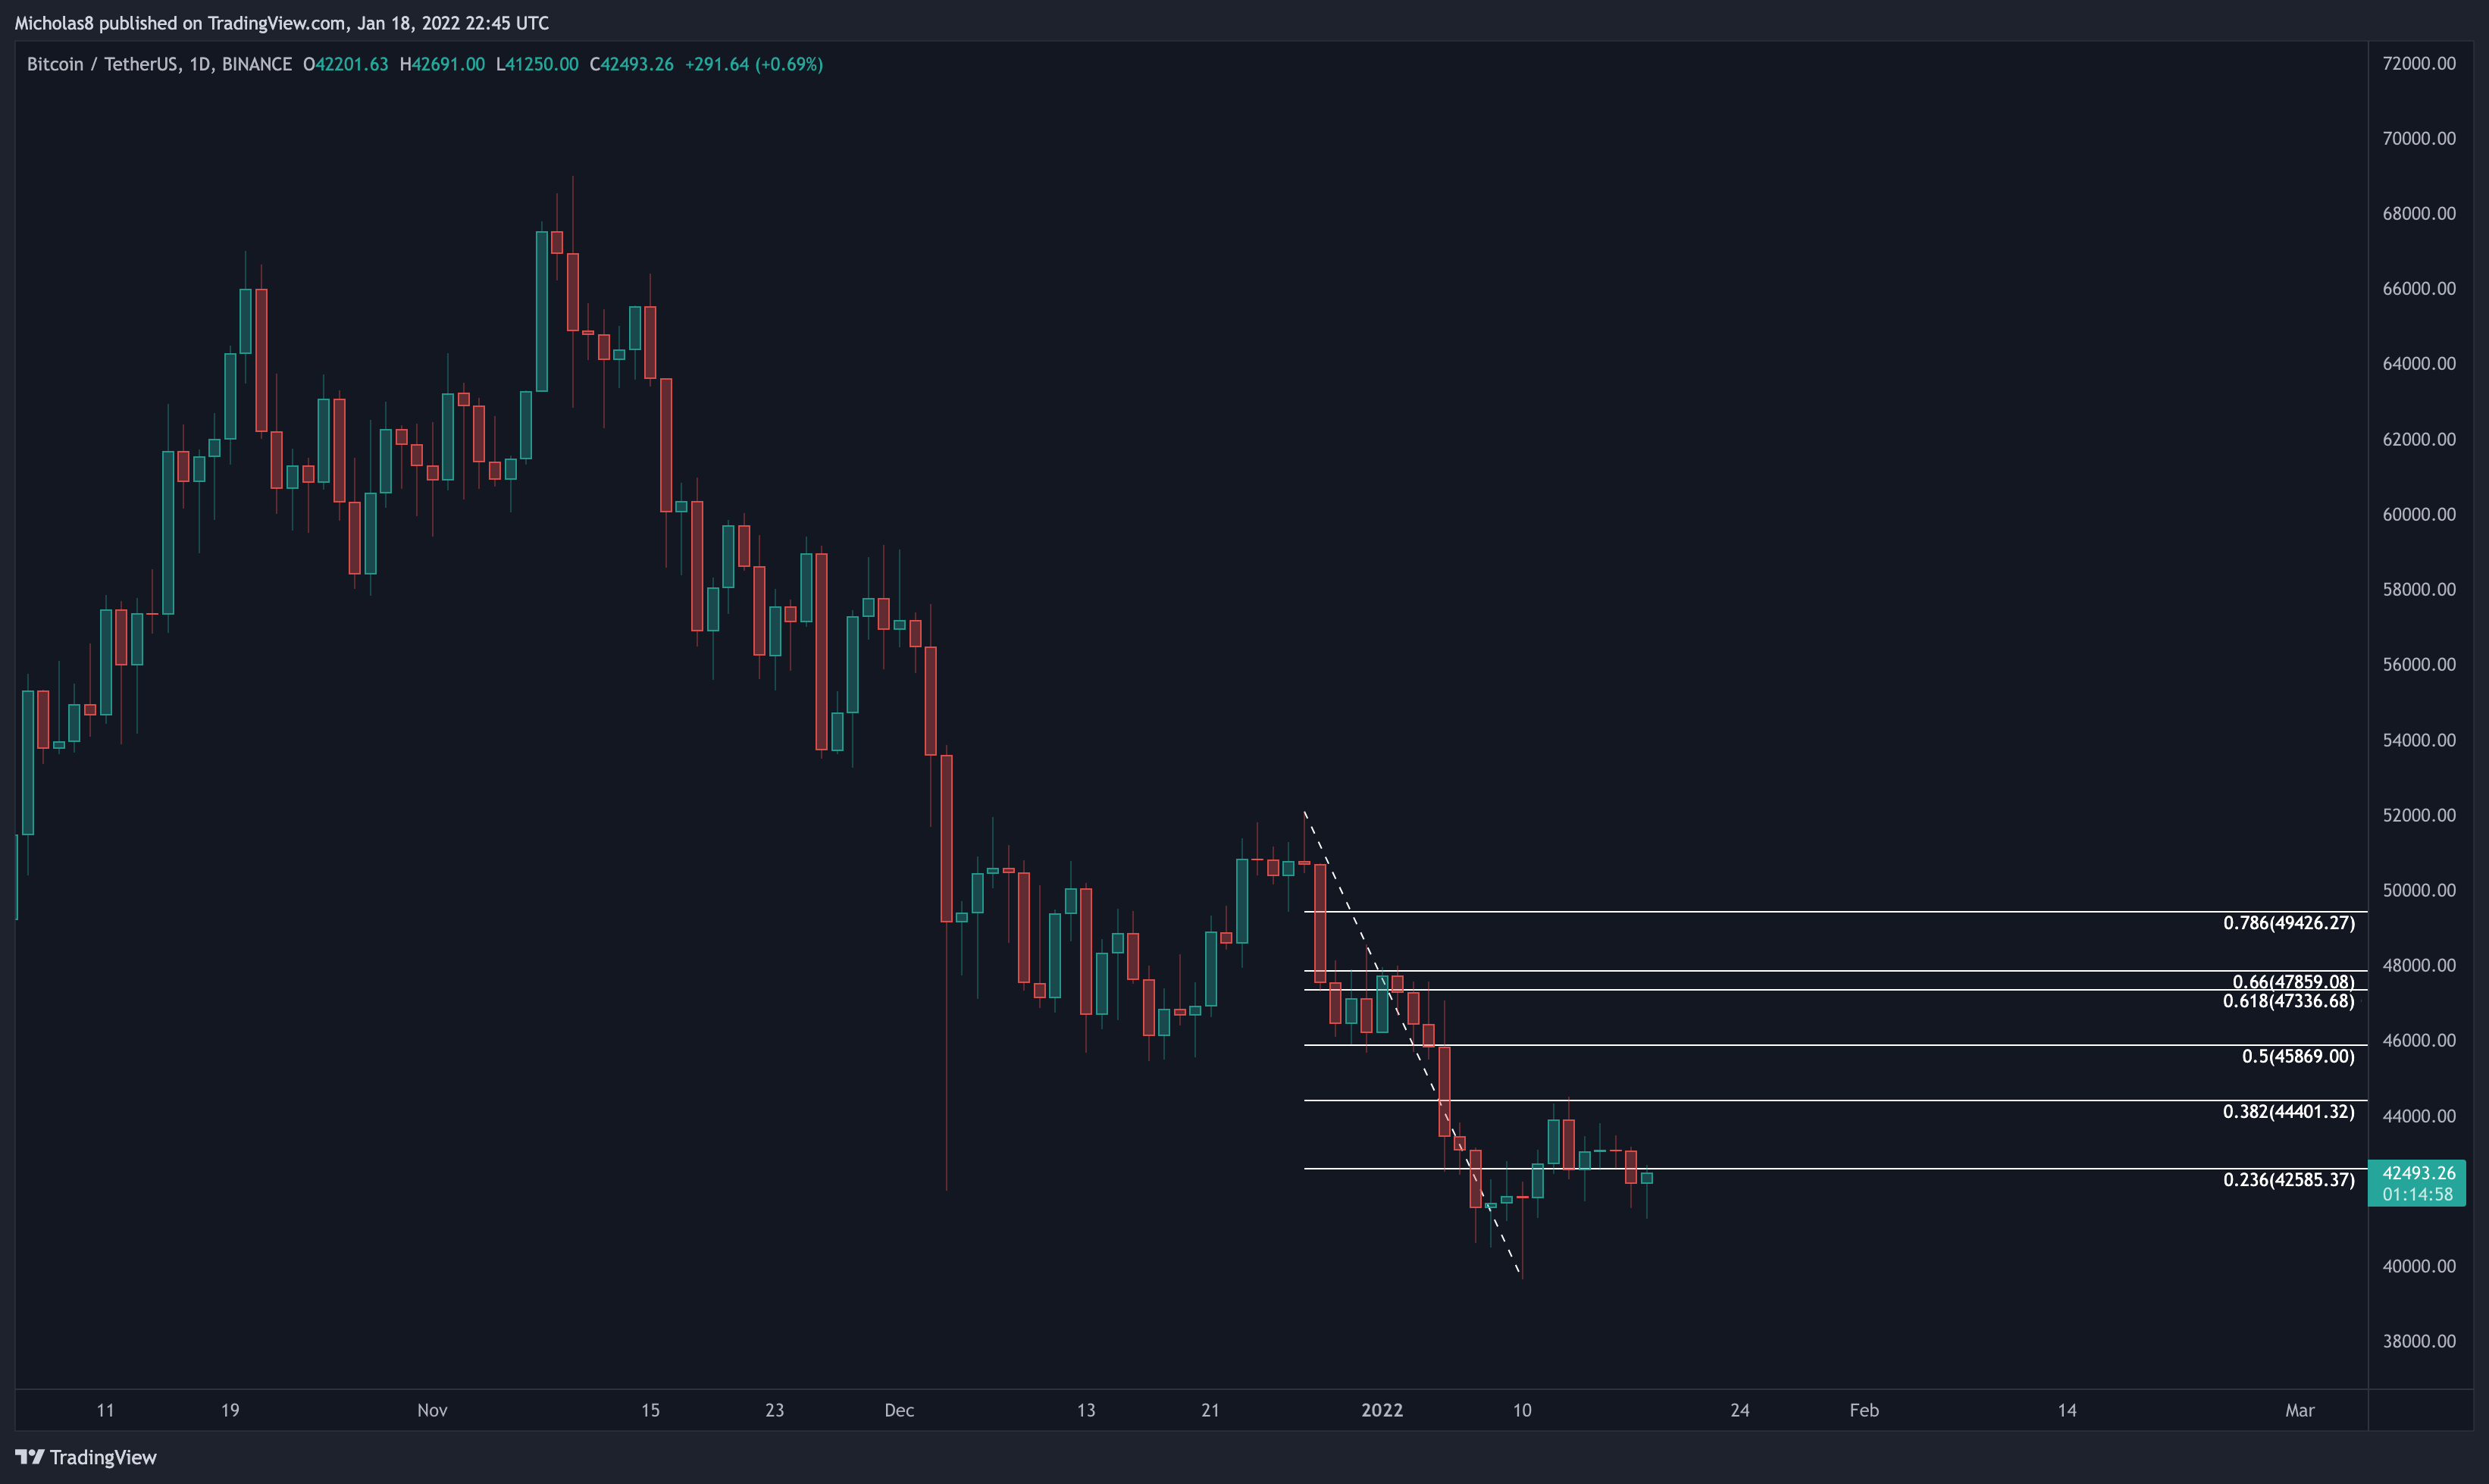
After losing the median line and the 0.382 Fibonacci Level as support, Bitcoin is now attempting to find support from the 0.236 Fibonacci Level.
Once Bitcoin fell below the median line, it became bearish. We can treat this curve as we do with ranges – the upper half = bullish, the bottom half = bearish.
Key Liquidity Zone (LQZ)
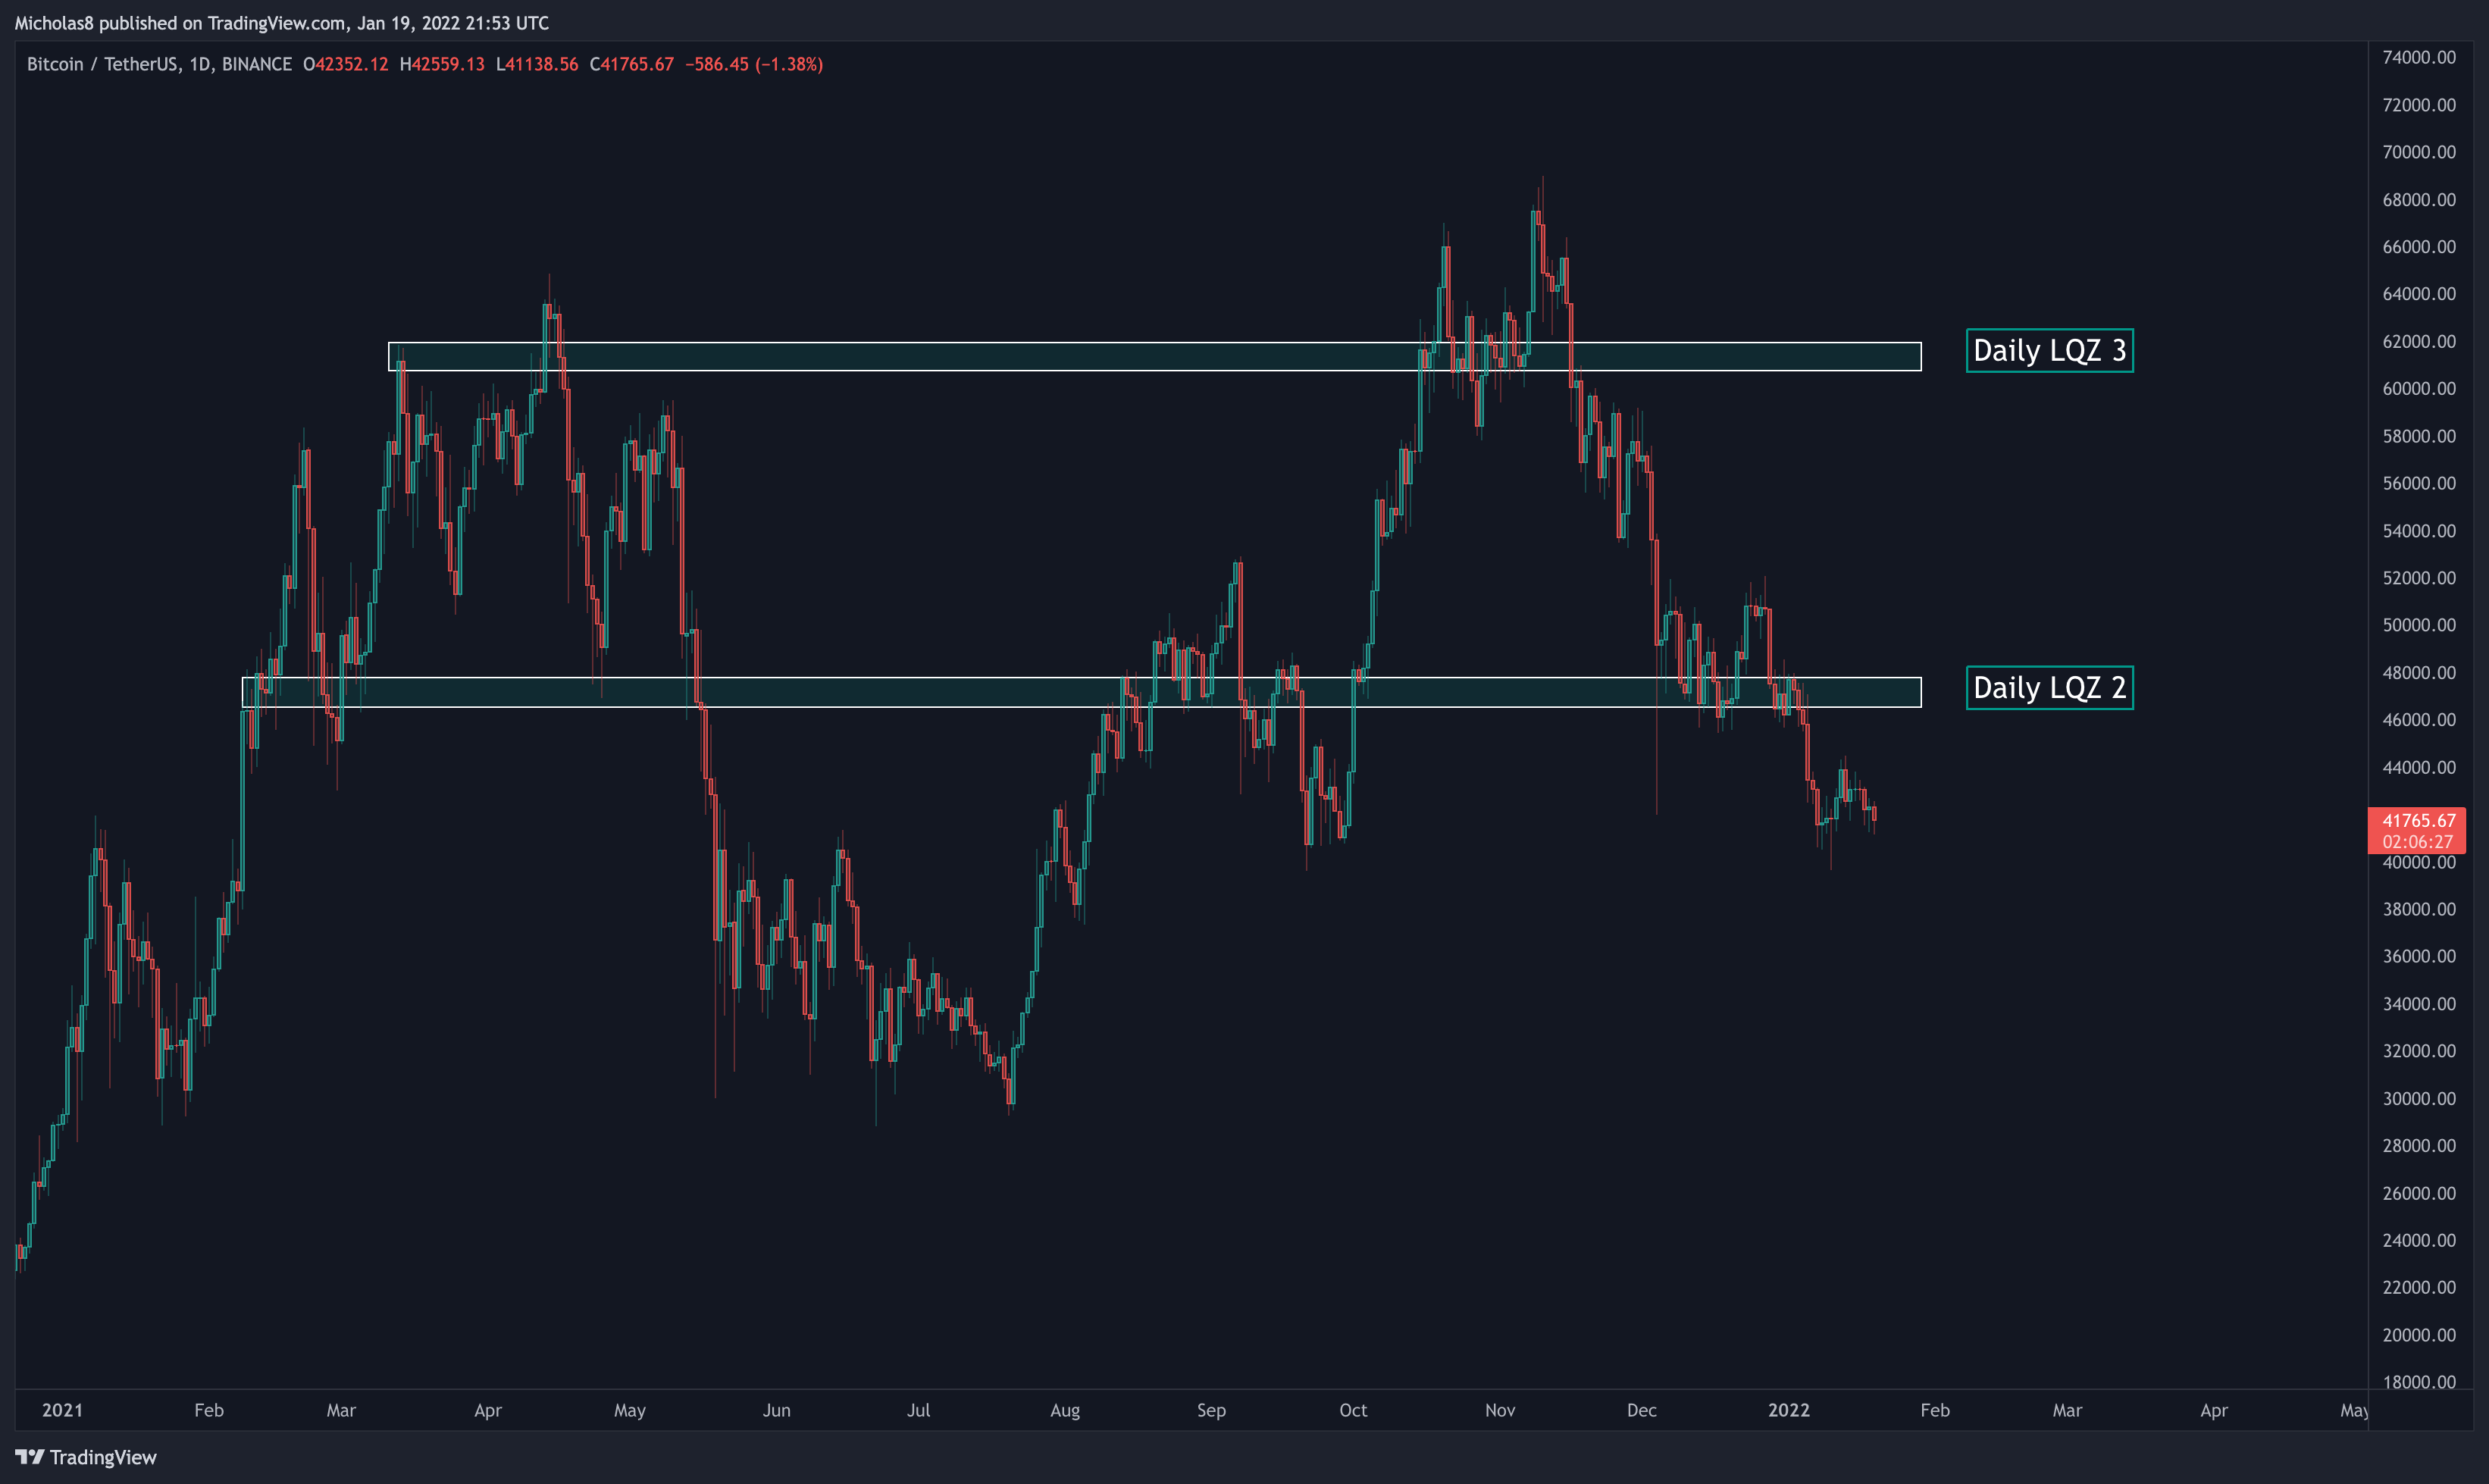
Zone 2: The second LQZ sits at 46.5k - 47.8k, which Bitcoin has unfortunately fallen below. We may see it serve as resistance moving forward.
Zone 3: The final daily liquidity zone sits at 60.7k-61.9k, which Bitcoin still trades significantly below. We may see it serve as resistance moving forward.
Bullish Exhaustion
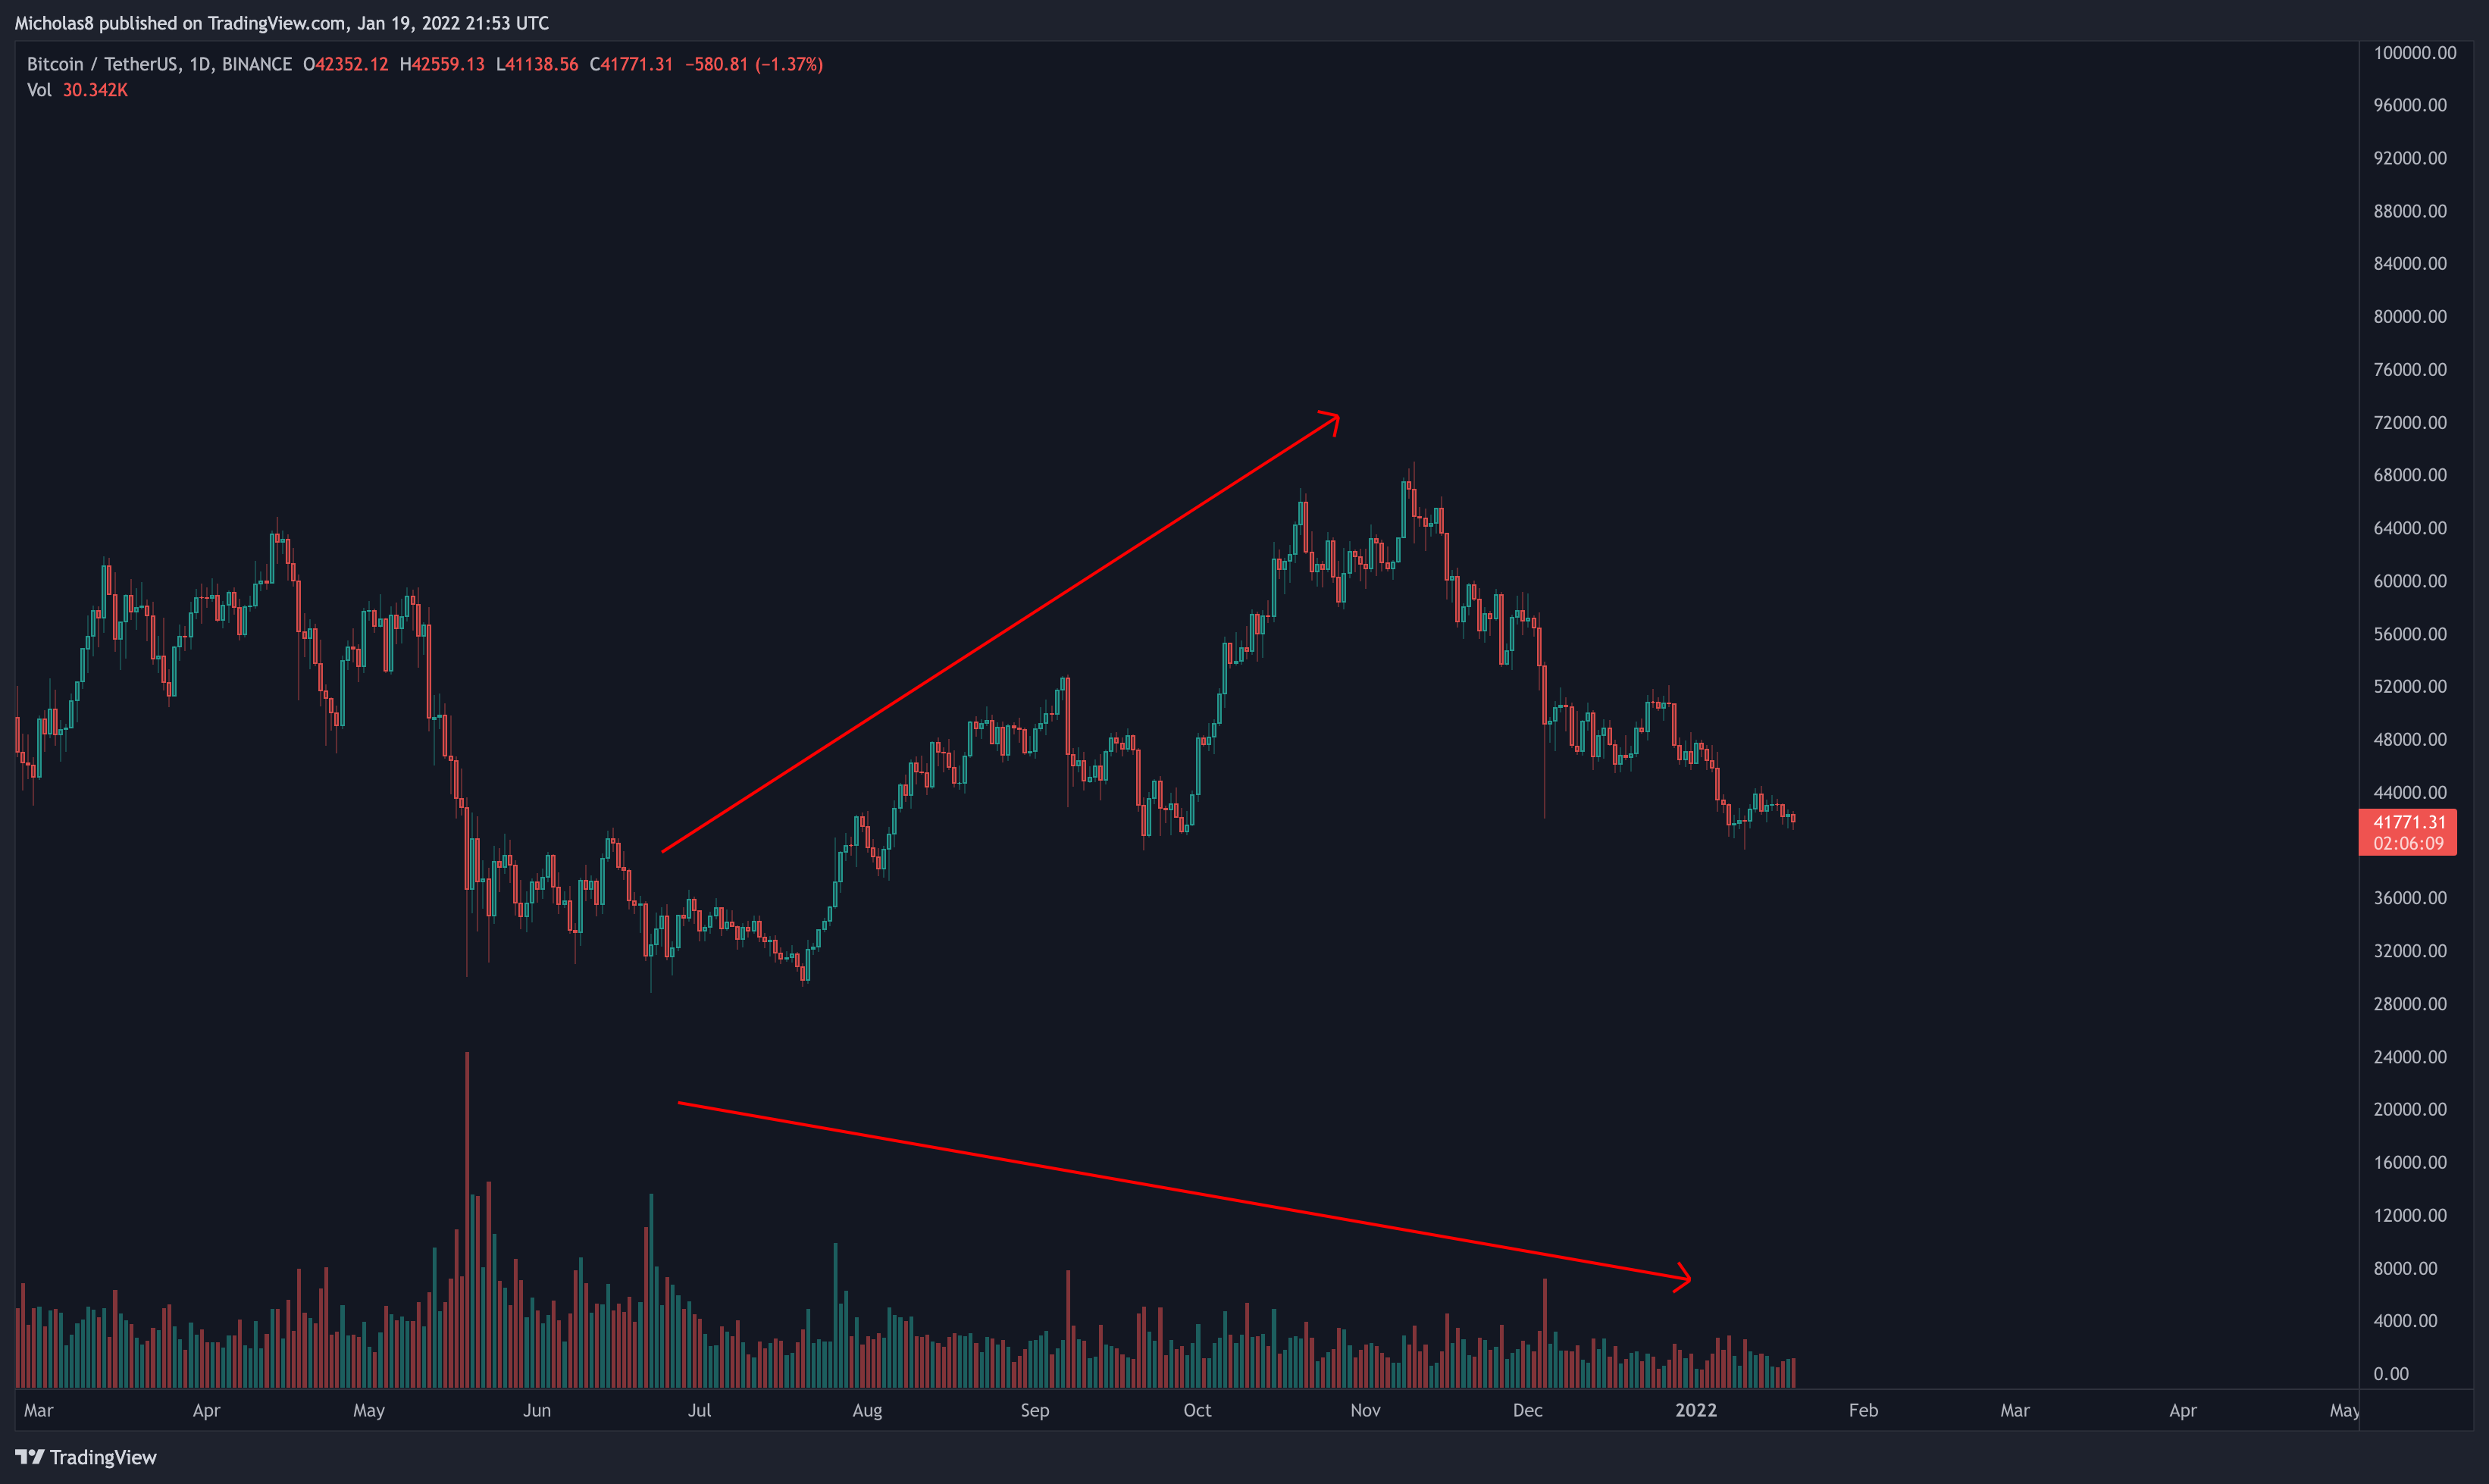
We have an increase in price with a decline in volume, possibly signalling a loss of bullish momentum in the market.
Network Value to Transaction (NVT)
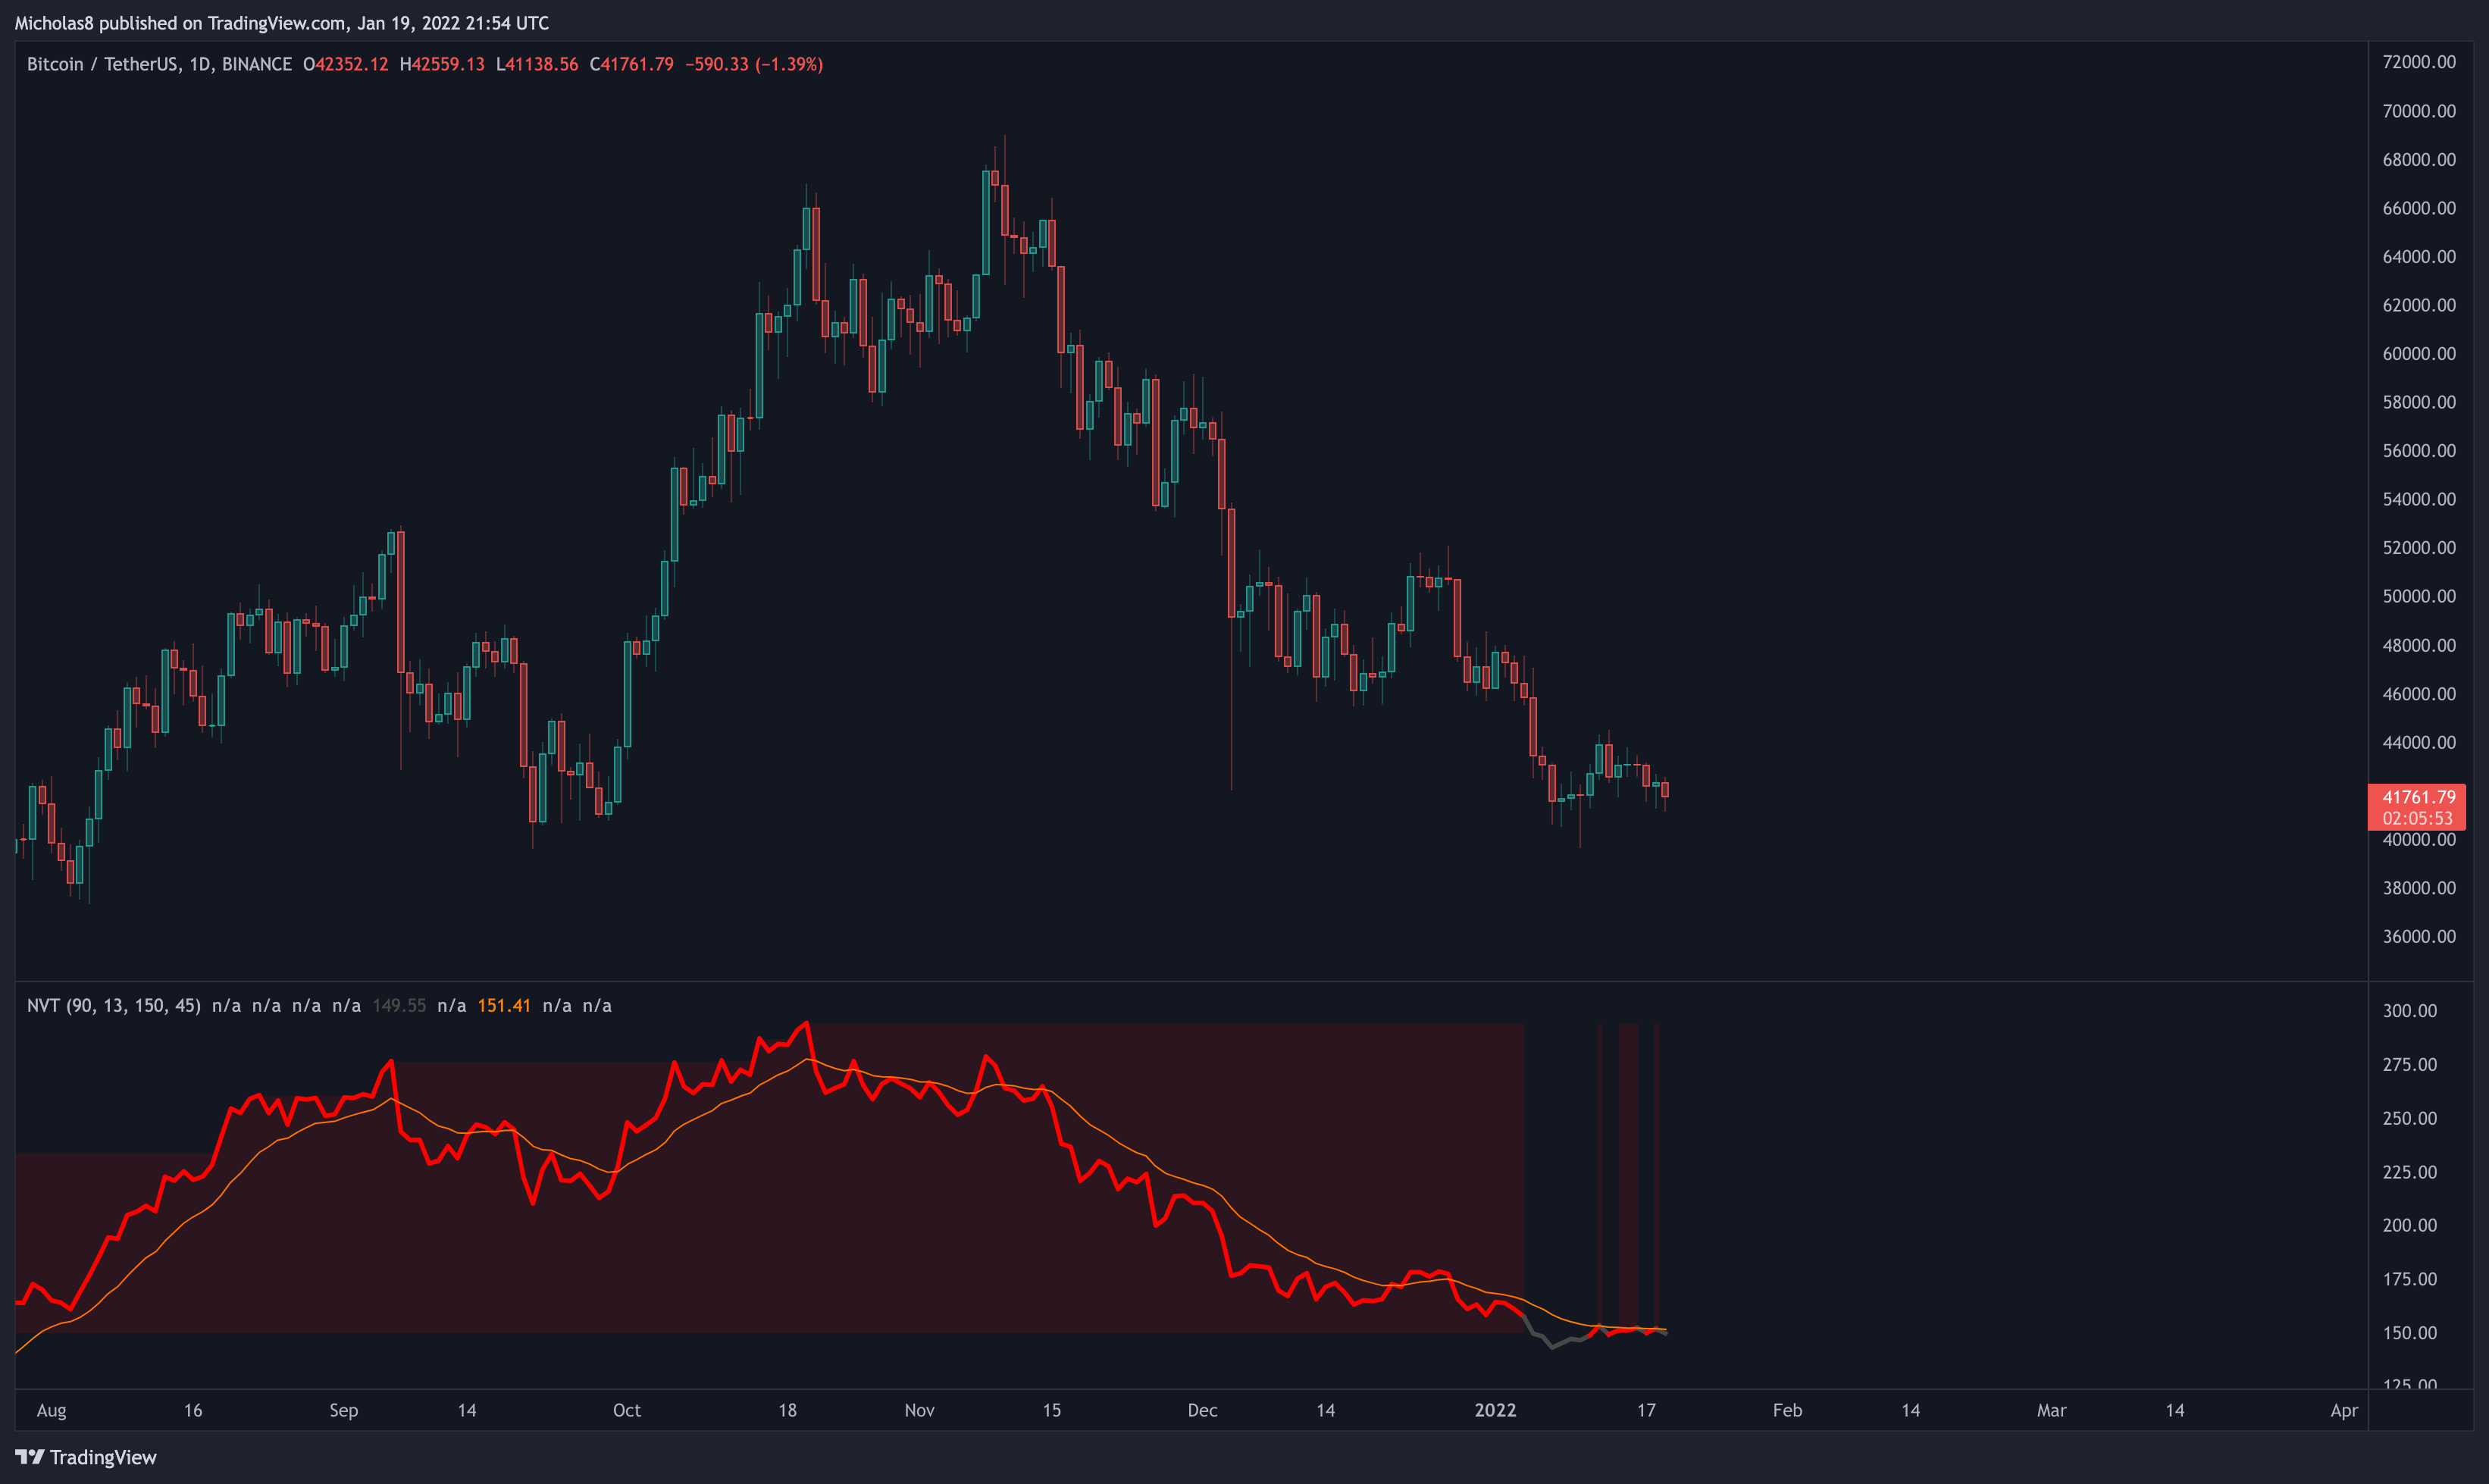
*This indicator describes the relationship between market cap and transfer volumes.
Bitcoin will likely close below the NVT Signal Line. Typically when this happens, we see a more sustained correction/consolidation phase.
The NVT looks like it's shifting back to grey again (bearish). And until we can reclaim the Signal Line as support, this remains bearish.
Directional Movement Index (DMI)
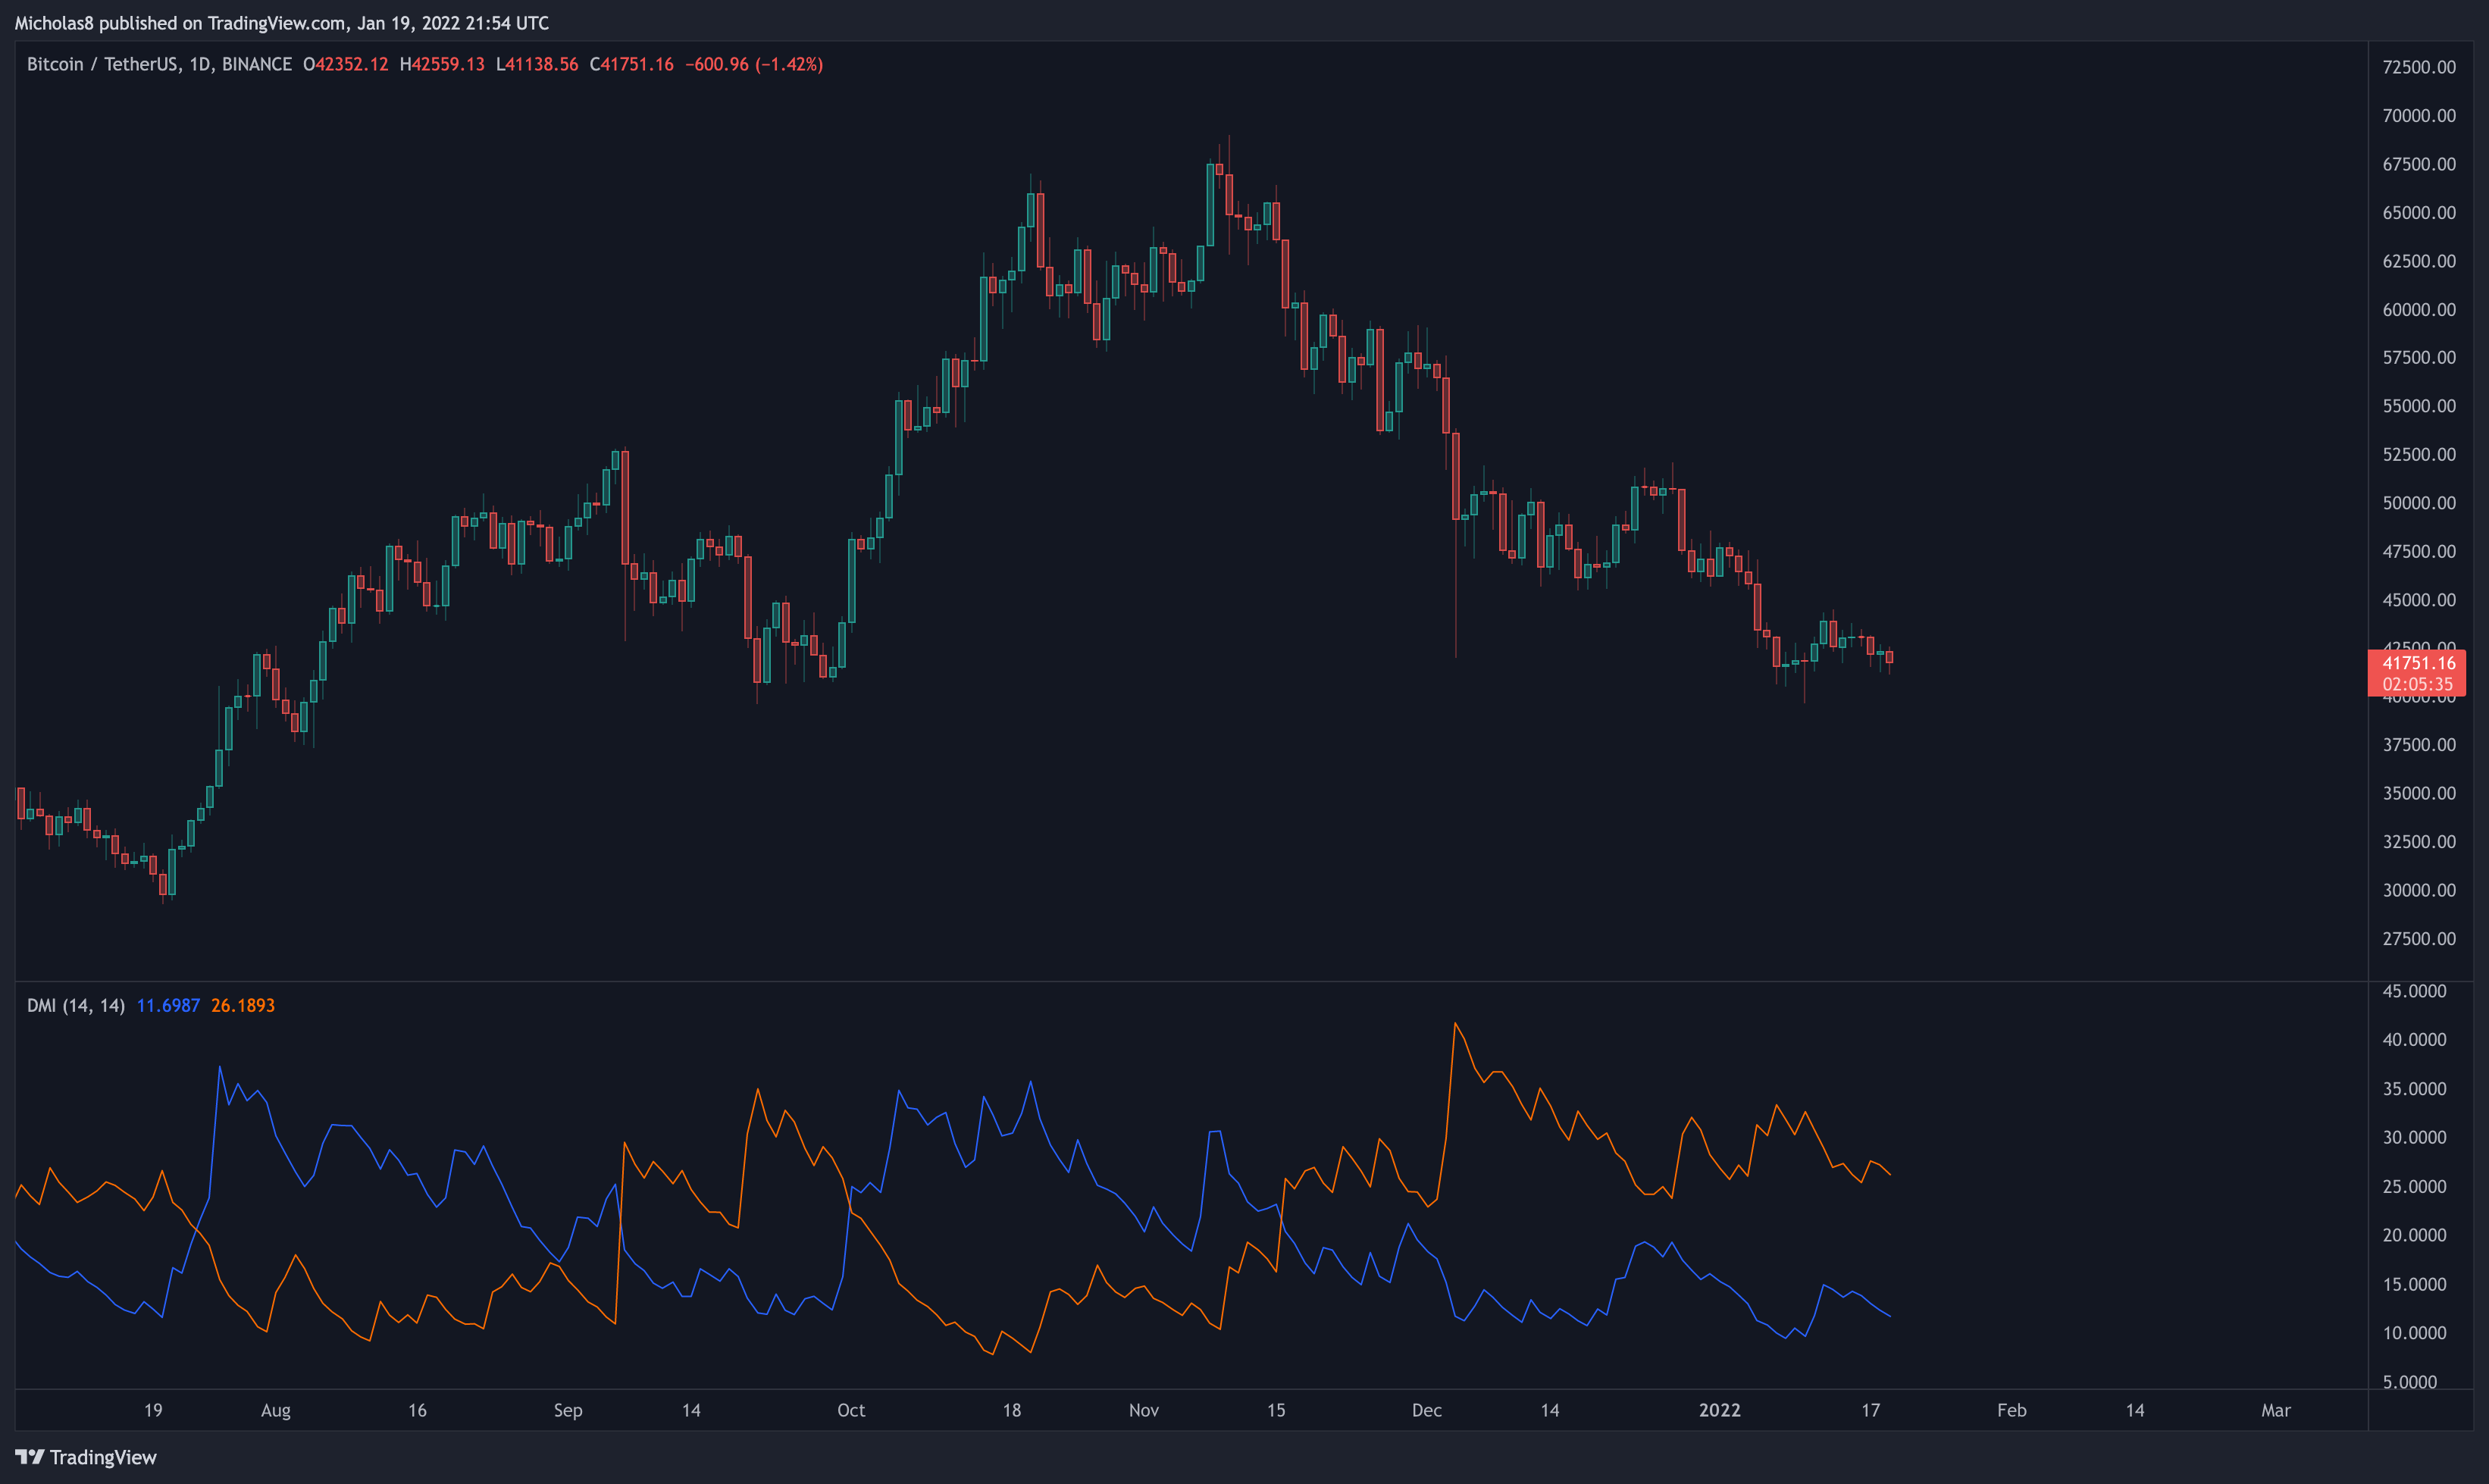
*This is another momentum indicator.
Generally speaking, when the blue line (bullish) crosses below the orange line (bearish), it signals a potential shift in momentum to the bears. Given that the orange line still trends above the blue line, Bitcoin's momentum remains negative.
EMA Ribbon
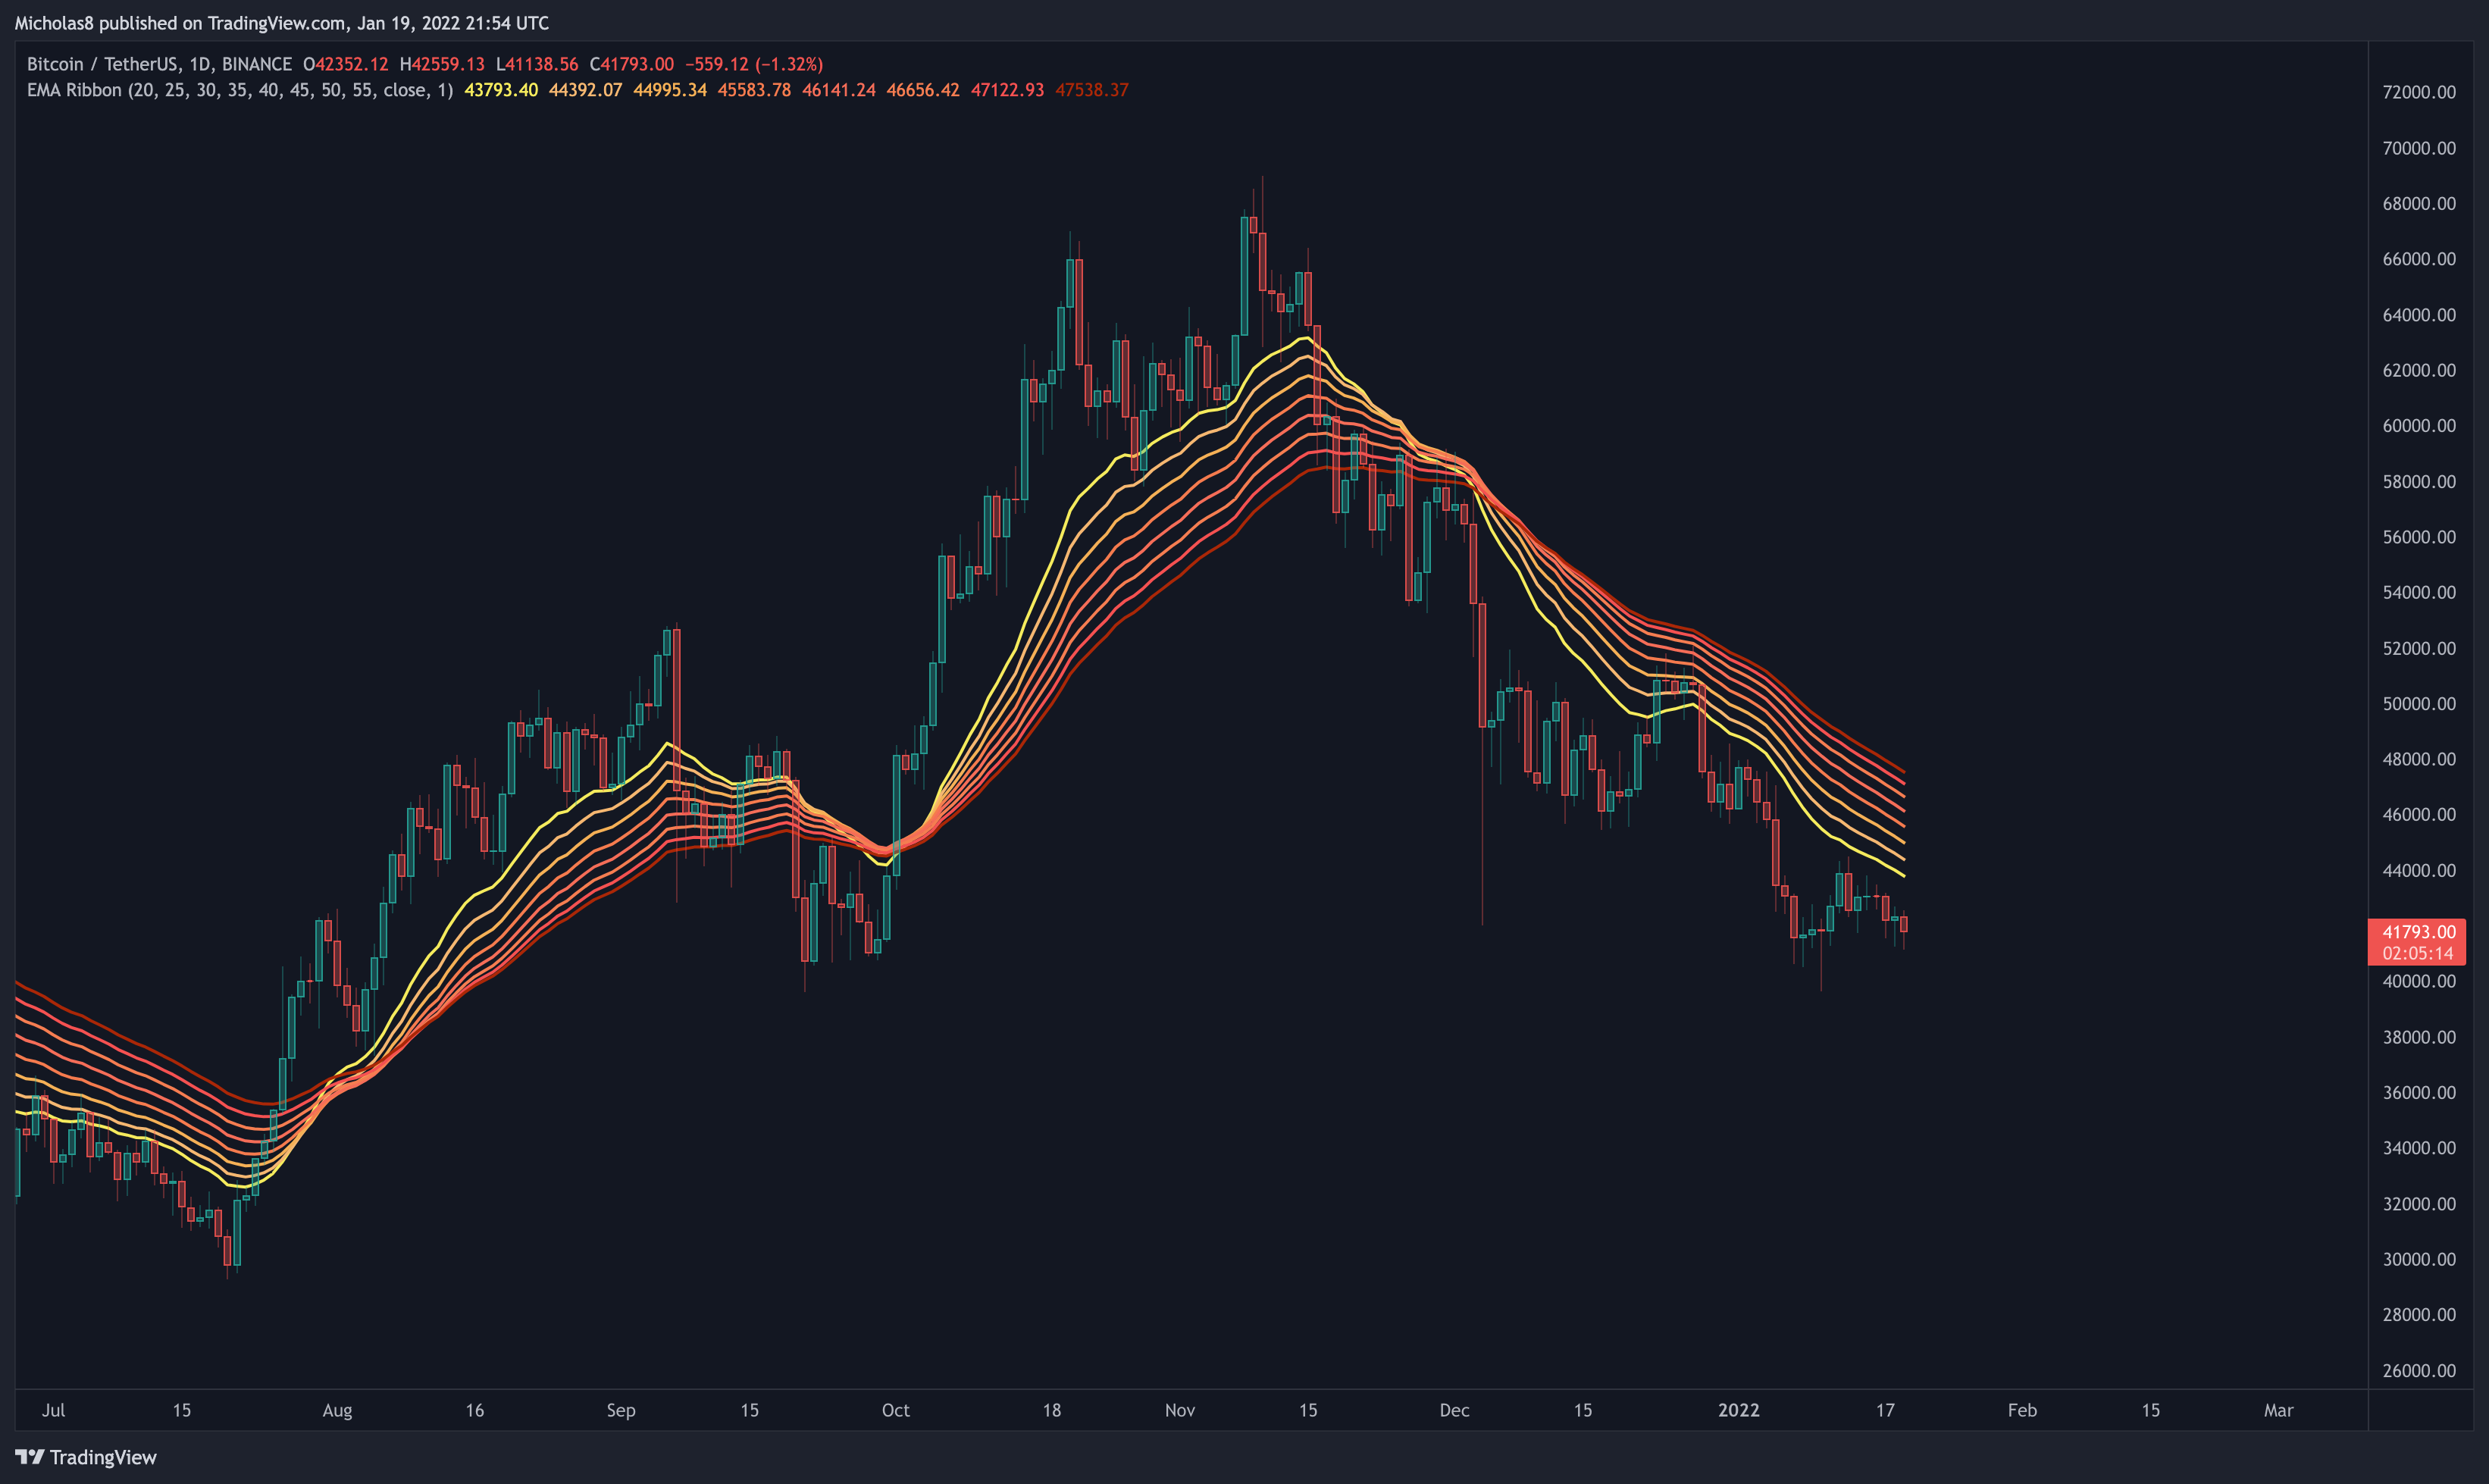
Bitcoin has lost the EMA ribbon as support in this timeframe.
Implication: It may end up serving as strong resistance.
What is an EMA ribbon? A 'ribbon' of EMAs that together indicate bearish and bullish momentum in the market. When an asset is trading is above the ribbon, it's considered bullish. Vice-versa.
Exponential Moving Average (EMA): 8, 21, 50 and 200
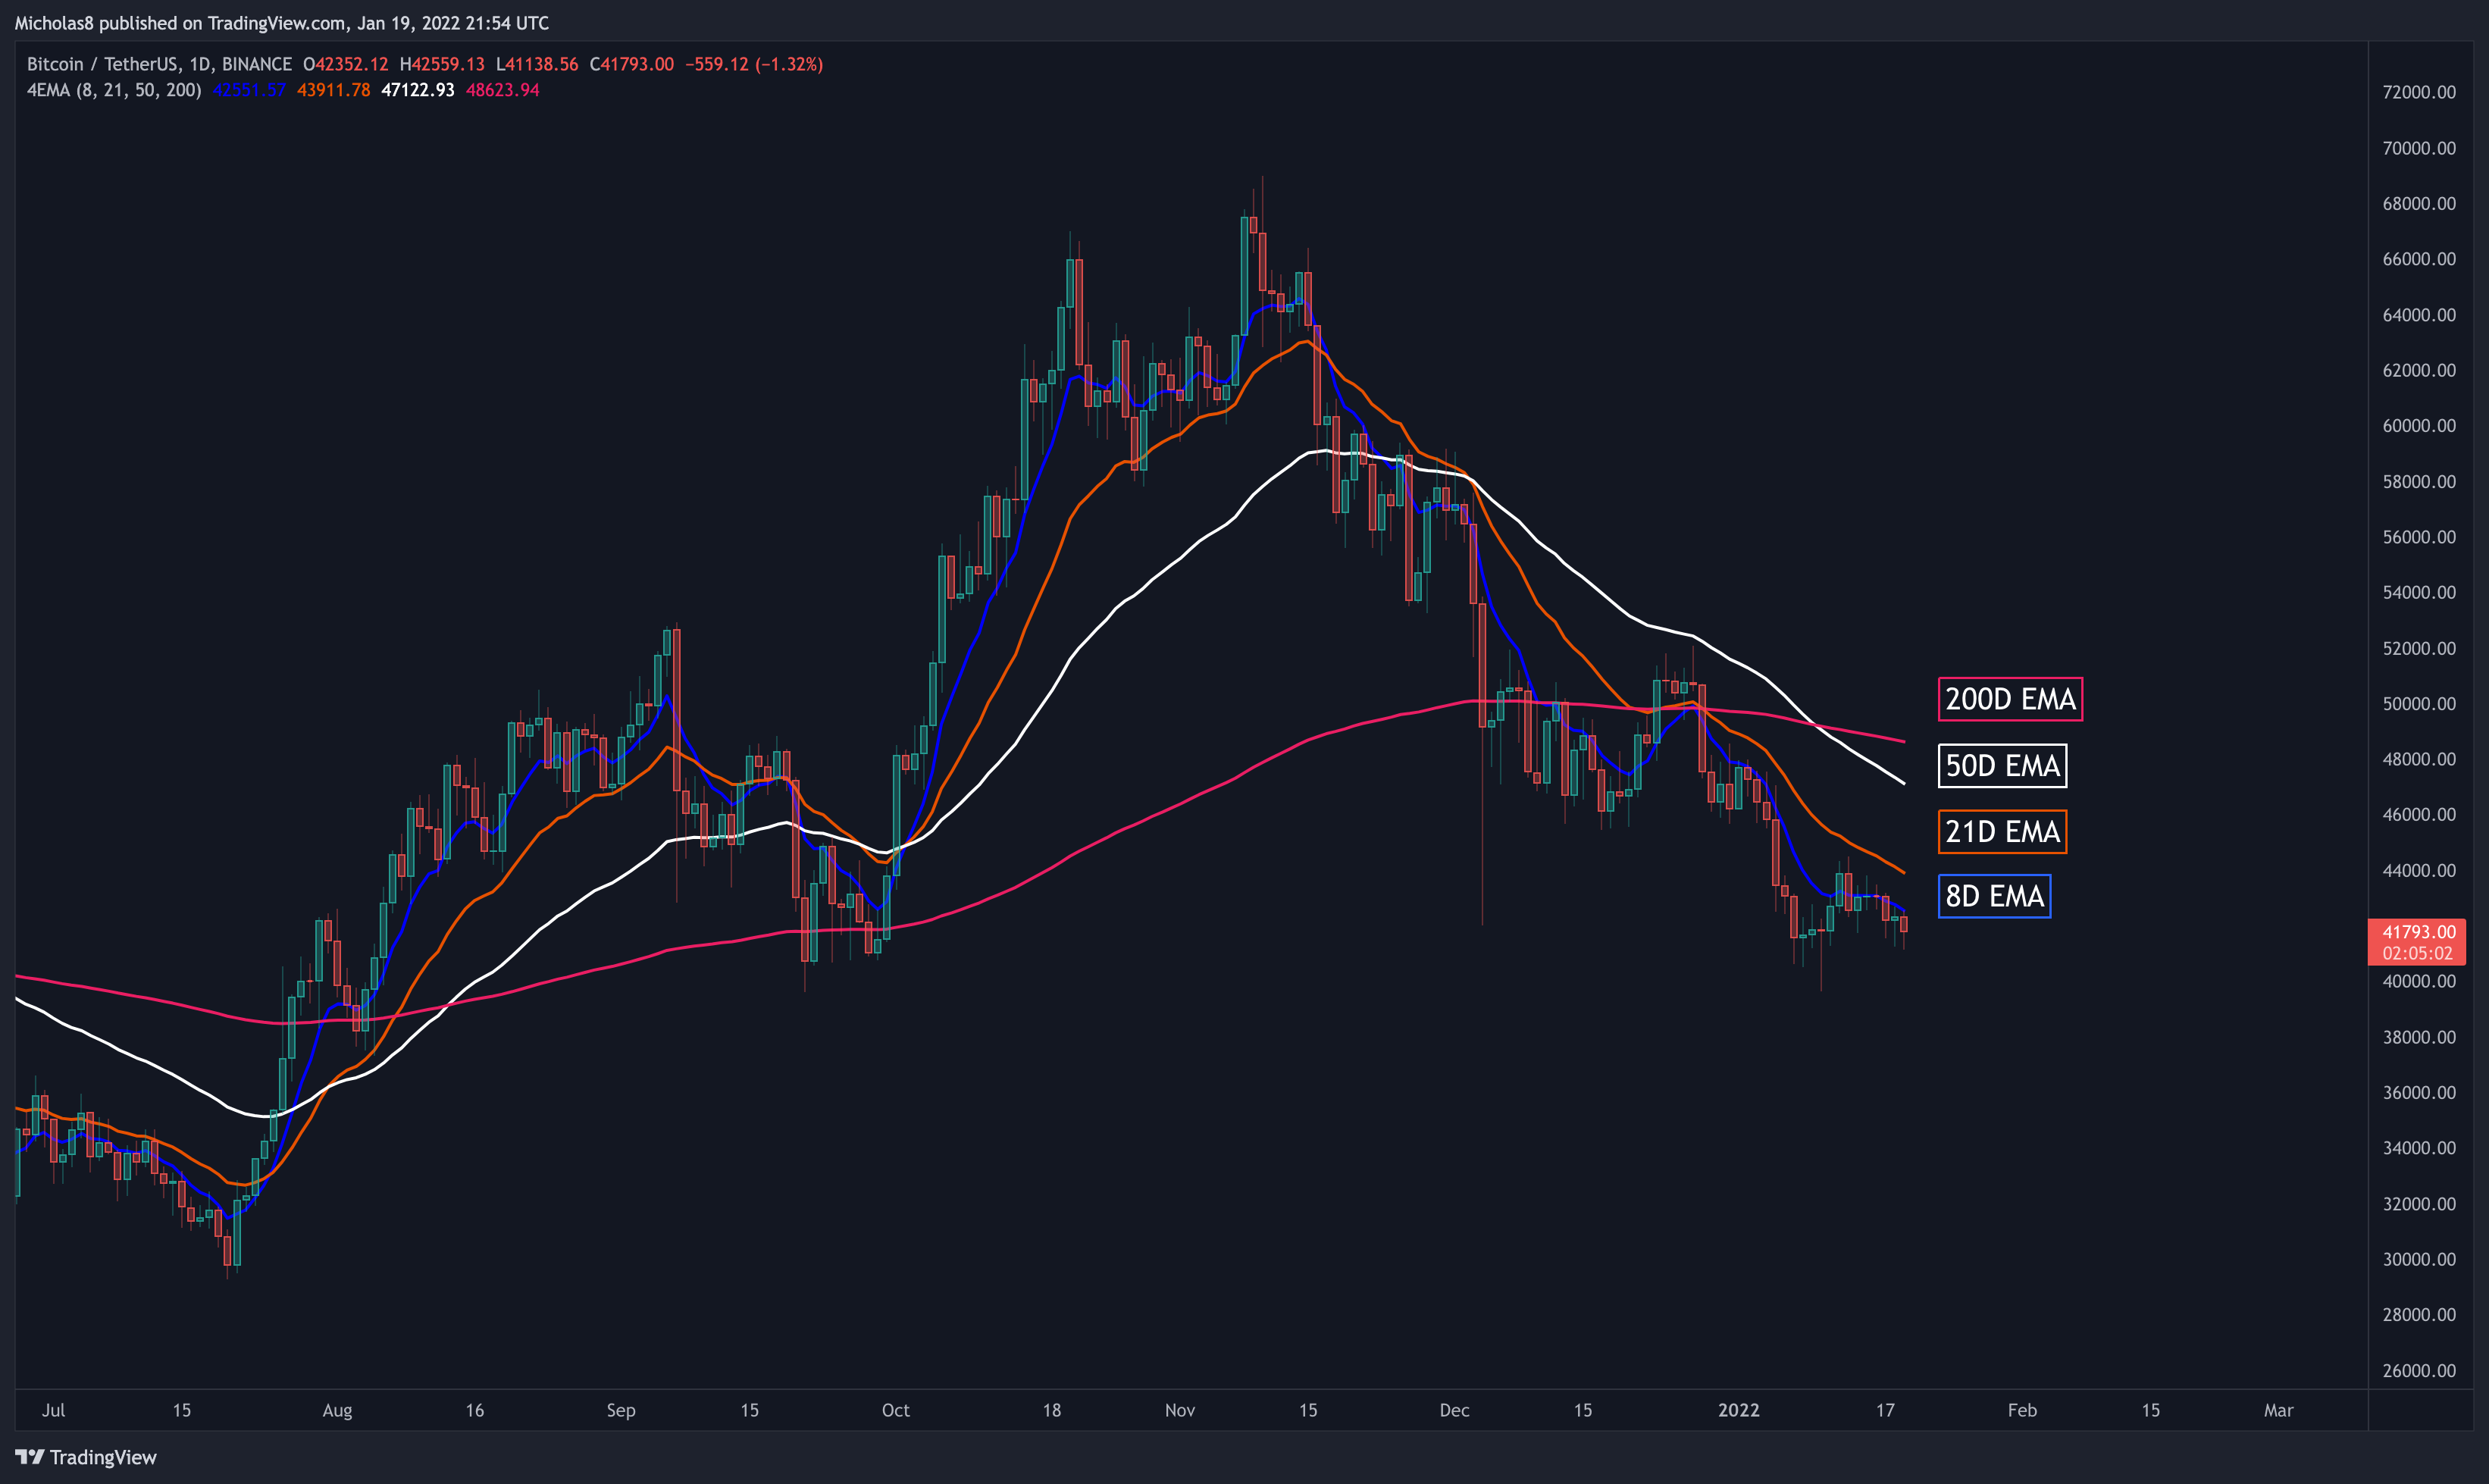
Bitcoin continues to trade below the 21/50/200 EMAs, and has failed to re-claim the 8-day EMA as support.
Implications: They may serve as resistance moving forward.
Simple Moving Average (SMA): 20, 50, 100 and 200
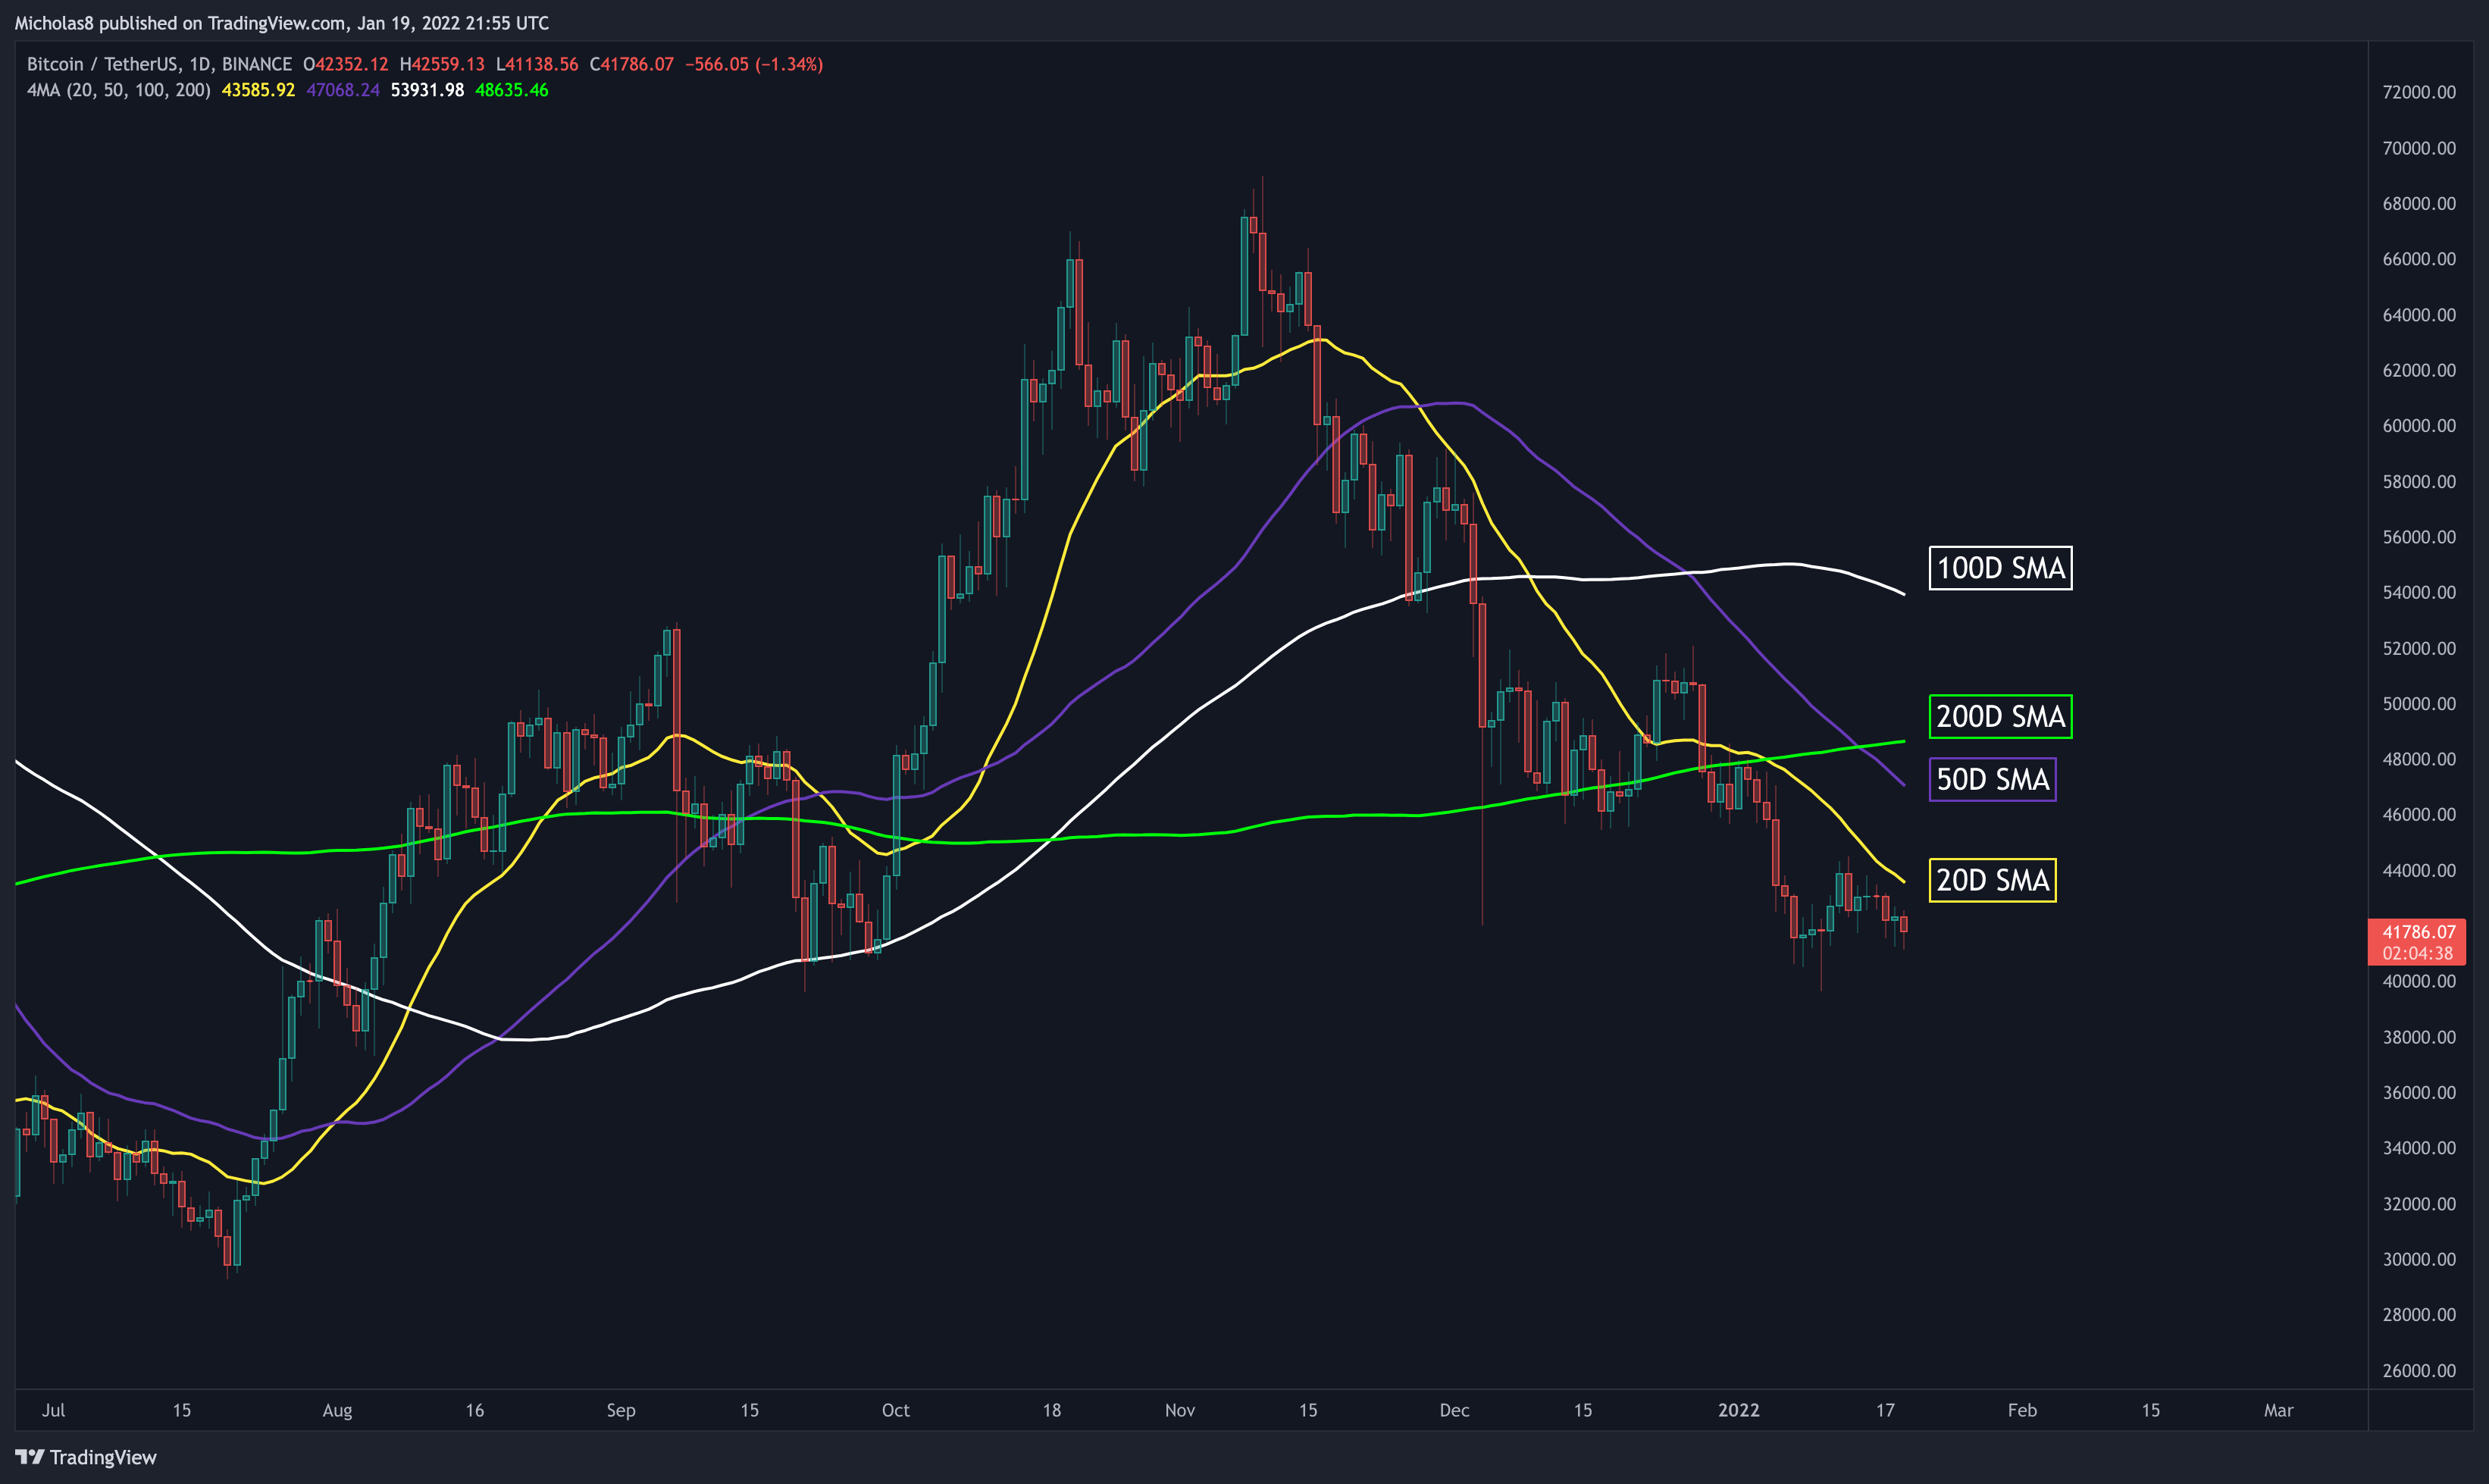
Bitcoin continues to trade below these SMAs. We have seen a Death Cross between the 50/200-day SMAs. This is a traditional marker for whether or not an asset is in a bear market or not. When the 50 SMA trends above the 200 SMA, the asset is bullish. When the 50 SMA trends below the 200 SMA, the asset is bearish.
Implications: They may serve as a level of resistance moving forward. Bitcoin has fallen below the 200-day SMA again. Traditionally, this is indicative of an asset being in a bear market. We have seen a Death Cross between the 20/200-day SMAs. This is typically indicative of continued downside PA.
4H Timeframe
Key Liquidity Zone (LQZ)
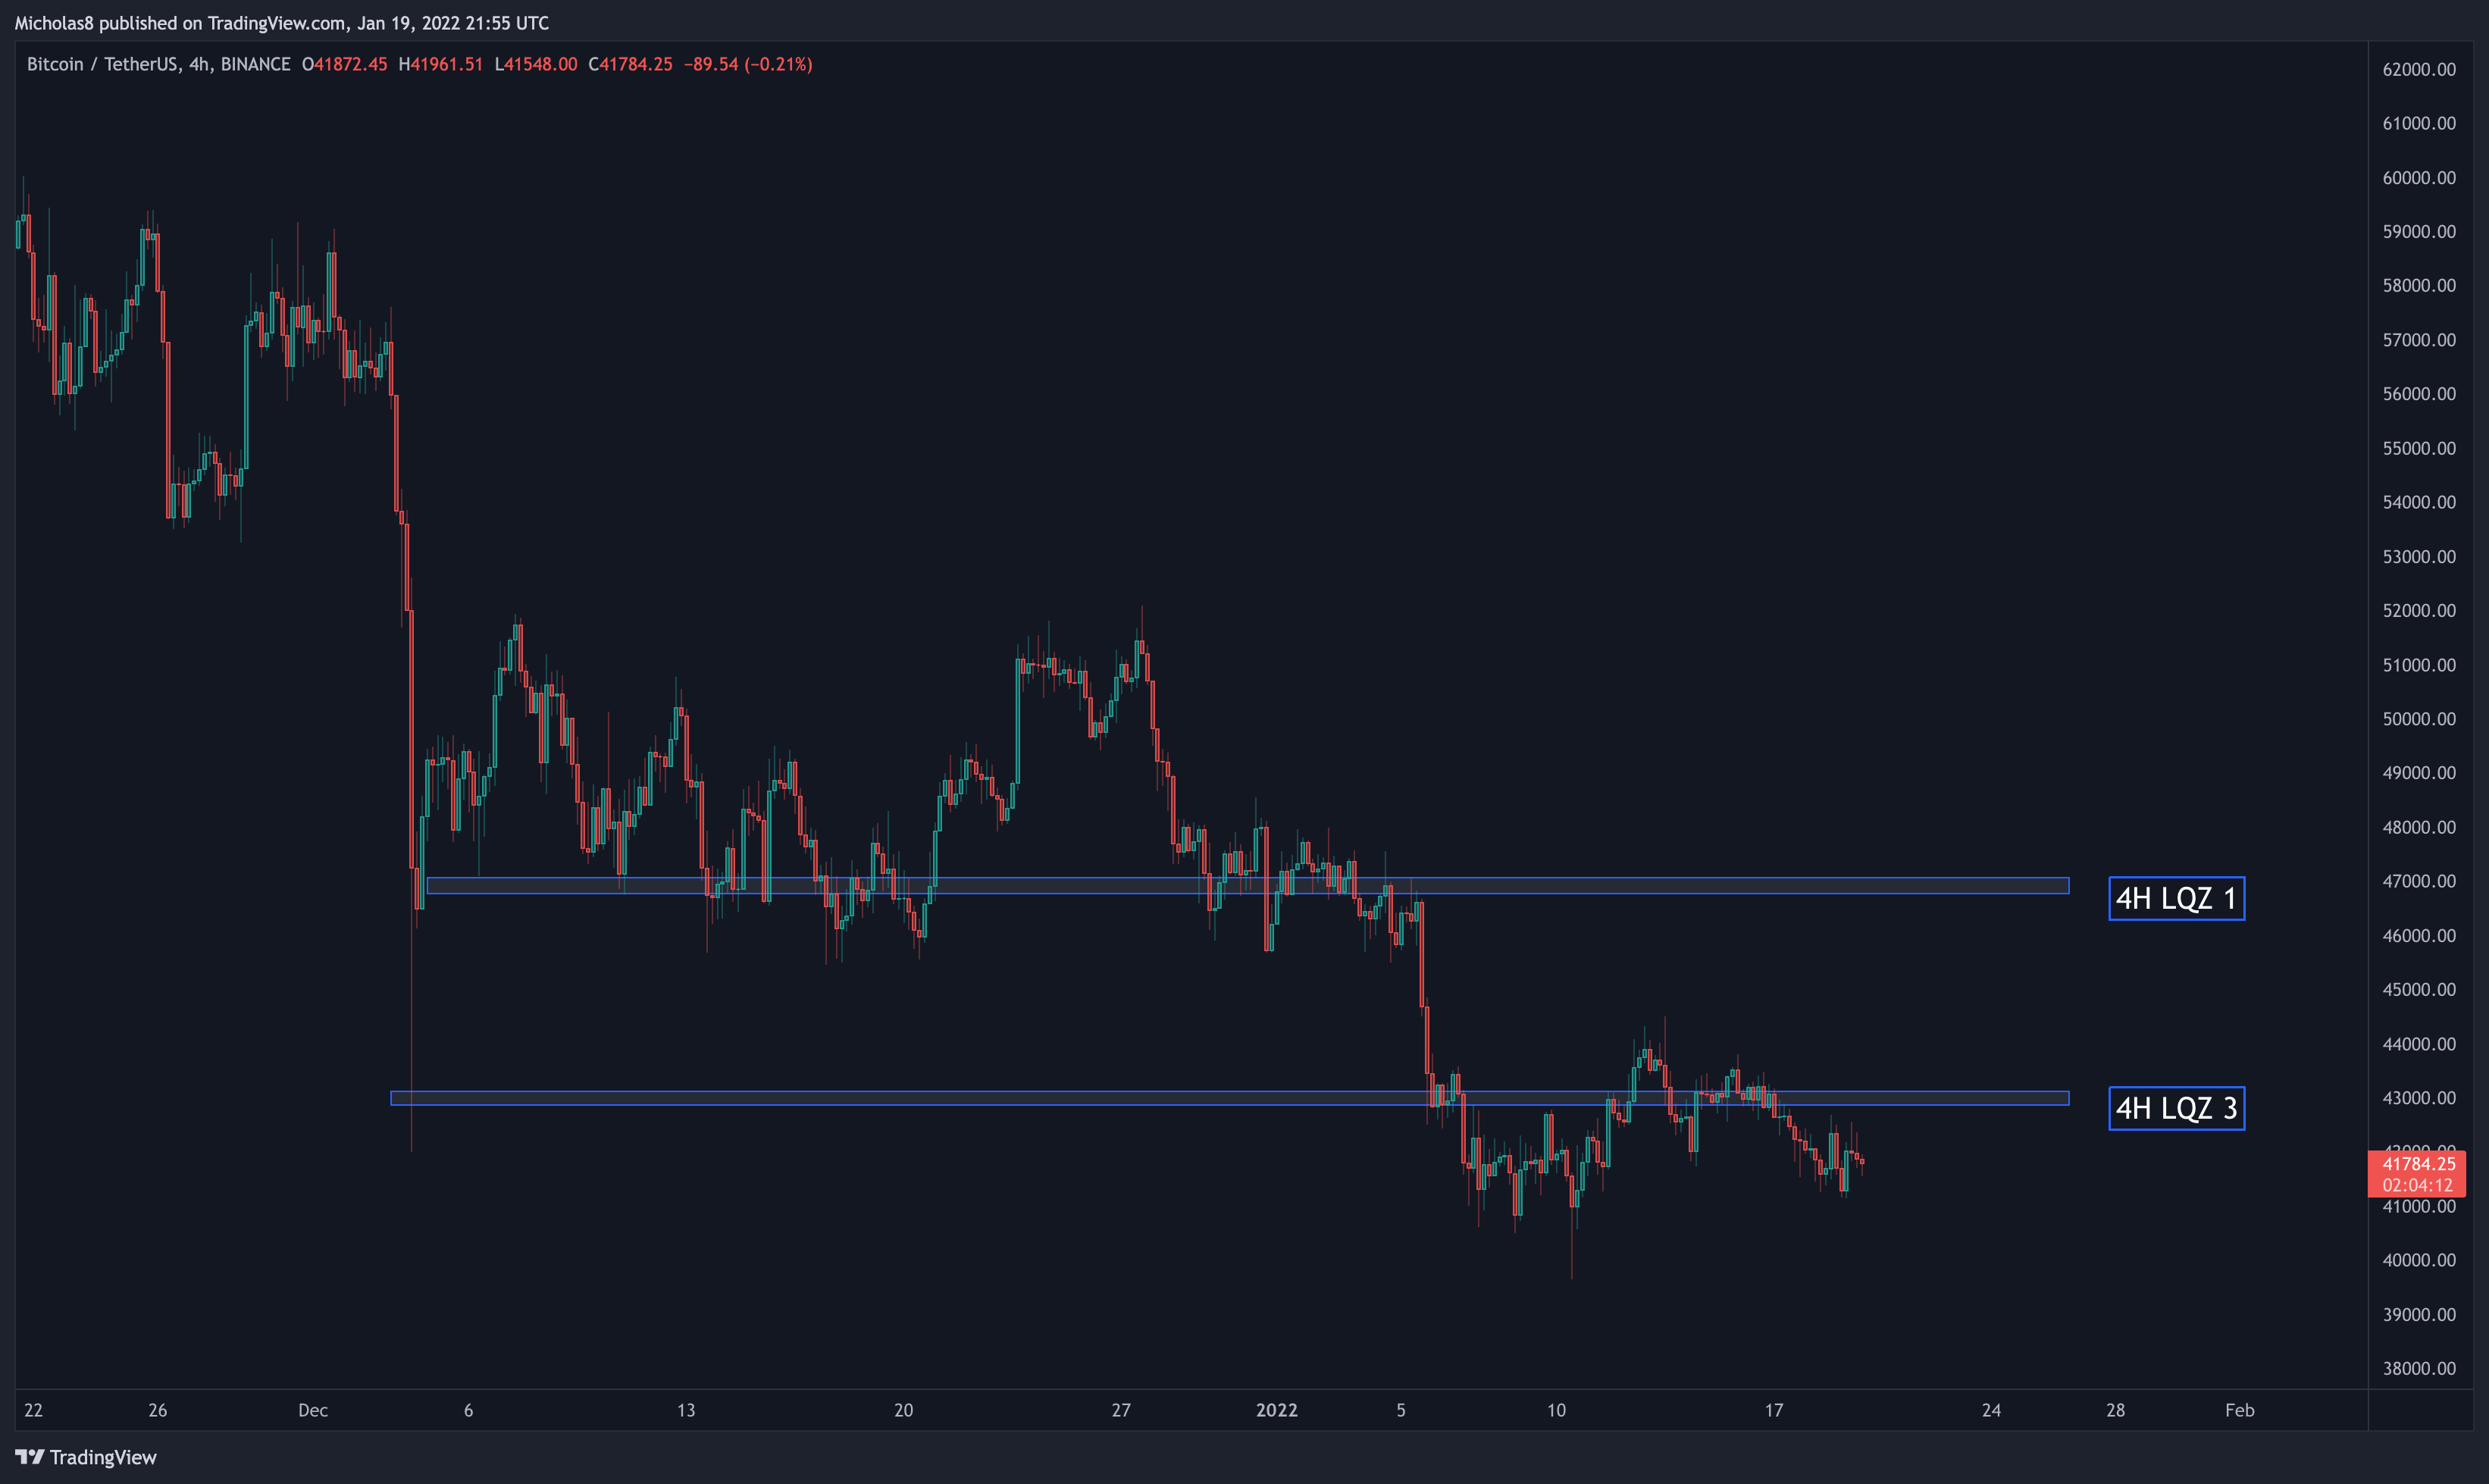
Zone 1: Bitcoin continues to trade below the LQZ sitting at 46.8k-47.1k.
Zone 3: The new LQZ at 42.9k-43.1k has been lost as support.
Implications: We may see this serve as resistance moving forward.
EMA Ribbon
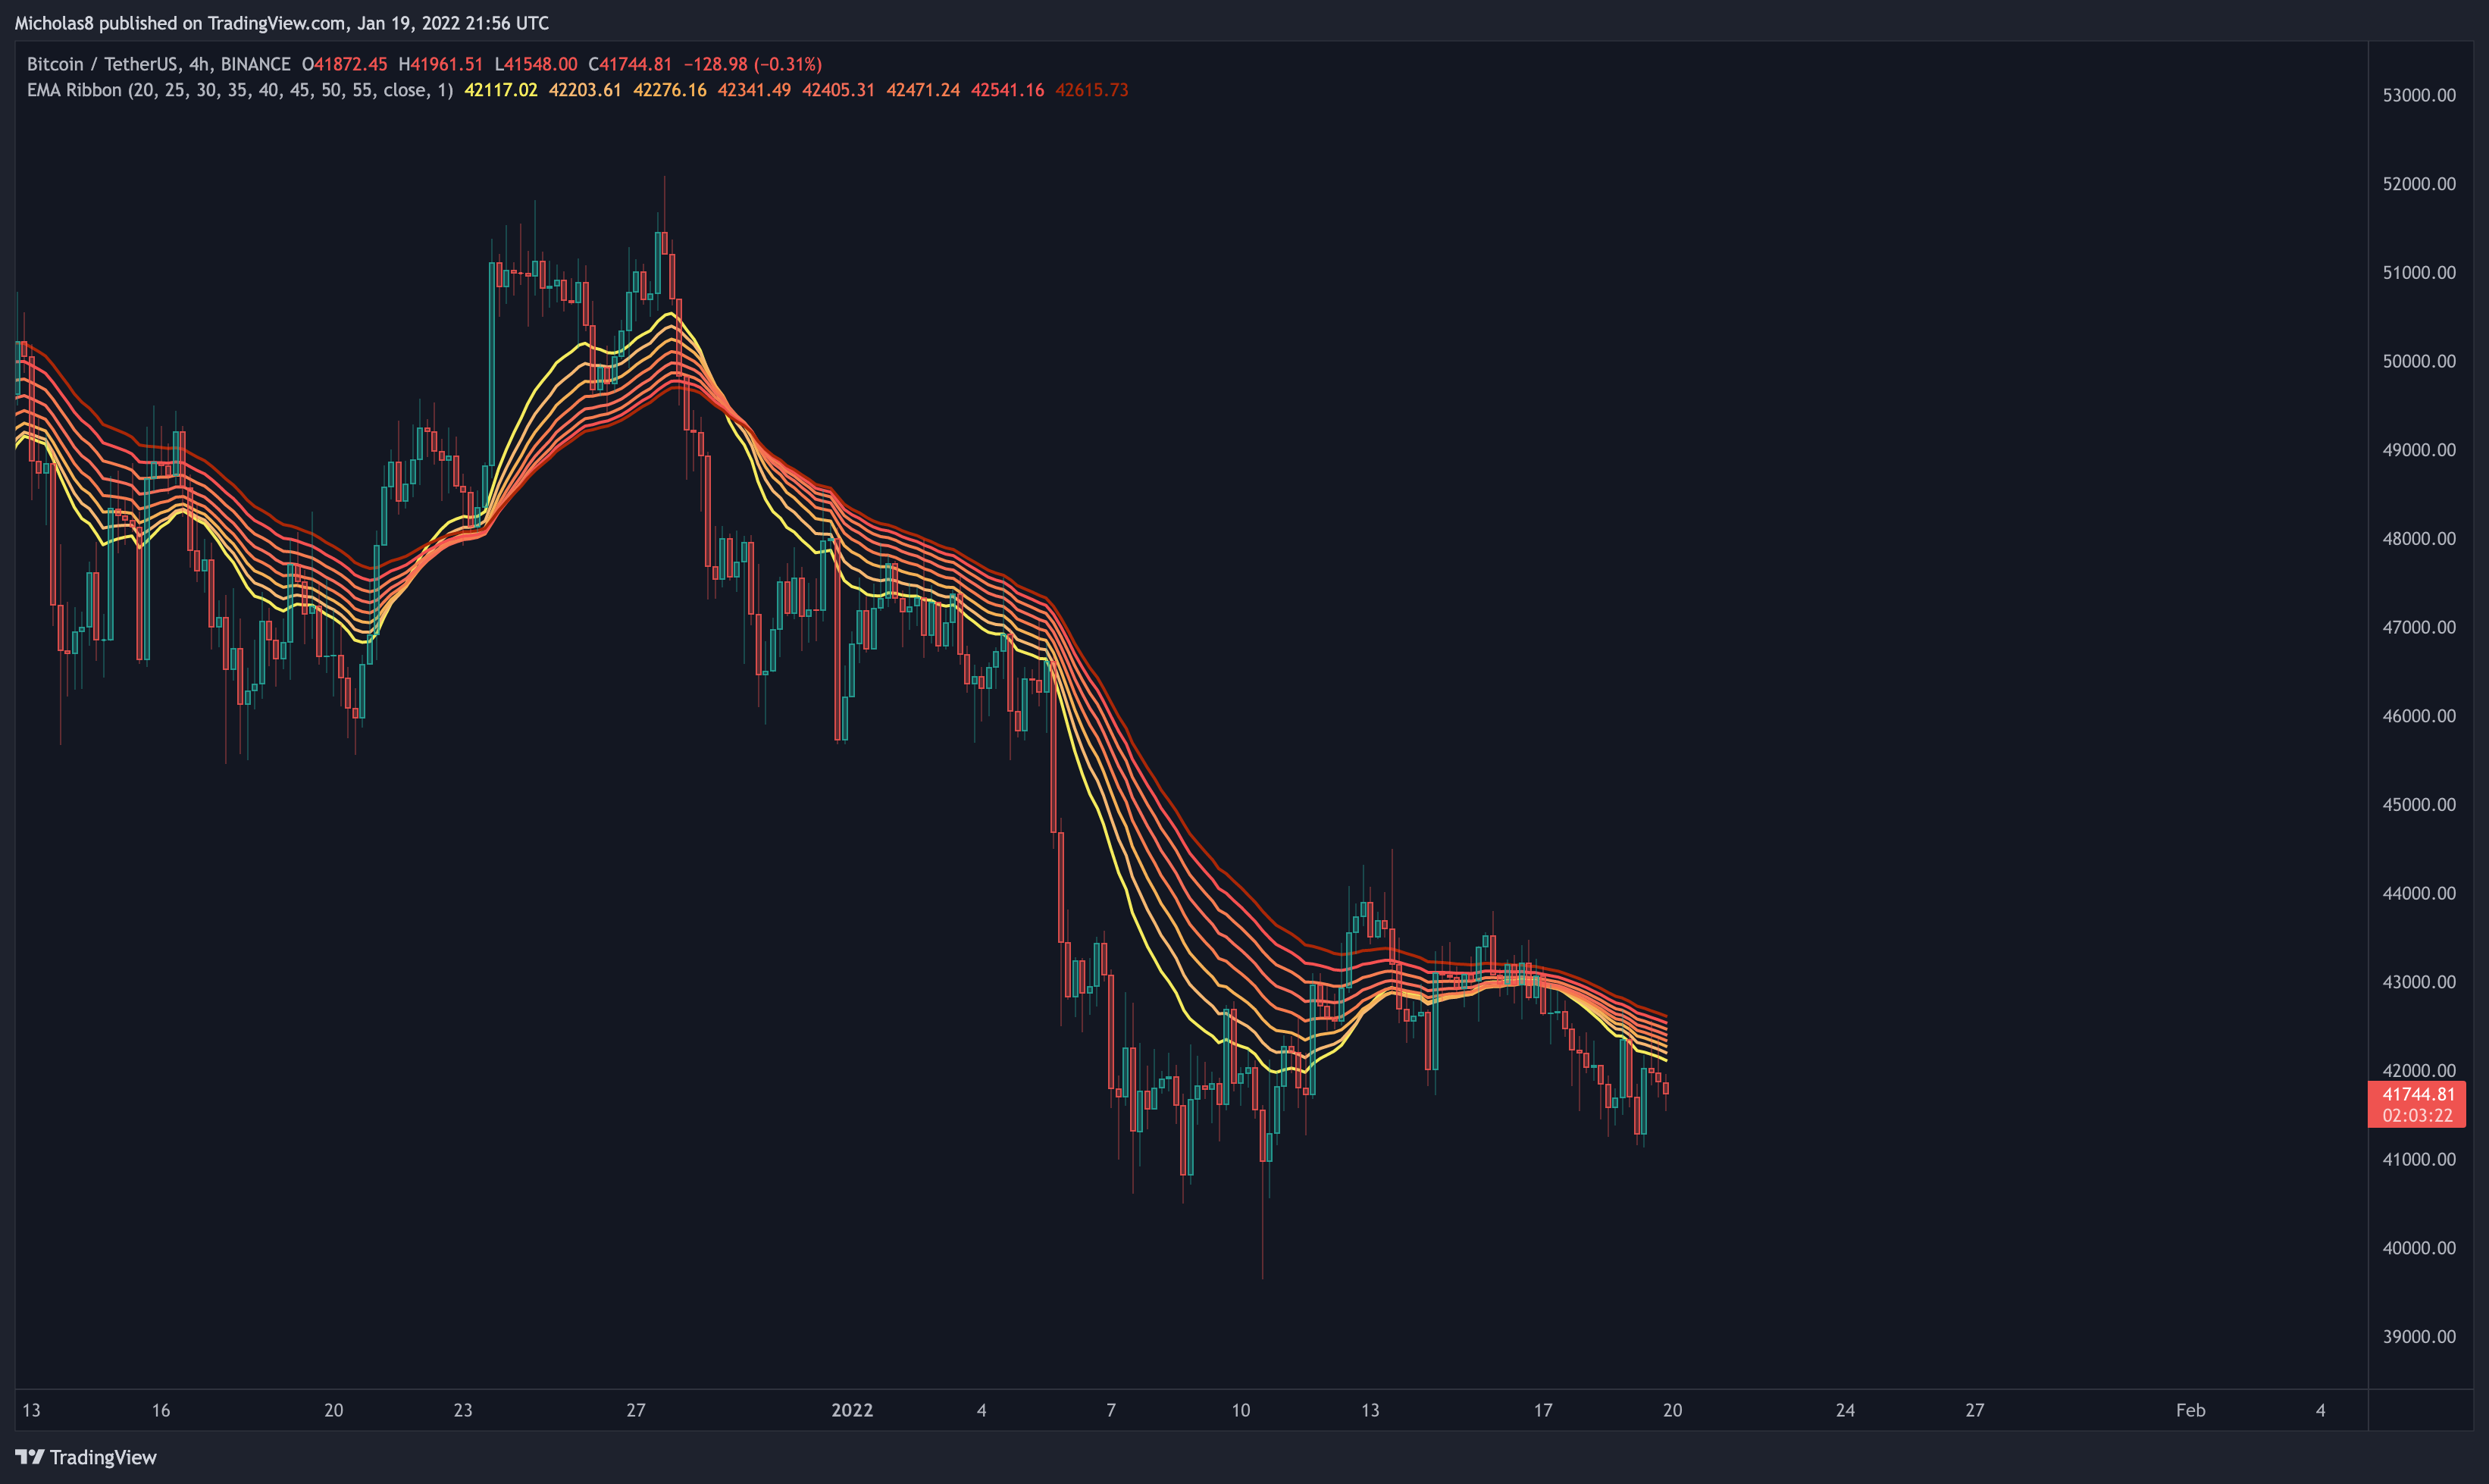
Bitcoin has lost the EMA ribbon as support in this timeframe.
Implication: This may serve as resistance moving forward.
What is an EMA ribbon? A 'ribbon' of EMAs that together indicate bearish and bullish momentum in the market. When an asset is trading is above the ribbon, it's considered bullish. Vice-versa.
Simple Moving Averages (SMA): 20, 50 and 200
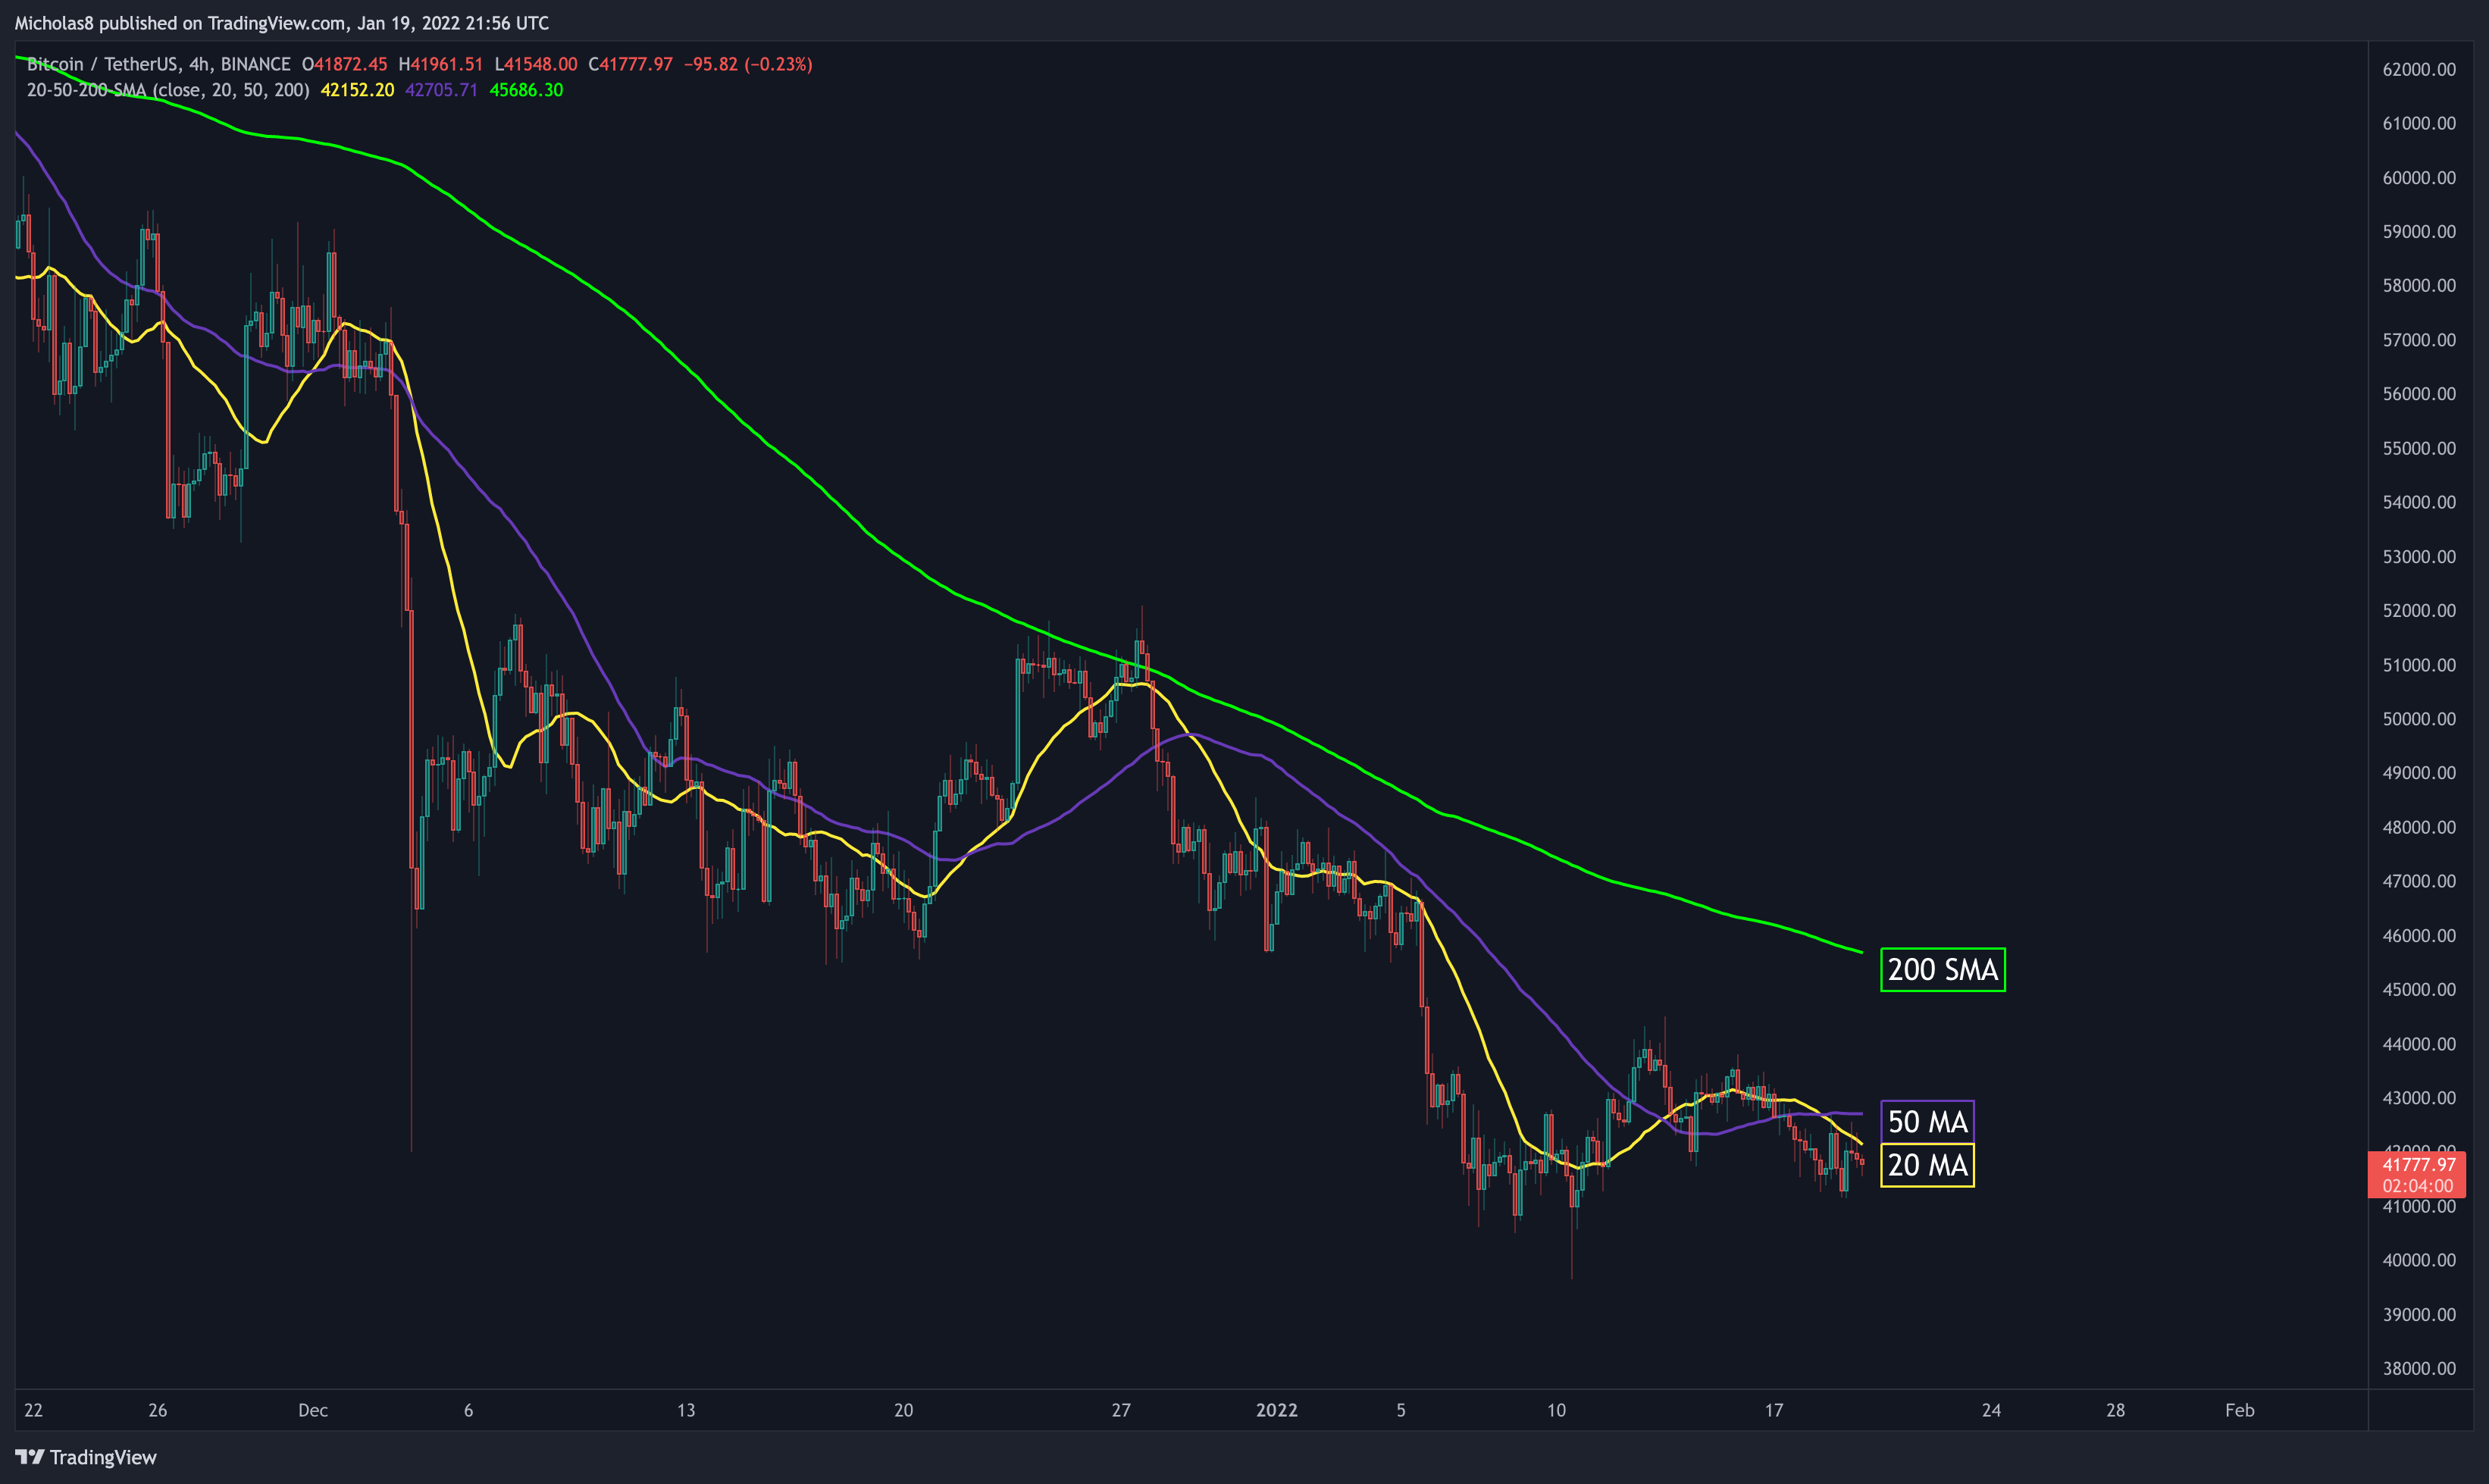
Bitcoin continues to trade below the 200 SMA, and has fallen back below the 20 and 50 SMAs.
Implication: They may serve as resistance moving forward.
1H Timeframe
EMA Ribbon
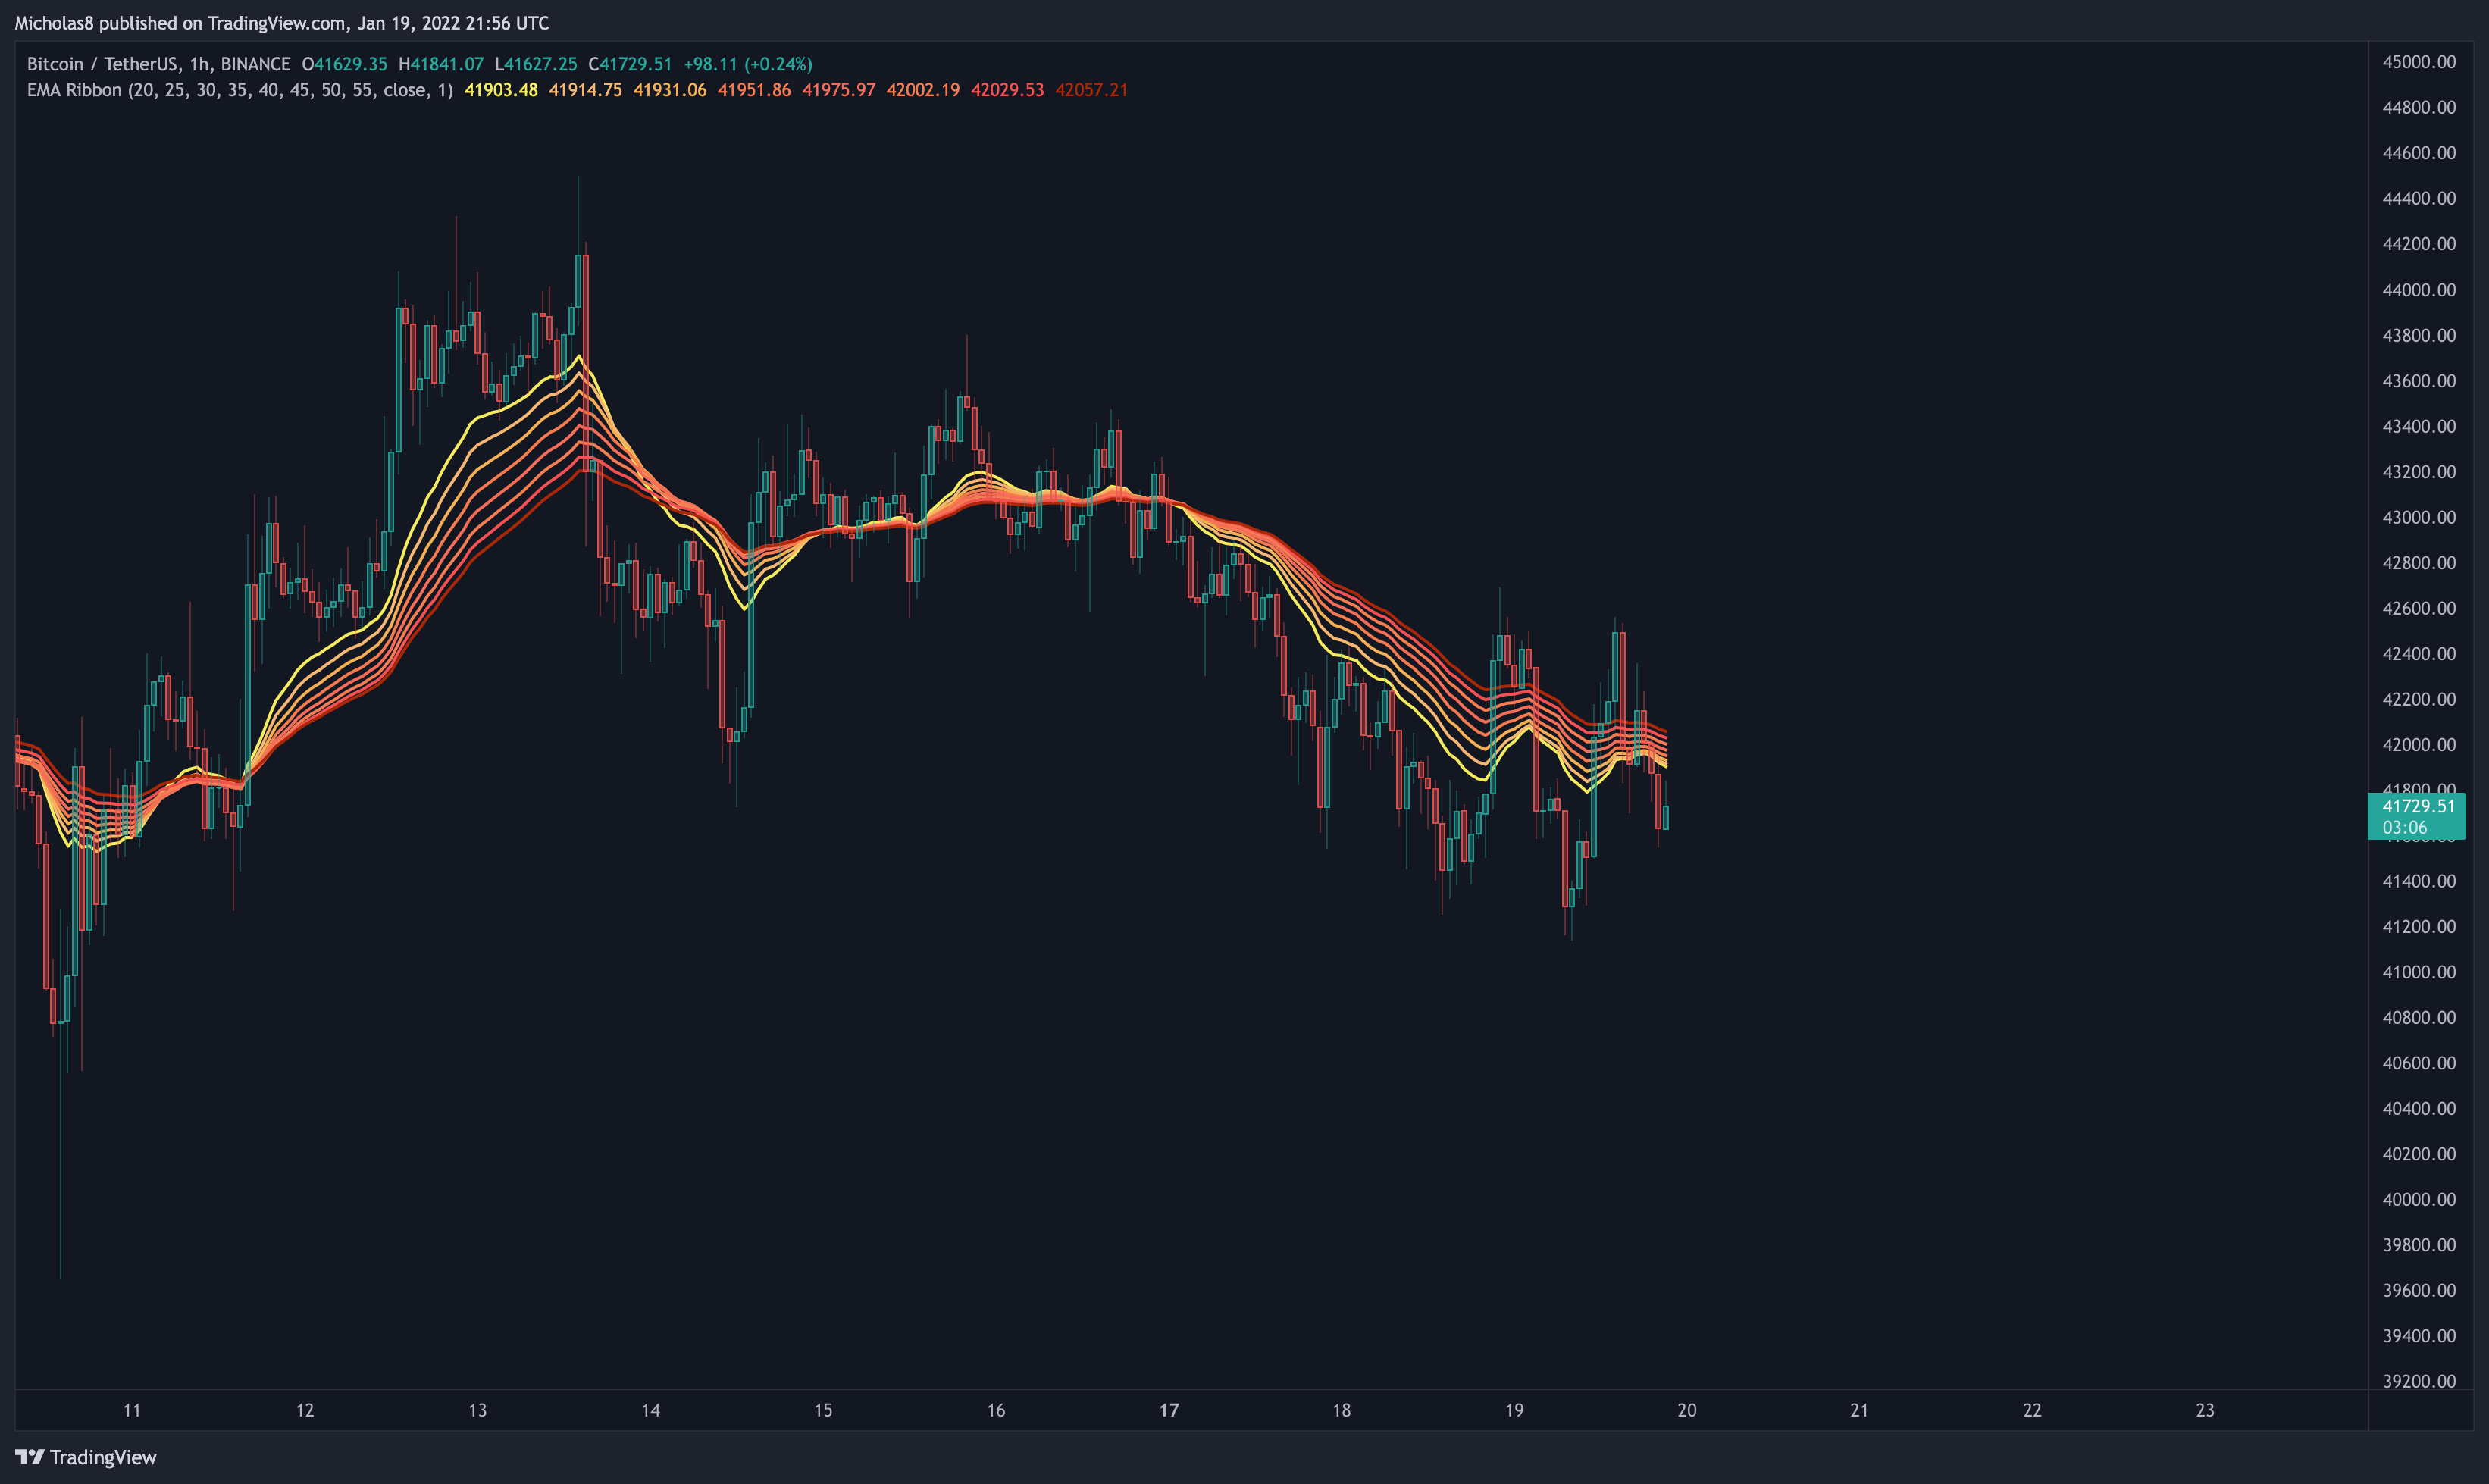
Bitcoin has lost the EMA ribbon as support in this timeframe.
Implication: This may serve as resistance moving forward.
What is an EMA ribbon? A 'ribbon' of EMAs that together indicate bearish and bullish momentum in the market. When an asset is trading is above the ribbon, it's considered bullish. Vice-versa.
Divergences
Divergences
Exaggerated Hidden Bearish Divergence
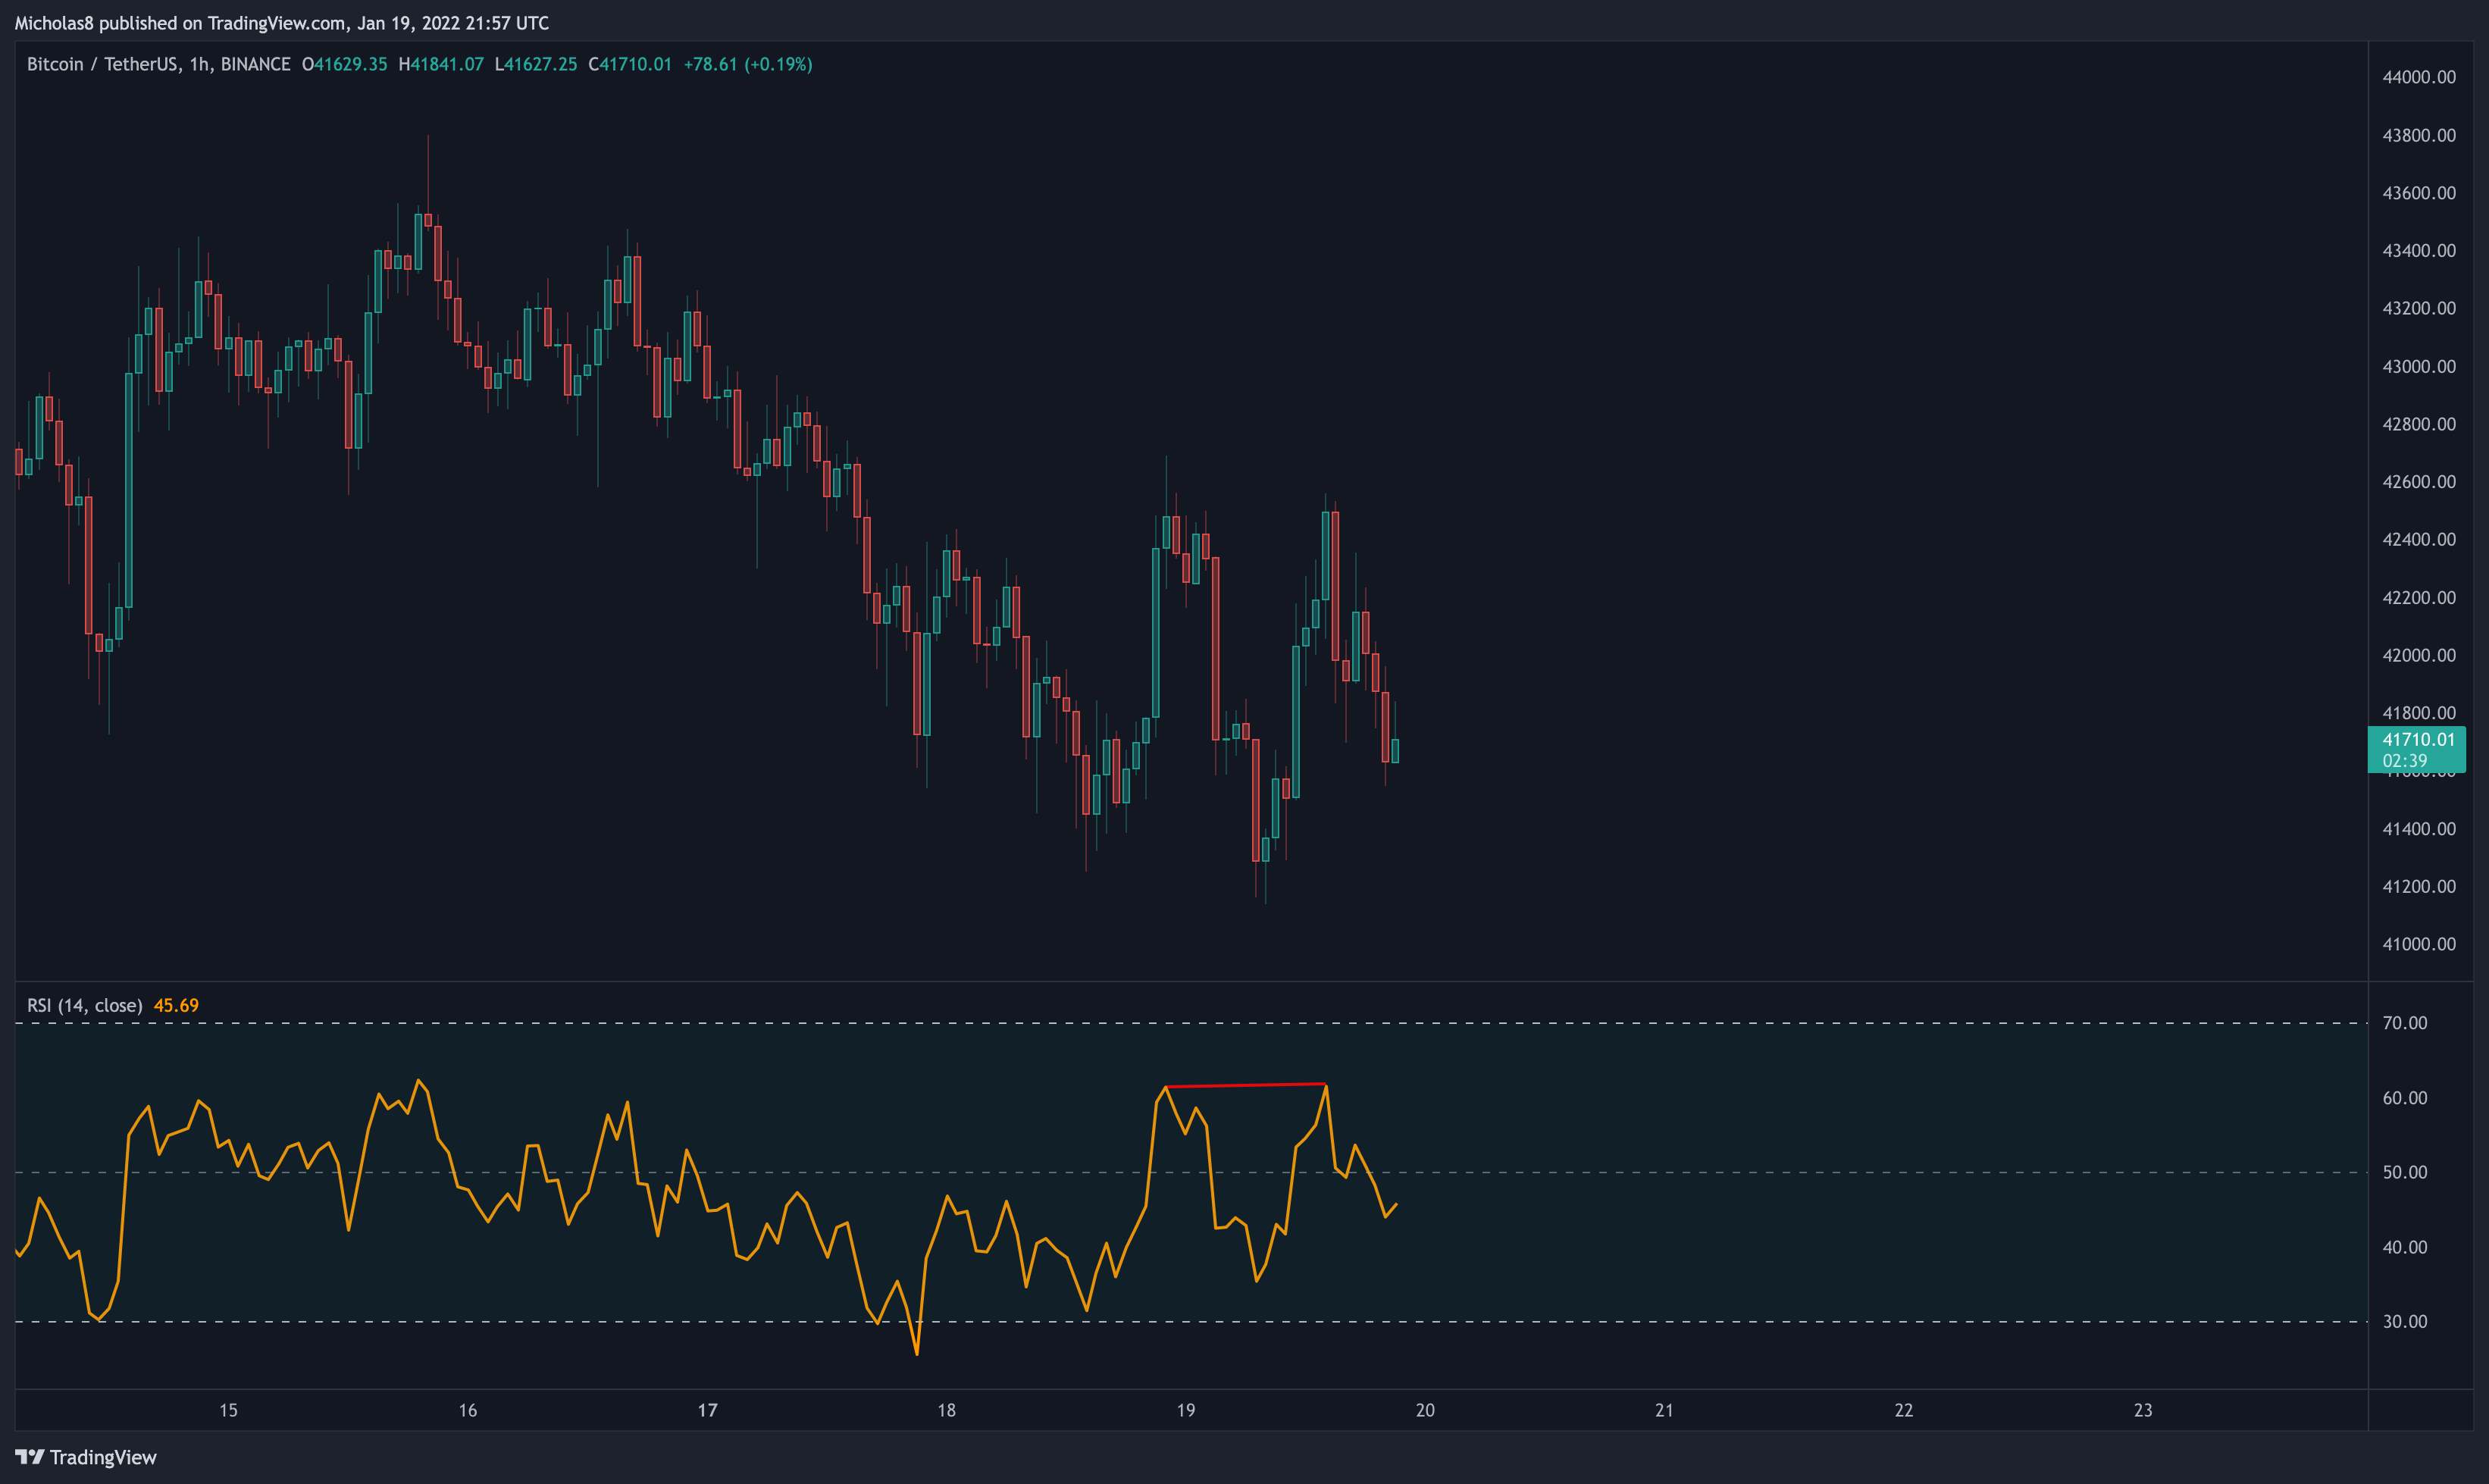
Bitcoin has a lower high in price, with a similar high in the RSI. This is an exaggerated hidden bearish divergence, which signals a possible trend continuation down.
Note: Exaggerated divergences are the weaker type of divergence.
Invalidation: Higher high in price and in the RSI.
CME GAPS
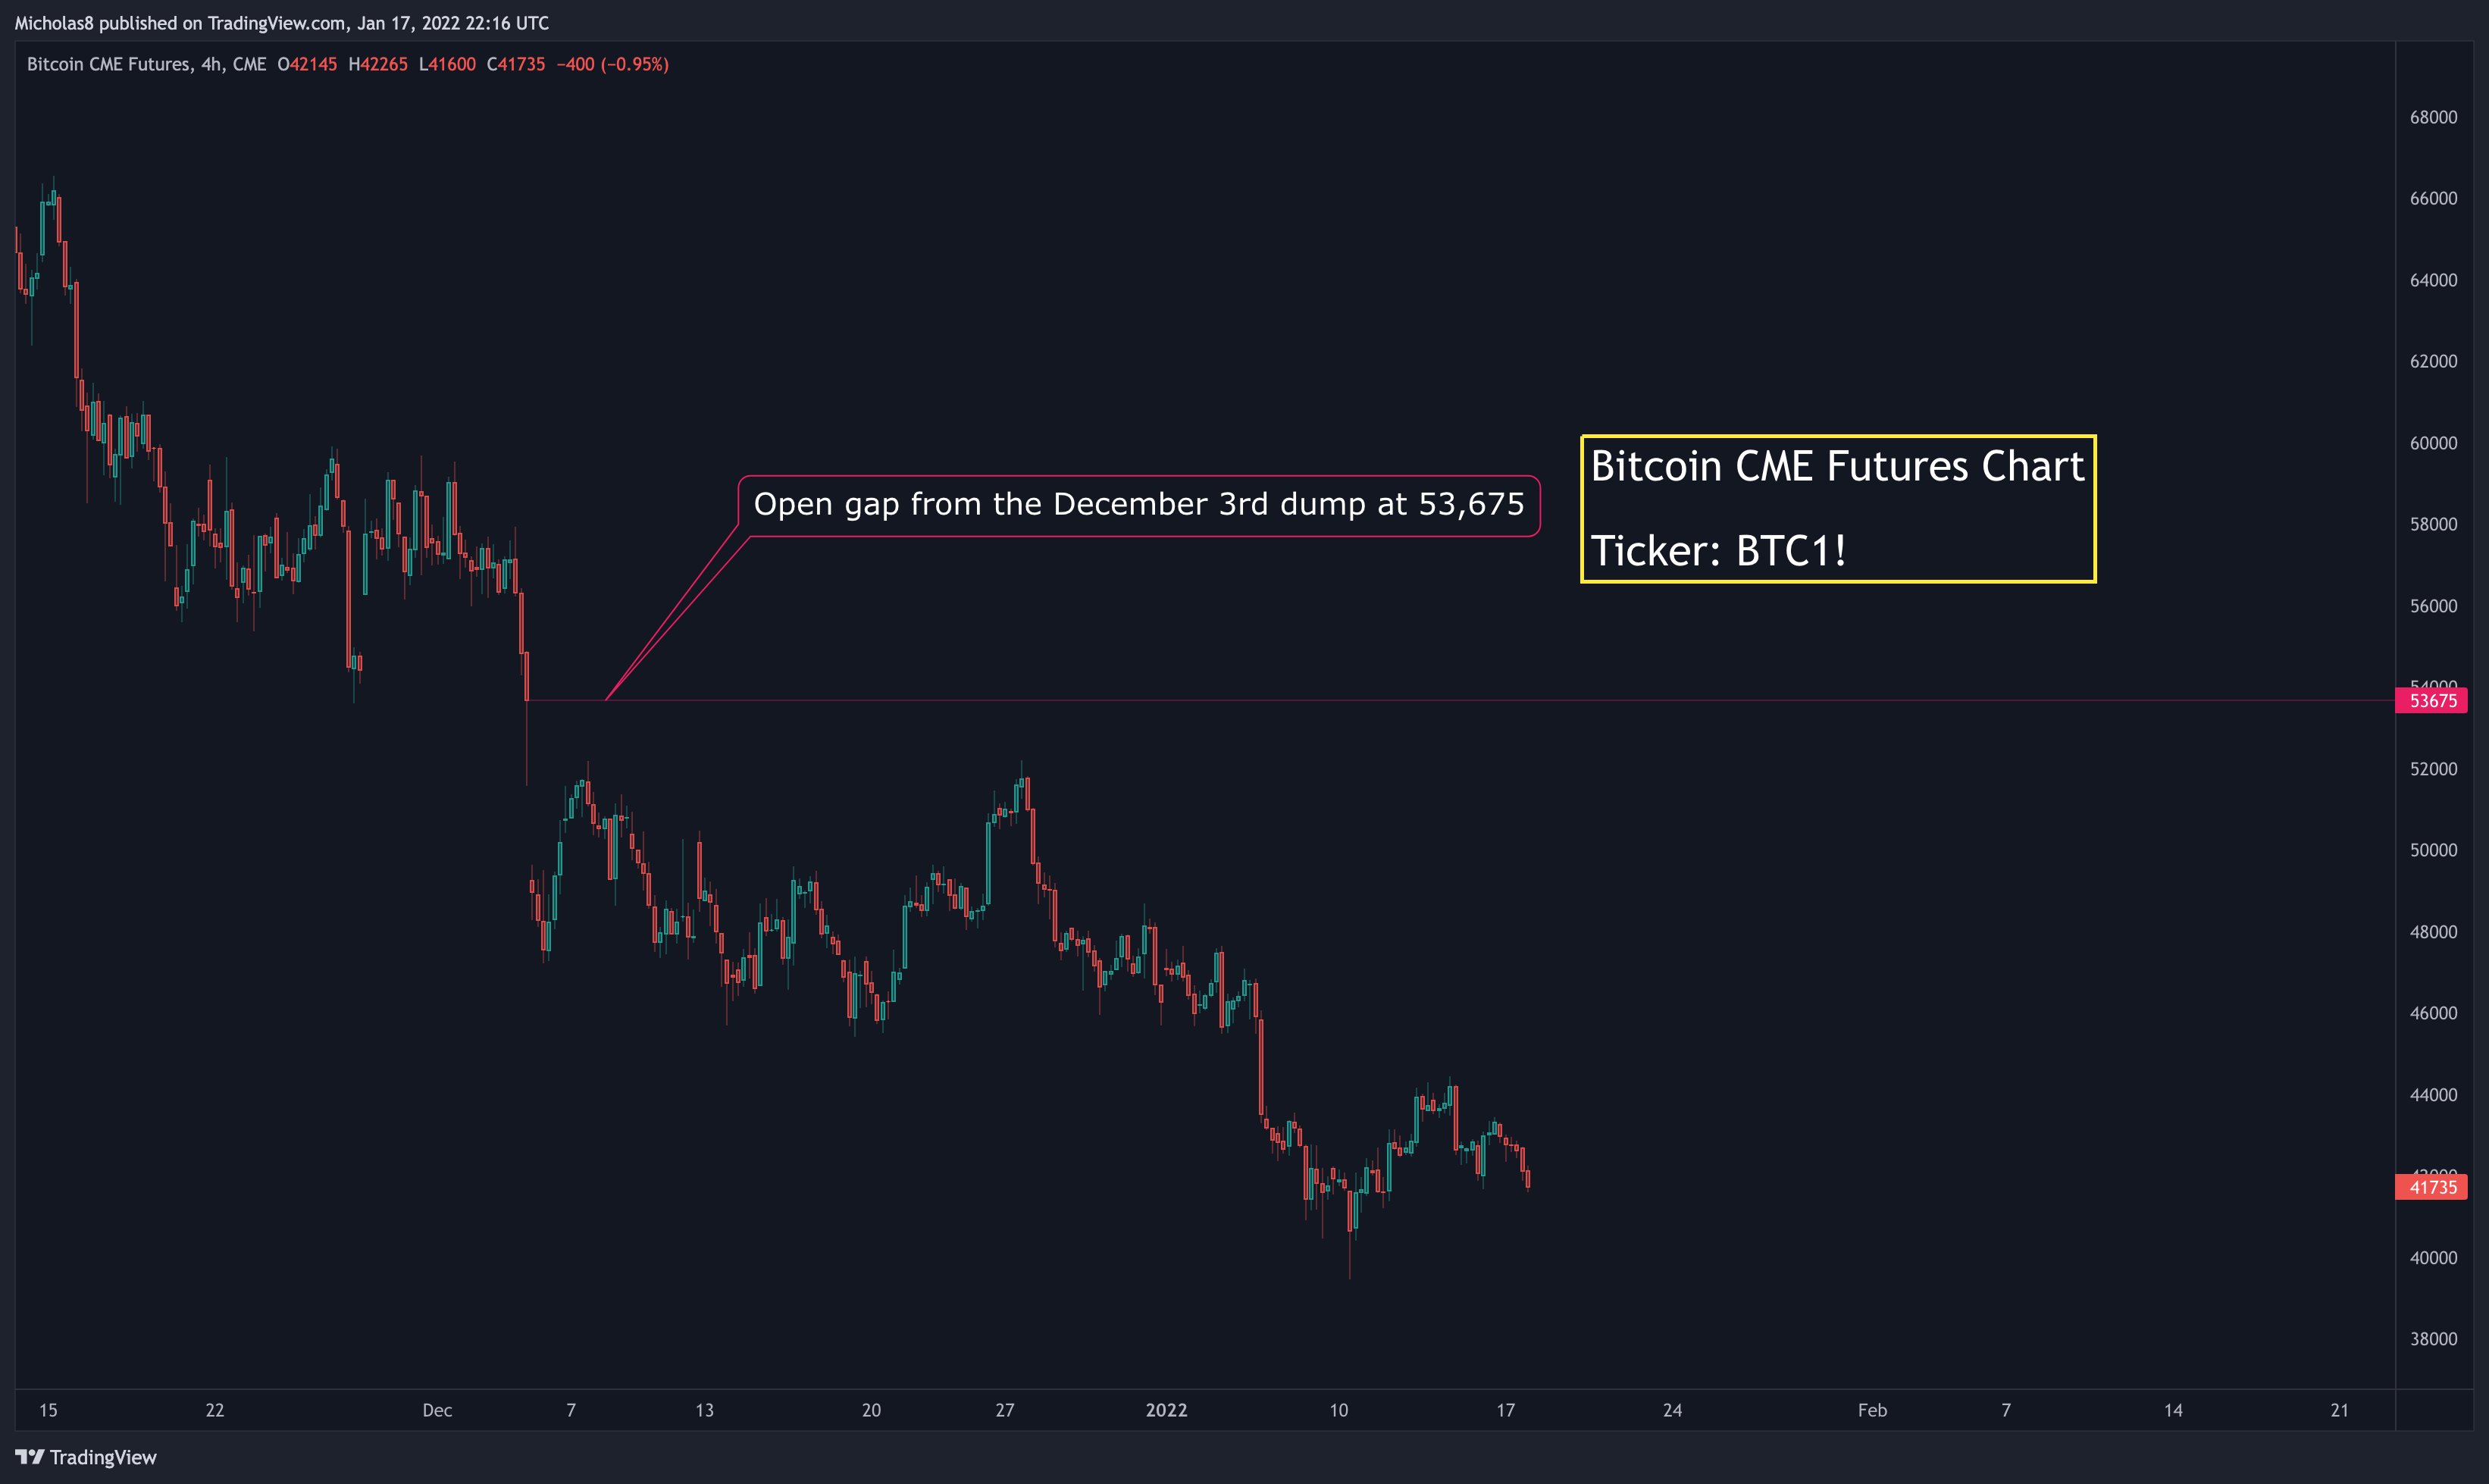
The gap below us at 32,480 is still open. Although not all gaps fill, they do tend to, which is why I'm still including this gap as something to be aware of.
GAP: 53,675 – As mentioned when the gap first formed, this is a "breakaway gap". These are gaps that form when there's a dramatic shift in market structure. Typically these gaps take much longer to fill than the normal gaps. This is comparable to the gap at 32,480.
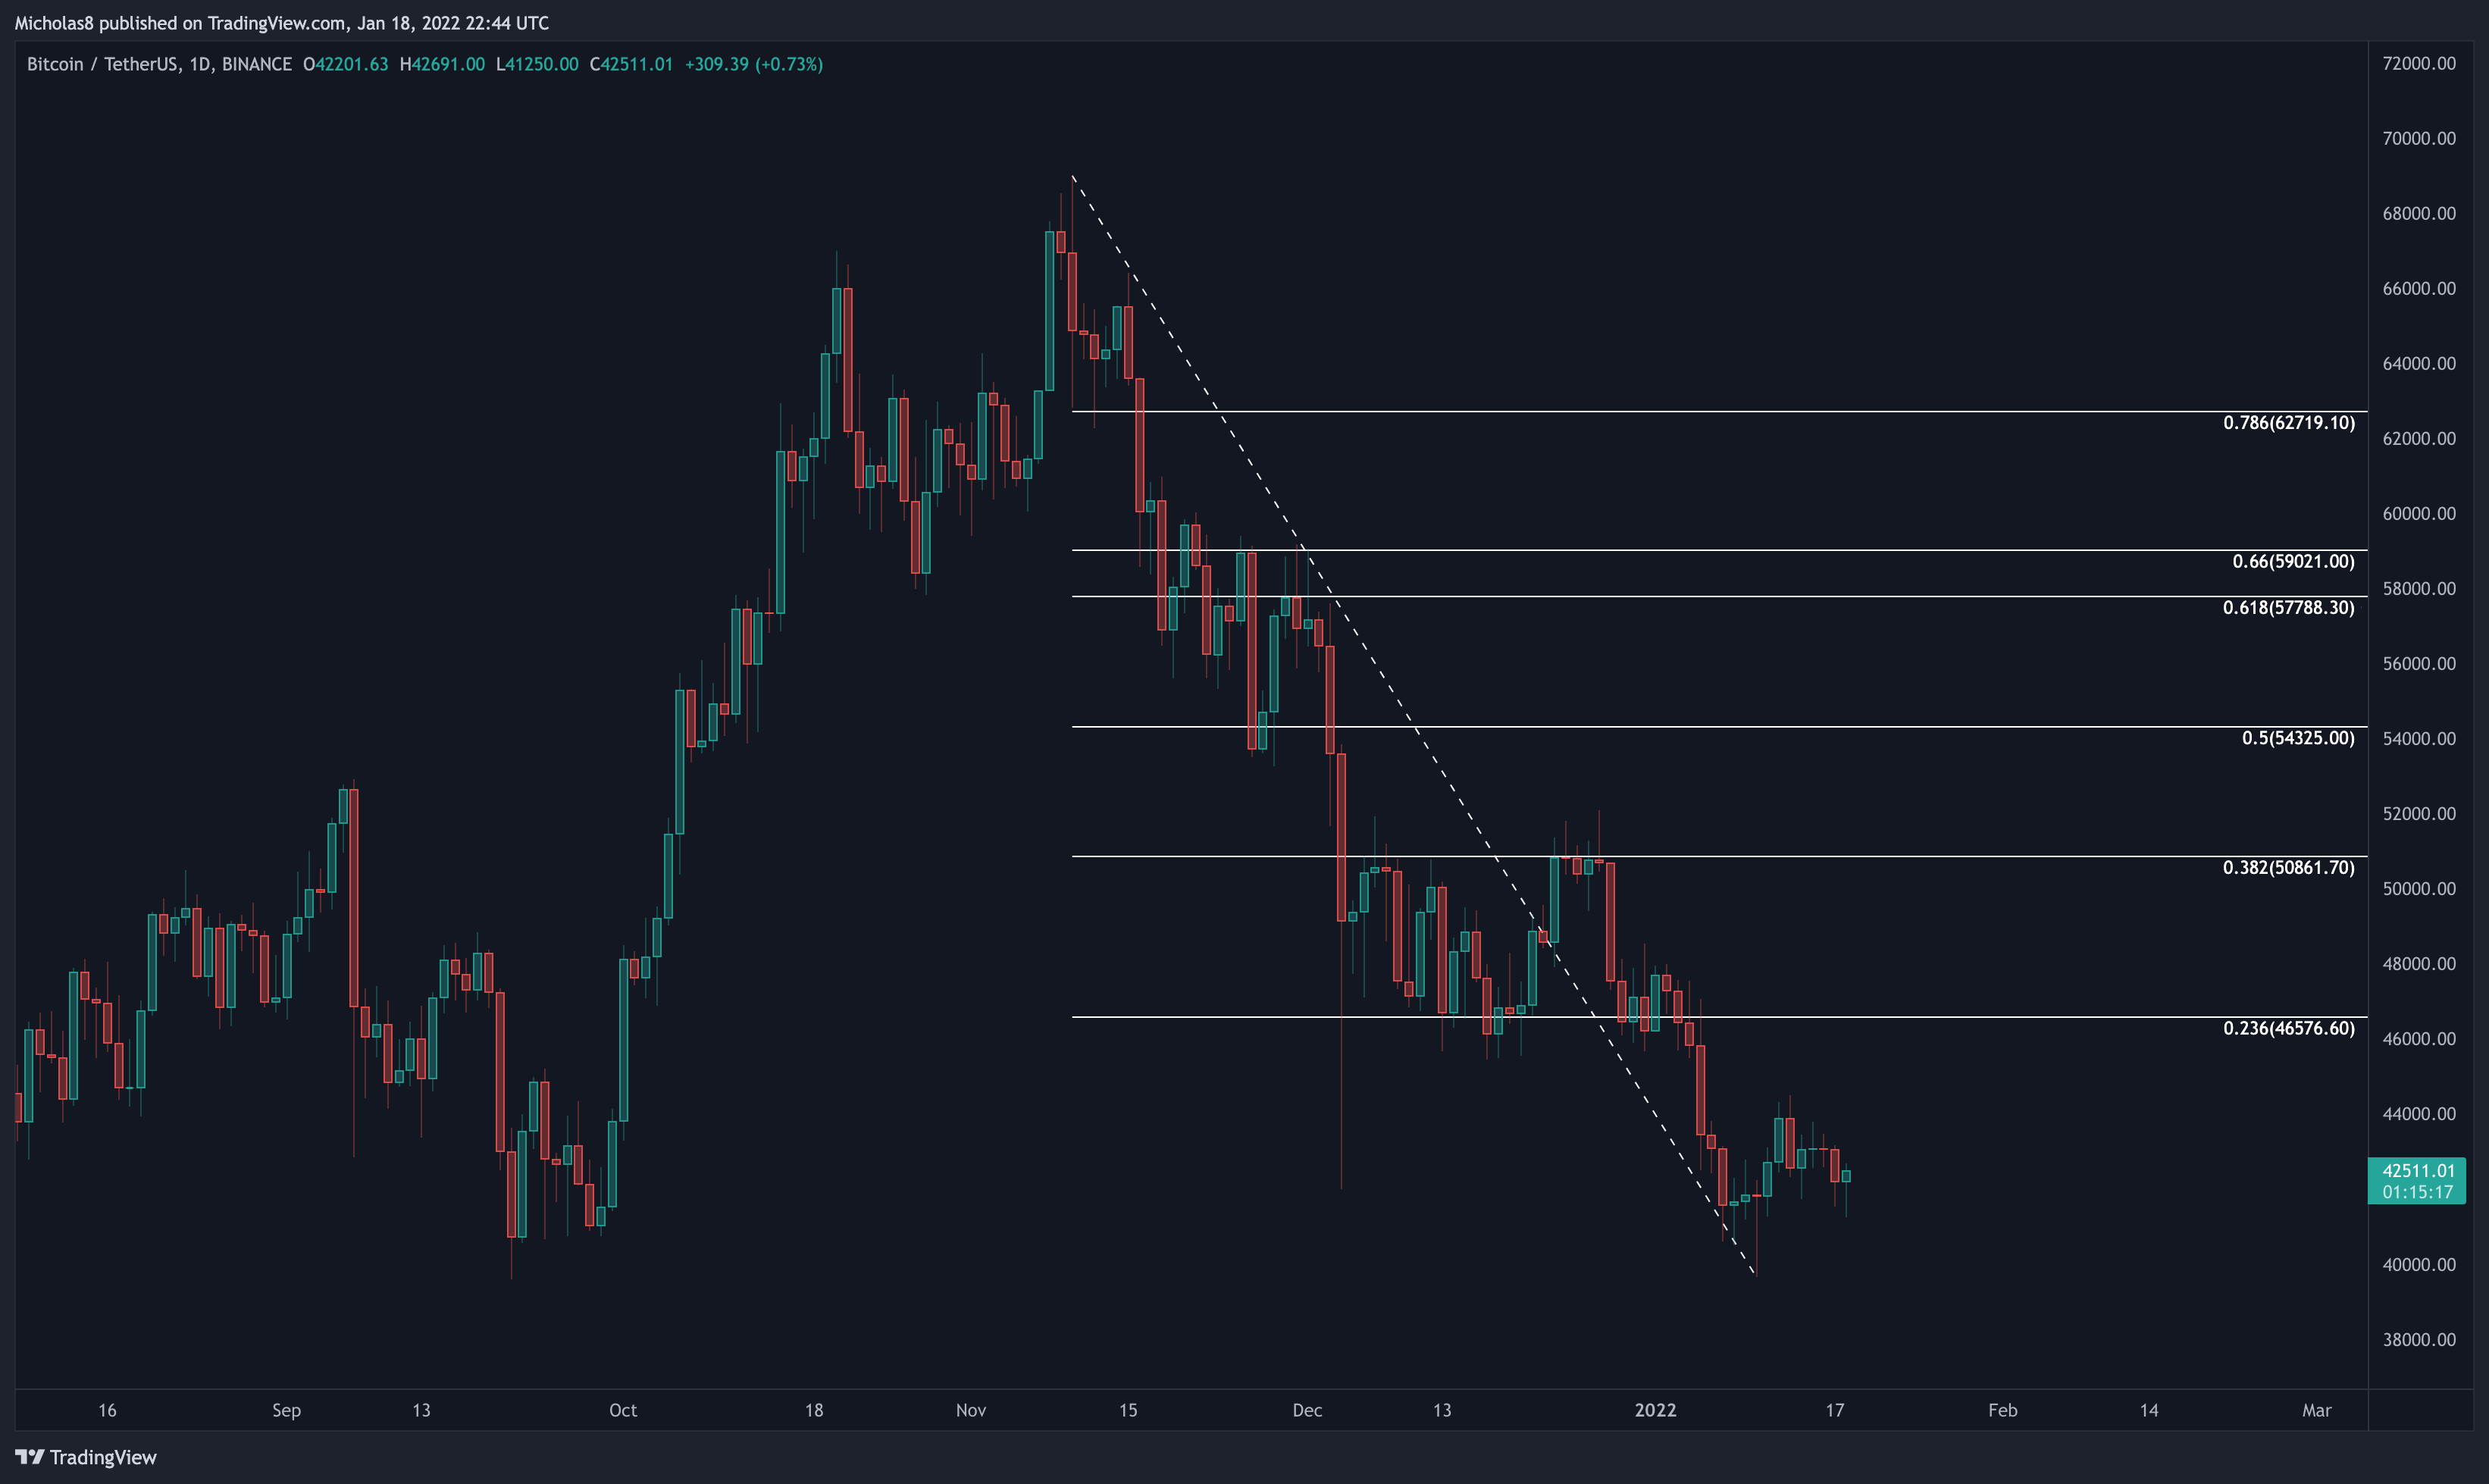
Key Levels
Daily Timeframe

29790
33380
35910
38205
39245
40735
41565
42205
43900
44865
46255
46700
47140
47720
48290
49490
50840
50590
51295
51755
52665
53950
54340
54720
55315
56245
56900
57775
58050
58415
58865
Fibonacci Levels
4H Timeframe
39970
40755
41645
42845
44215
45310
46745
48145
48845
49755
50380
51000
51885
52190
52829
53235
53865
54885
55473
Fibonacci levels
1-hour Timeframe

39650
40610
41000
41200
42000
42430
42885
43100
43580
43815
44080
44500
45455
45900
46130
46585
47320
47920
48315
49190
Fibonacci levels
FINAL THOUGHTS
RECAP FROM THIS MORNING
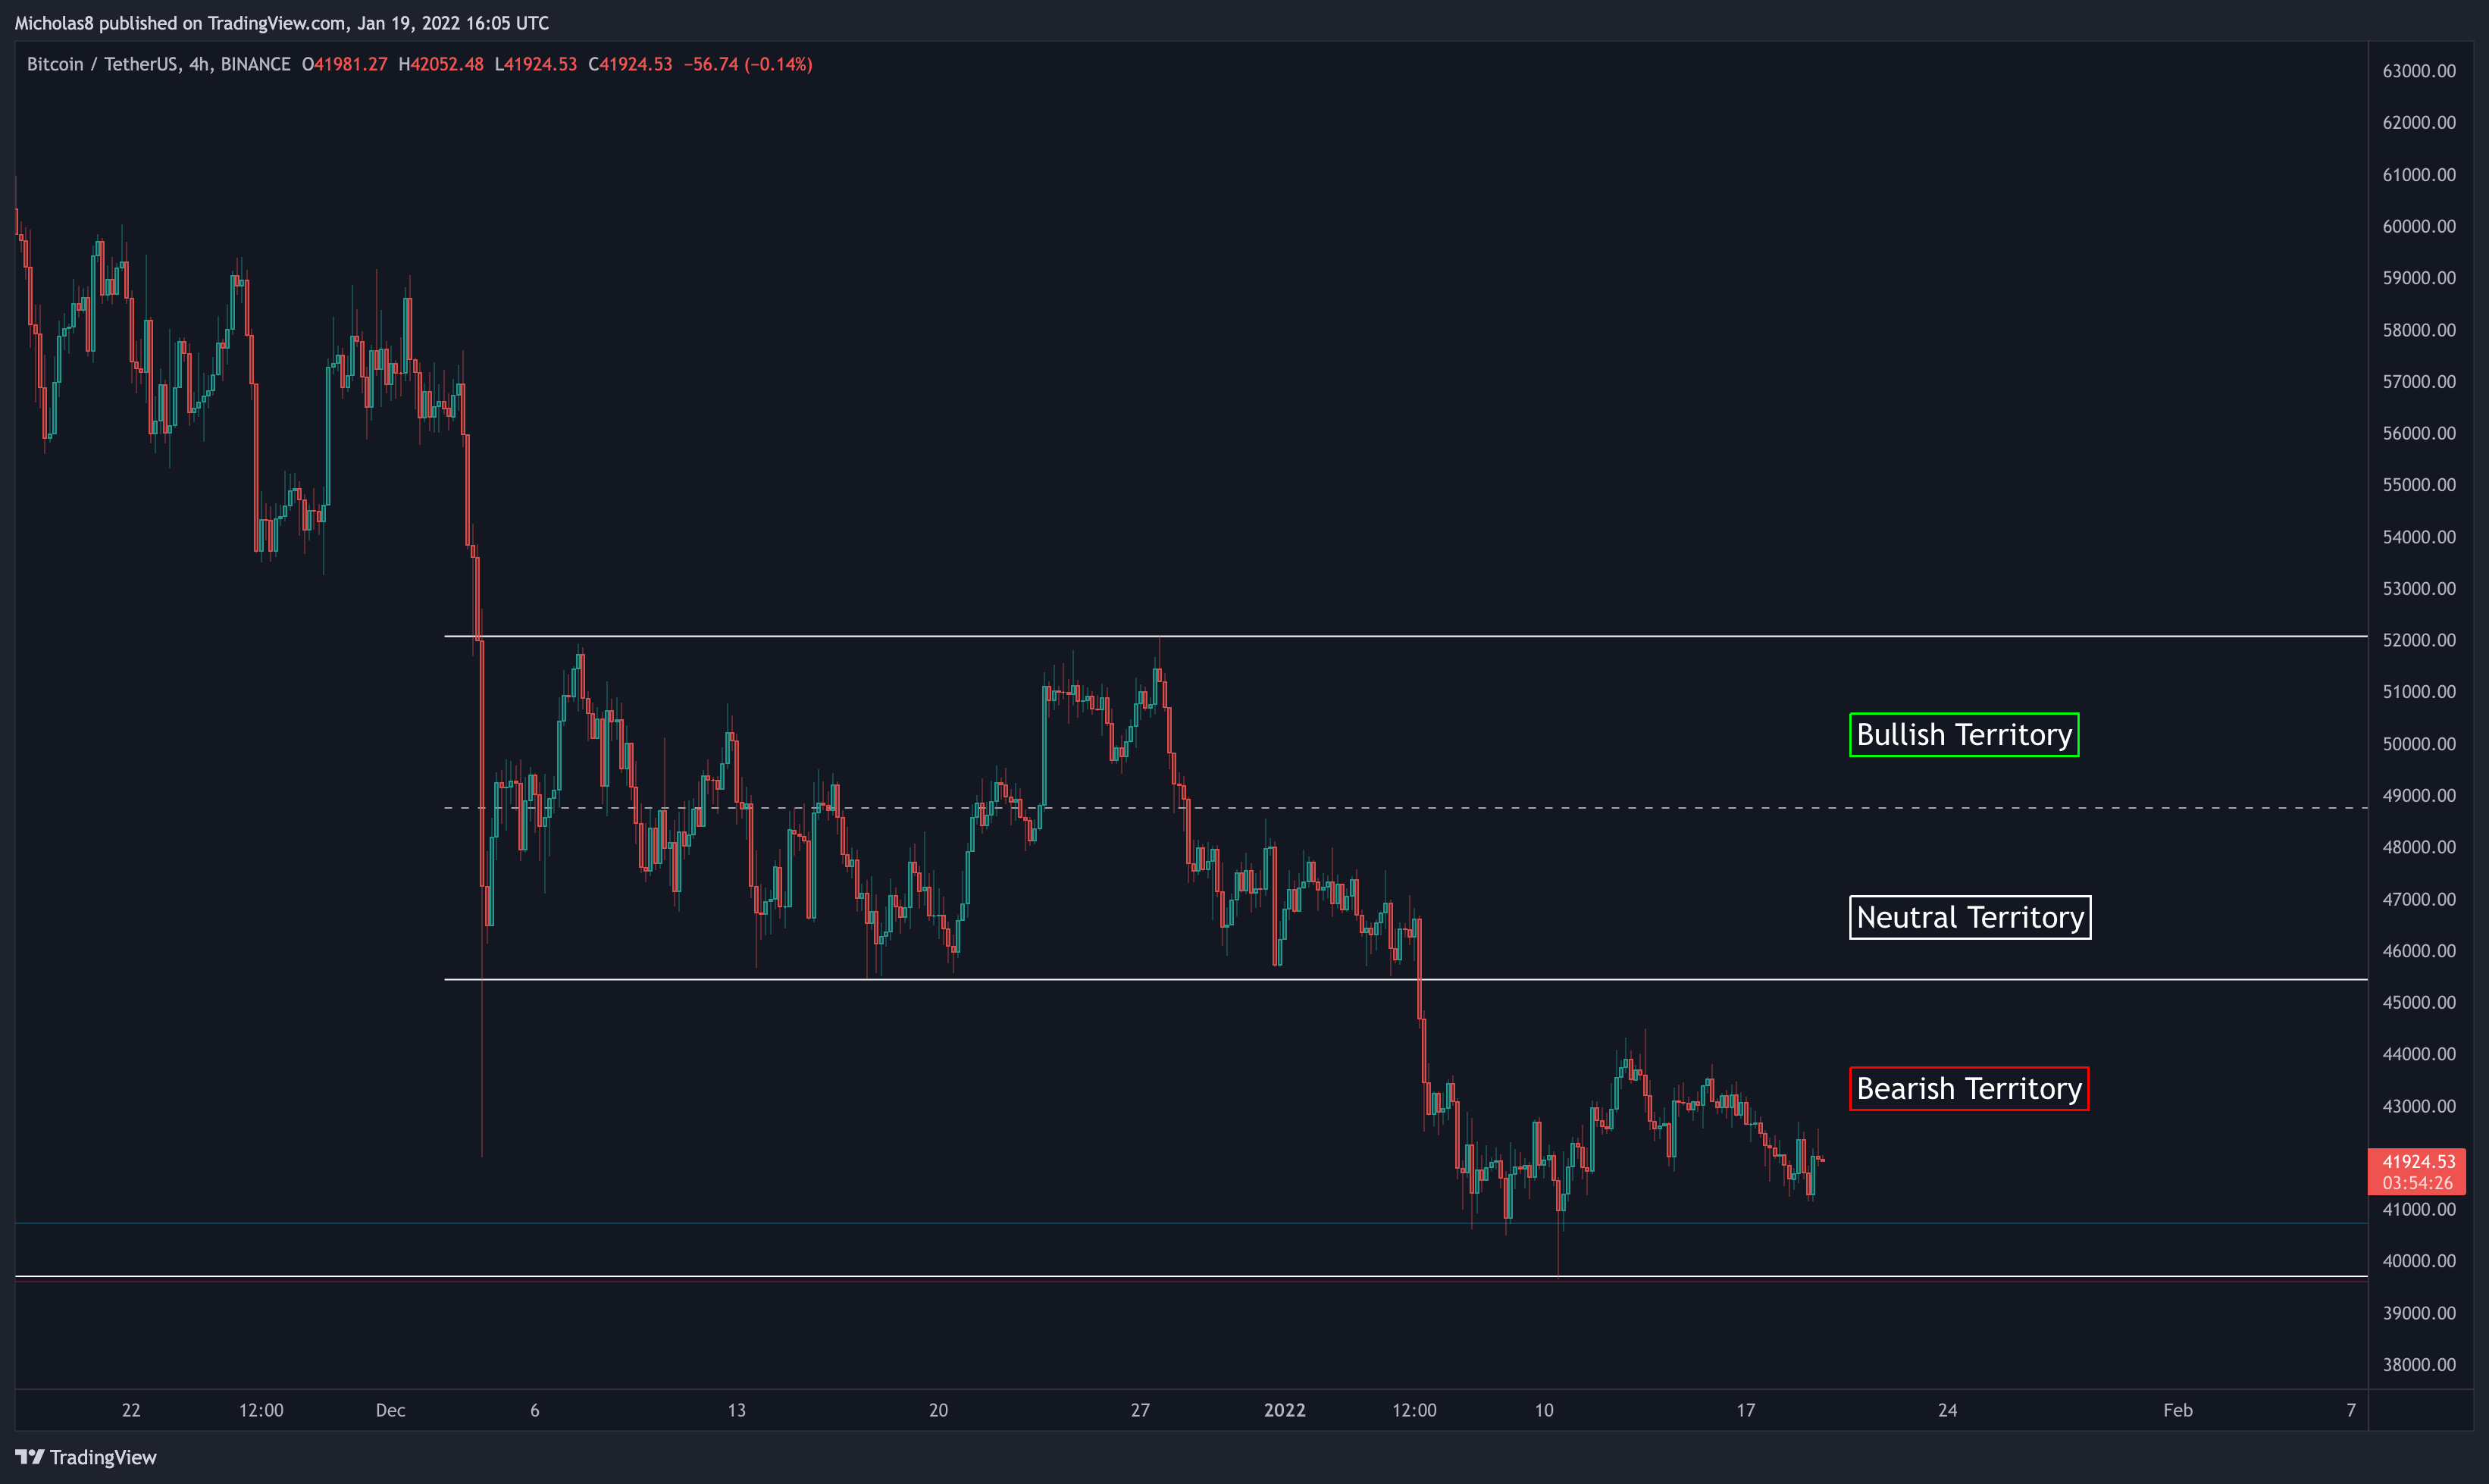
Bitcoin continues to trade within the Bearish Territory.
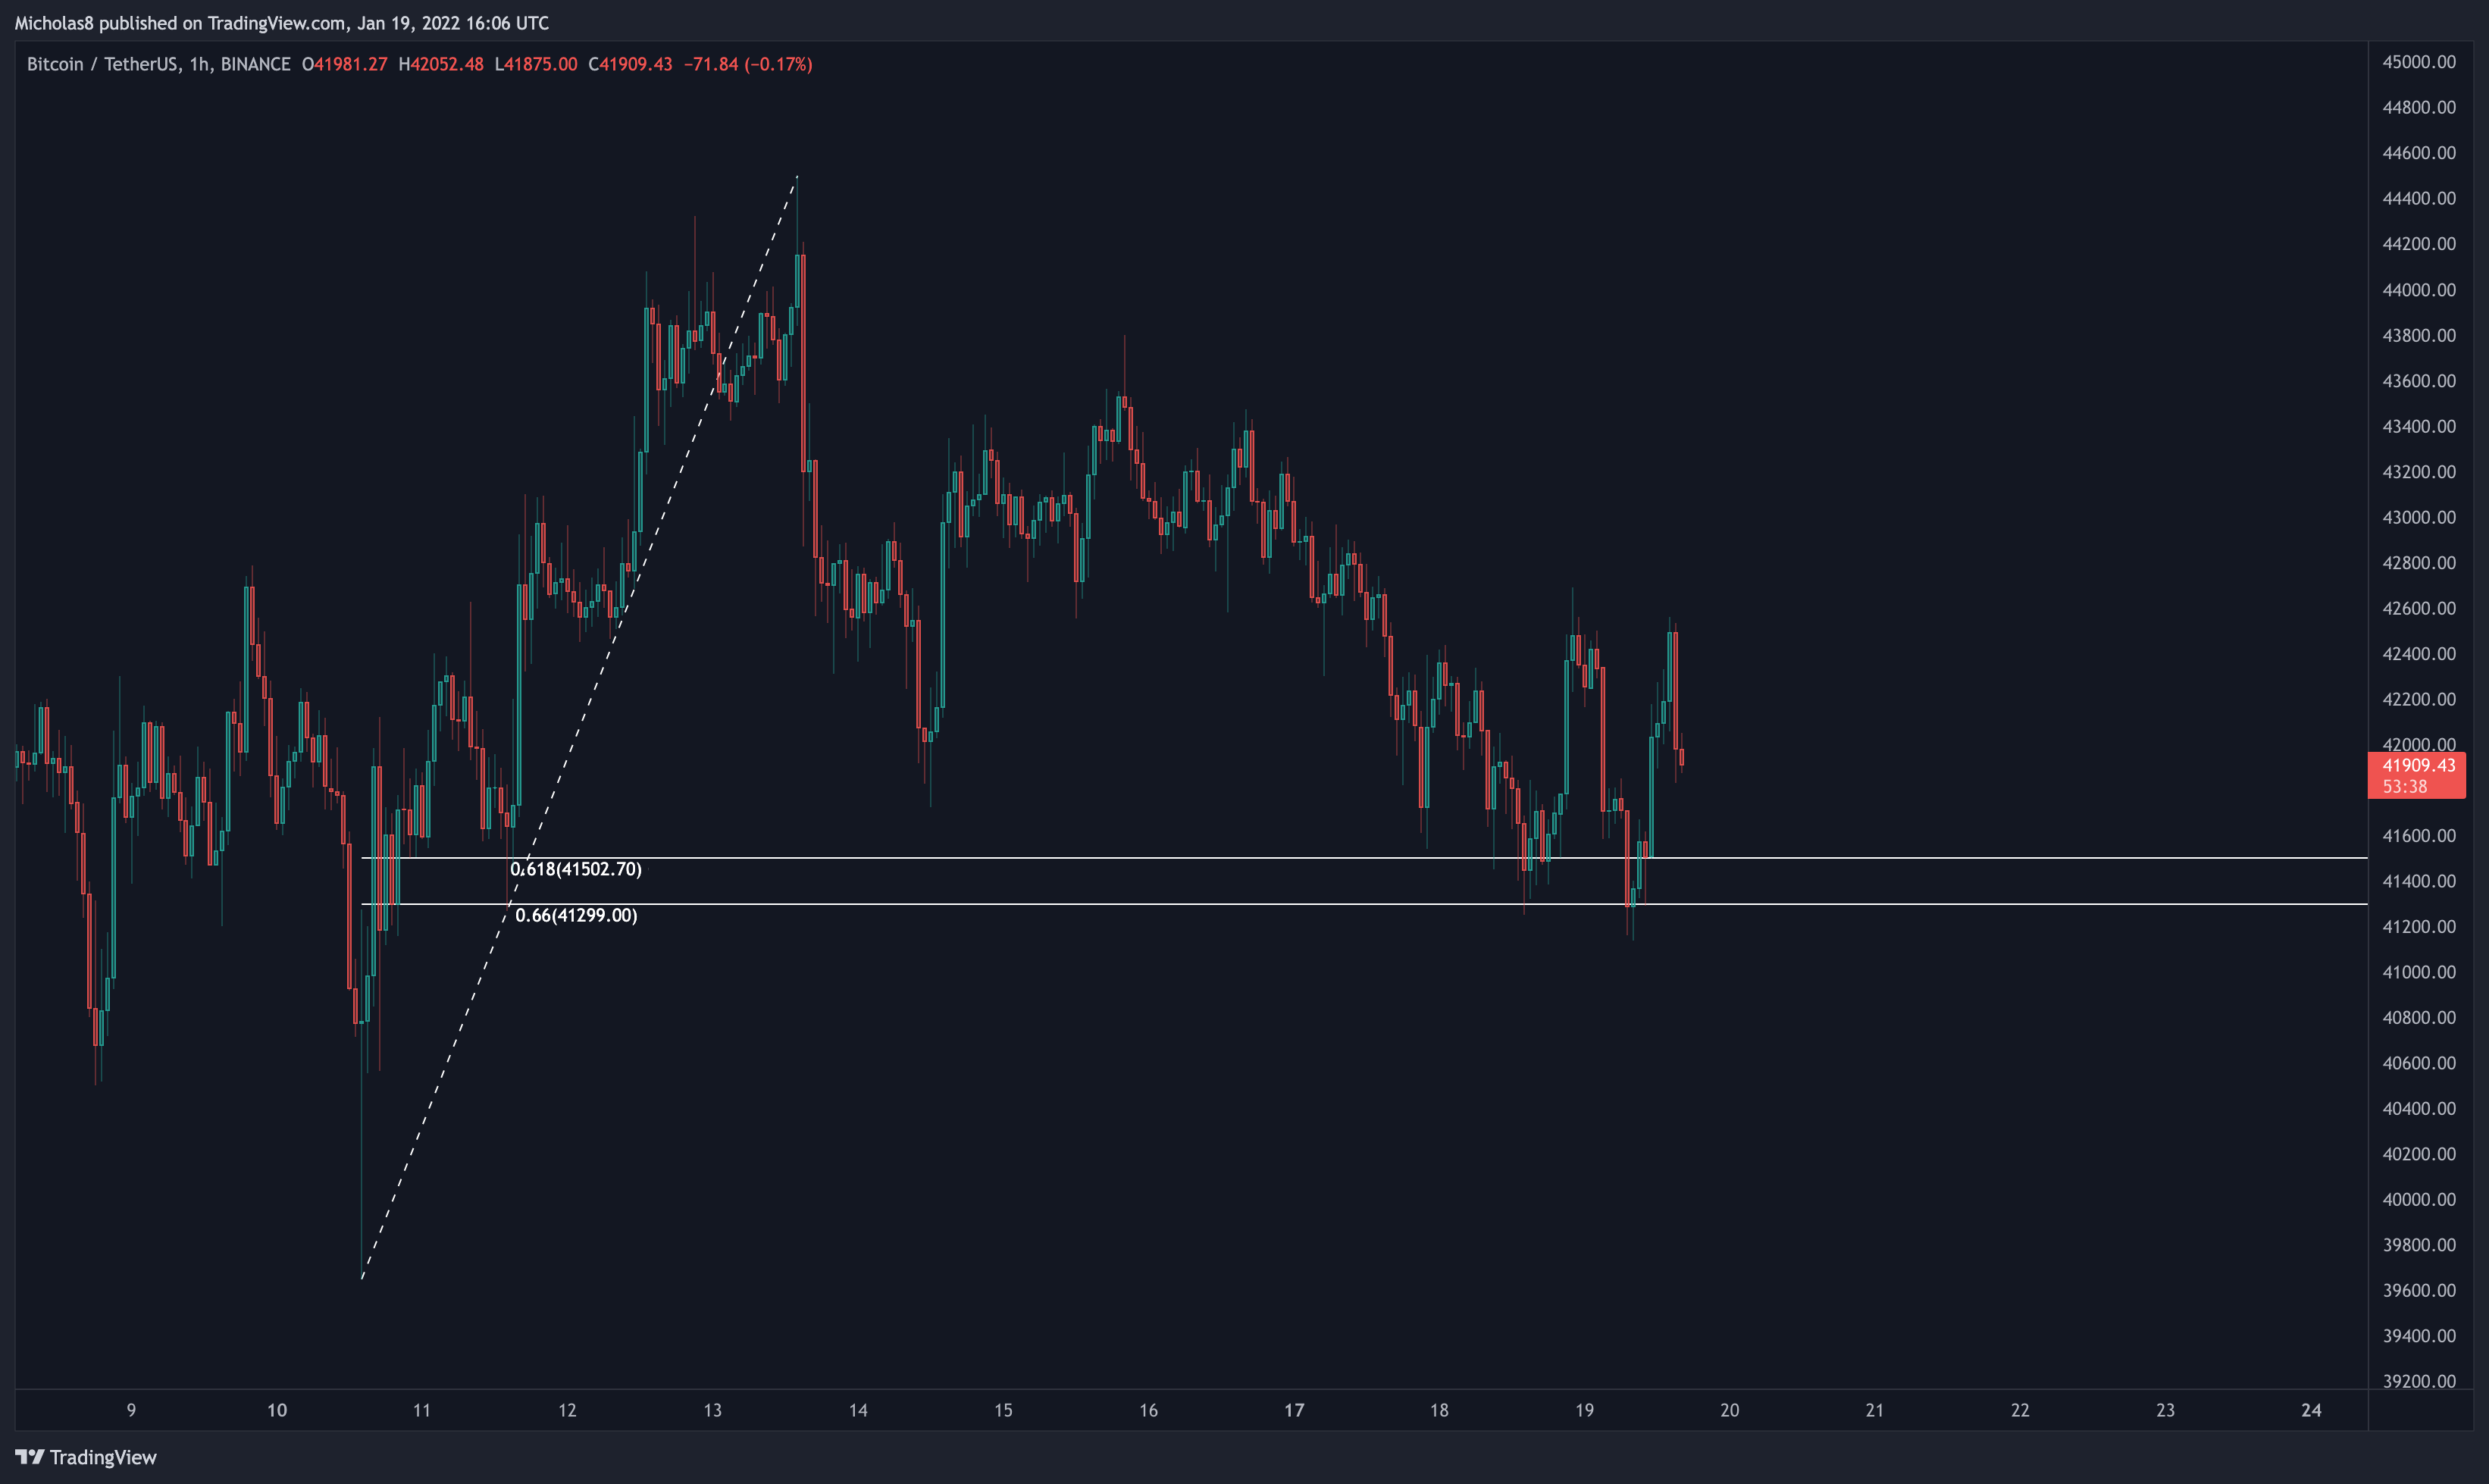
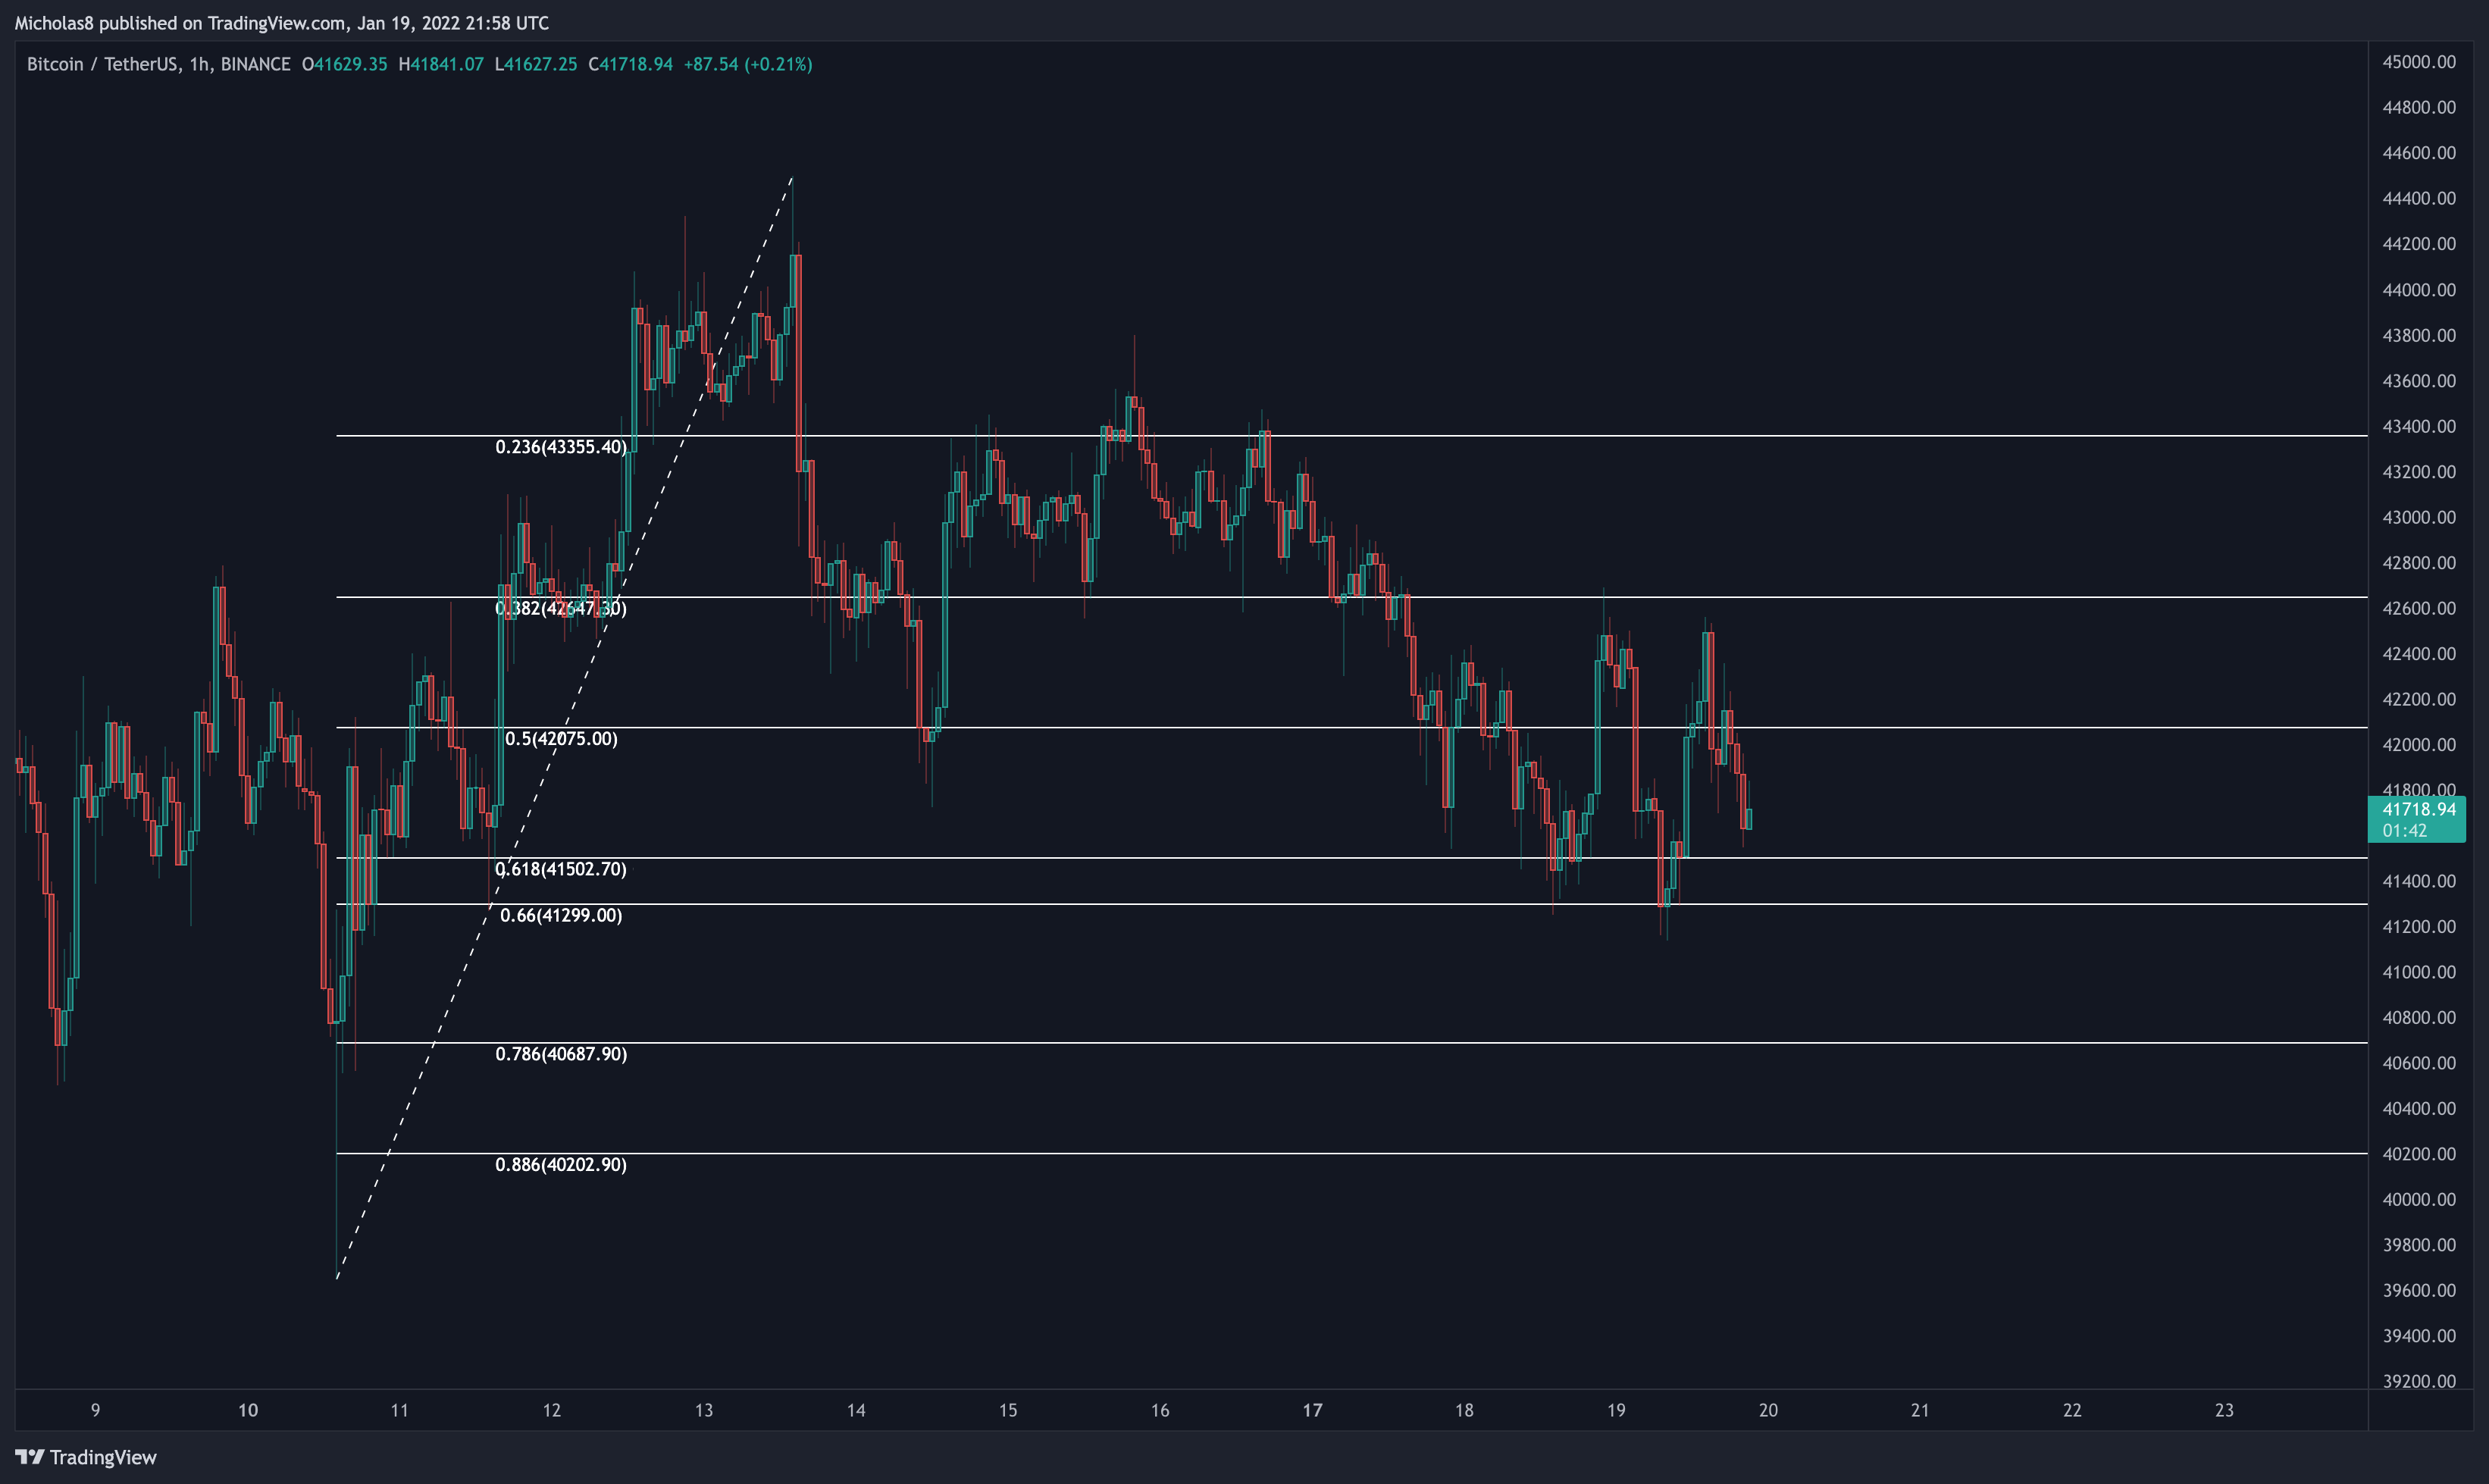
Bitcoin has formed another 1H and 4H bullish divergence. In confluence, we have the Golden Pocket again of this entire move up after bottoming at 39.6k, with a Swing Failure Pattern (SFP) of the low. As. a reminder, in short, an SFP of the low is when we see price temporarily fall below the previous low but is unable to sustain price action below it ultimately resulting in an aggressive move to the upside.
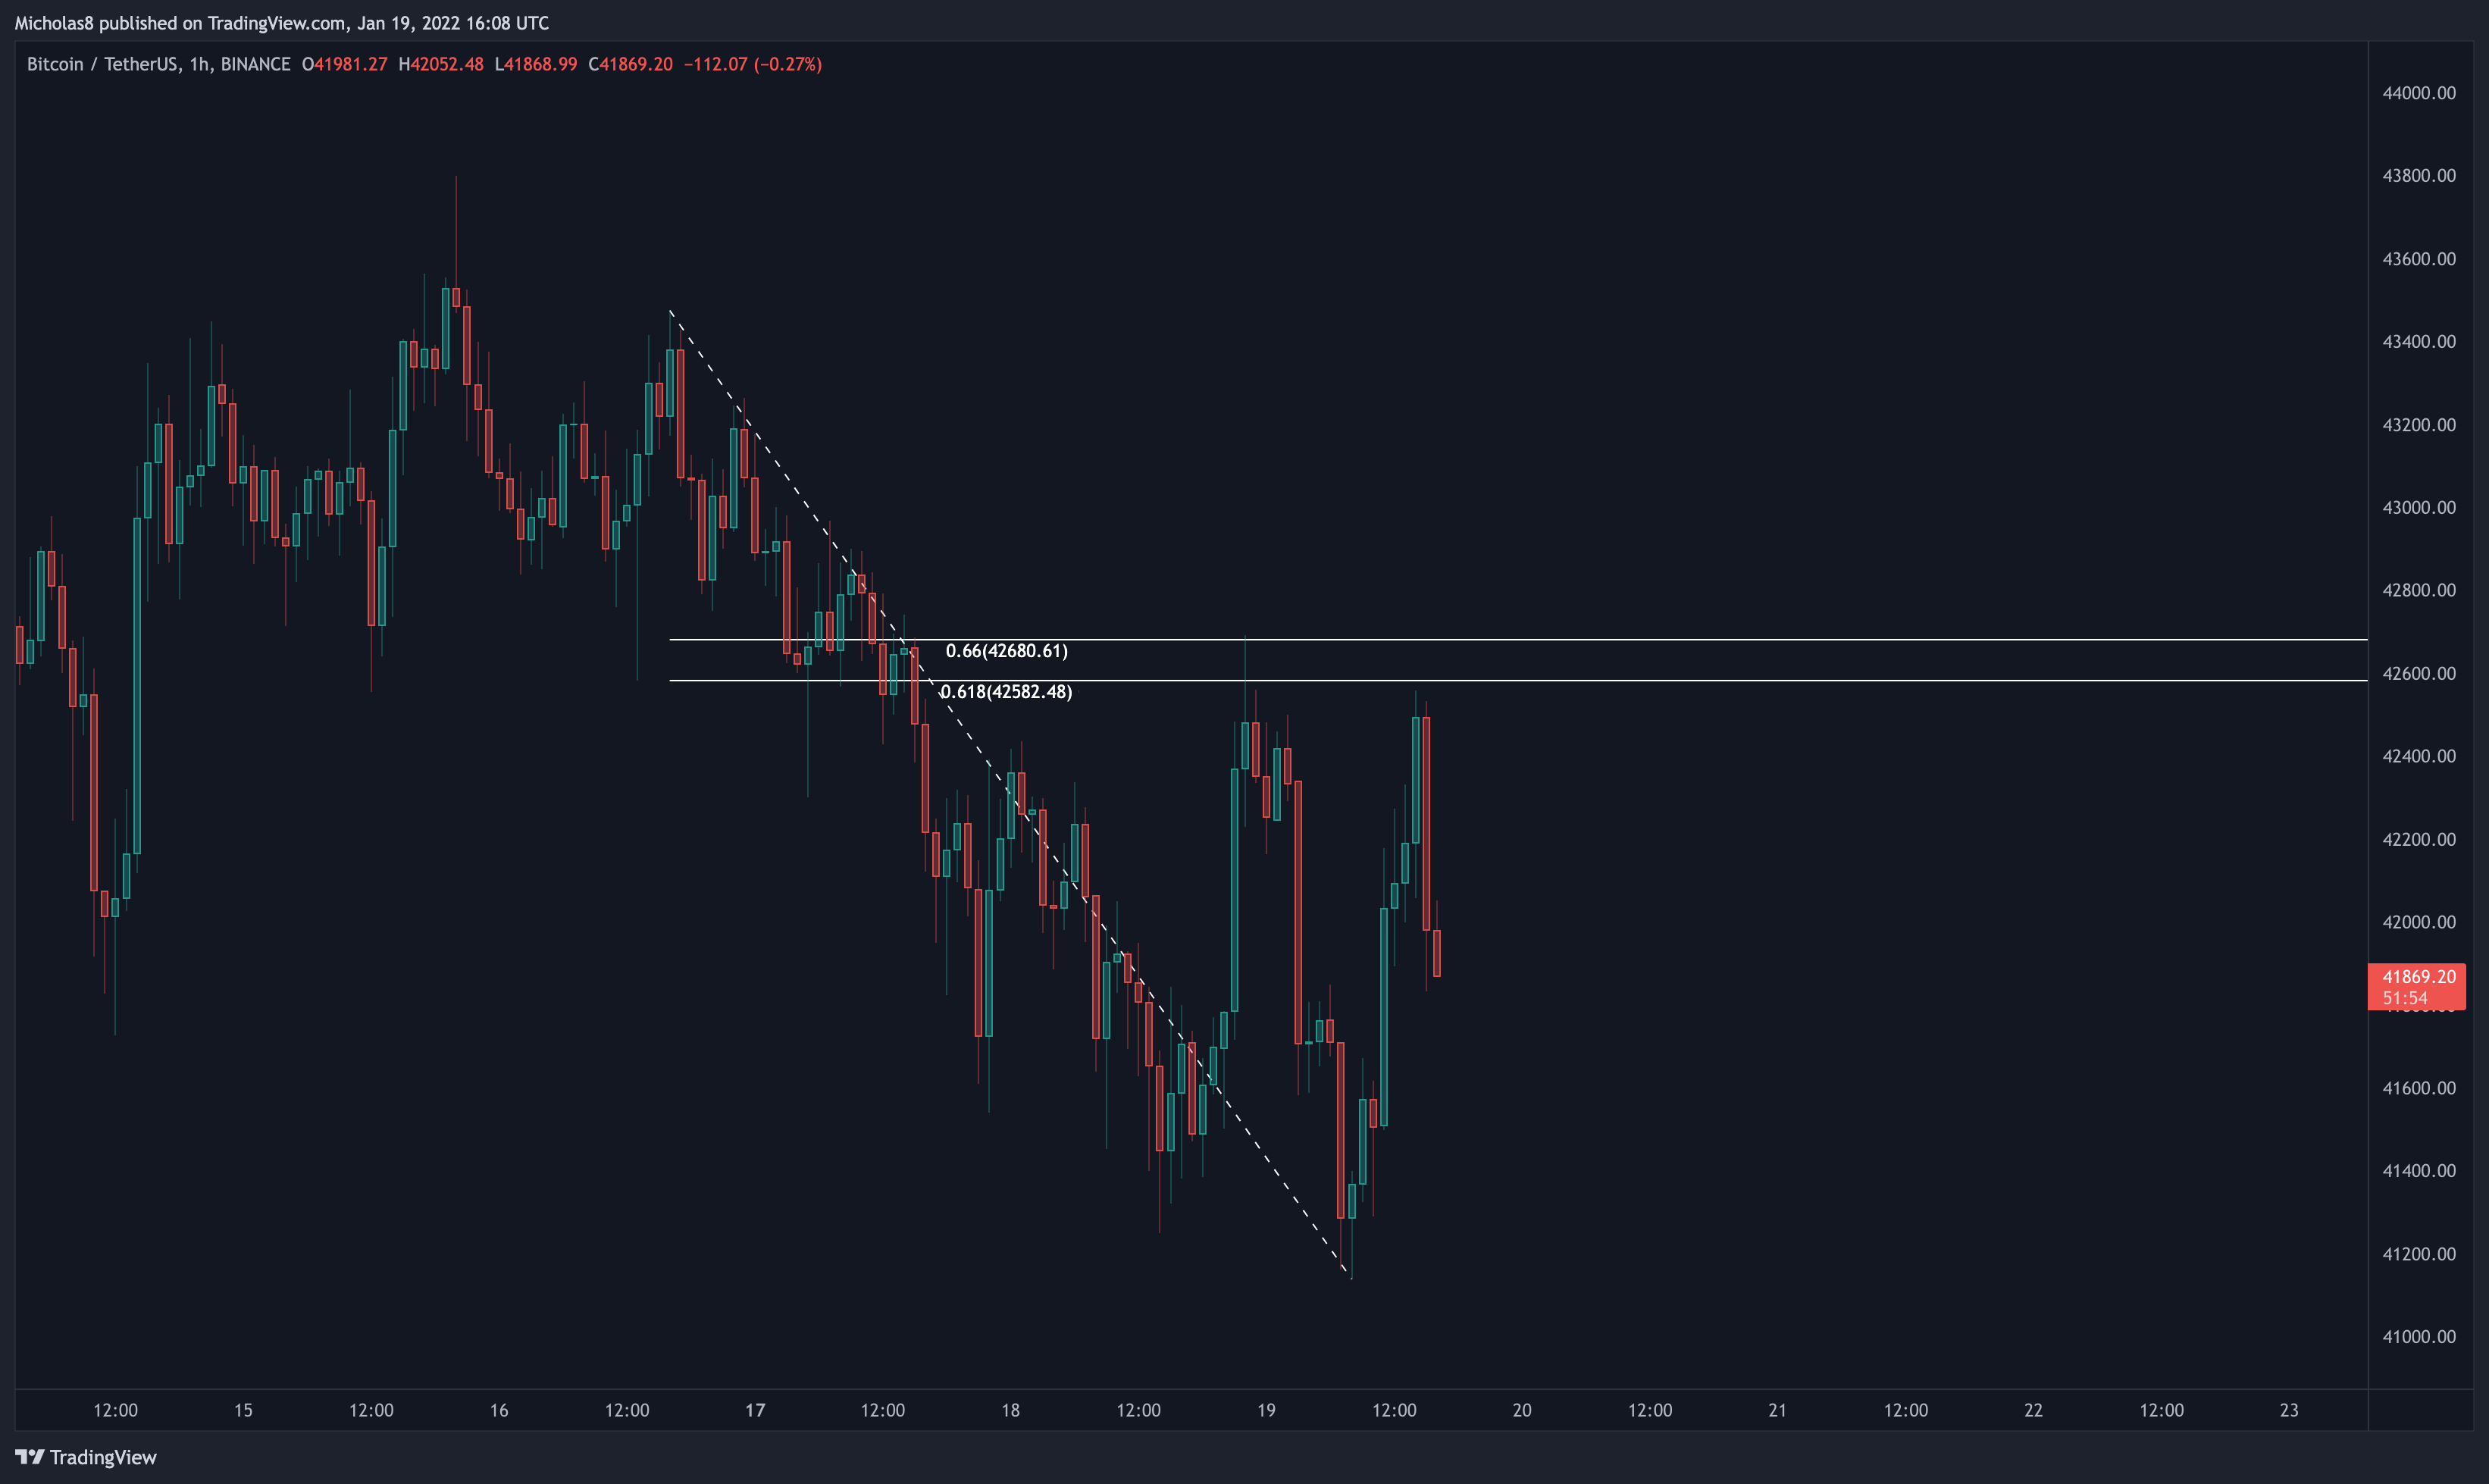
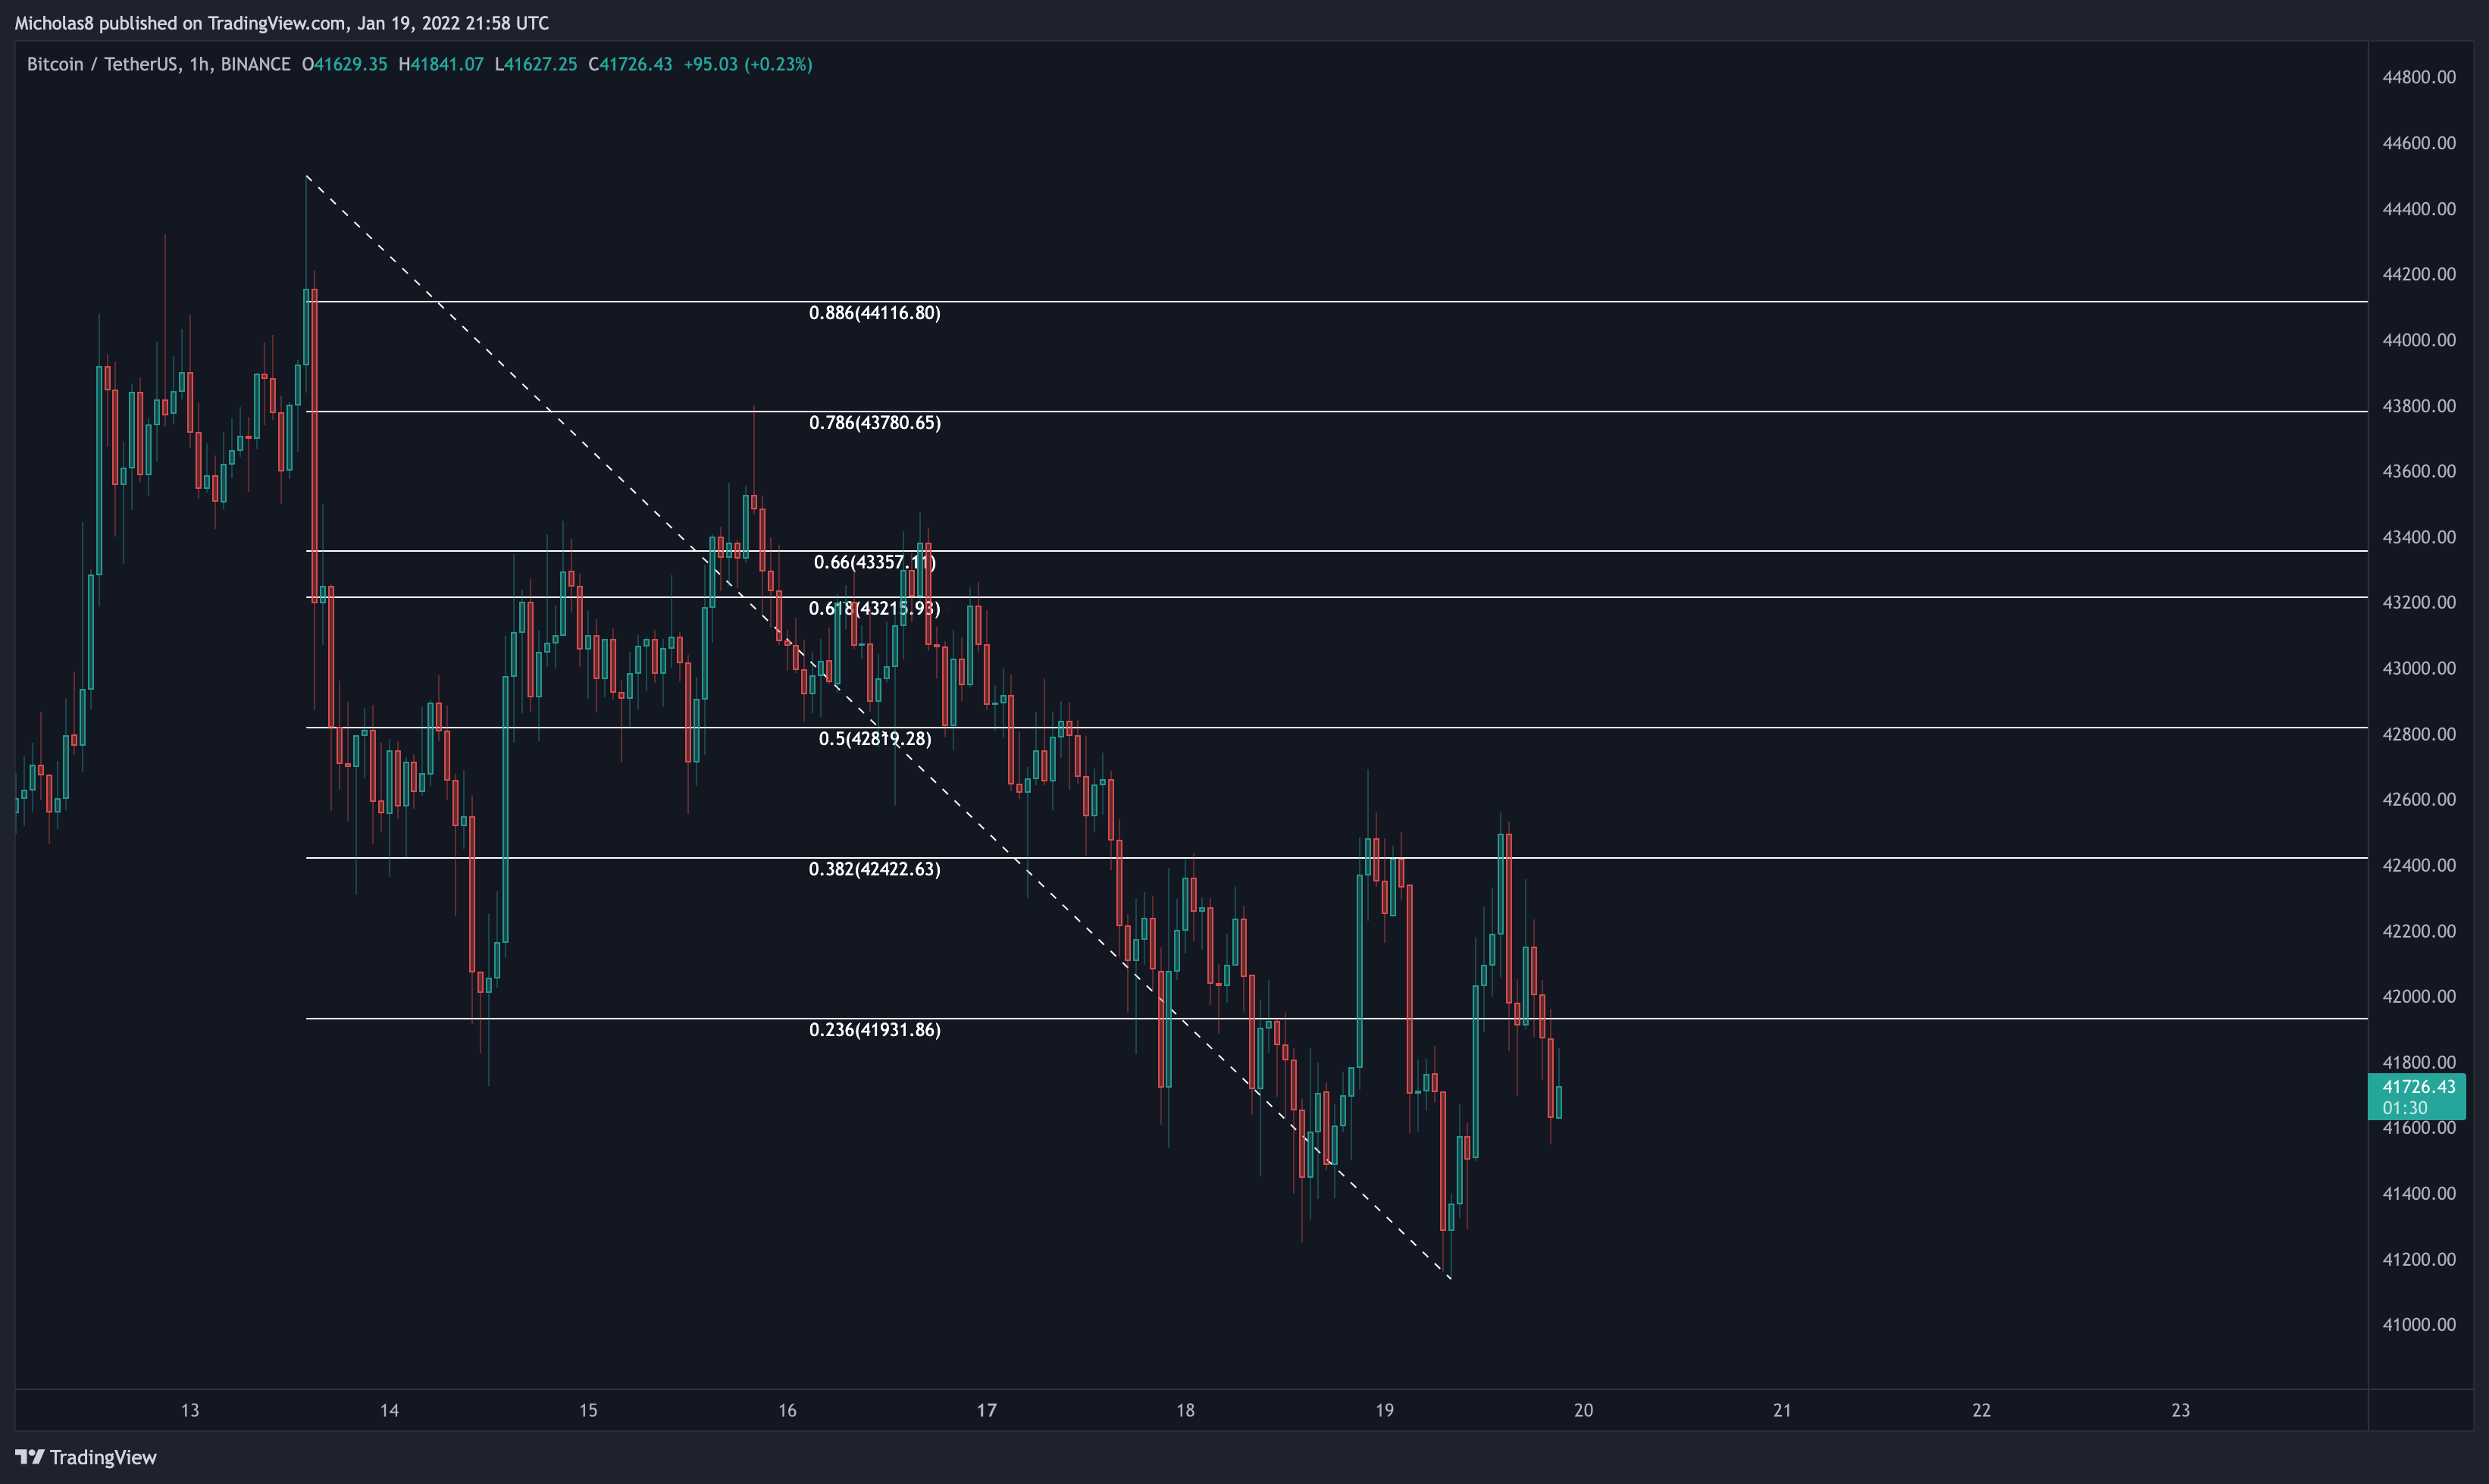
Currently, we're finding resistance at the same Golden Pocket we did yesterday, again with a hidden bearish divergence.
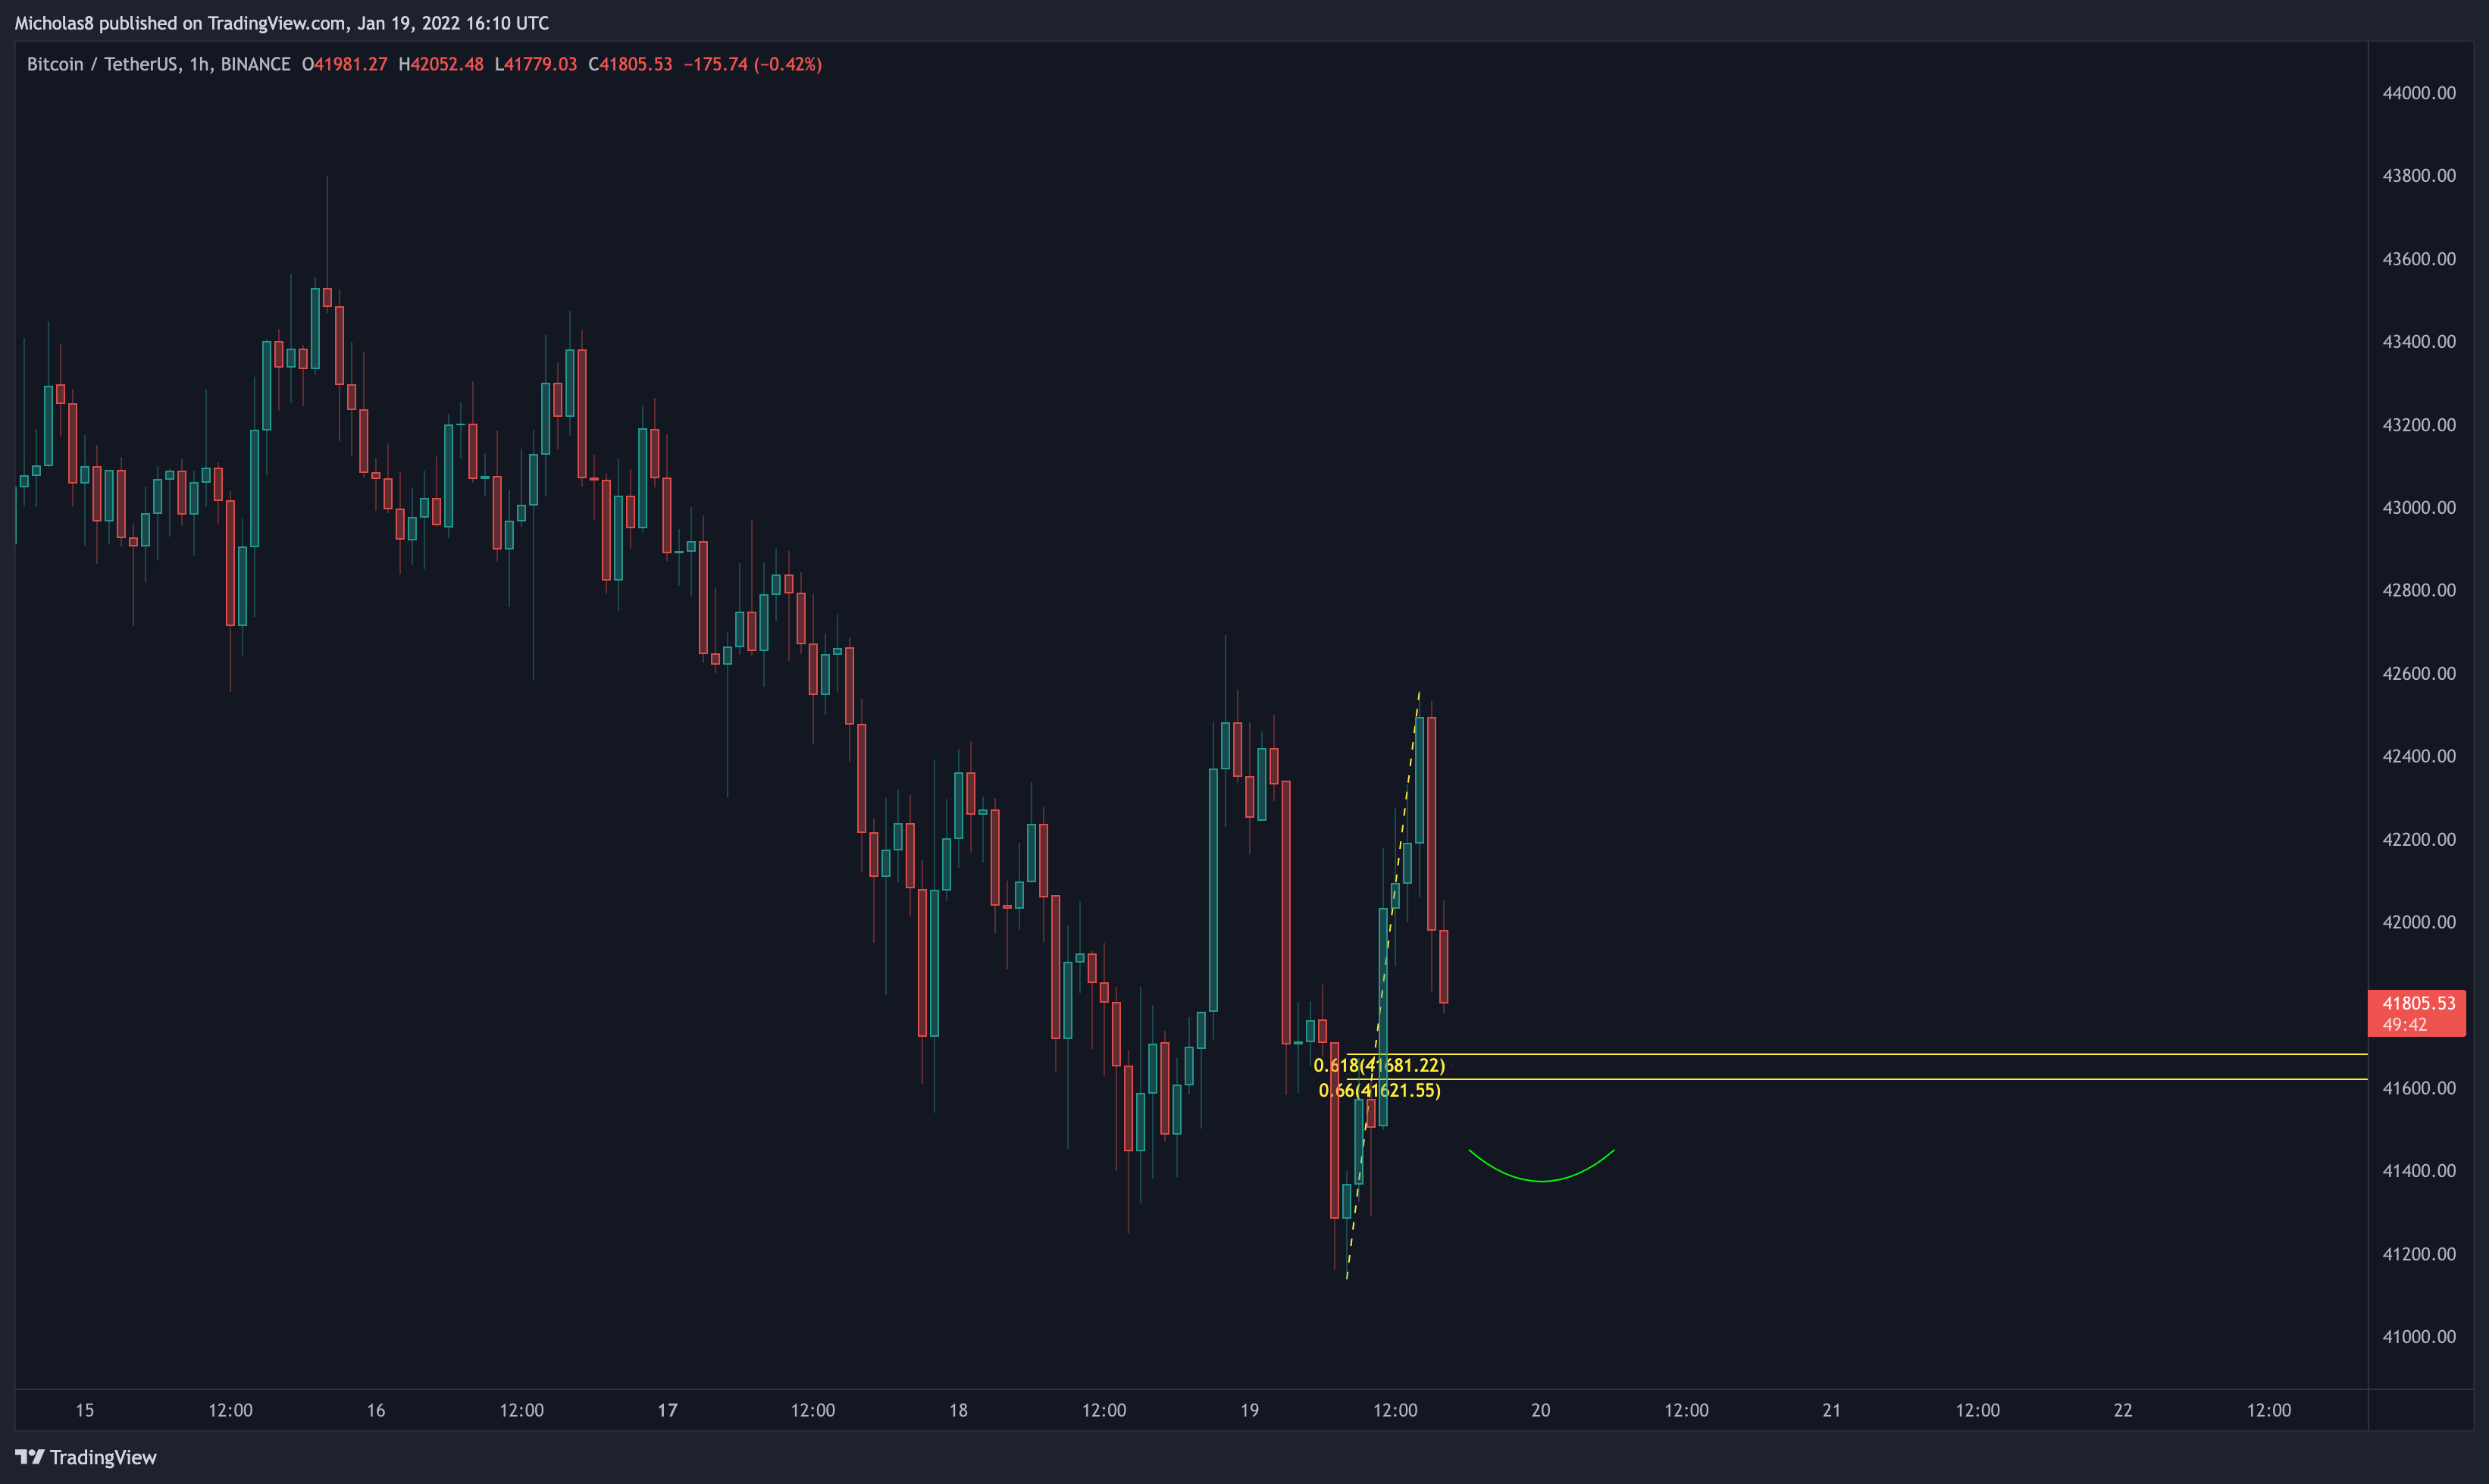
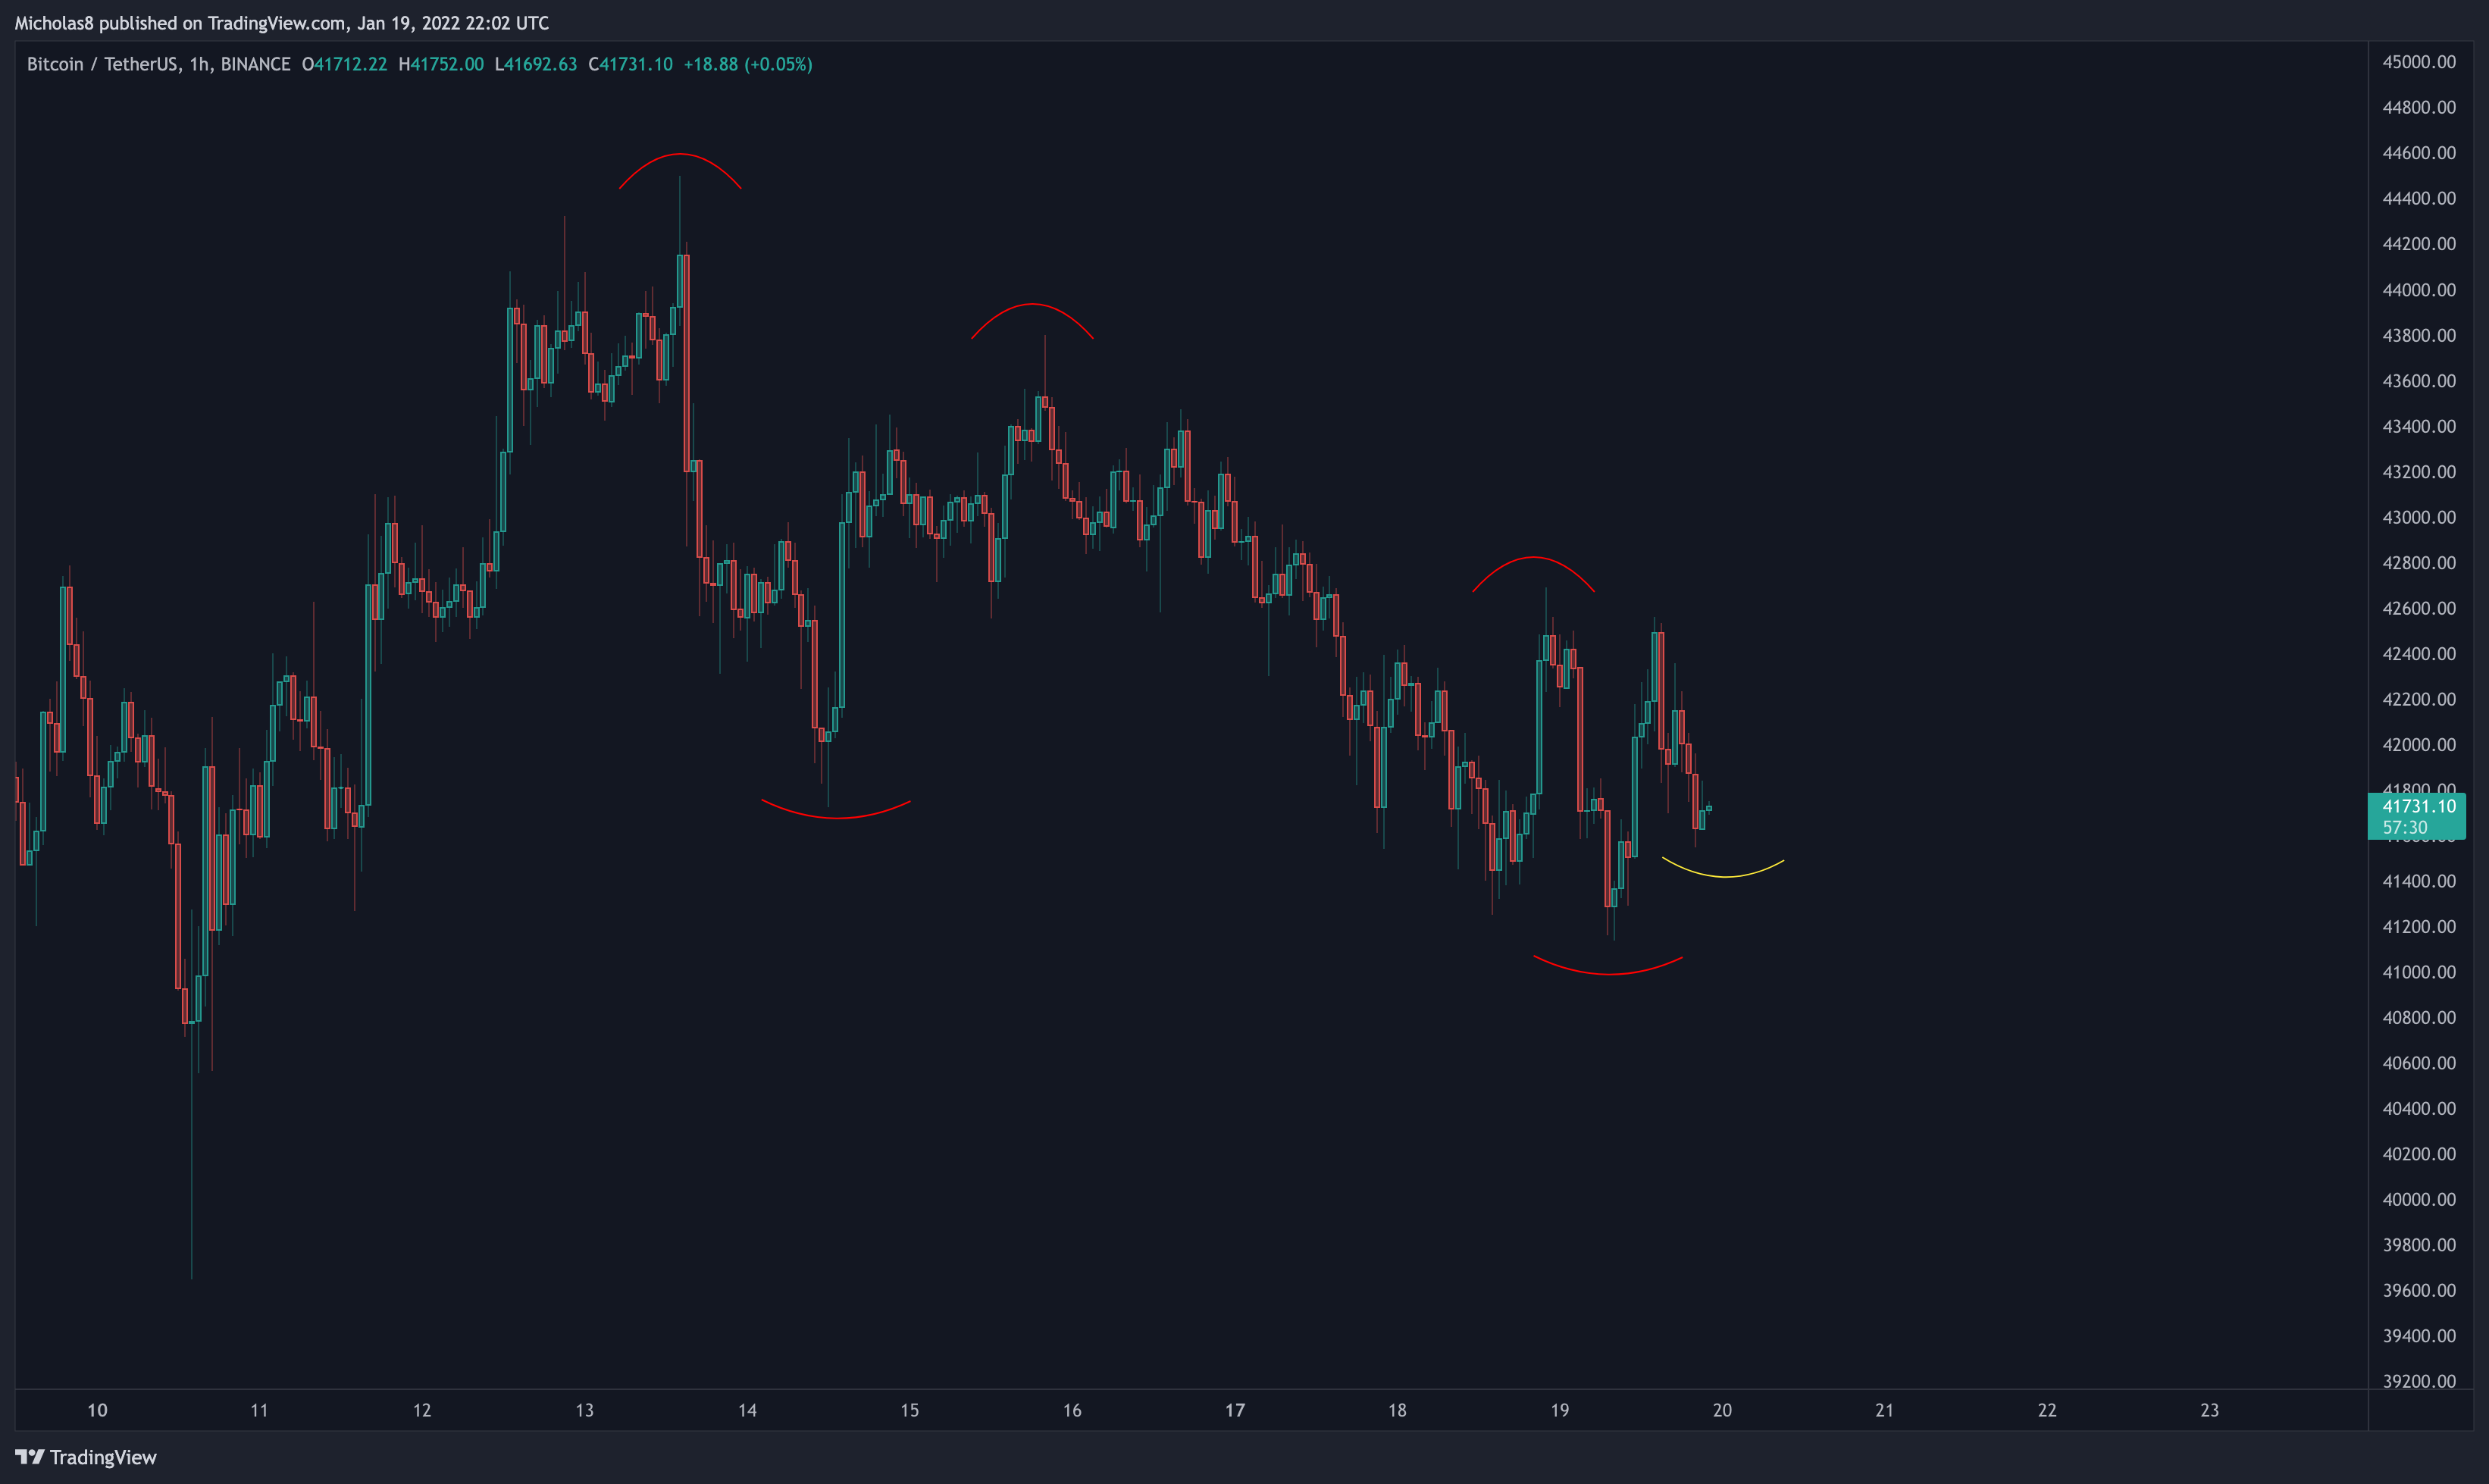
Given that Bitcoin is consistently creating new bullish divergences, leads me to believe that there's still an opportunity here that the bulls can take advantage of. As long as Bitcoin can maintain price action above the 41.1k low of today, there's still hope. Ideally, we see a new higher low come in at the yellow Golden Pocket, or in the region of the green curve I've indicated above.
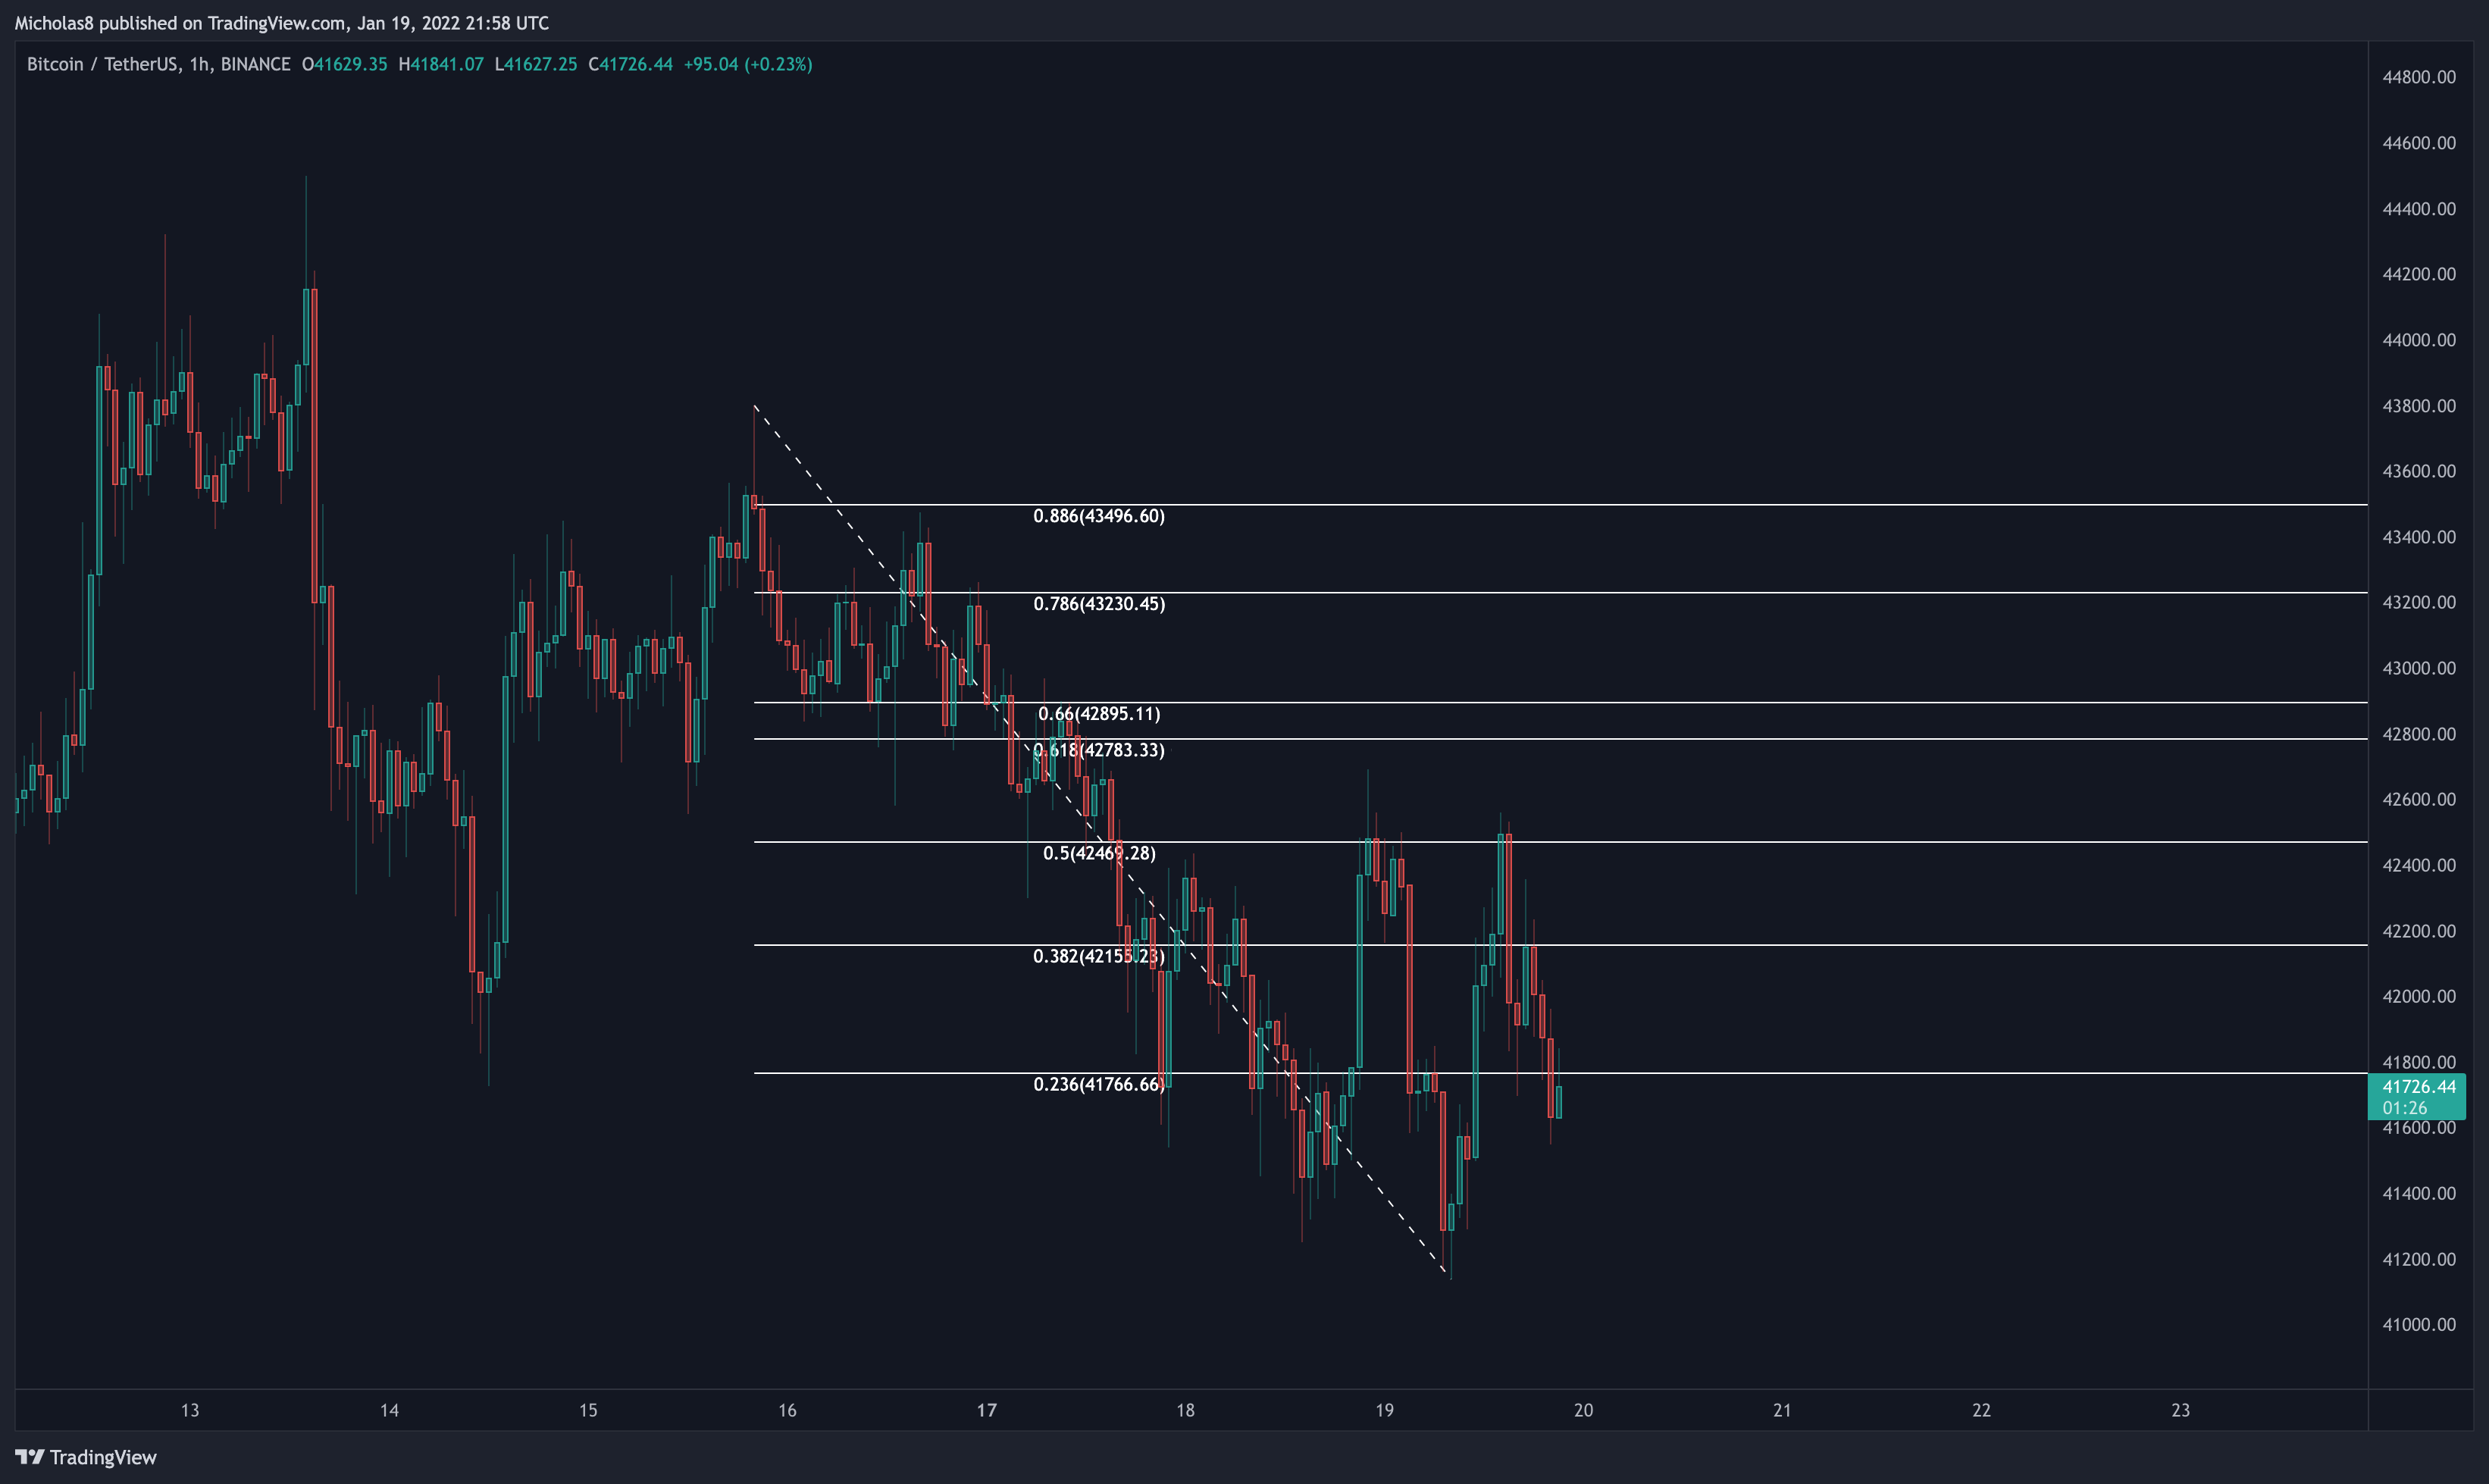
And if we do create a higher low in an attempt to continue up, please refer to the 1H Key Levels for all immediate relevant Golden Pockets that will likely serve as resistance.
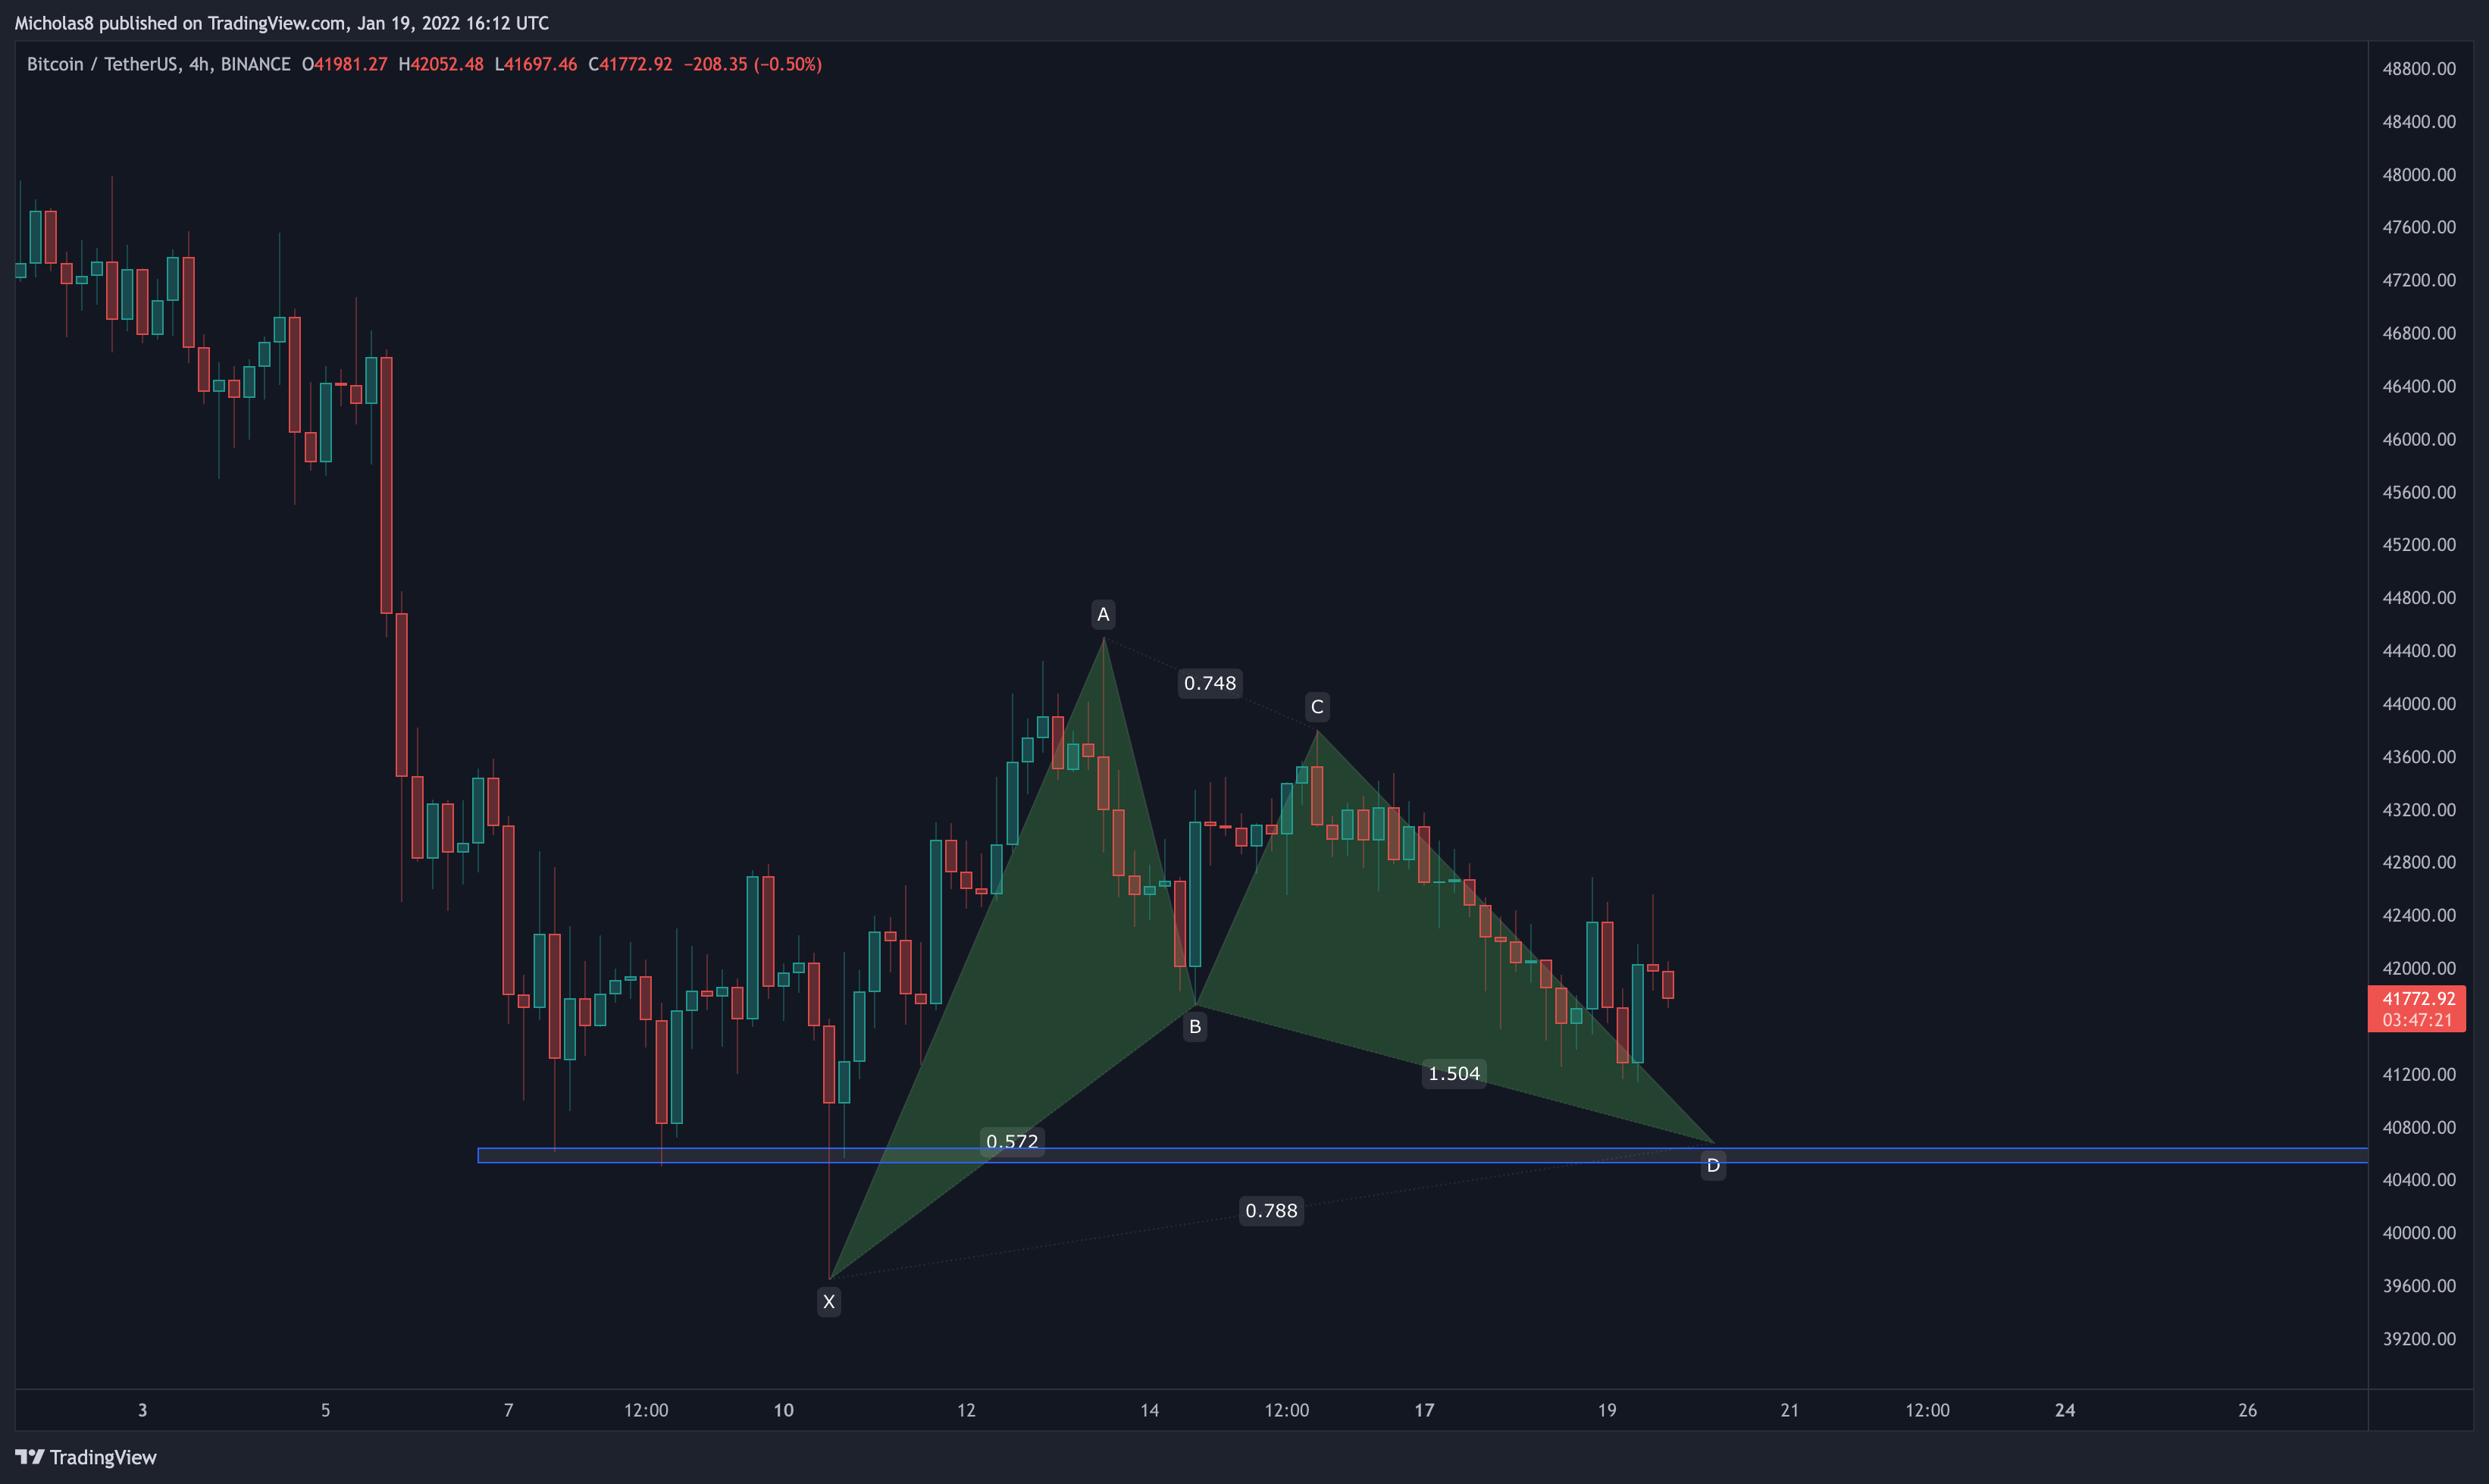
However, if the bulls aren't able to sustain momentum, this Bullish Gartley is still valid.
And these lower targets are as well.
All in all, on a short to medium term level, Bitcoin is starting to form bullish divergences, indicating some strength from the bulls. If the bulls can make something out of this, I would be looking towards our Golden Pockets as potential resistance points (see 1H Key Levels).
Thank you for your continued support and I hope you have a great rest of your week!
_
TONIGHT
The Good
Trading above the Daily LQZ 1
1W Hidden Bullish Divergence
1H/1D Bullish Divergence
4H Bullish Divergence
CME Gap at 53,665
Bullish Market Structure (1W timeframe)
Risen above the 4H LQZ 2
_
The Bad
May be losing the 1W EMA Ribbon
Lost the Bull Market Support Band
Lost the 20/50-week SMAs
1H Hidden Bearish Divergence
1W Bearish Divergence
1M Bearish Divergence
Bullish Exhaustion
Lost the 1H/4H/1D EMA Ribbon
Bearish Market Structure (1D timeframe)
Trading below the 20/50/100/200-day SMAs
Trading below the 8/21/50/200-day EMAs
Trading below the Daily LQZ 2/3
Trading below the 4H LQZ 1/3
Volume Analysis
Bearish DMI
Bearish NVT
Resistance from the Bitcoin Logarithmic Curve Median Line
20/50-day SMA Death Cross
20/100-day SMA Death Cross
50/100-day SMA Death Cross
20/200-day SMA Death Cross
50/200-day EMA Death Cross
50/200-day SMA Death Cross
_
Between this morning and tonight nothing has changed.
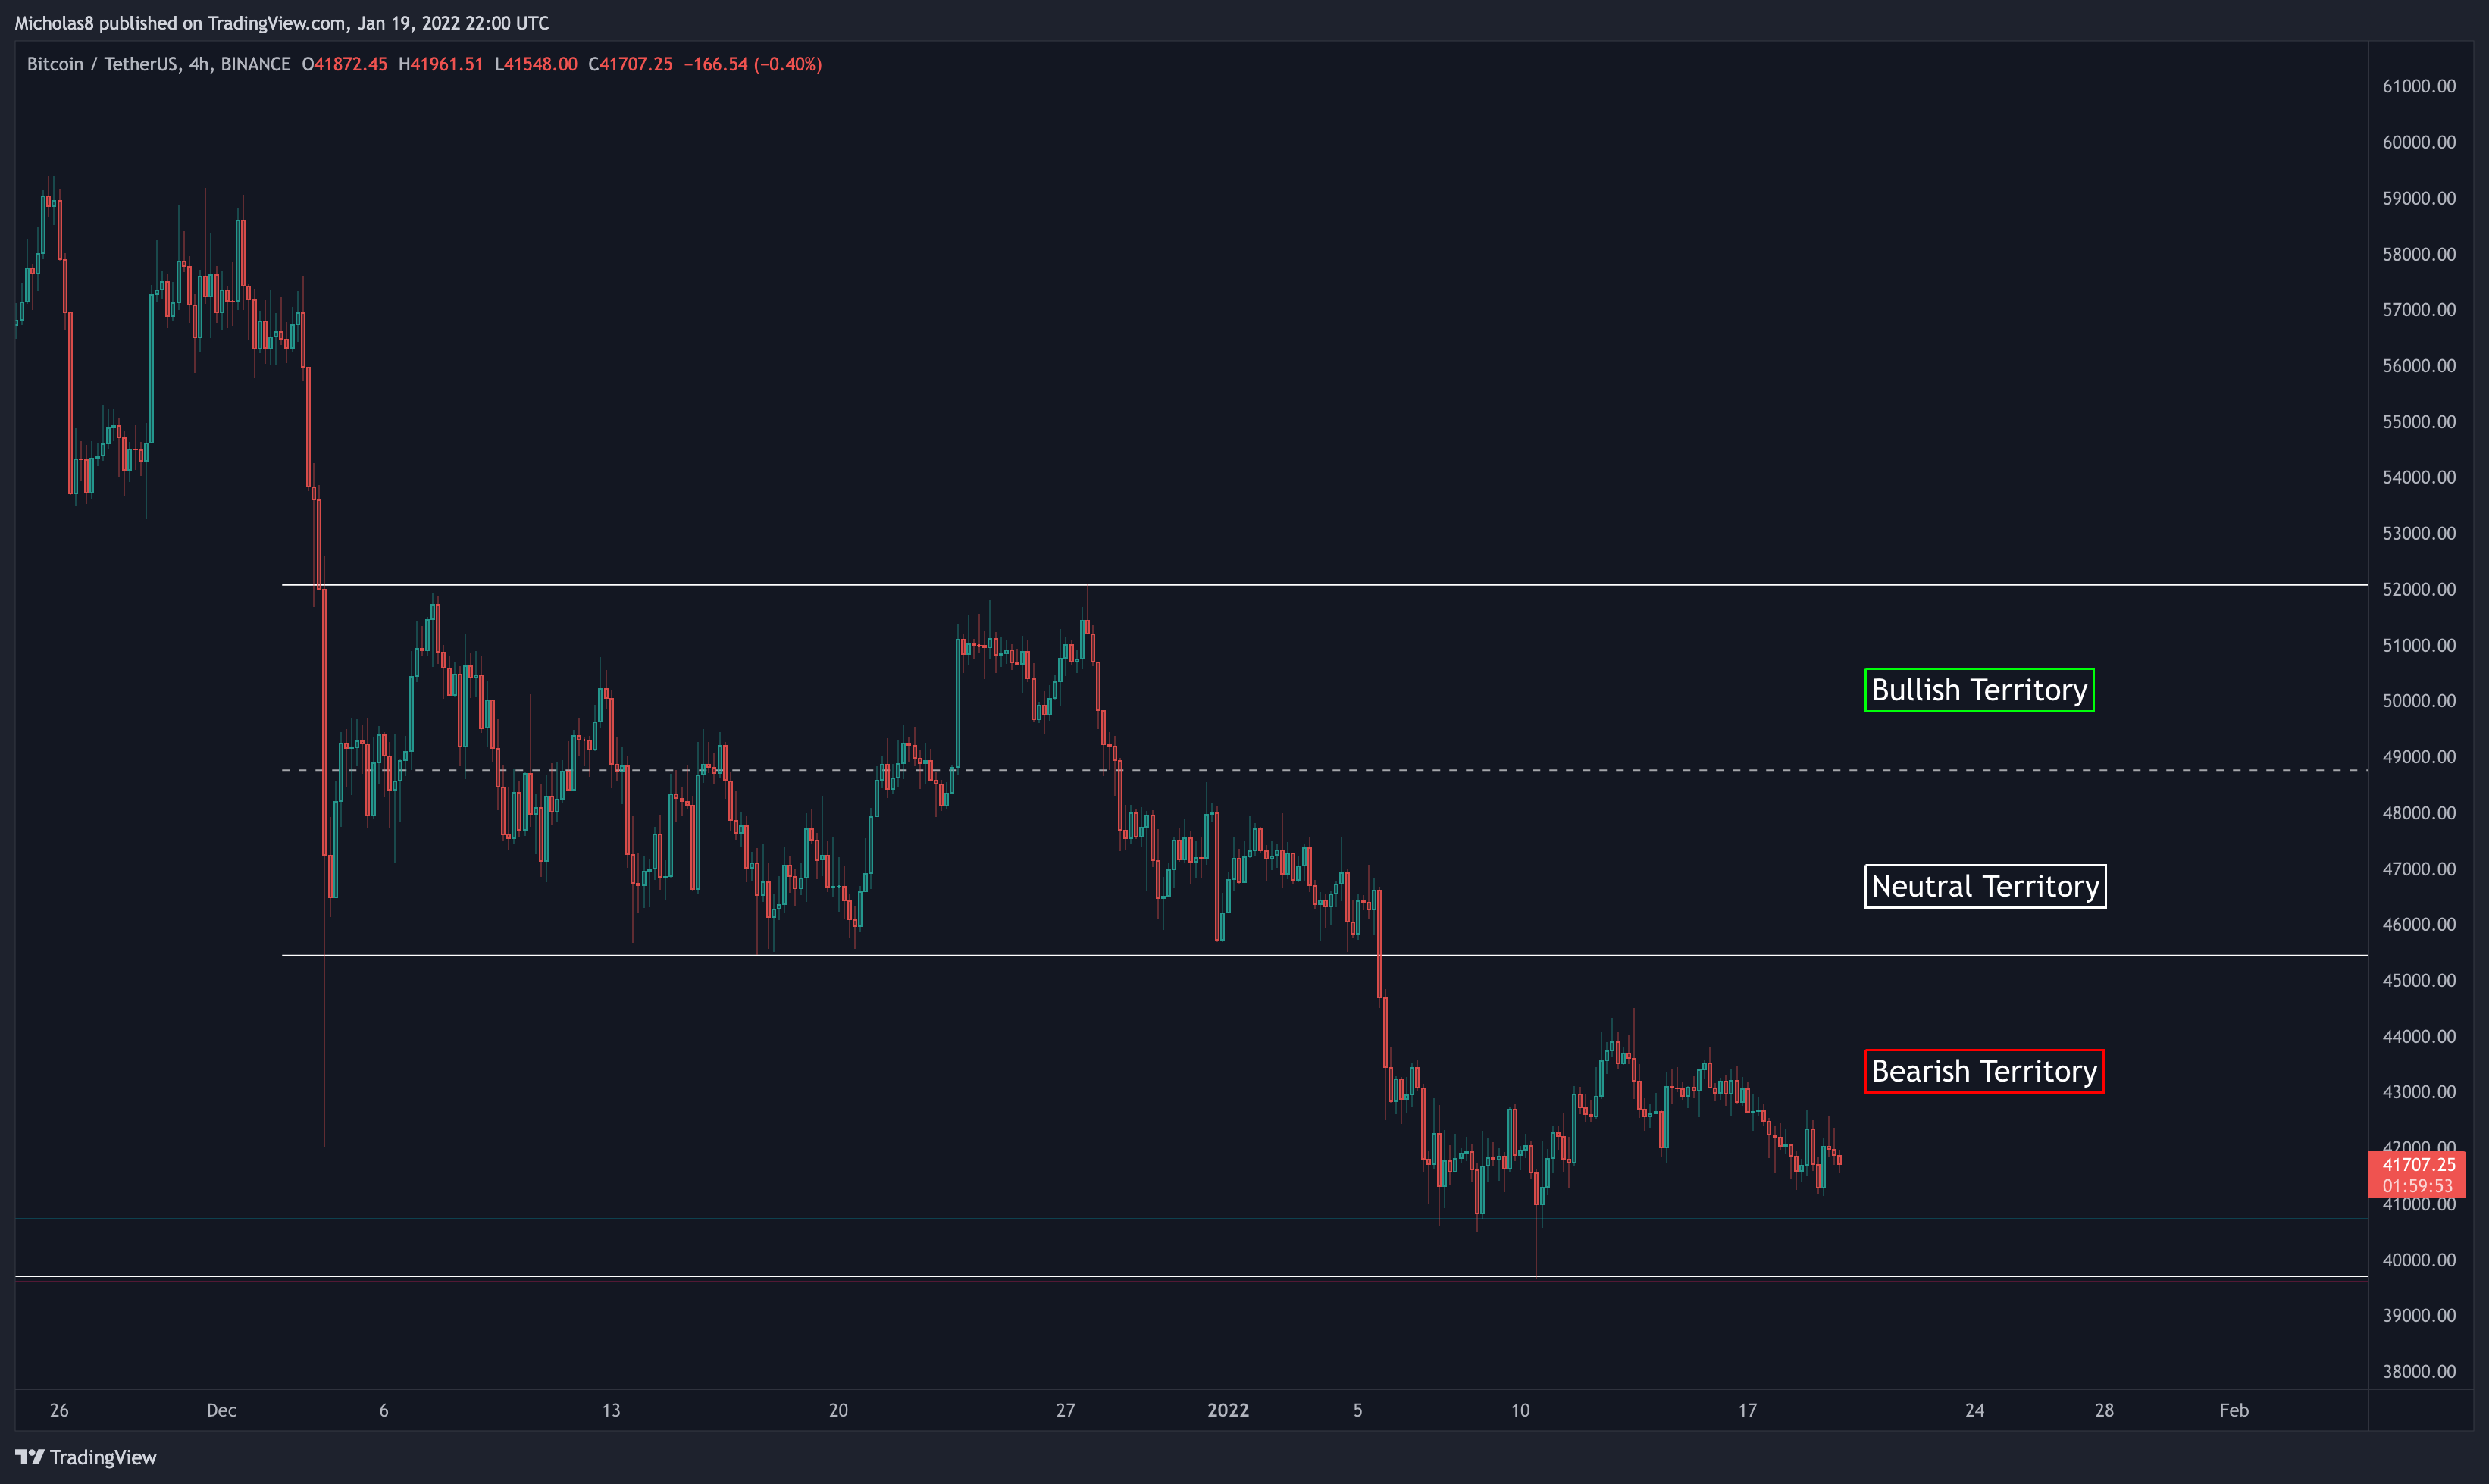
Bitcoin continues to trade within the Bearish Territory.
We can see here on the LTFs (lower timeframes) that Bitcoin is still bearish as it continues to print lower highs and lower lows. Until Bitcoin can print a meaningful higher high, the market structure remains bearish.
Given that we do have these 1H/4H bullish divergences still in play, there's a possibility that we are in the midst of creating our first higher low.
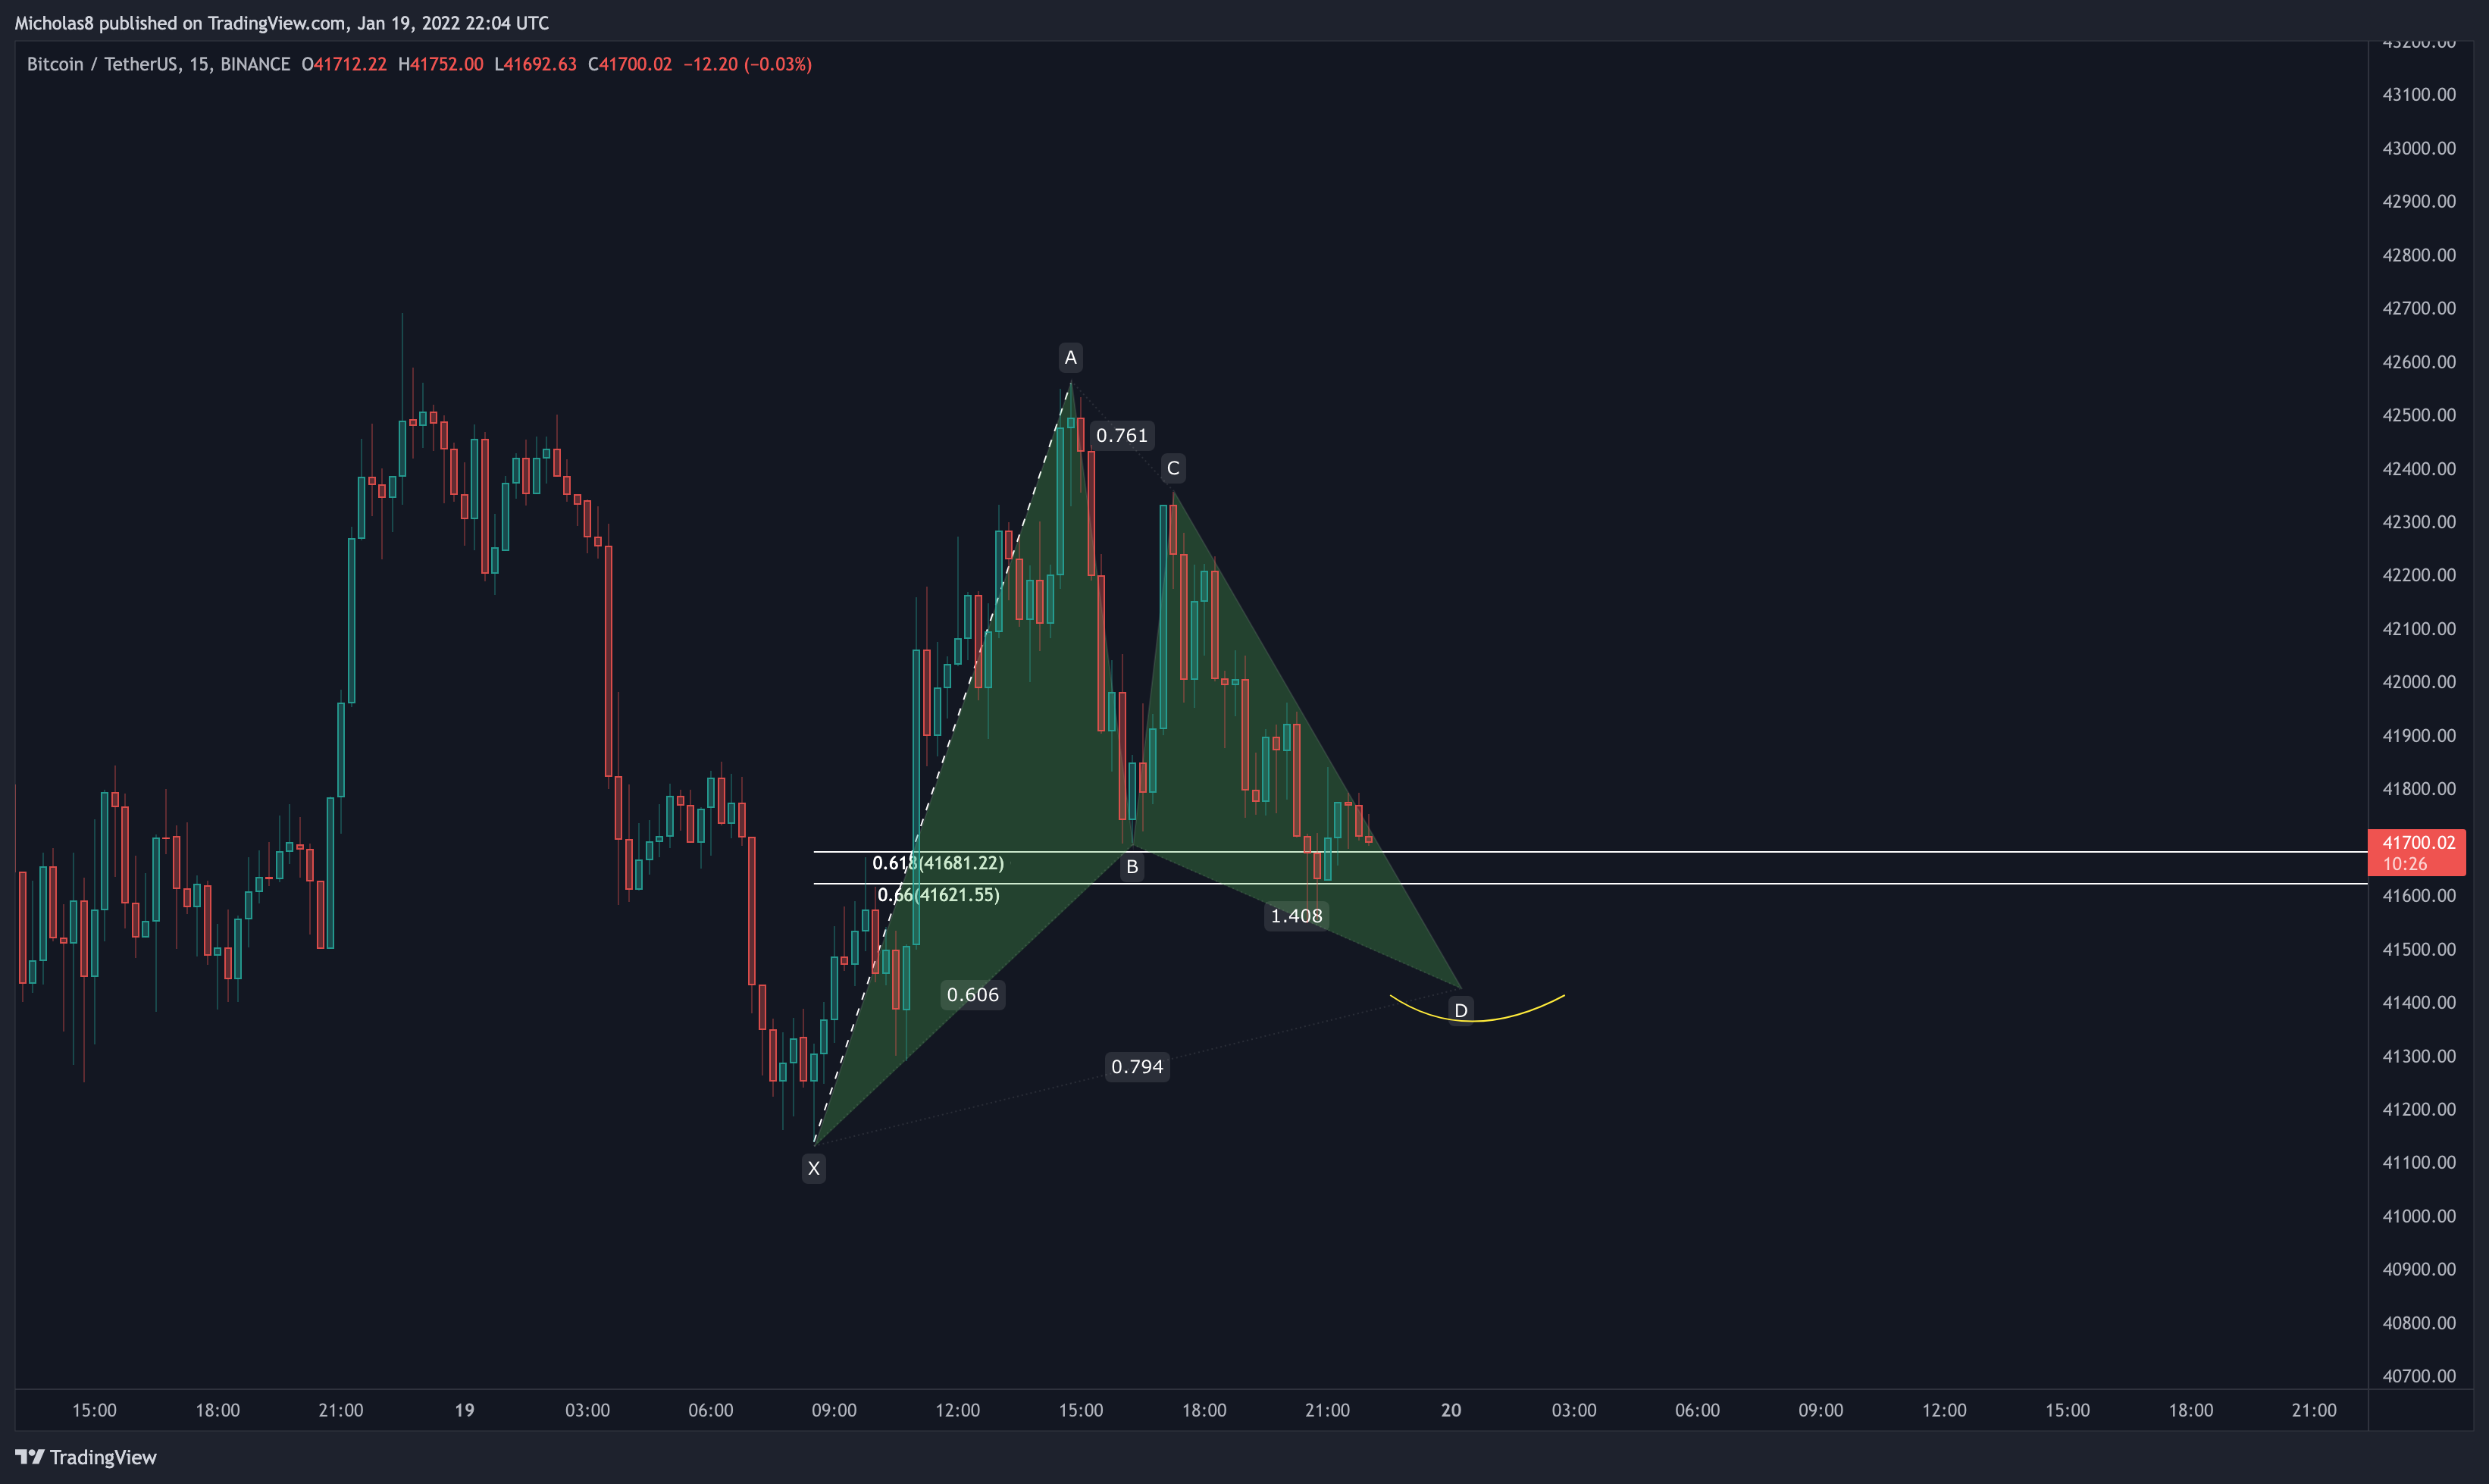
Bitcoin is currently finding support from the Golden Pocket mentioned in this morning's report. However, I am seeing a bit of weakness in the charts right now. If we continue down, and create some more LTF bullish divergences, I can see this Bullish Gartley playing out for the bullish scenario of a reversal to the upside. PCZ (Pattern Completion Zone at Point D/yellow curve) = approximately 41.4k.
But, if we do continue even lower, the levels of support remain the same (see "recap" above).
All in all, it's great to see these divergences provide some relief for the market. However, as always, we need to stay vigilant and aware of the levels above as they are likely to serve as resistance. If Bitcoin can maintain this bullish momentum and solidify a higher low, it becomes more likely that we see a bullish breakout from the Falling Wedge.
Thank you for your continued support, and I hope you have a great rest of your week!
Cheers!
To subscribe to this daily newsletter (2 reports daily during the week, and one report on Sunday), follow the link below to get started with as little as $10/month!
https://www.buymeacoffee.com/bitcoincharts
LIMITED TIME SPECIAL OFFER: To those that missed the lifetime membership offer, there are still 4 left! $108 (same price as an annual membership) for lifetime access to our market reports. DM me on Twitter for more info!