
Spektrum Telemetry File Viewer is a software developed for hobbyists who use Spektrum radios. The software allows to view and analize telemetry files recorded by a Spektrum TX. The software is compatible with any telemetry enabled Spektrum radios (DX, iX, NX).

This is Windows only application. That means that the software designed to be used on Windows OS. It does not work on Android. However it can be used on Mac with any Windows emulator. The software can be used on any Windows platform that runs on x86 CPU.
Installation
The TLM Viewer does not need any istallation. Once downloaded simple unpack the ZIP archive and you can start using it.
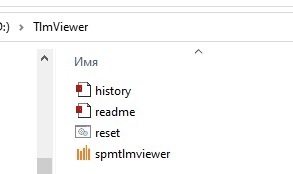
The archive contains few files: history.txt, readme.txt, reset.cmd and spmtlmviewer.exe.
The history.txt file includes all the changes history. The readme.txt file is the simple EULA (nothing important) and copyright notice. The reset.cmd is the important file. It runs the Telemetry Viewer in reset mode. So it clears all settings (global, per model and per sensor). This can help if something went wrong with data displaying. And the spmtlmviewer.exe is the application file.
On first run you may see a Windows Security warning. That is normal situation because TLM Viewer does not have digital signature. What is digital signature?
A long time ago Windows did not have any malware and virus protection. But then Microsoft started to add some build-in protection into their OSes. One of such protection mechanism is a digital signature. To disable Windows Securoty warning developers must purchase such signature from one of trusted companies and when signed application runs on Windows OS the OS checks the signature and if the signature is correct allows to run an application. Otherwise (if signature is incorrect) OS blocks an application. It allows to protect your PC from viruses that may affect an application (if an application file was modified by a virus the signature becomes invalid).
However such signature costs some money. Not big but as the TLM Viewer is a free software I do not see any reason to purchase signature for it and then renew it every year. Any way you can always check the software with Virus Total.
Opening a TLM File
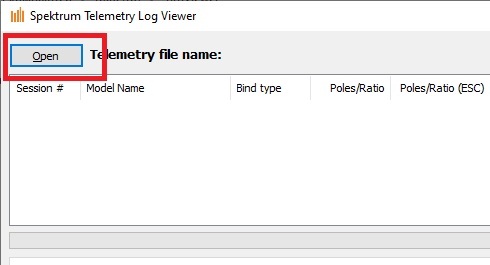
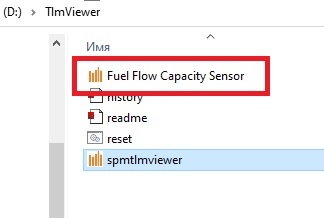
After unpacked you can start using the application. To open your TLM file simple start the application by clicking on spmtlmviewer file. When the program started click the Open button and select a TLM file you would like to view.
At the first run the TLM Viewer creates associations with TLM files and next time you need to view a Telemetry data you can simple click on a TLM file you want to view and the Viewer will start and open the file. Or you can drag-and-drop your file from Windows Explorer (or Total Commander) to the application window and the Viewer opens it.
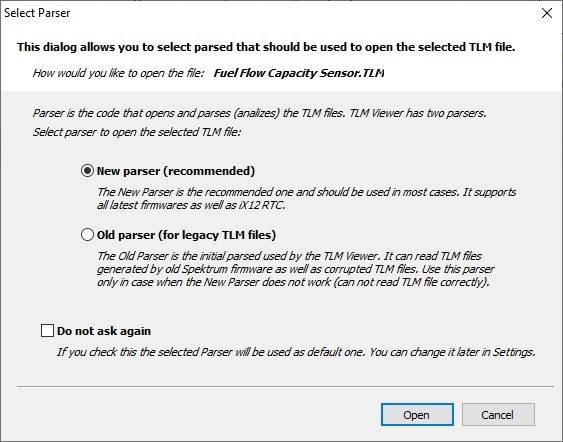
On the first run (and if you did not check "Do not ask again" checkbox) you will see the "Select Parser" dialog. What is the Parser? The Parser is a code part that parses (analizes) a Telemetry data from TLM file. In common case you should use "New Parser (recommended)". However, a long time ago there was a bug in Spektrum TX firmware when some TLM files were corrupted. To parse such files use "Old Parser (for legacy TLM file)" option. These days you usually do not need this feature so you can simple check "Do not ask again" check box and the Viewer remembers your choose and will use it next time you open a Telemetry file without asking for parser option again. If you need to change the parser after checking "Do not ask again" you can do it in the Settings dialog.
Main Window
The application main window is very simple.
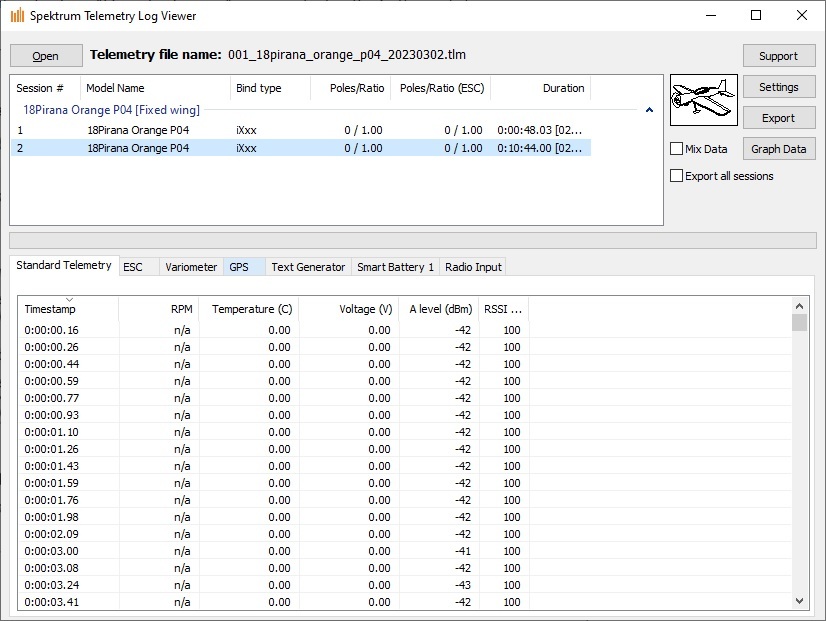
The window is splitted to 2 main parts: sessions list (top) and sensors data (bottom); and has few buttons and checkboxes. Between the sessions list and the sensors data lists you can see a progress bar that shows operations progress during opening sessions, exporting and building the graphics.
Next to the sessions list if any session is selected you can see a selected session model type image.
The "Open" button as described above allows to open a TLM file. You do not need to restart the application to open new TLM file. Simple click the "Open" button and select a file you would like to view.
Next to the "Open" button you can see the opened telemetry file name. If no file opened the "Telemetry file name" will be empty.
The "Support" button opens the "About" dialog with all the author contact information and the information about the application. Also there you can find the current application version number.
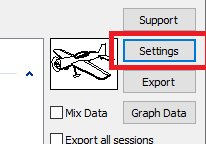
The "Settings" button opens the "Settings" dialog where you can change a global application settings and a model specific settings.
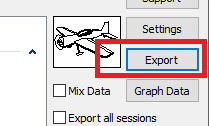
The "Export" button opens the "Export Session" dialog that allows to export telemetry data to different formats.
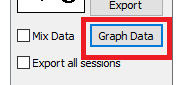
The "Graph Data" button opens the graphics with the current selected session data.
The "Mix Data" checkbox allows to control which data should be shown on a graphic.
The "Export all sessions" checkbox allows to export all sessions from the opened telemetry file.
Sessions List
Each Telemetry file may include one or more telemetry sessions for single or different models. It depends on your telemetry logging settings in your transmitter. The software does not show empty sessions (the sessions that do not contain any sensros/telemetry data). So you will see only session that include at least one telemetry/sensor record.
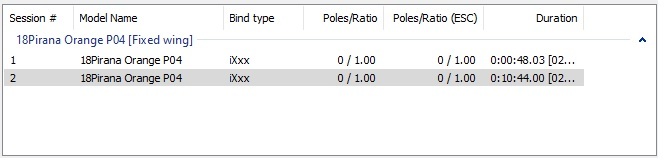
In the Sessions List you can see all the sessions contained in the opened TLM file. There you can see:
The session number
The model name (as it is stored in your TX)
The bind type (not always correct because this information is not always stored in a telemetry file so the application tries to guess this)
Poles and Ratio (used to calculate RPMs from standard telemetry) from your TX telemetry settings
Poles and Ratio for ESC (used to calculate RPMs from ESC telemetry) from yoru TX telemetry settings
The session duration in hours:minues: seconds.milliseconds format (for iX series it also show the session date and time)
If you right click on a session the session editing popup menu appears.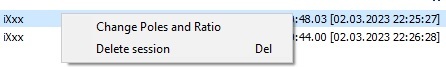
If your Poles/Ratio settings are incorrect you can change it from this menu. Select "Change Poles and Ratio" menu item and the "Change Poles and Ratio" dialog opens.
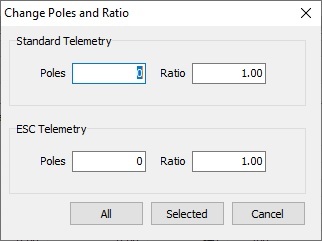
After you entered a correct values click "All" or "Selected" button. If you click the "Cancel" button all changes will be reverted. The "All" button updates the values in the all sessions of the opened TLM file. The "Selected" button updates the values in the selected session only.
You also can delete session from the sessions list if you select the "Delete session" menu item in the sessions popup menu. Or you can simple press the "Del" key on your keyboard to delete the selected session when the sessions list is active (selected).
Sensors
Each session from a Telemetry file includes sensors data. It may vary from session to session and depends on connected sensors and your telemetry configuration in your TX. The TLM Viewer does not show sensor that do not have any recorded data even it was configured in the Telemetry settings in your transmitter.
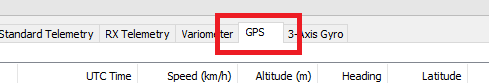
The sensor is a real or virtual device. The real devices (sensors) are: GPS sensor, Variameter, ESC, etc. The virtual devices (sensors) are: Standard Telemetry, Text Generator, Radio Imput, etc. All these are called "sensor".
Each sensor found in the TLM file is shown on its own tab. You can hide sensors you do not want or need to see. To show/hide sensors simple right click on any sensor tab and a popup menu with all detected sensors opens.
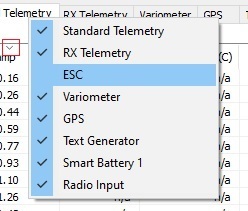
Click on sensor name menu item to hide/show sensor. Visisble sensors marked with "V", hidden sensors do not have such mark in this menu.
Sensor Data
The sensor data lists diplay the sensor data that is stored in the opened TLM file for the selected telemetry session. Which data is shown in the lists depends on filterings (postprocessing) settings. It can be raw data (the Raw Data is the data that exactly stored in the file) or processed data (peak filtering, smooth filtering, etc. In this case some data can be hidden/skipped).
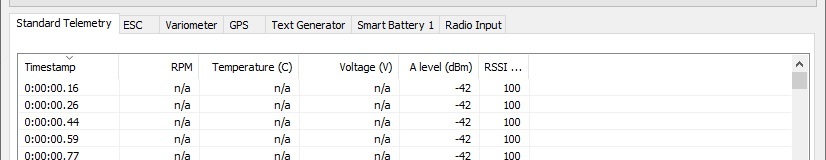
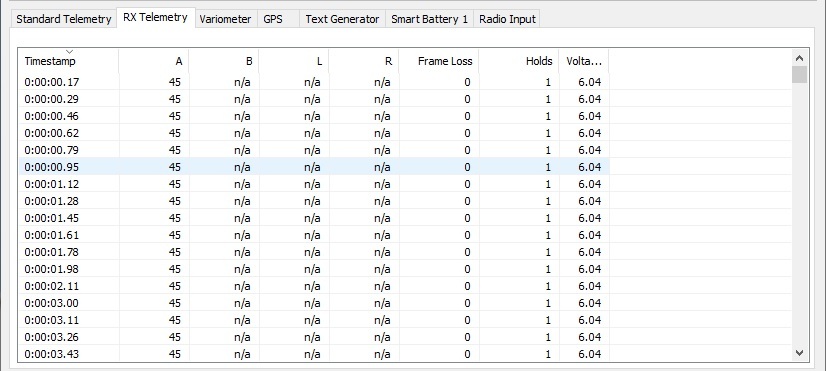
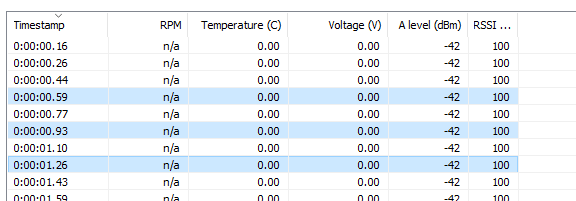
The shown columns for different sensors are different except the Timestamp column. Timestamp column shows record time in format hours:minutes:seconds.milliseconds. It is relative value calculated from session start. Other columns depends on the sensor and shows sensors data. For exmaple, on the image below you can see the RX sensor data.
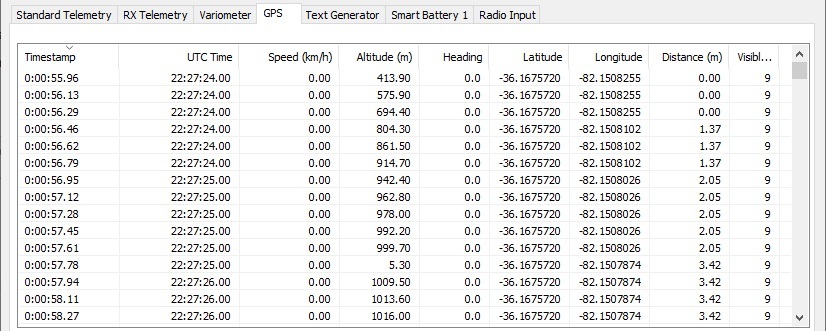
And the next image shows GPS sensor data.
You can change data sorting order by clicking on a data column. By default a sensor data is sorted by timestamp. The sort ordering is shown by a small arrow above the column name. You can see that arrow above the Timestamp column. The arrow pointing down means ascending sorting. The arrow pointing up means descending sorting.
Sensor Data Columns
Some sensors may have lot of data or some data may be empty. So you may need to hide such columns to make data more readable or better for analizing. This also useful if you want to build a data graphics without shown the data you do not need.
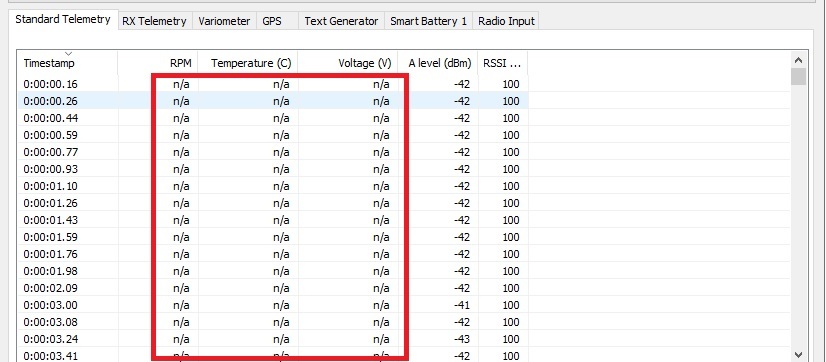
A sensor with empty data shown on the image above.
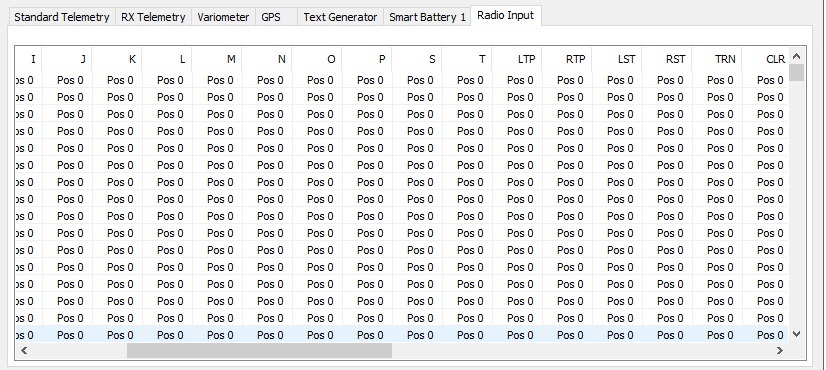
And the sensor with lot of data shown on the image above.
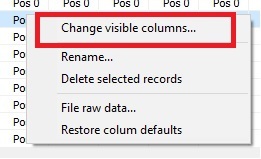
The software allows to hide columns you do not what to see. To do that simple right click on the seonsors data list and a popup menu appears. There are two possible menu configuration for sensor data columns management. The first one is a "Column Visability Editor" dialog. To open it click on "Change visible columns..." menu item.
And the "Column Visability Editor" dialog opens.
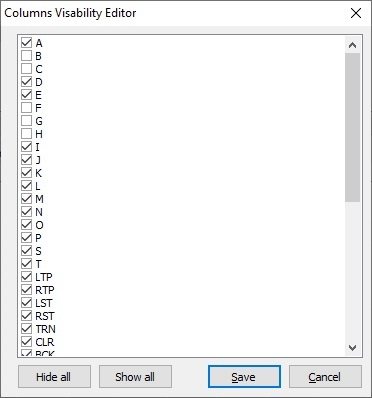
There you can select which columns should be shown. Click "Hide all" to hide (uncheck) all the columns. Only the "Timestamp" column will be visible. Click "Show all" to show all possible data for the selected sensor. Click "Save" to save changes you made. Click "Cancel" to discard the changes.
The second way to change visible columns is through popup menu. The usage is similat to the sensors tab menu described above.
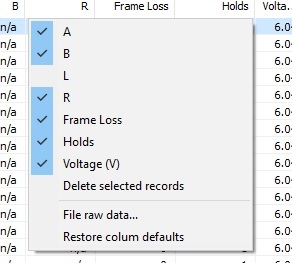
The columns configuration method depends on the application settings. The first way (with the dialog) is good if your model telemetry has sensors with lot of data (for example, Radio Inout). The second way (with menu) is good if your model telemetry includes only sensors with small data (for example, Standard Telemetry).
You can easy revert all columns changes by simple selecting "Restore column defaults" from the poup menu.
Session Editing
If a sensor data contains rows with "bad" data or if you need to work with just a small amout of your telemetry session data you can delete rows from the sensor data. To do that simple right click on a row you want to delete and select "Delete selected records" menu item from the popup menu. You can also delete few rows. To do that click on first row you want to delete then press and hold the Shift button on your keyboard, scroll down to the last row you want to delete and select it. Then right click on selected rows and select "Delete selected records" menu item from the popup menu.
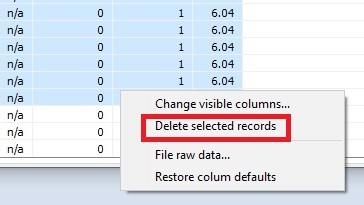
You can also use the Control key to select few rows. Select first one. The press and hold the Control key on your keyboard and click on items you want to delete. Then right click on any selected row and select "Delete selected records" menu item from the popup menu.
If you deleted some records and the select other session the application asks to save changes. If you click "Yes" the "Export session" menu opens. If you click "No" all the changes will be reverted. The Export session described below in the "Export to TLM" part.
Copy Records
You can also copy selected records to clipboard (as comma separated text) and then past it to Excel or any other file you want. Simple selected records you want to copy as dexribed above (Session Editing section) and select "Copy selected records".
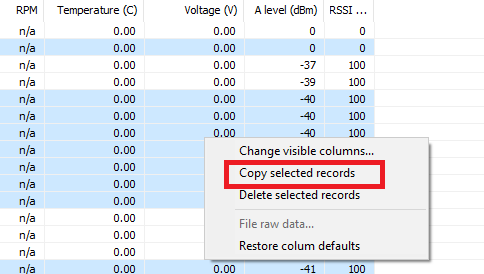
The selected records will be copied to the clipboard. You can select one or more records.
Raw Sensor Data
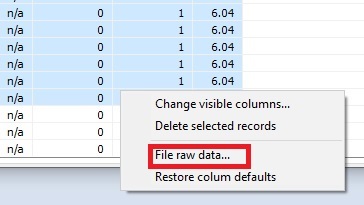
If you develop own sensor or want to find what is going wrong with your model or telemetry data you can see the raw sensor data as it is stored in a TLM file. This option available only if the Post Processing set to None. To view raw data select "File raw data..." from the sensor popup menu.
The Raw Data dialog opens.
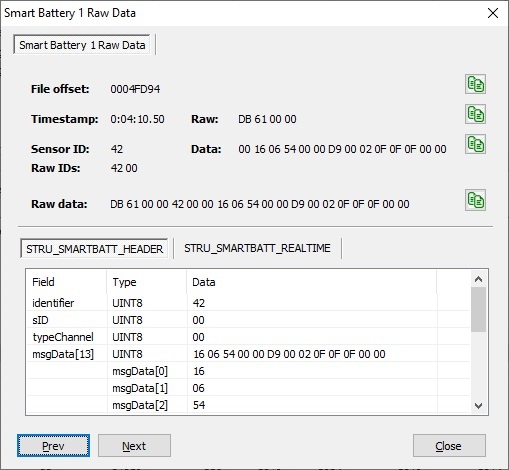
There you can see:
File offset - the data offset in the TLM file. You can this value to fast find the data in the TLM file;
Decoded and raw Timestamp values;
Decoded (Sensor ID) and raw (Raw IDs) sensor ID;
Raw sensor data (Data);
All the raw data as it is stored in the file (Raw data)
Below you can find a sensor data as it is encoded in the Spektrum defined structure. Some rows for some sensor may contain more than single sensor data structure (as on exaple above).
The "Green Buttons" right next to data allows to copy value to the clipboard so you can then simple paste it in your HexEditor or other application you use for opening your TLM file as raw bytes.
The "Prev" and the "Next" buttons allow to move by sensor data rows without closing the dialog.
Additional Sensor Information
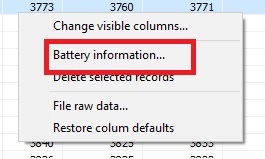
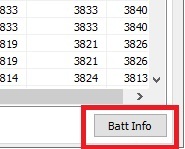
Some sensors provide additional information. In this case additional menu item appears in the sensor popup menu. For example the Smart Battery sensor provides common information about used battery and the "Battery information..." meanu item is added to the popup menu.
If you select this menu item the "Smart Battery Information" dialog appears.
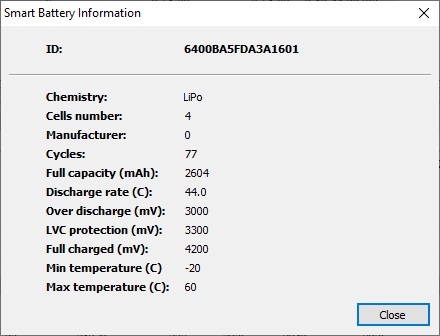
You can also use "Batt info" button to see that dialog.
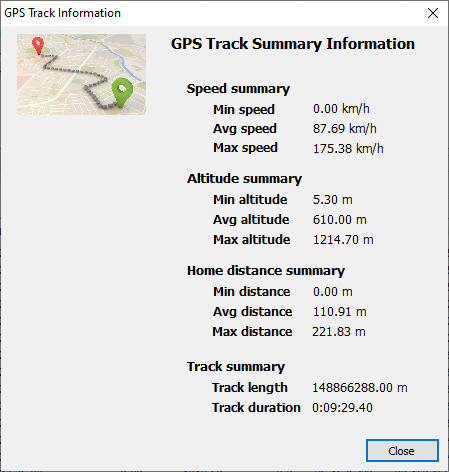
The GPS sensor also provides additional information.
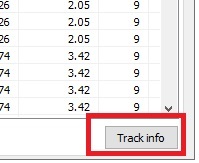
If you click the "Tack info" button the "GPS Track Information" dialog opens.
Please note that not all sensors allows to get additional information.
Renaming Columns
There is an option to rename columns for some sensors: Radio Input, User Defined, some others. If the sensor allows to rename columns the "Rename..." menu item appears in the sensor popup menu.
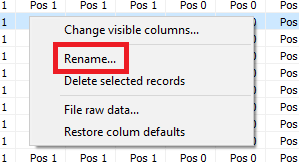
When you select this menu item the "Rename User Sensor Columns" dialog opens.
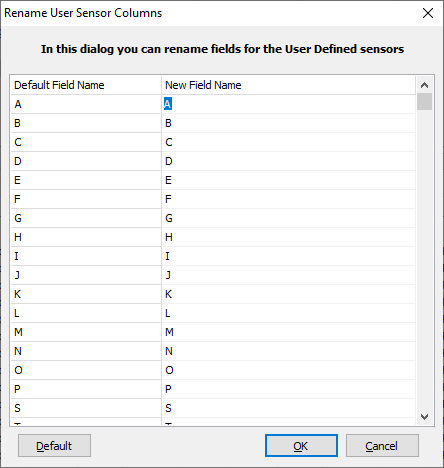
In this dialog you can see the default columns name and change it by typing new name in the "New Field Name" column. Click "OK" to apply your changes, click "Cancel" to revert the changes and click "Default" to restore default columns names.
Settings
All the settings made on the sensors tabs (visible columns, columsn name, etc) are stored per modem and per sensor. When you open a telemetry file that contains data for the same model and open the same sensor tab all the previously made changes apply to this opened file. However there is some global (per application) and model specific (per model) settings. To edit global application settings click the "Settings" button.
Application Settings
When you clicked the "Settings" button the "Application Settings" dialog opens. On the "Global Settings" tab you can adjust global (per application) settings.
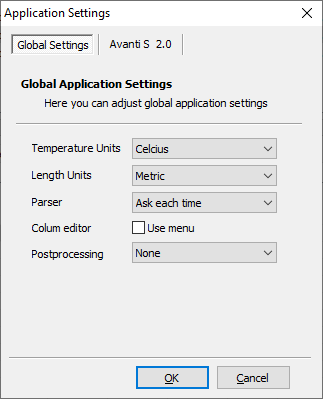
On the "Global Settings" tab you can edit settings that apply to all models. They are:
Temperature Units - how the temperature value should be shows: as Celcius or as Fahrenheit;
Length Units - how the length (distance, altitude, speed) should be should: as Metric (meters) or as Emperial (foots);
Parser - there you can tell the application to ask which parser should be used when file is opened. Ask each time - the application will show parser selection dialog when you open a telemetry file (see details in the "Opening a TLM File" section). New parser - always use new parser. Old parser - always use old parser. Also if you checked the "Do not ask again" check box in the "Select parser" dialog then here you can change that selection;
Column editor - check the "Use menu" check box to show columns as menu items when you what to hide/show them. Uncheck the "Use menu" (the default value) to use "Columns Visability Editor" dialog;
Postprocessing - controls how a sensor data should be processed. "None" - no postprocessing applied and the data shown as it appears in the file. (The "File raw data..." menu is available only with this setting). "Simple filter" - applies some basic peak and "invalid data" filtering. Does not change the data but removes some rows with data that looks incorrect/invalid. "Peak filter" - applies very simple peak filtering. As this filtering type may cause RX telemetry be incorrect because of removing some important rows, you can enable/disable this filtering for RX telemetry bu checking/unchecking the "Enable RX filtering" checkbox. "Smooth" - applies simple smoothing filtering with "floating window". Also can be enabled/disabled for RX telemerty. The "window" size can also be adjusted. This filtering makes graphics looks smoother.
Click "OK" to save settings. Click "Cancel" to reject all changes.
Model Settings
You can also adjust some global (per model) model specific settings in the "Application Settings" dialog. To view these setting click the tab with model name.
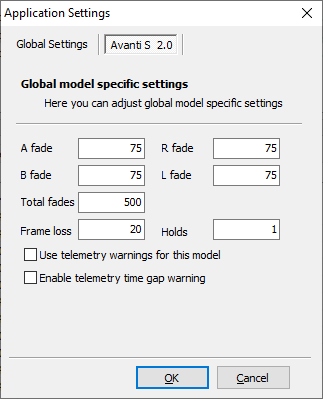
There you can adjust the warnings thresholds, enable/disable telemetry warning (with specified tresholds) and enable/disable time gap warnings.
Click "OK" to save settings. Click "Cancel" to reject all changes.
Exporting Data
You can export sensor(s) data to csv, kml and tlm files. The available file type depends on the sensor and on the "Mix Data" check box state. To export data click the "Export" button.
Export to CSV
You can export any sensor data to csv file. To do that open the sensor you would like to export and click the "Export" button. The "Export session" dialog opens and you can provide the csv file name there. Make sure that the file type is "Comma Separated File (*.csv)".
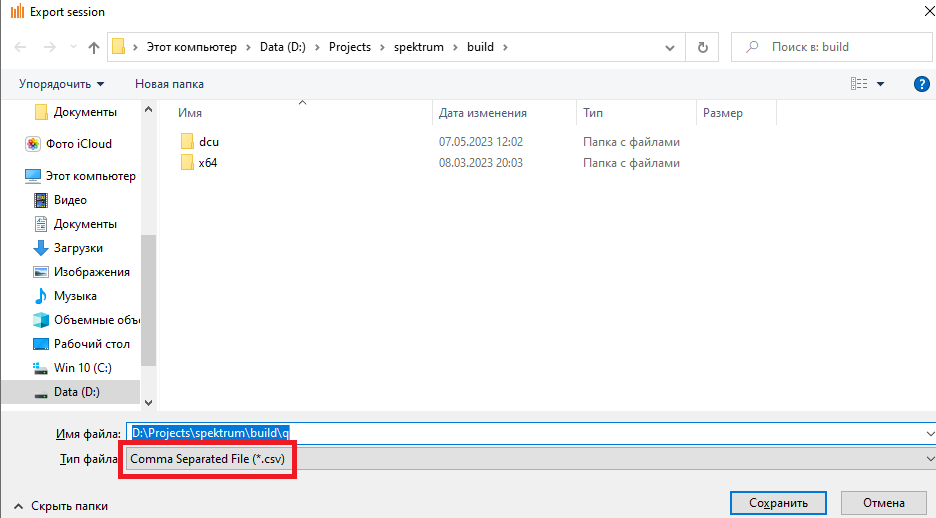
Click "Save" to save the file. Click "Cancel" to cancel exporting. Once you click "Save" all the selected sensors data will be save to the file with given name in the given location. Only visible columns will be exported and if you deleted some rows from the sensors data list these rows will NOT be exported.
If the "Mix data" checkbox is checked then after "Export session" dialog the "Select Data for Graph" dialog opens.
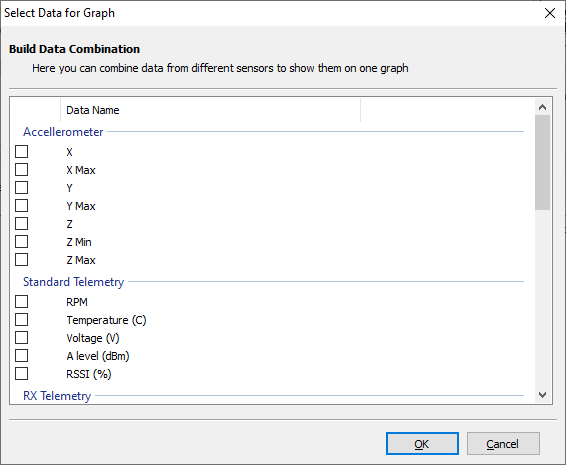
This dialog allows to combine different sensors data in a single csv file. Check sensors data you want ot export and click "OK". The selected data from the selected sensors will be saved to the specified file.
Export to TLM
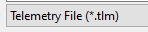
If the "Mix data" checkbox is unchecked you can export current (or all) sessions to new TLM file. Select "Telemetry file (*.tlm)" as the file type and click "Save" button.
The new TLM file with session data will be created. If you deleted some rows in sensors data then tese deleted rows will not be saved in the new file.
If the "Export all sessions" checkbox is checked than all sessions will be exported (except sessions you deleted). If that checkbox is unchecked then only current (selected) session will be exported.
Export to KML
The Telemetry Viewer allows to export your GPS data to KML file that can be opened with Google Earth application and you can see your flight track there.
To export GPS data to KML open the GPS sensor tab.
And click the "Export" button. Make sure that the "Mix data" and the "Export all sessions" checkboxes are unchecked. Select "Google Earth File (*.kml)" in the file type drop down box.
Provide the file name and click "Save". The KML file with your GPS track will be created.
Building a Graphics
The software allows to view your telemetry data in graphic form. To build a data graphic simple click the "Graph Data" button.
By default (if the "Mix Data" checkbox is unchecked) the current sensor data will be shown. The graphic will include only visible columns. So if you hide some columns these hidden data will not appear on the graph. Also if you do not want/need to see some data you can simple hide these columns.
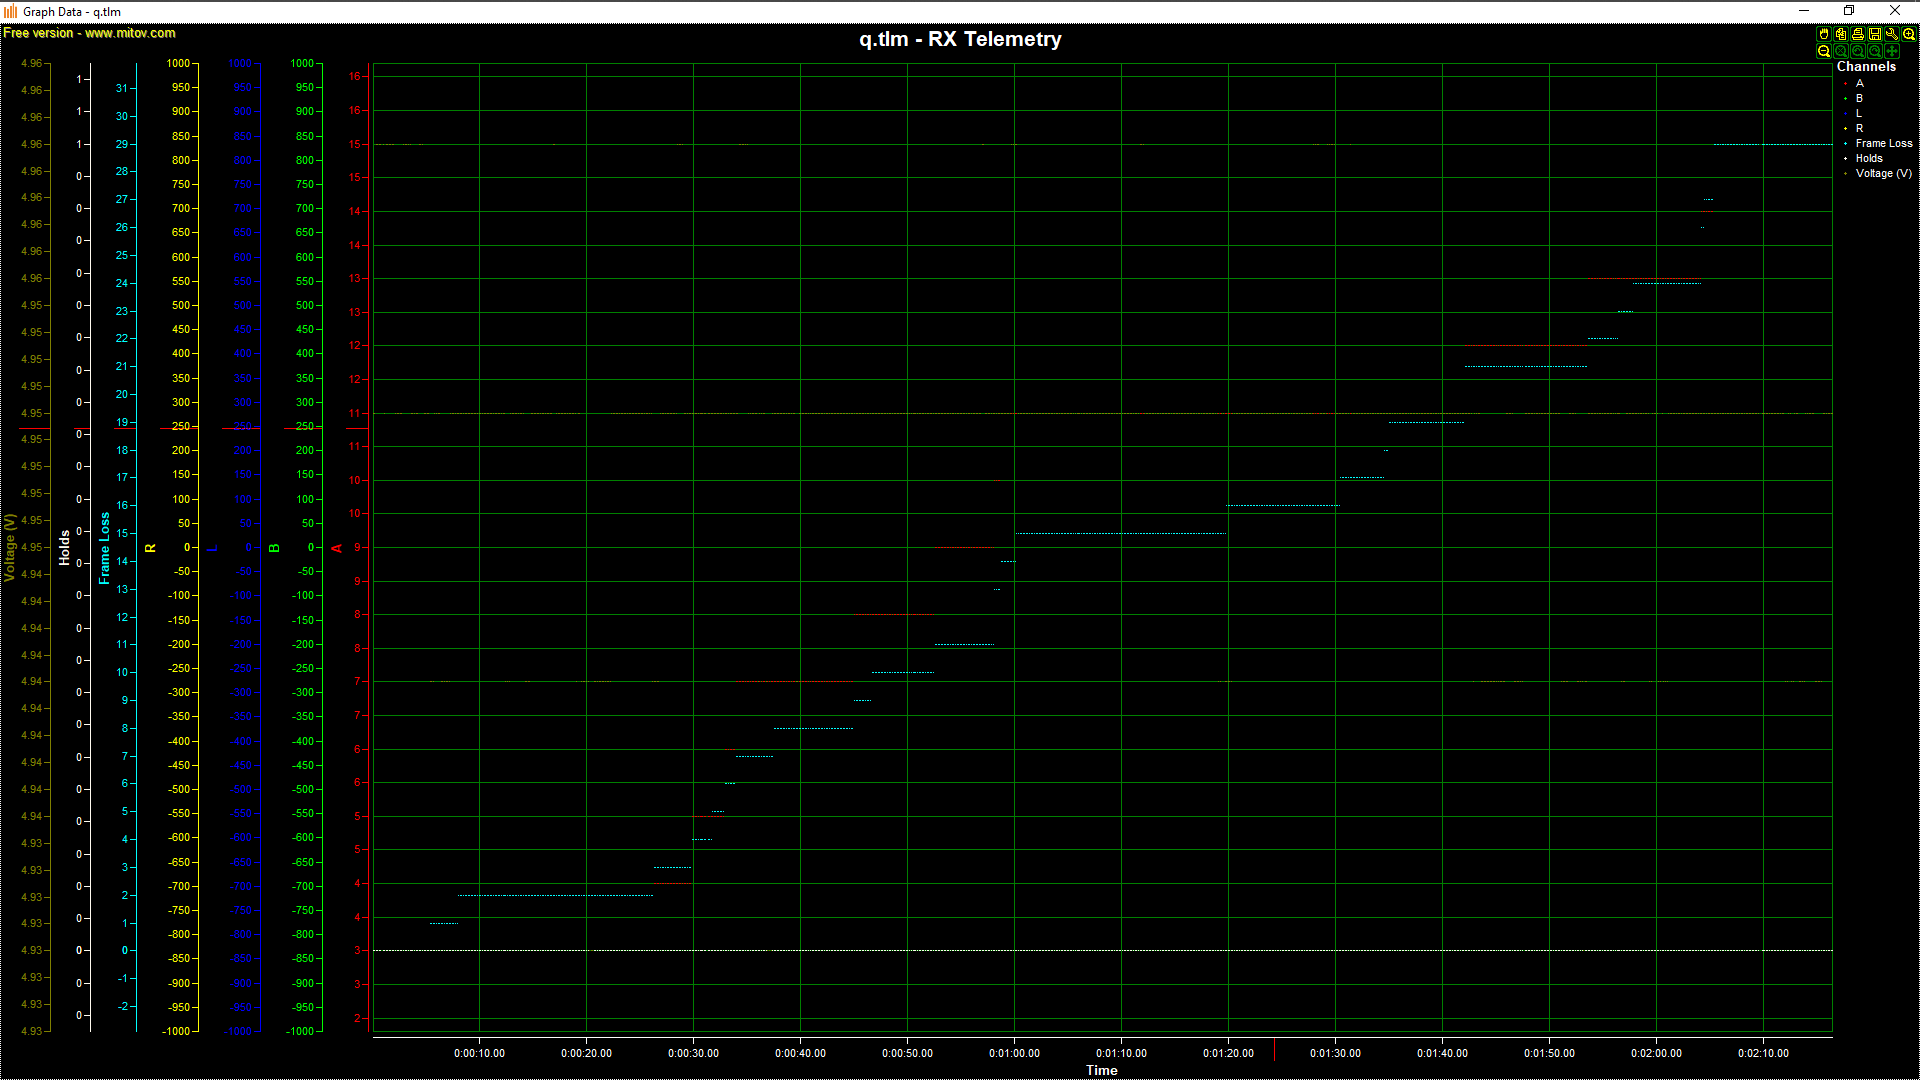
If the Postprocessing in the "Application Settings" was set to "None" the graphic appears as dots. With any other Post Processing settings the graphic appears as lines.
If the "Mix Data" checkbox is checked the "Select Data for Graph" dialog opens (see above). This allows to combine data from different sensors on a single graphic.
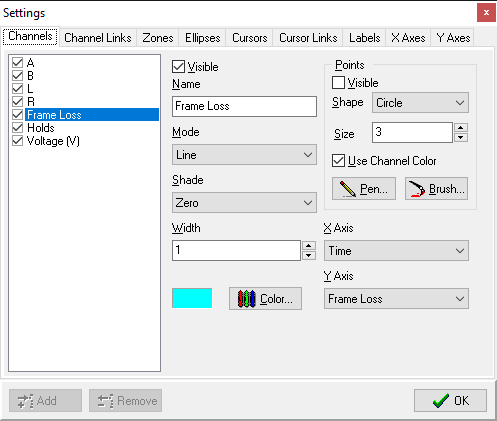
You can customize your graphic by clicking on the Channels box.
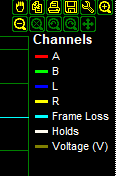
The "Settings" dialog opens and you can show/hide sensors, change lines colors, graphic style, etc.
Also you can save and print your graphics, zoom it in and out and lot of other things. Just play with it to find out all the features.
Thank you
Thank you for using Telemetry Viewer and for supporting me. This is free hobby software.
I also would like to say "Thank you" to Boian Mitov from Mitov Software who provided the best Graphic builder I have ever seen. To DevArt who developed the ever fastest VirtualTable implementation. To my customers who uses my Bluetooth Framework, WiFi Framework and other libraries. And to the guy from rcdesign forum who asked me to develop such software a long time ago. I hope he still uses this.
And of course to all the RCGroup (and especially to Andy Kunz) Spektrum community who helped me a lot with making this software better.