
An easy way to add SE bars and lettering on top of bars directly from the mean comparison test by using ggplot() function in R. To see the details visit the link below: https://agroninfotech.blogspot.com/2020/06/two-way-repeated-measures-analysis-in-r.html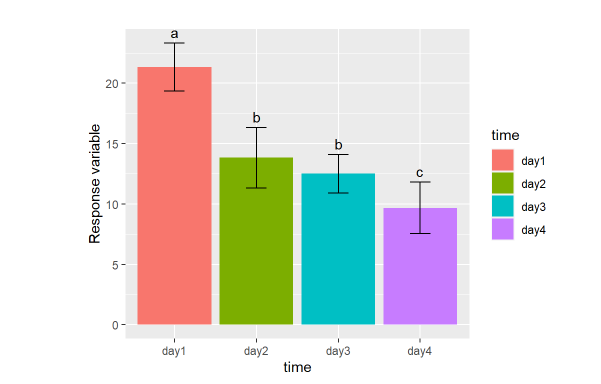
Bar plot with SE and lettering on it using ggplot() function in R
Jul 04, 2021
Enjoy this post?