
You will find the content below in this order:
1. The Good
2. The Bad
3. Key Levels
Brief Overview
On the weekly timeframe, VET still is bullish as we're holding above the key MAs. I would be concerned if we lost the 20-week.
If we can break through the LQZs on the 4H and daily timeframe, I would be looking for continuation depending on the market conditions at that point in time.
All in all, VET looks similar to BTC. We do have a few concerns with the bearish divergences, but they may be invalidated soon.
Weekly Timeframe
EMA Ribbon
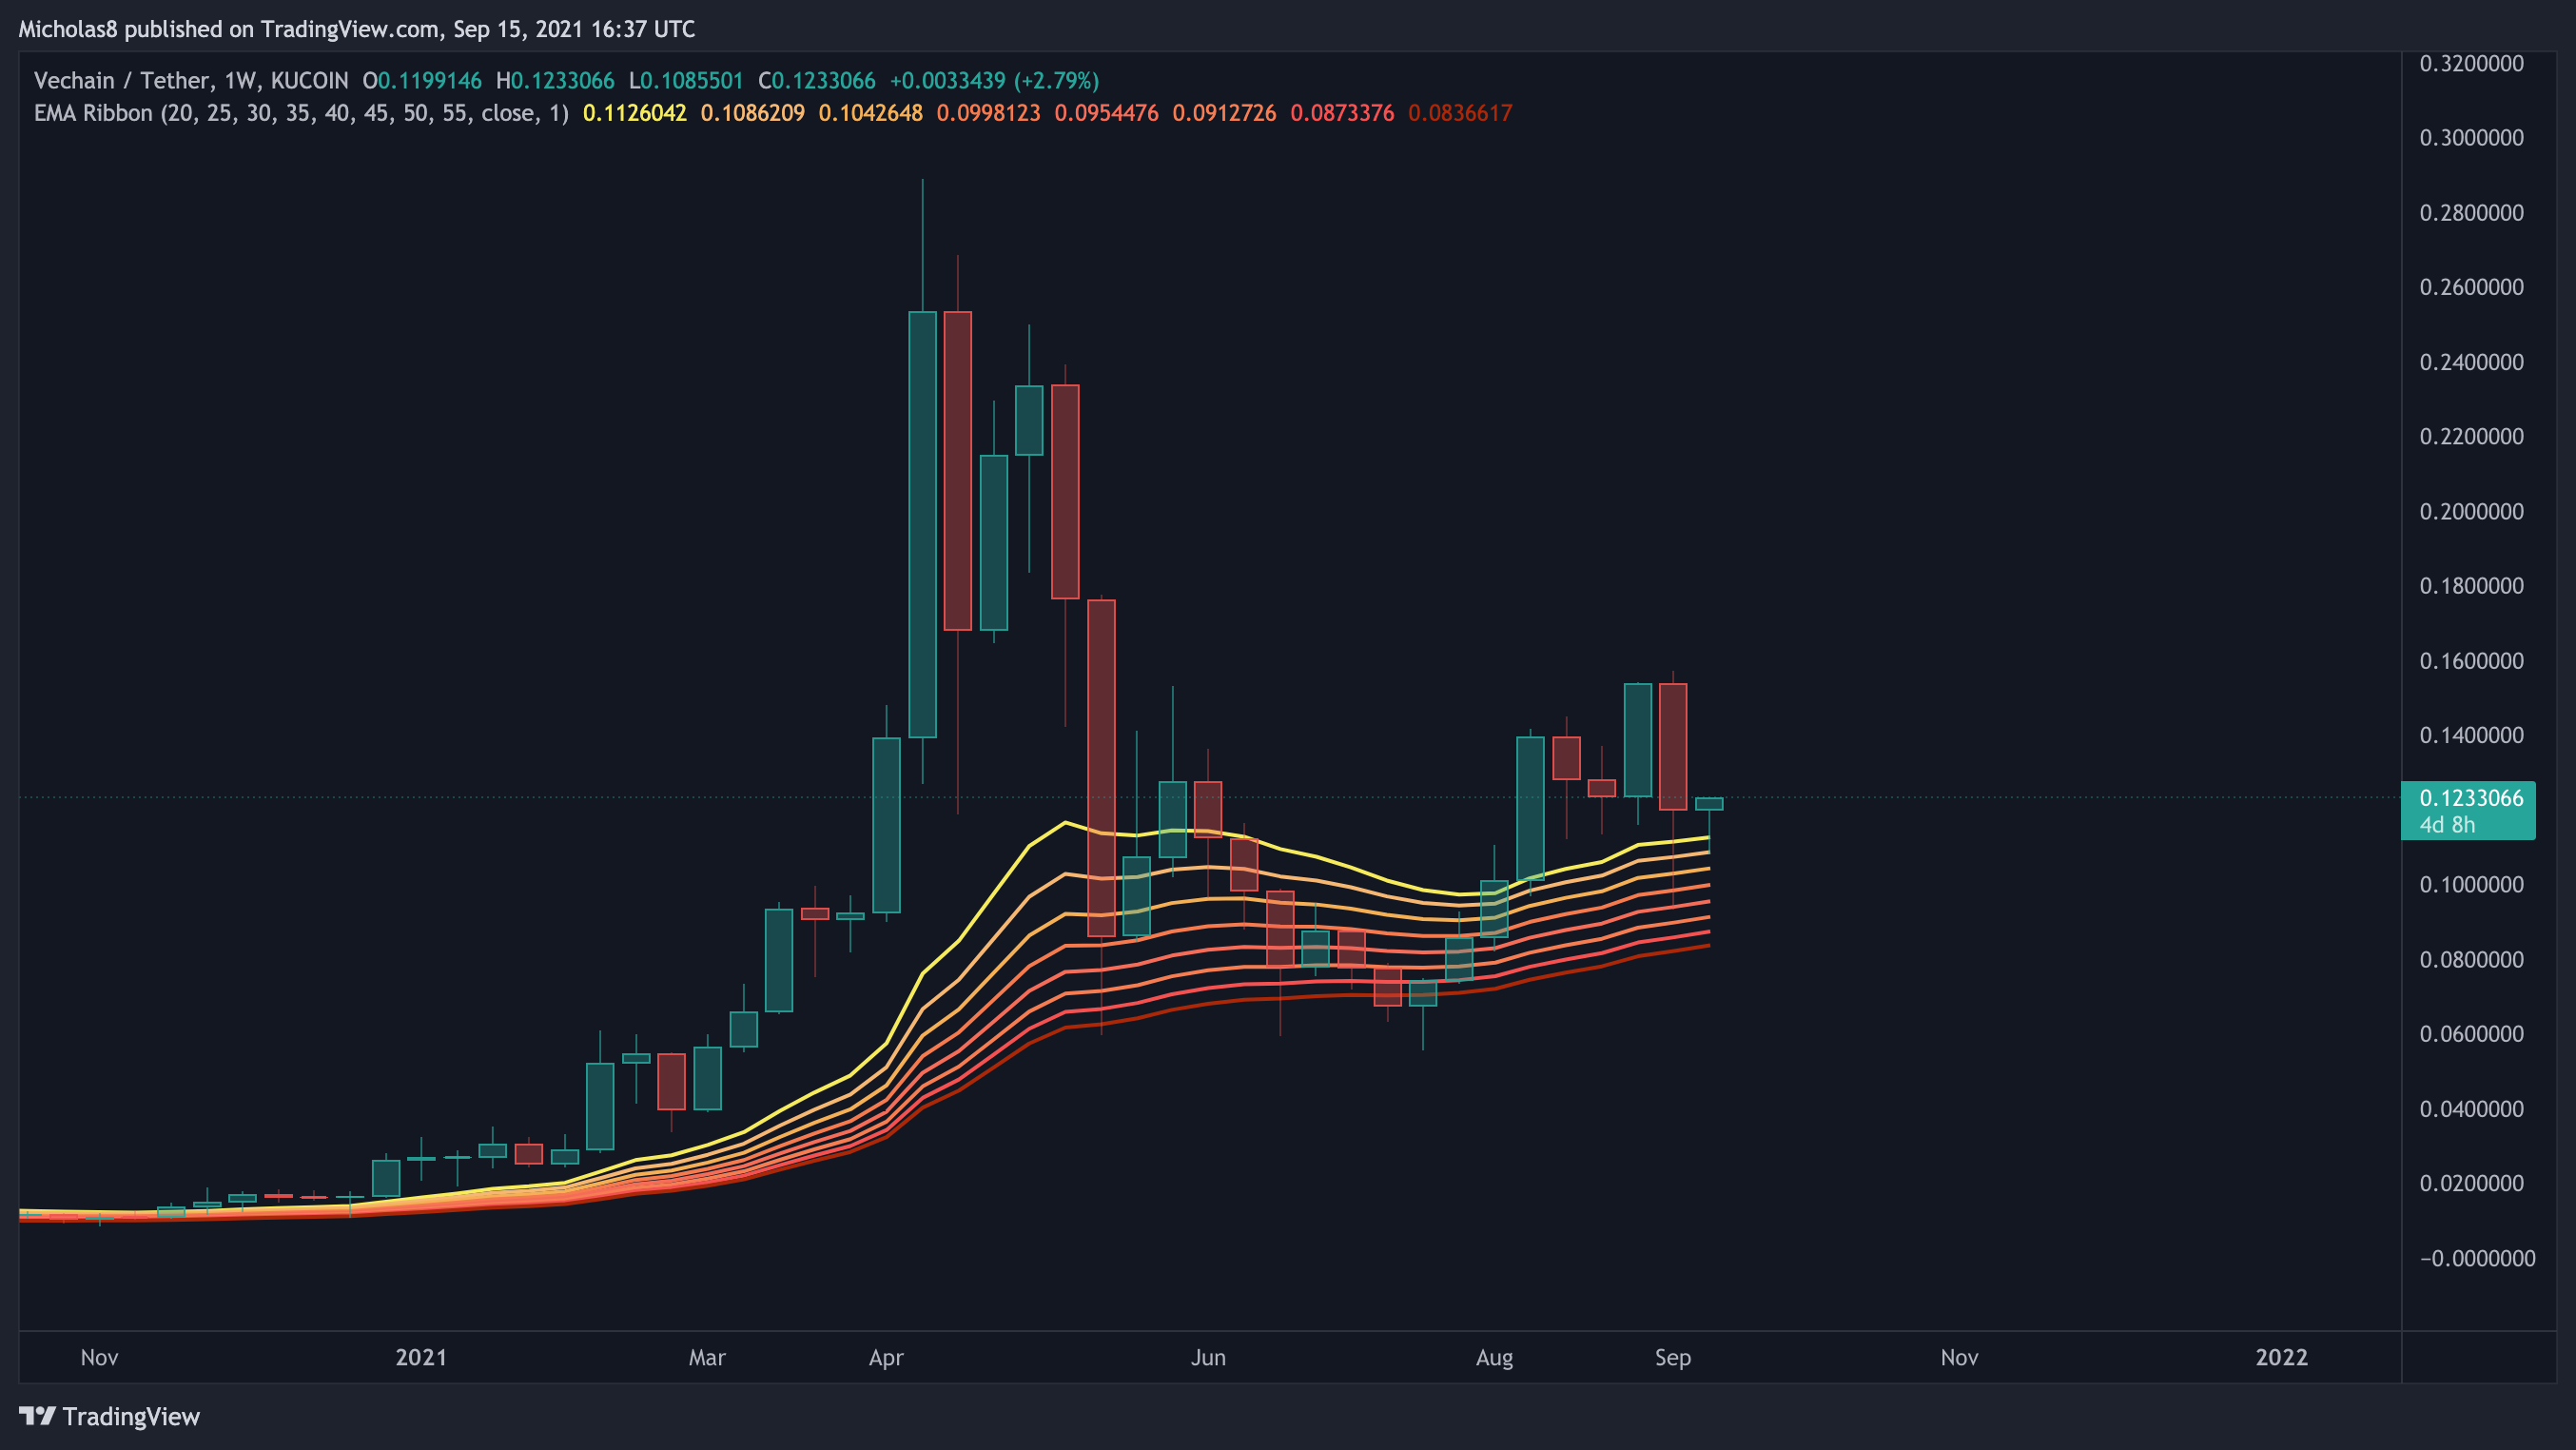
With regards to the EMA ribbon, VET continues to remain bullish from a macro perspective on the weekly timeframe. Ideally, we will see this continue to serve as support.
Simple Moving Averages (SMA): 20 and 50
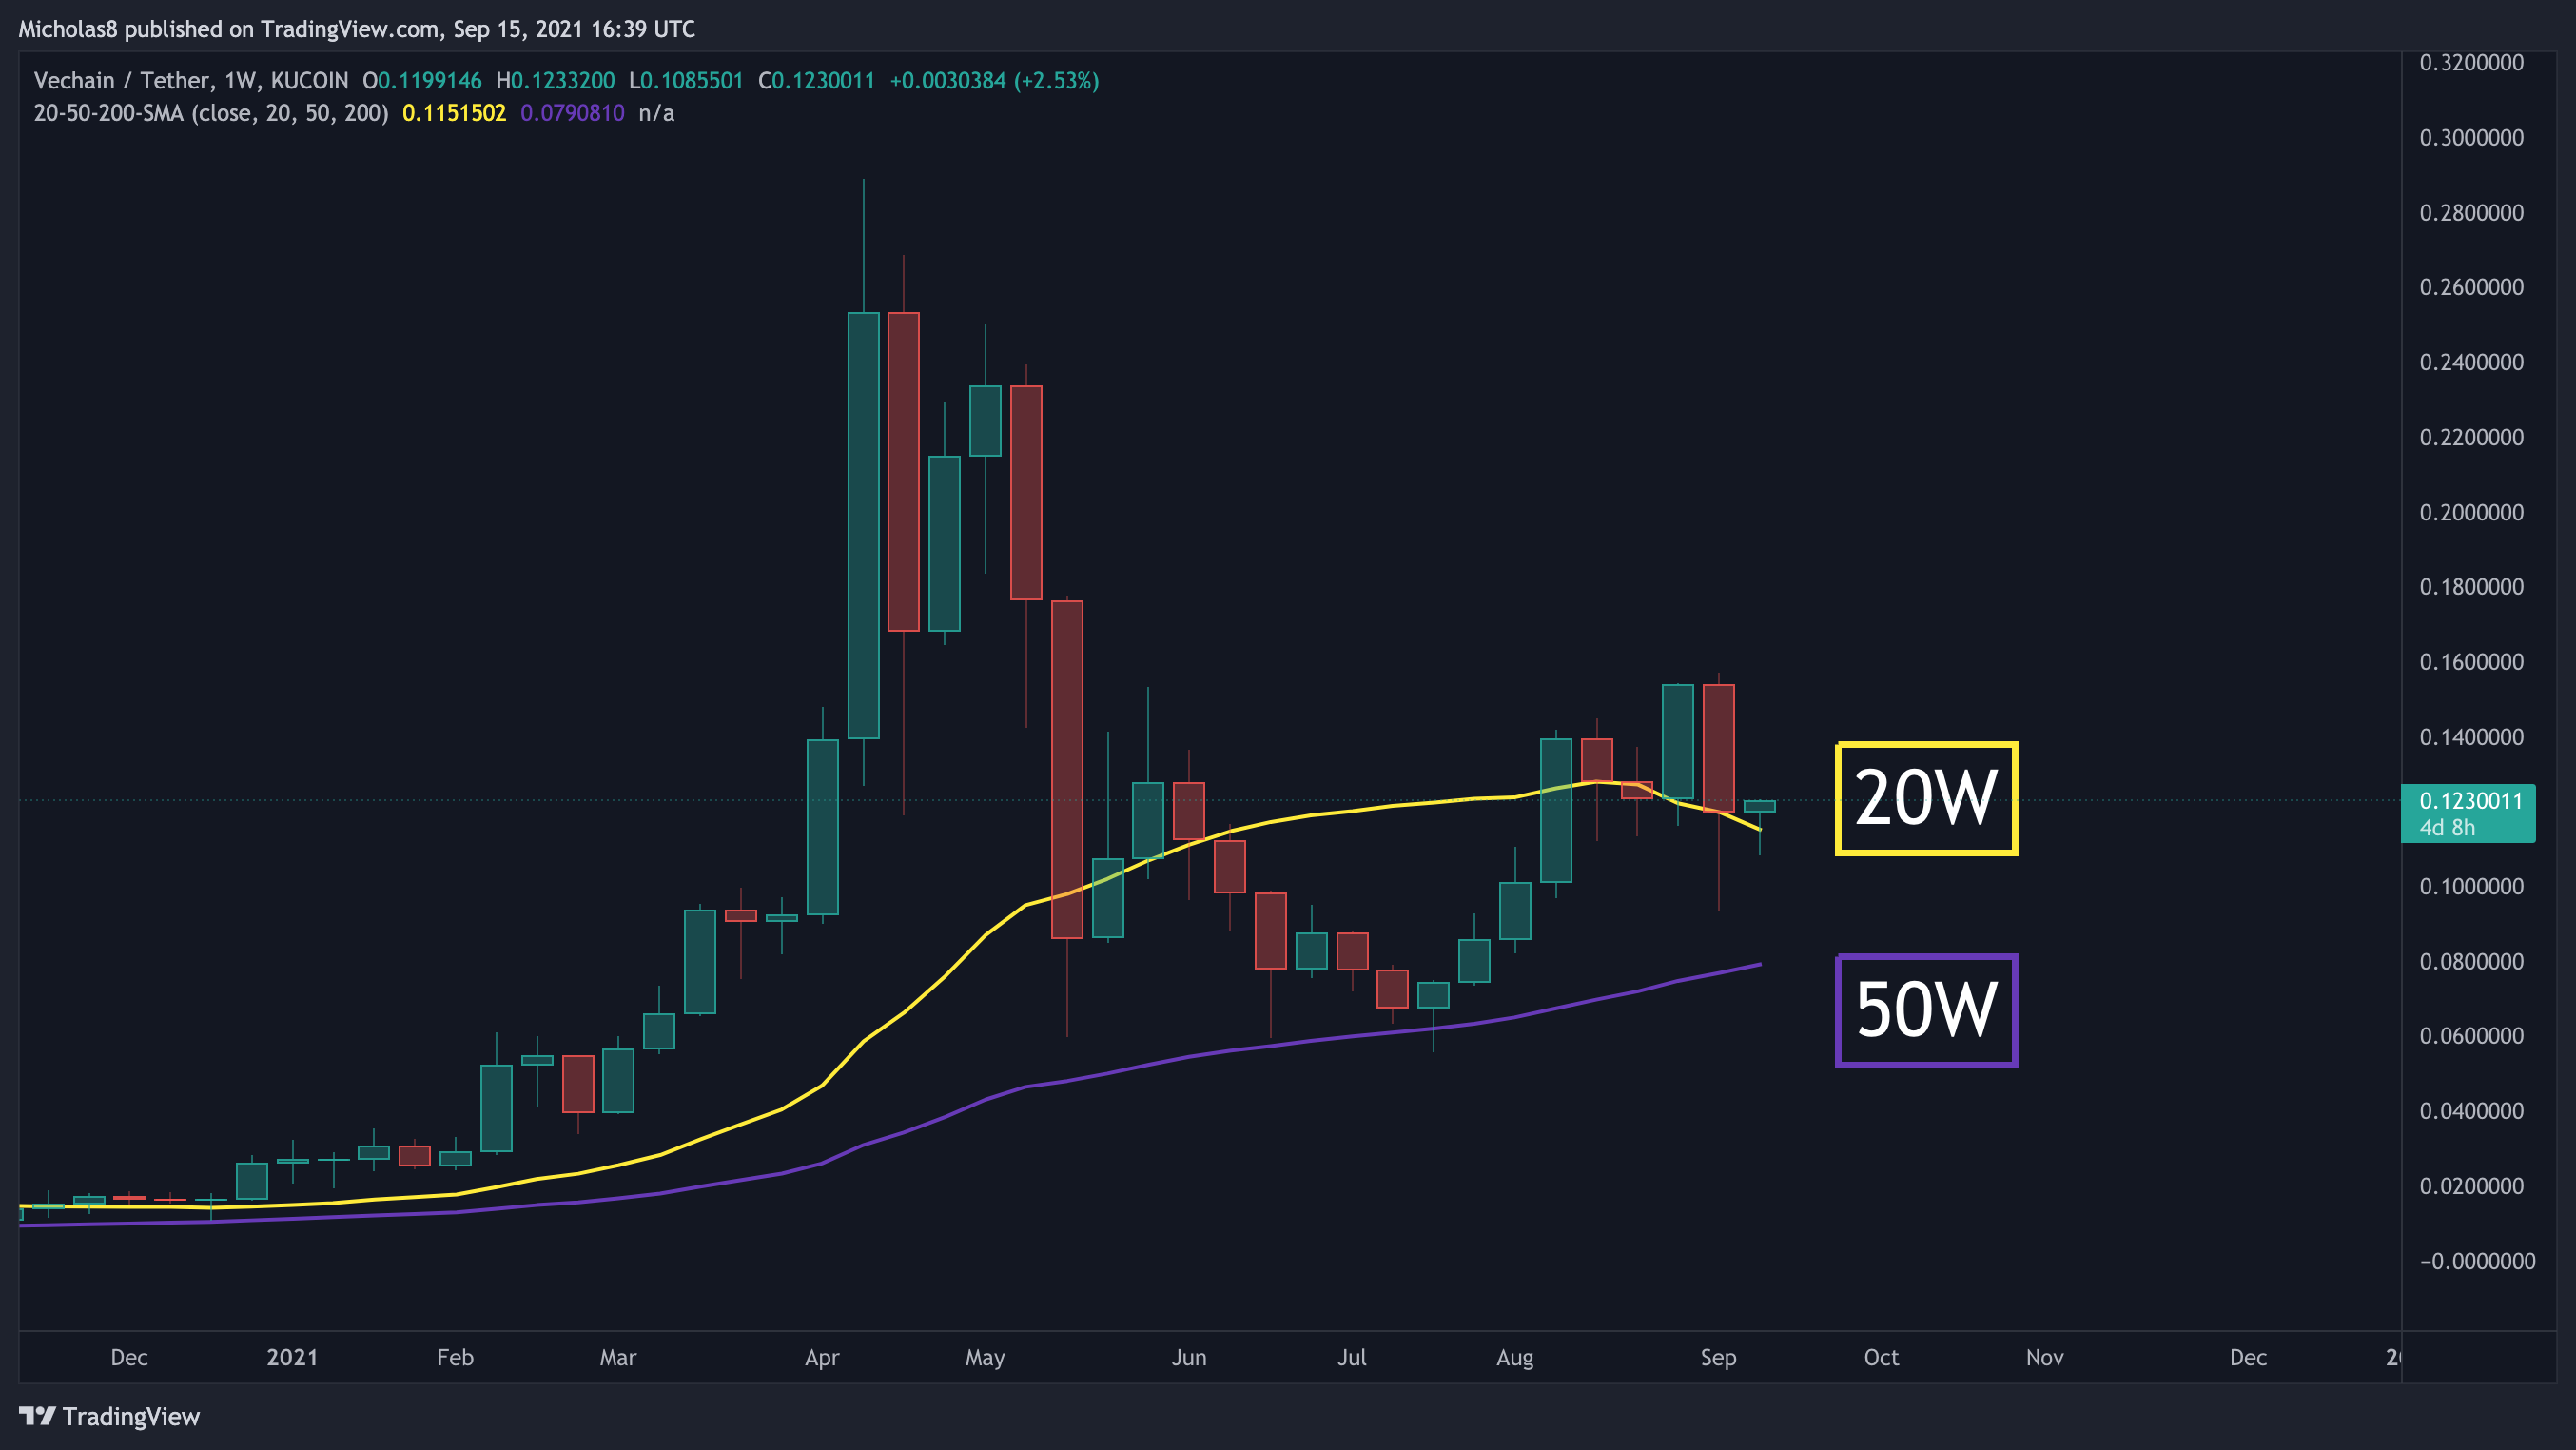
VET is currently trading above both of these SMAs. Ideally, when we next test them, they will serve as support as the 20W seems to be now.
Exponential Moving Averages (EMA): 8, 13 and 21
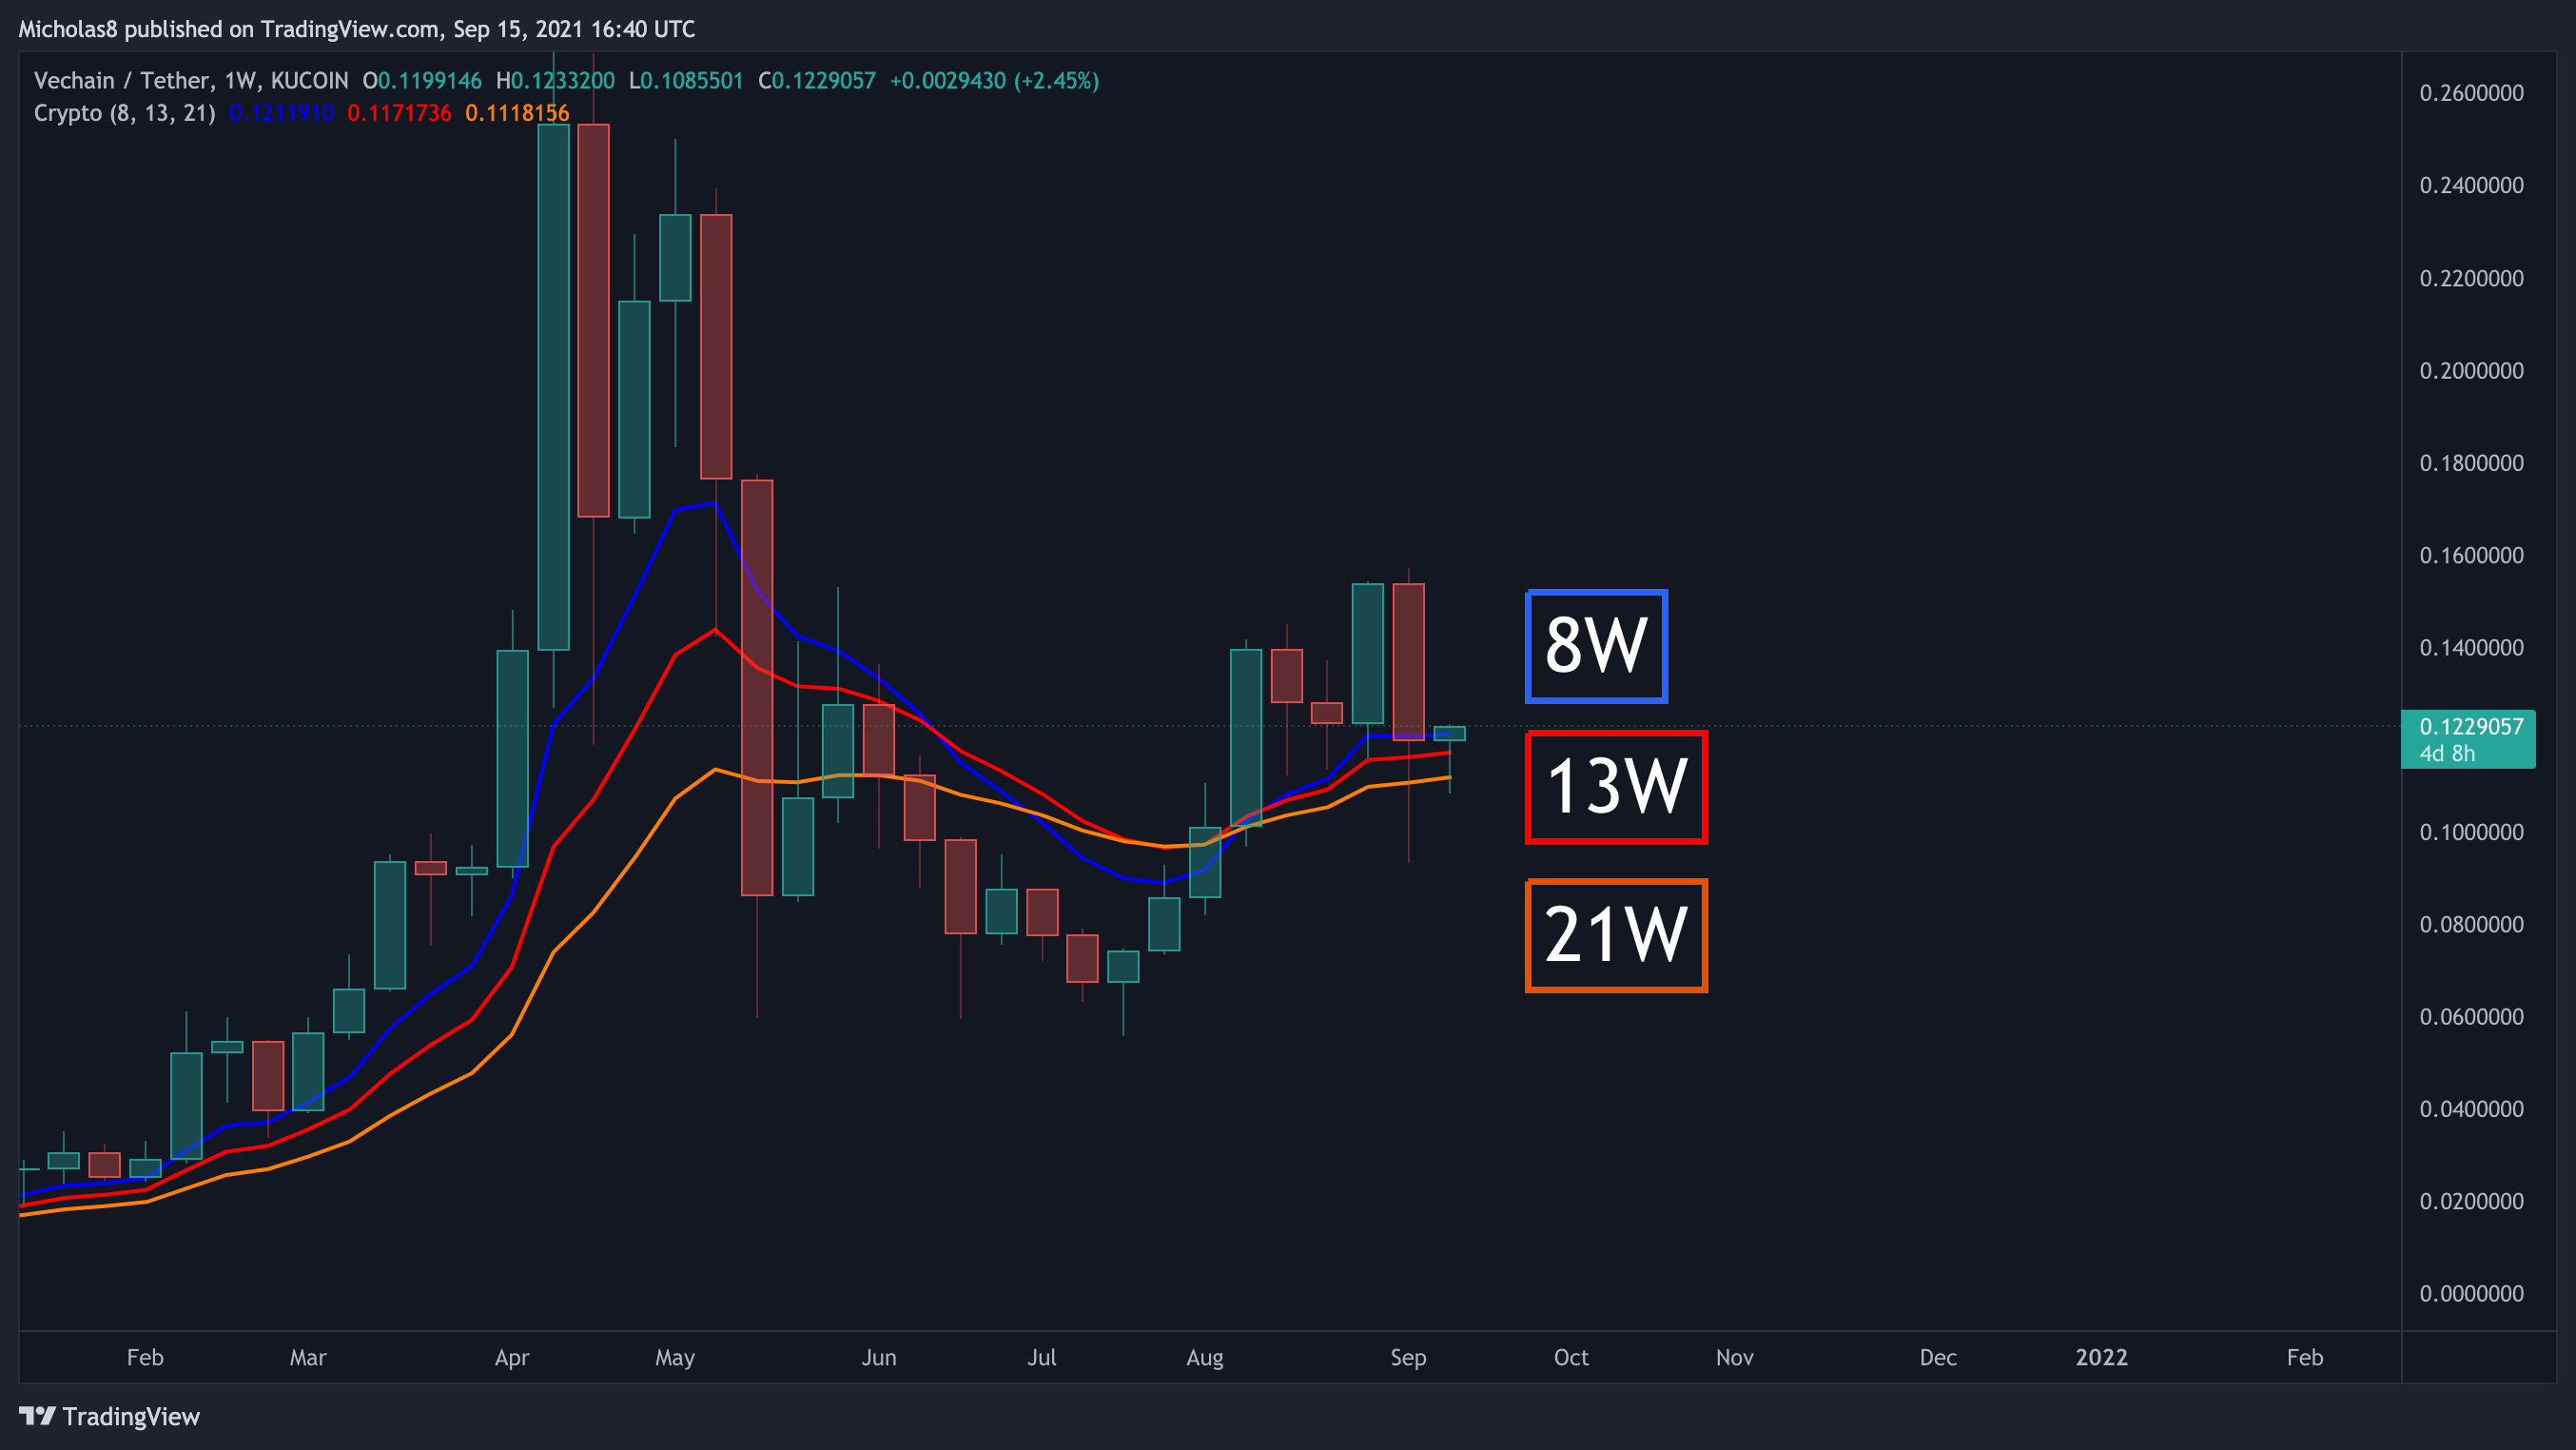
VET did close slightly below the 8 EMA last week but is trying to find support from all three of these EMAs this week. Ideally, they will serve as support.
Daily Timeframe
Structure
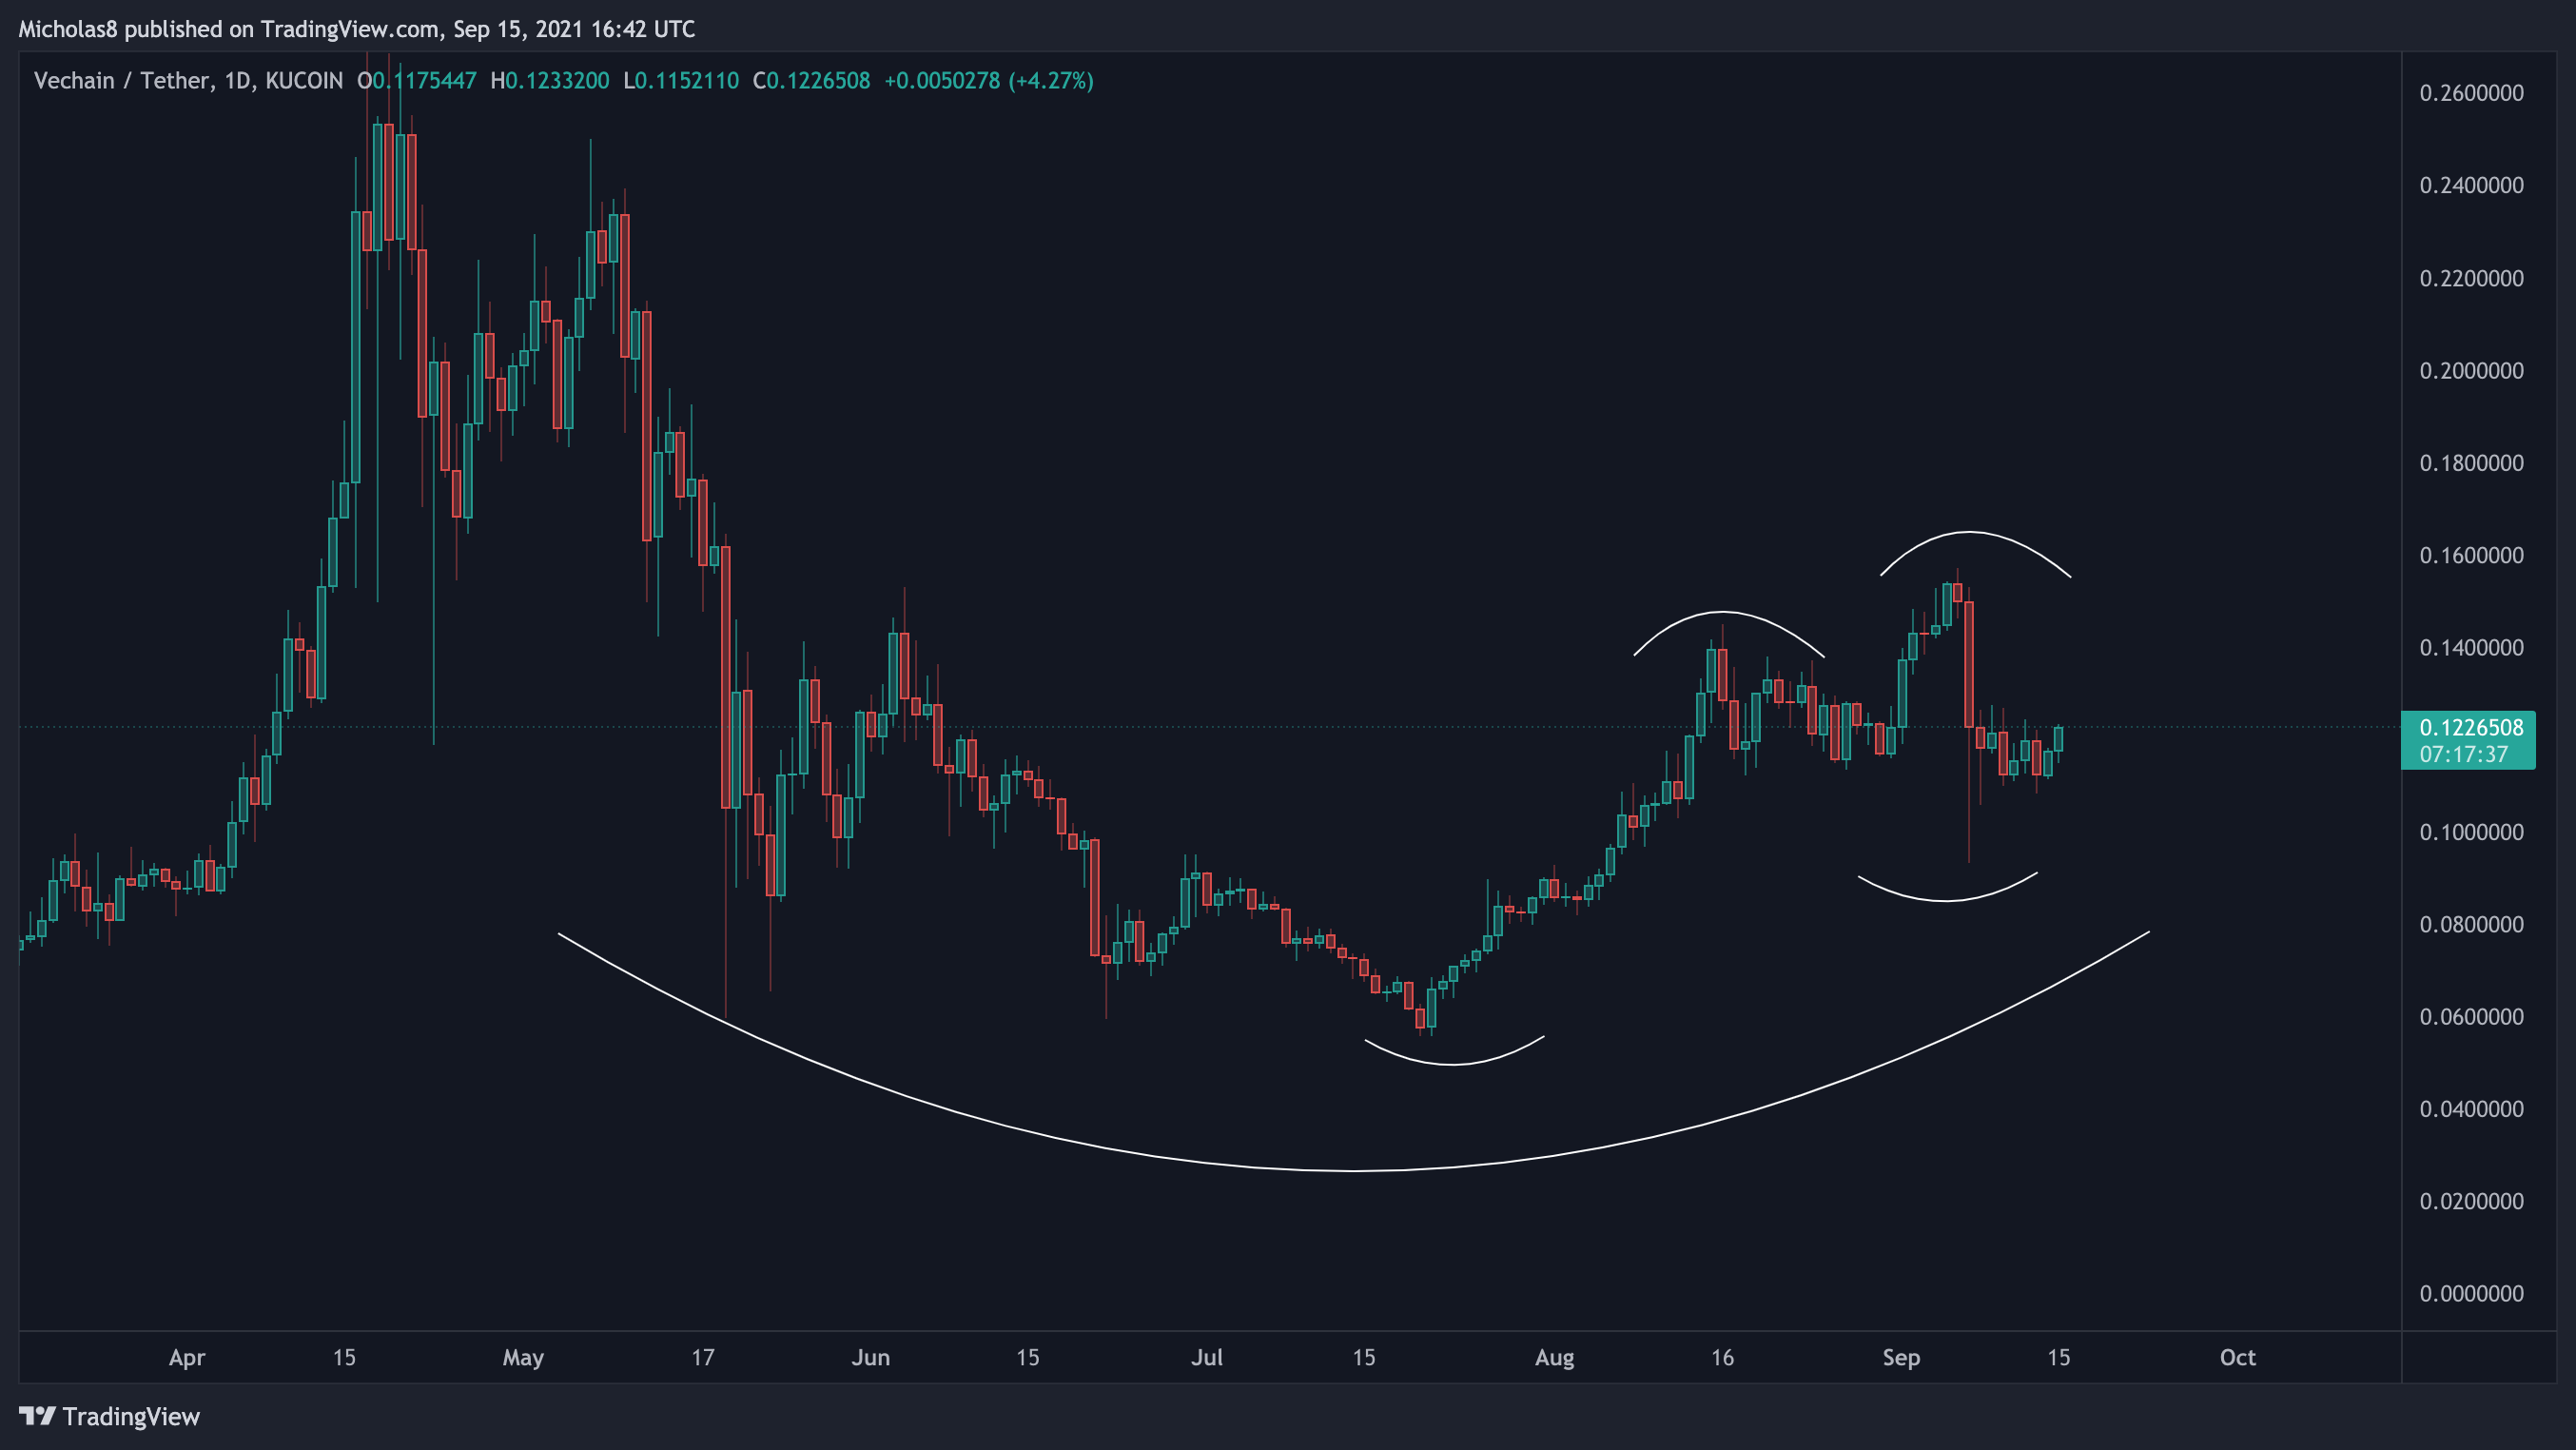
The macrostructure of VET is looking good. Outlined by the rounded bottom was an accumulation phase. What happens after the accumulation phase is called the 'mark-up' phase, where assets see a massive upside.
We are also maintaining this higher high and higher low structure which for now remains bullish!
Liquidity Zone (LQZ)
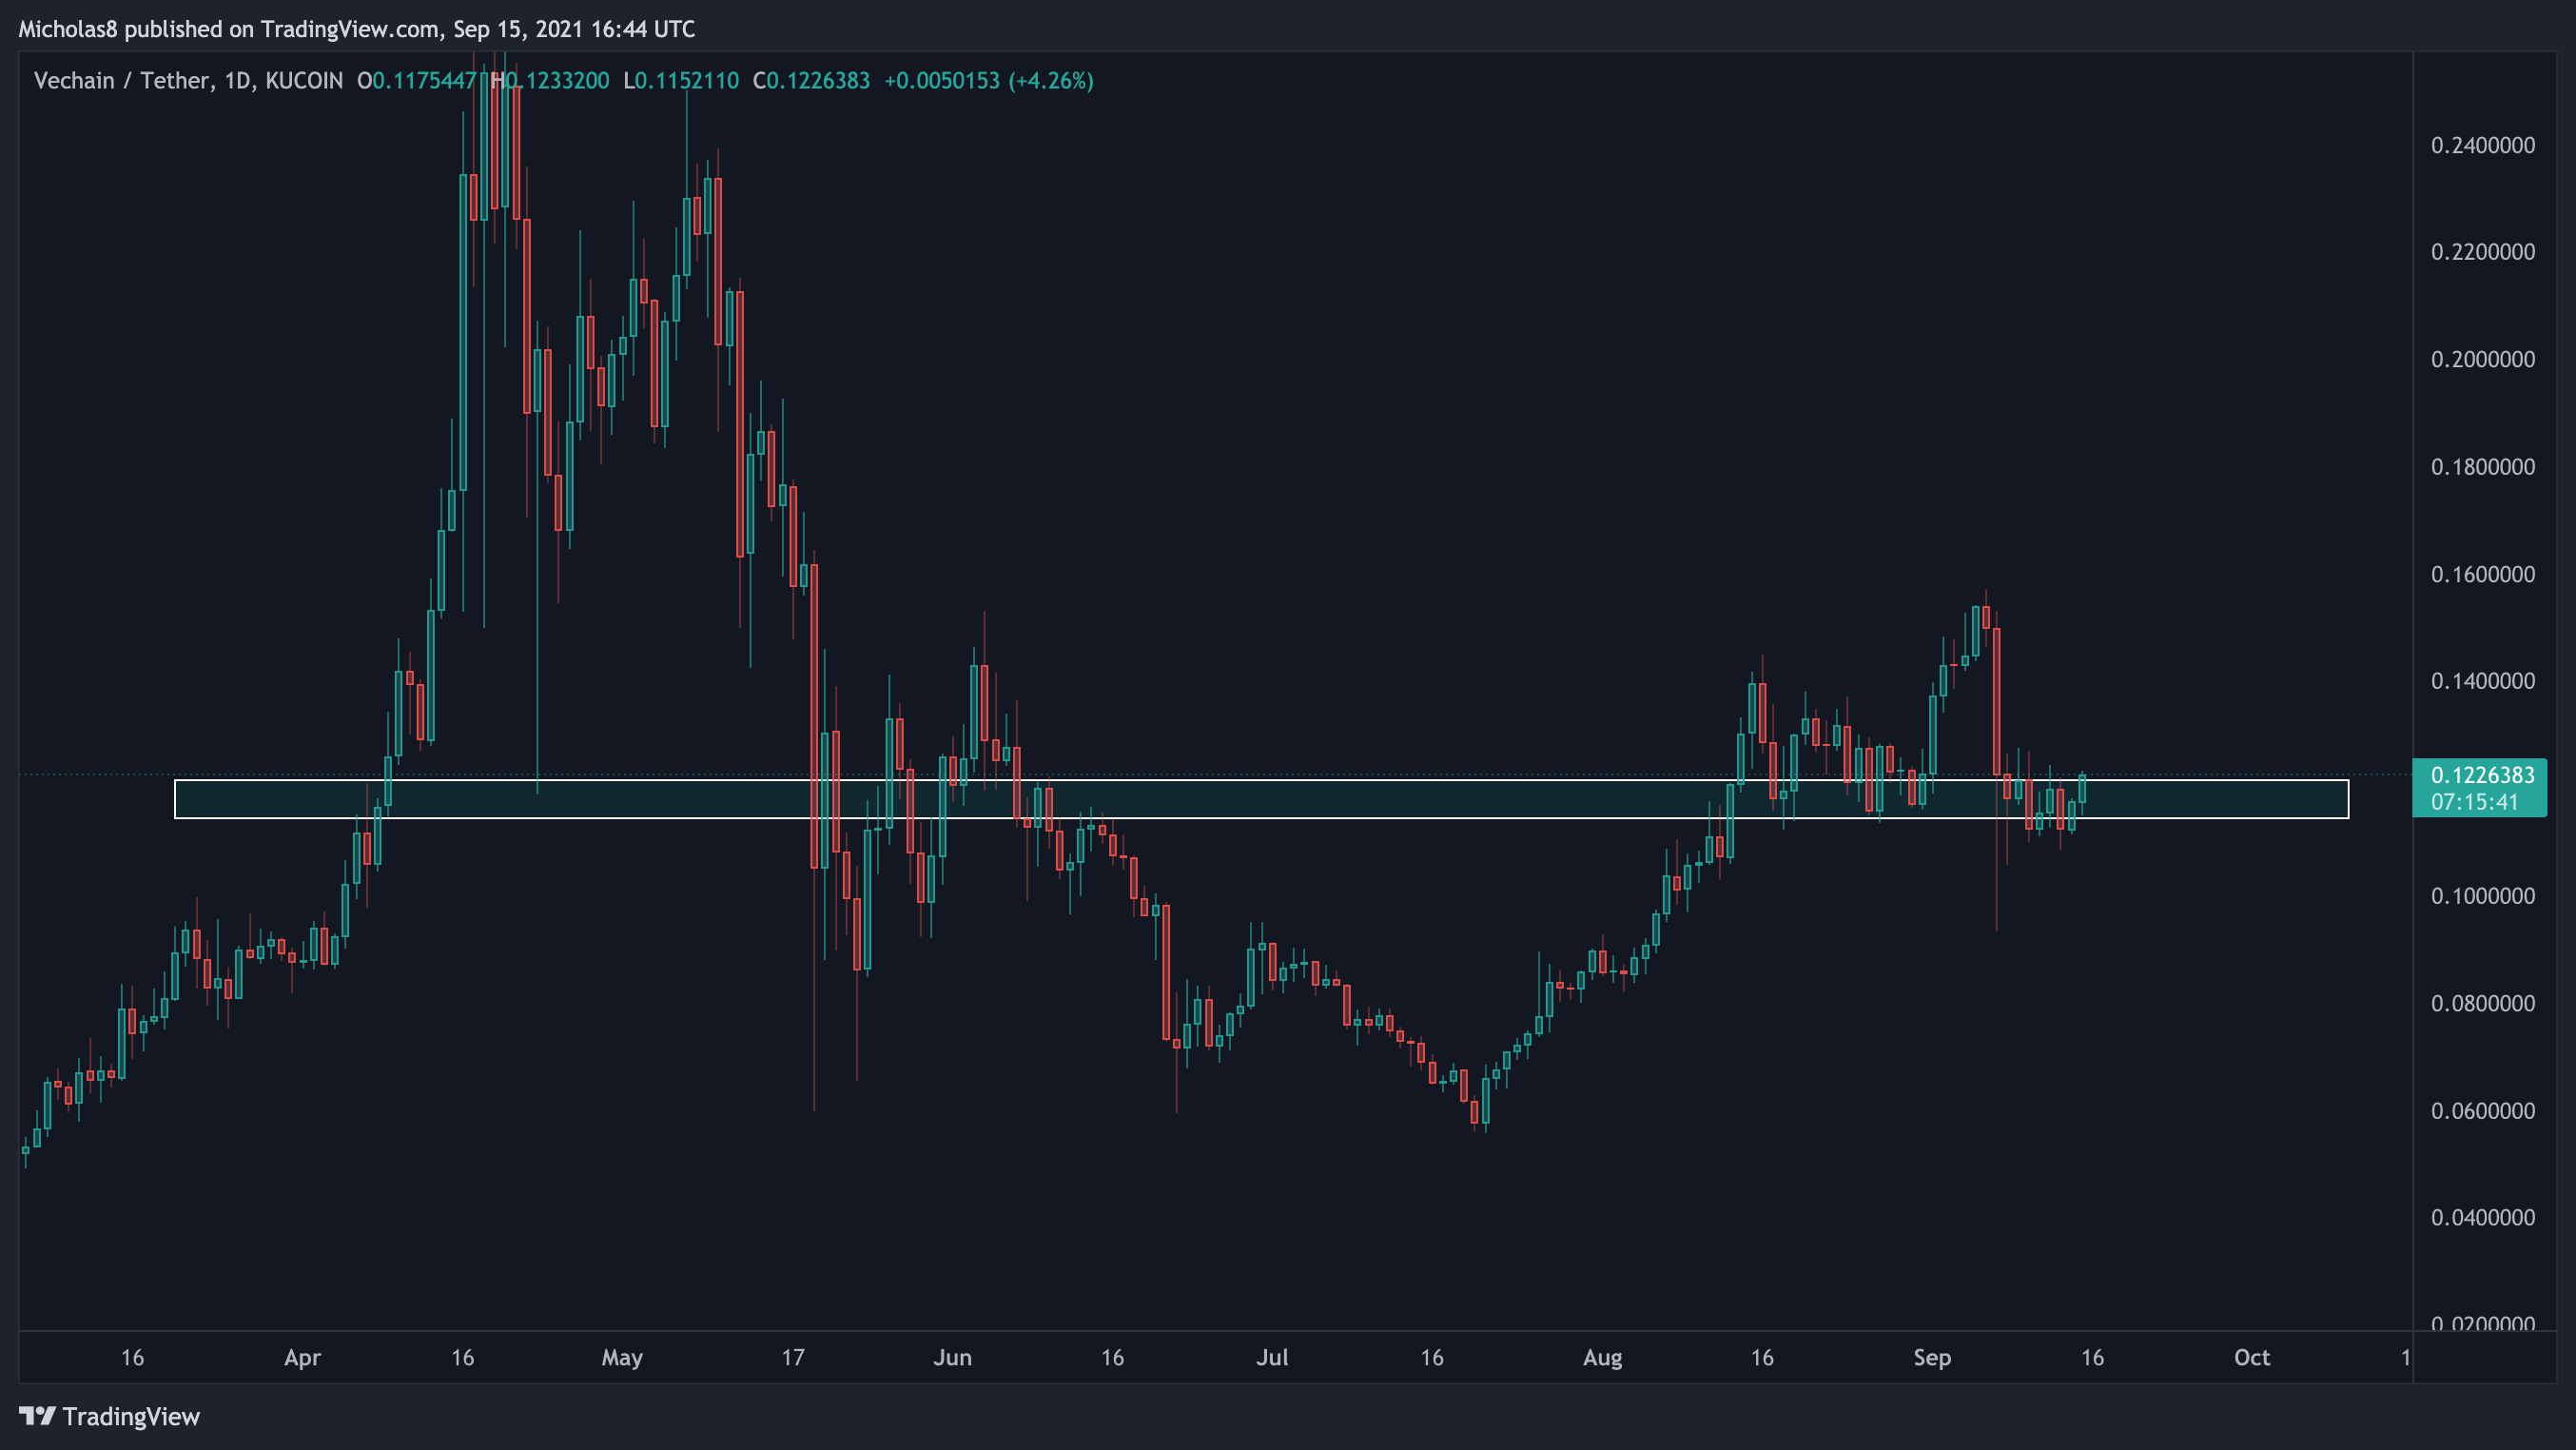
The major LQZ currently sits at 0.115 - 0.122. If we can see a daily candle close above this zone tonight, that will be bullish and may ensue a rally up.
EMA Ribbon
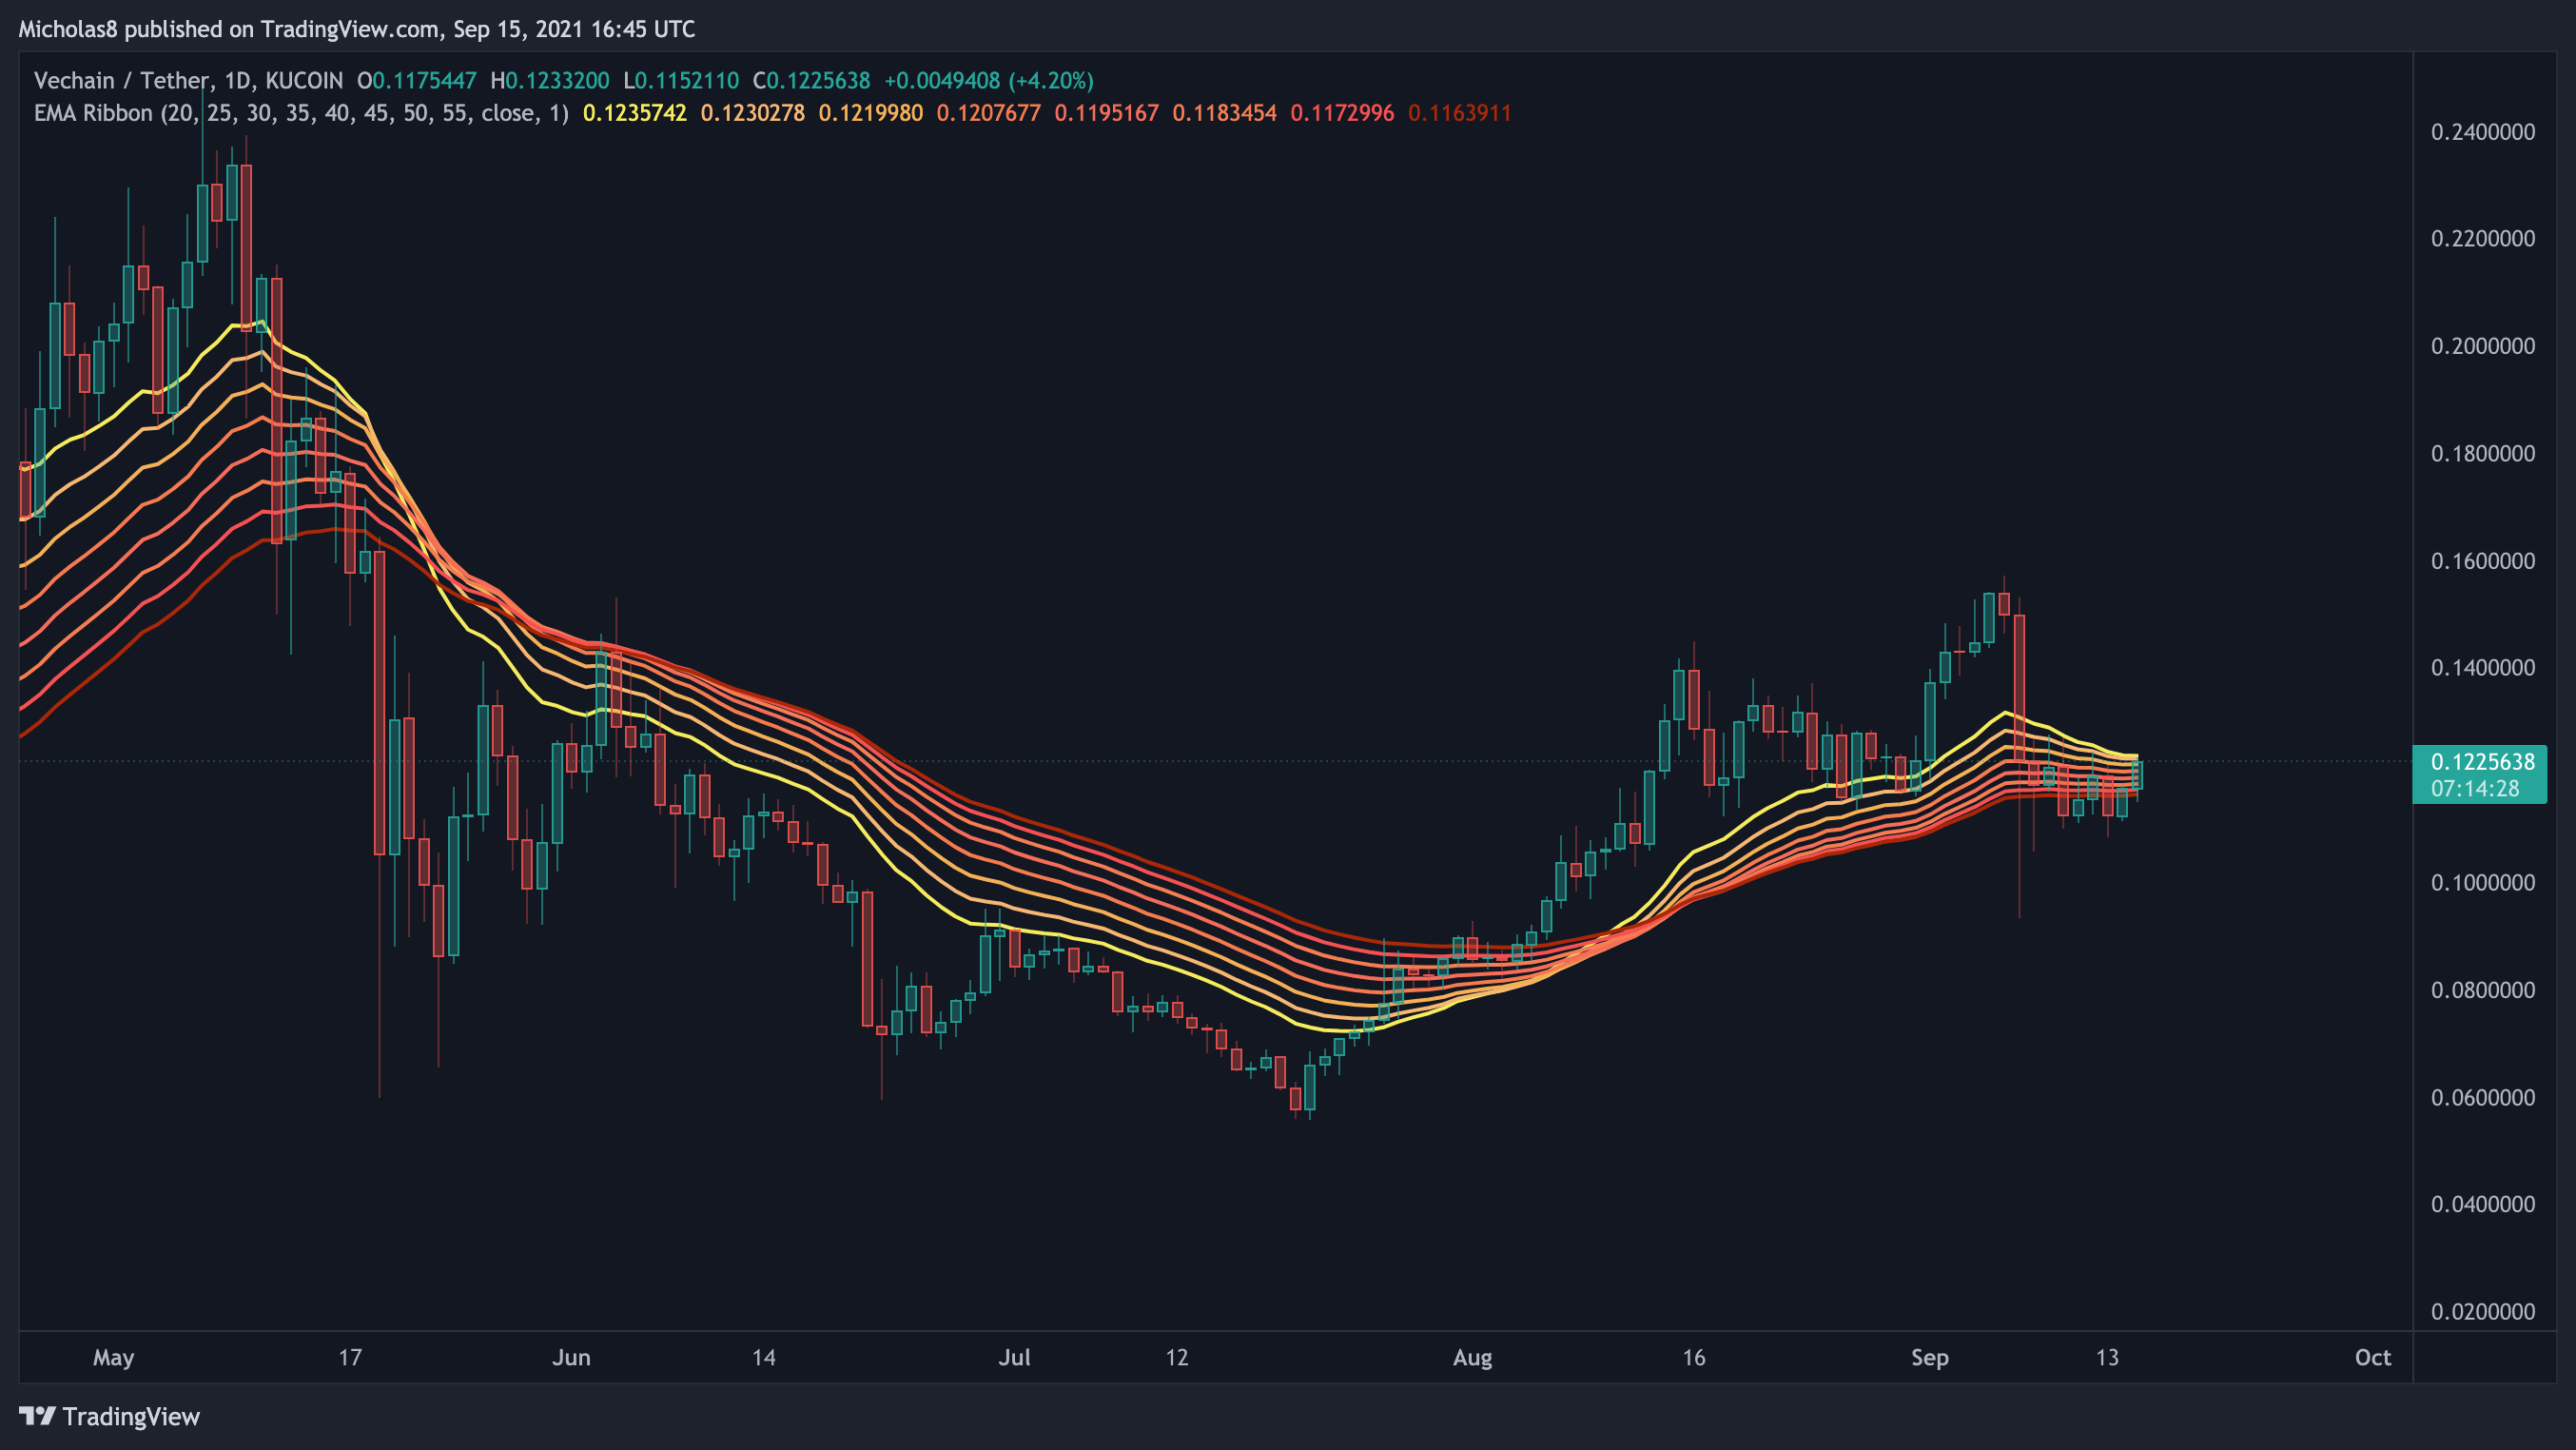
VET is right now finding resistance from the EMA ribbon. Similar to the LQZ, a break to the upside from the ribbon would be bullish as long as we can confirm it as support.
Simple Moving Averages (SMA): 20, 50, 100, 200
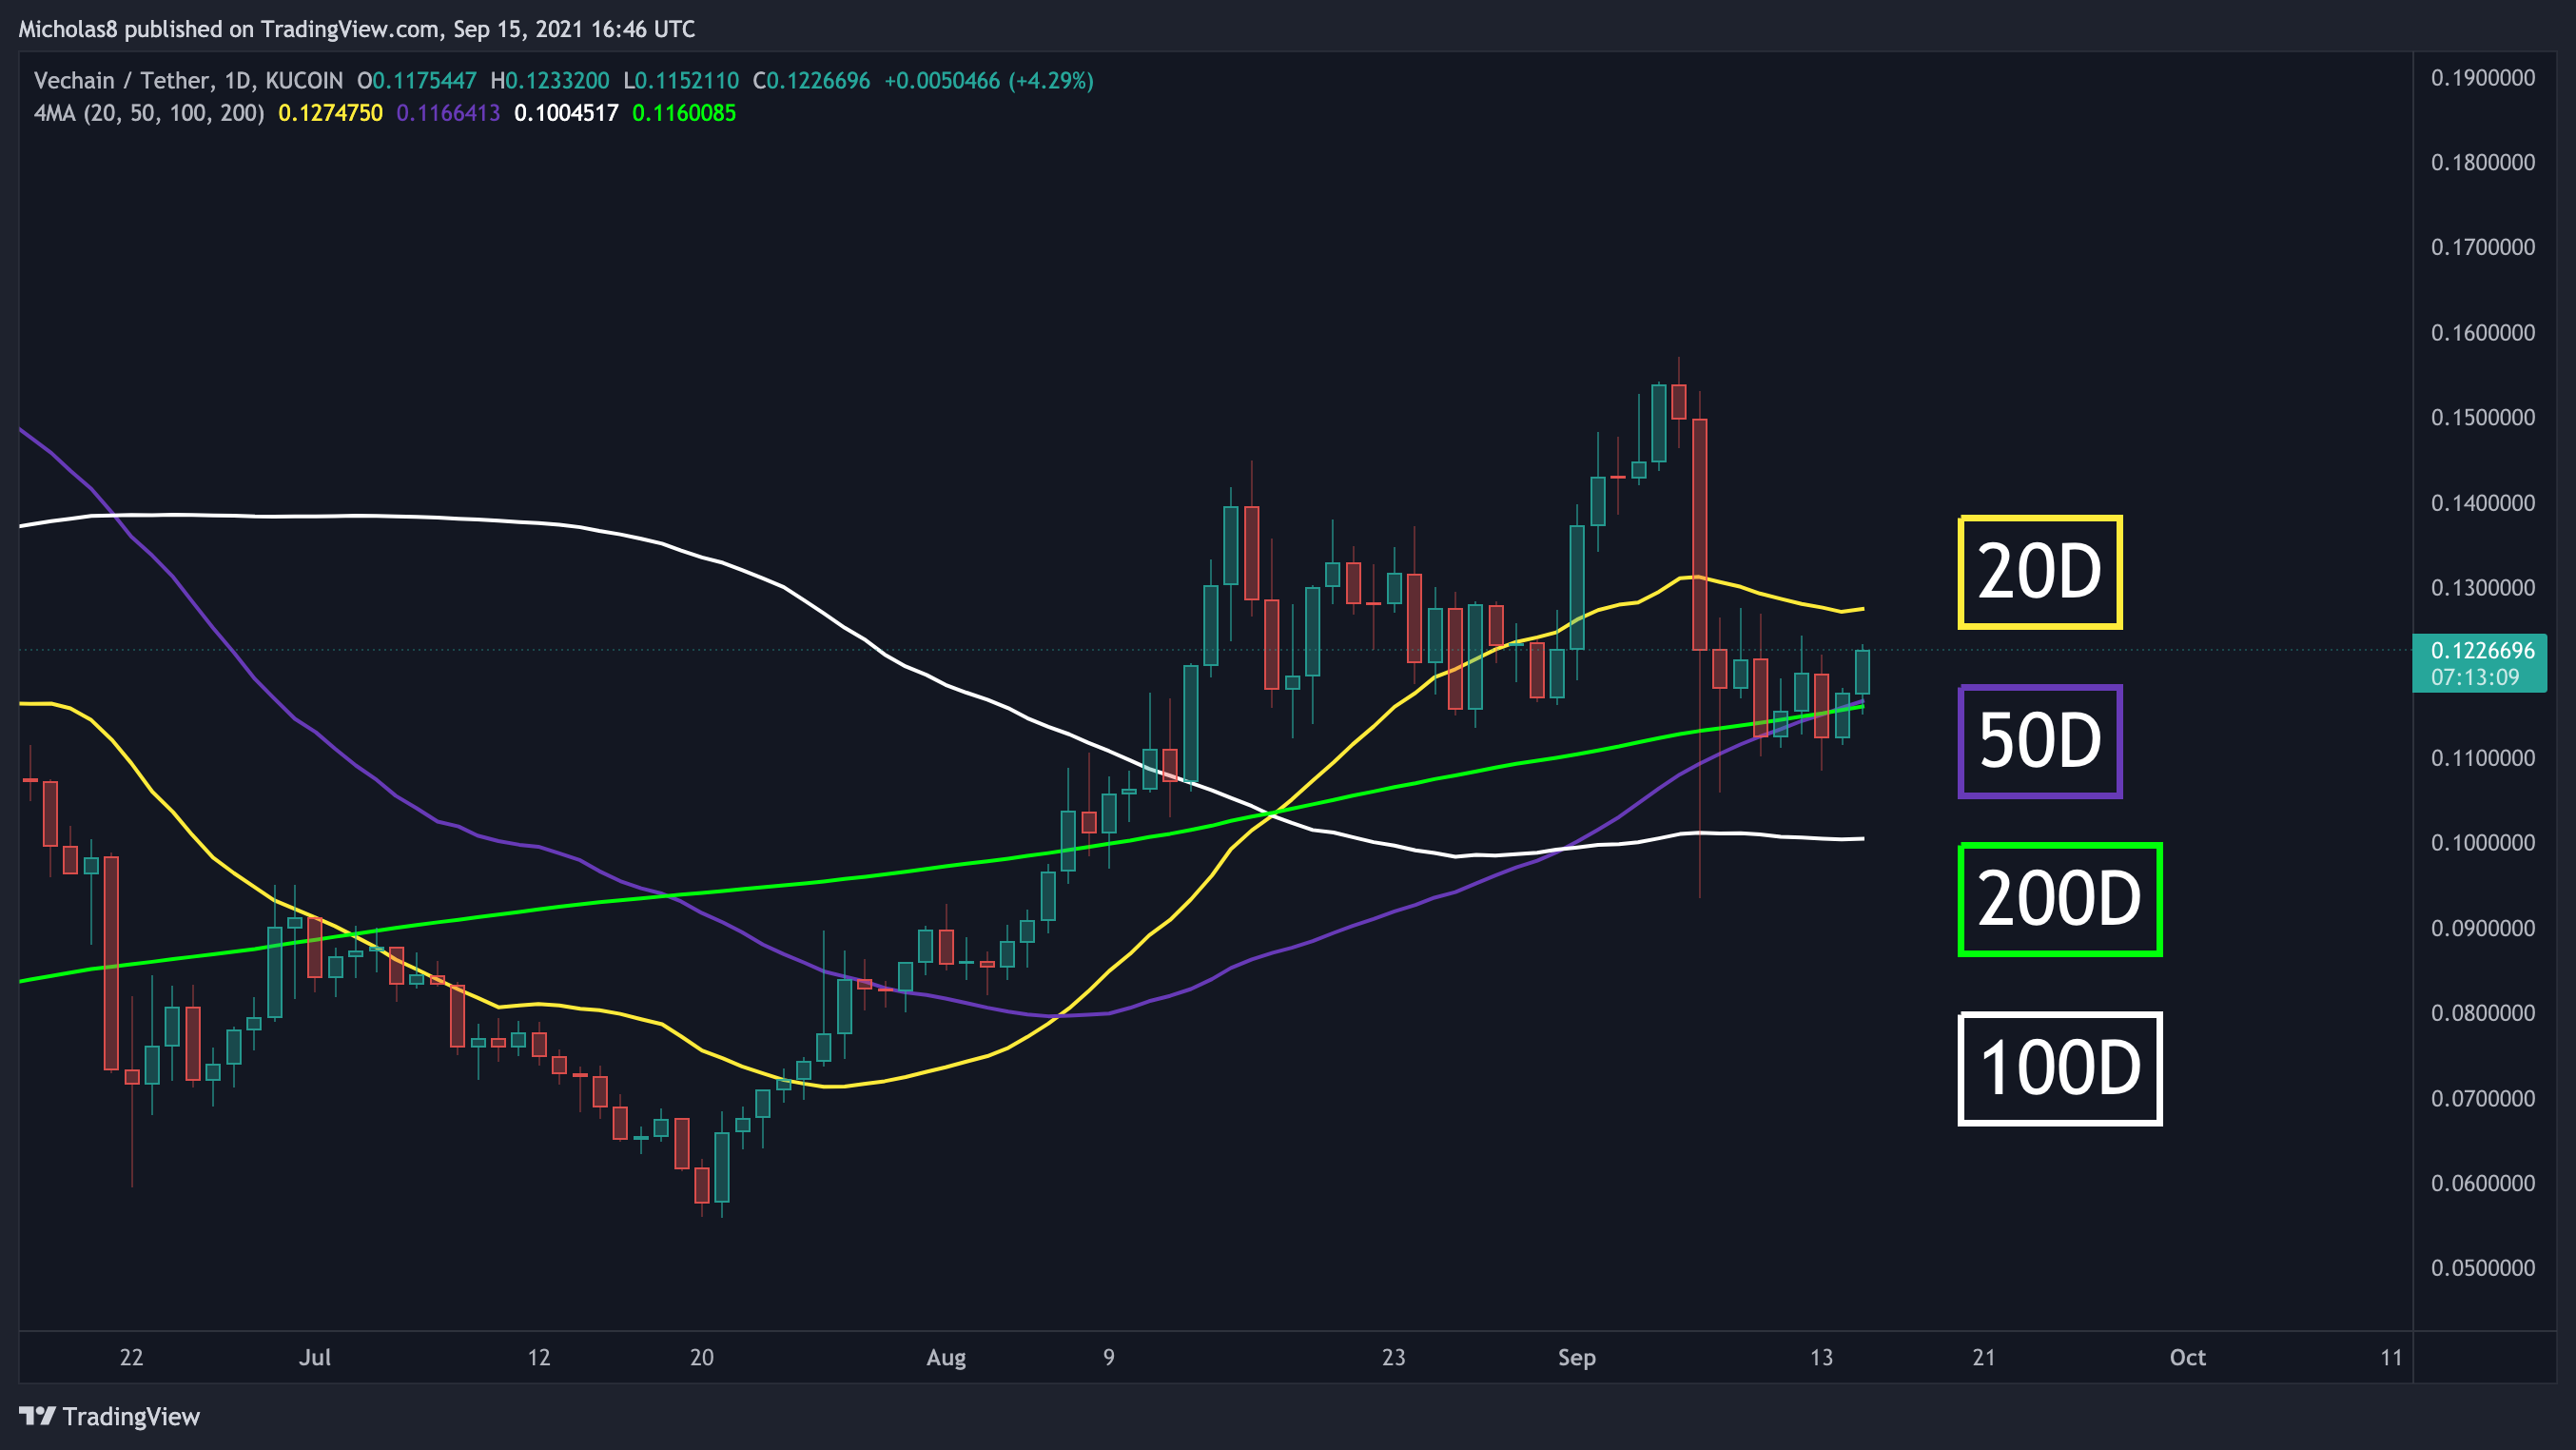
Similar to BTC, we are currently trading above the 50/100/200-day SMAs, and also will see a Golden Cross confirm tonight. This is a great macro signal for the performance of this asset. Please note: I do not consider this a buy signal. I use MAs as a way to gain a broader perspective of the current market conditions.
Moving forward though, be cognizant of the fact that we may find resistance from the 20-day SMA as we are trading below it.
Exponential Moving Averages (EMA): 8-day, 21-day, 50-day, 200-day
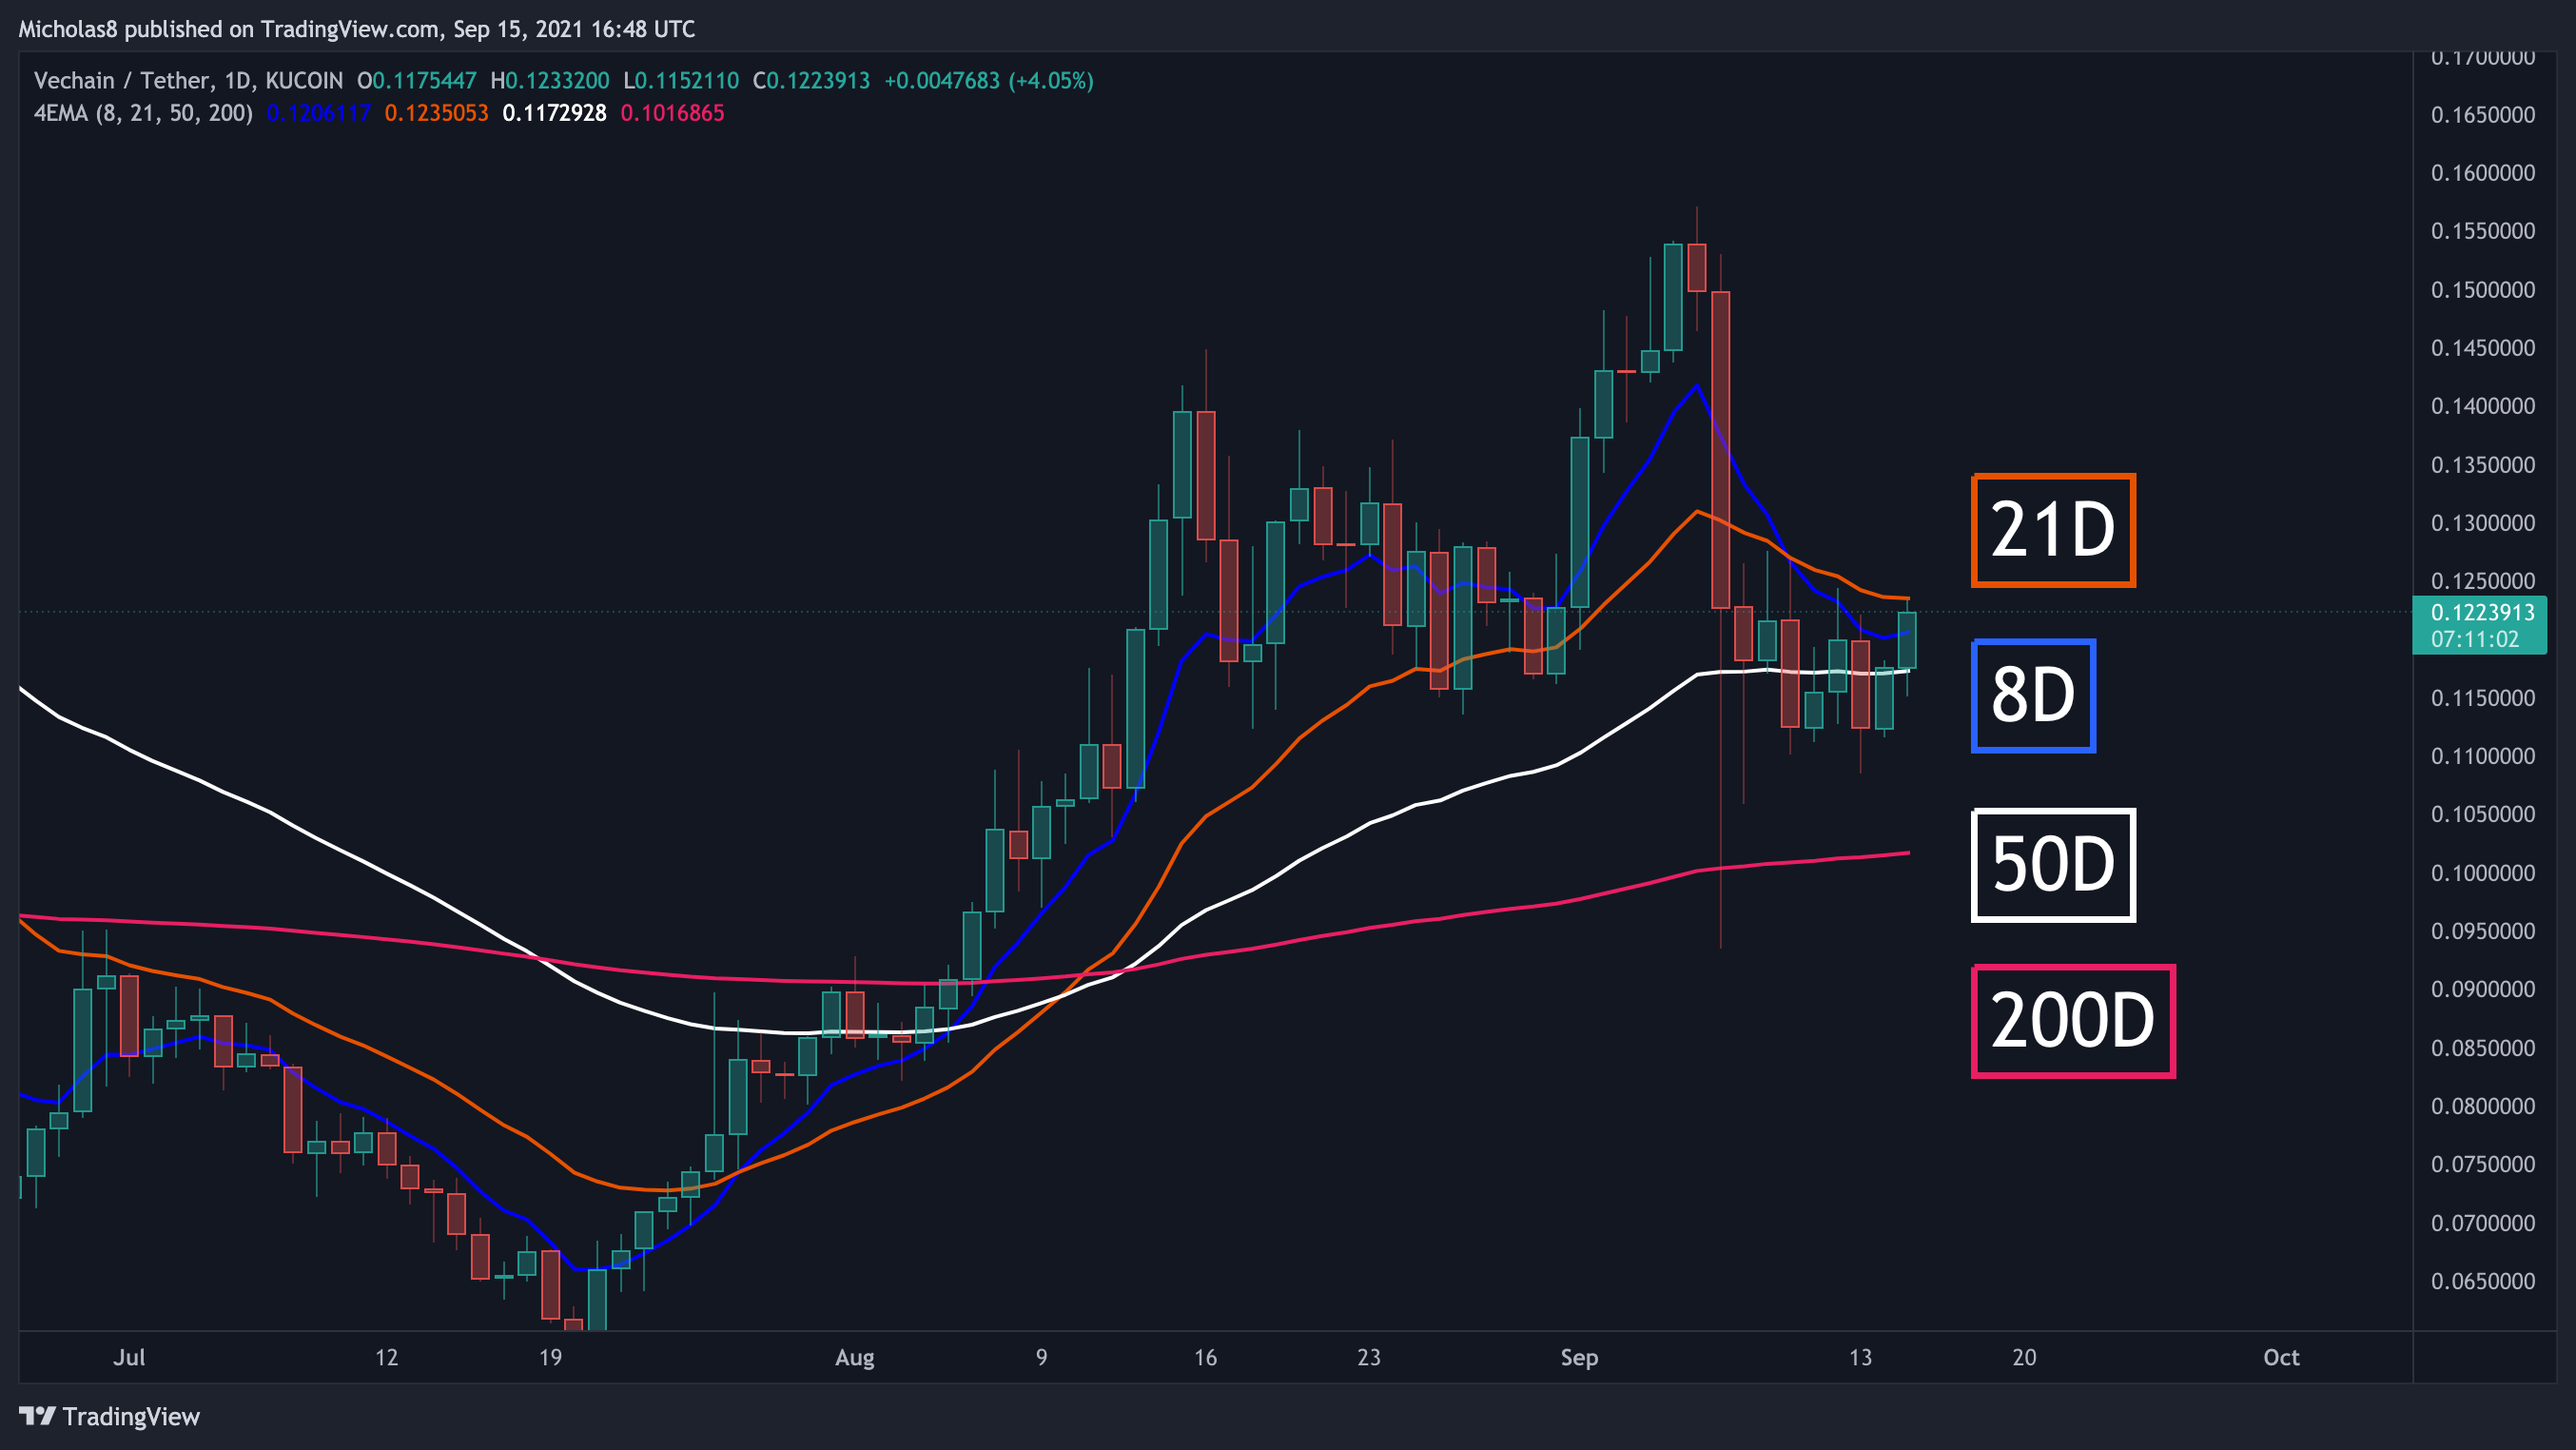
VET is finding resistance currently from the 21-day EMA. But we likely close above the 8/50/200-day EMAs tonight. If we do manage to see a close above these EMAs, it increases the likelihood that they serve as strong support and fuel the move to break through the 21-day EMA.
Divergences
Bearish Divergence (red)
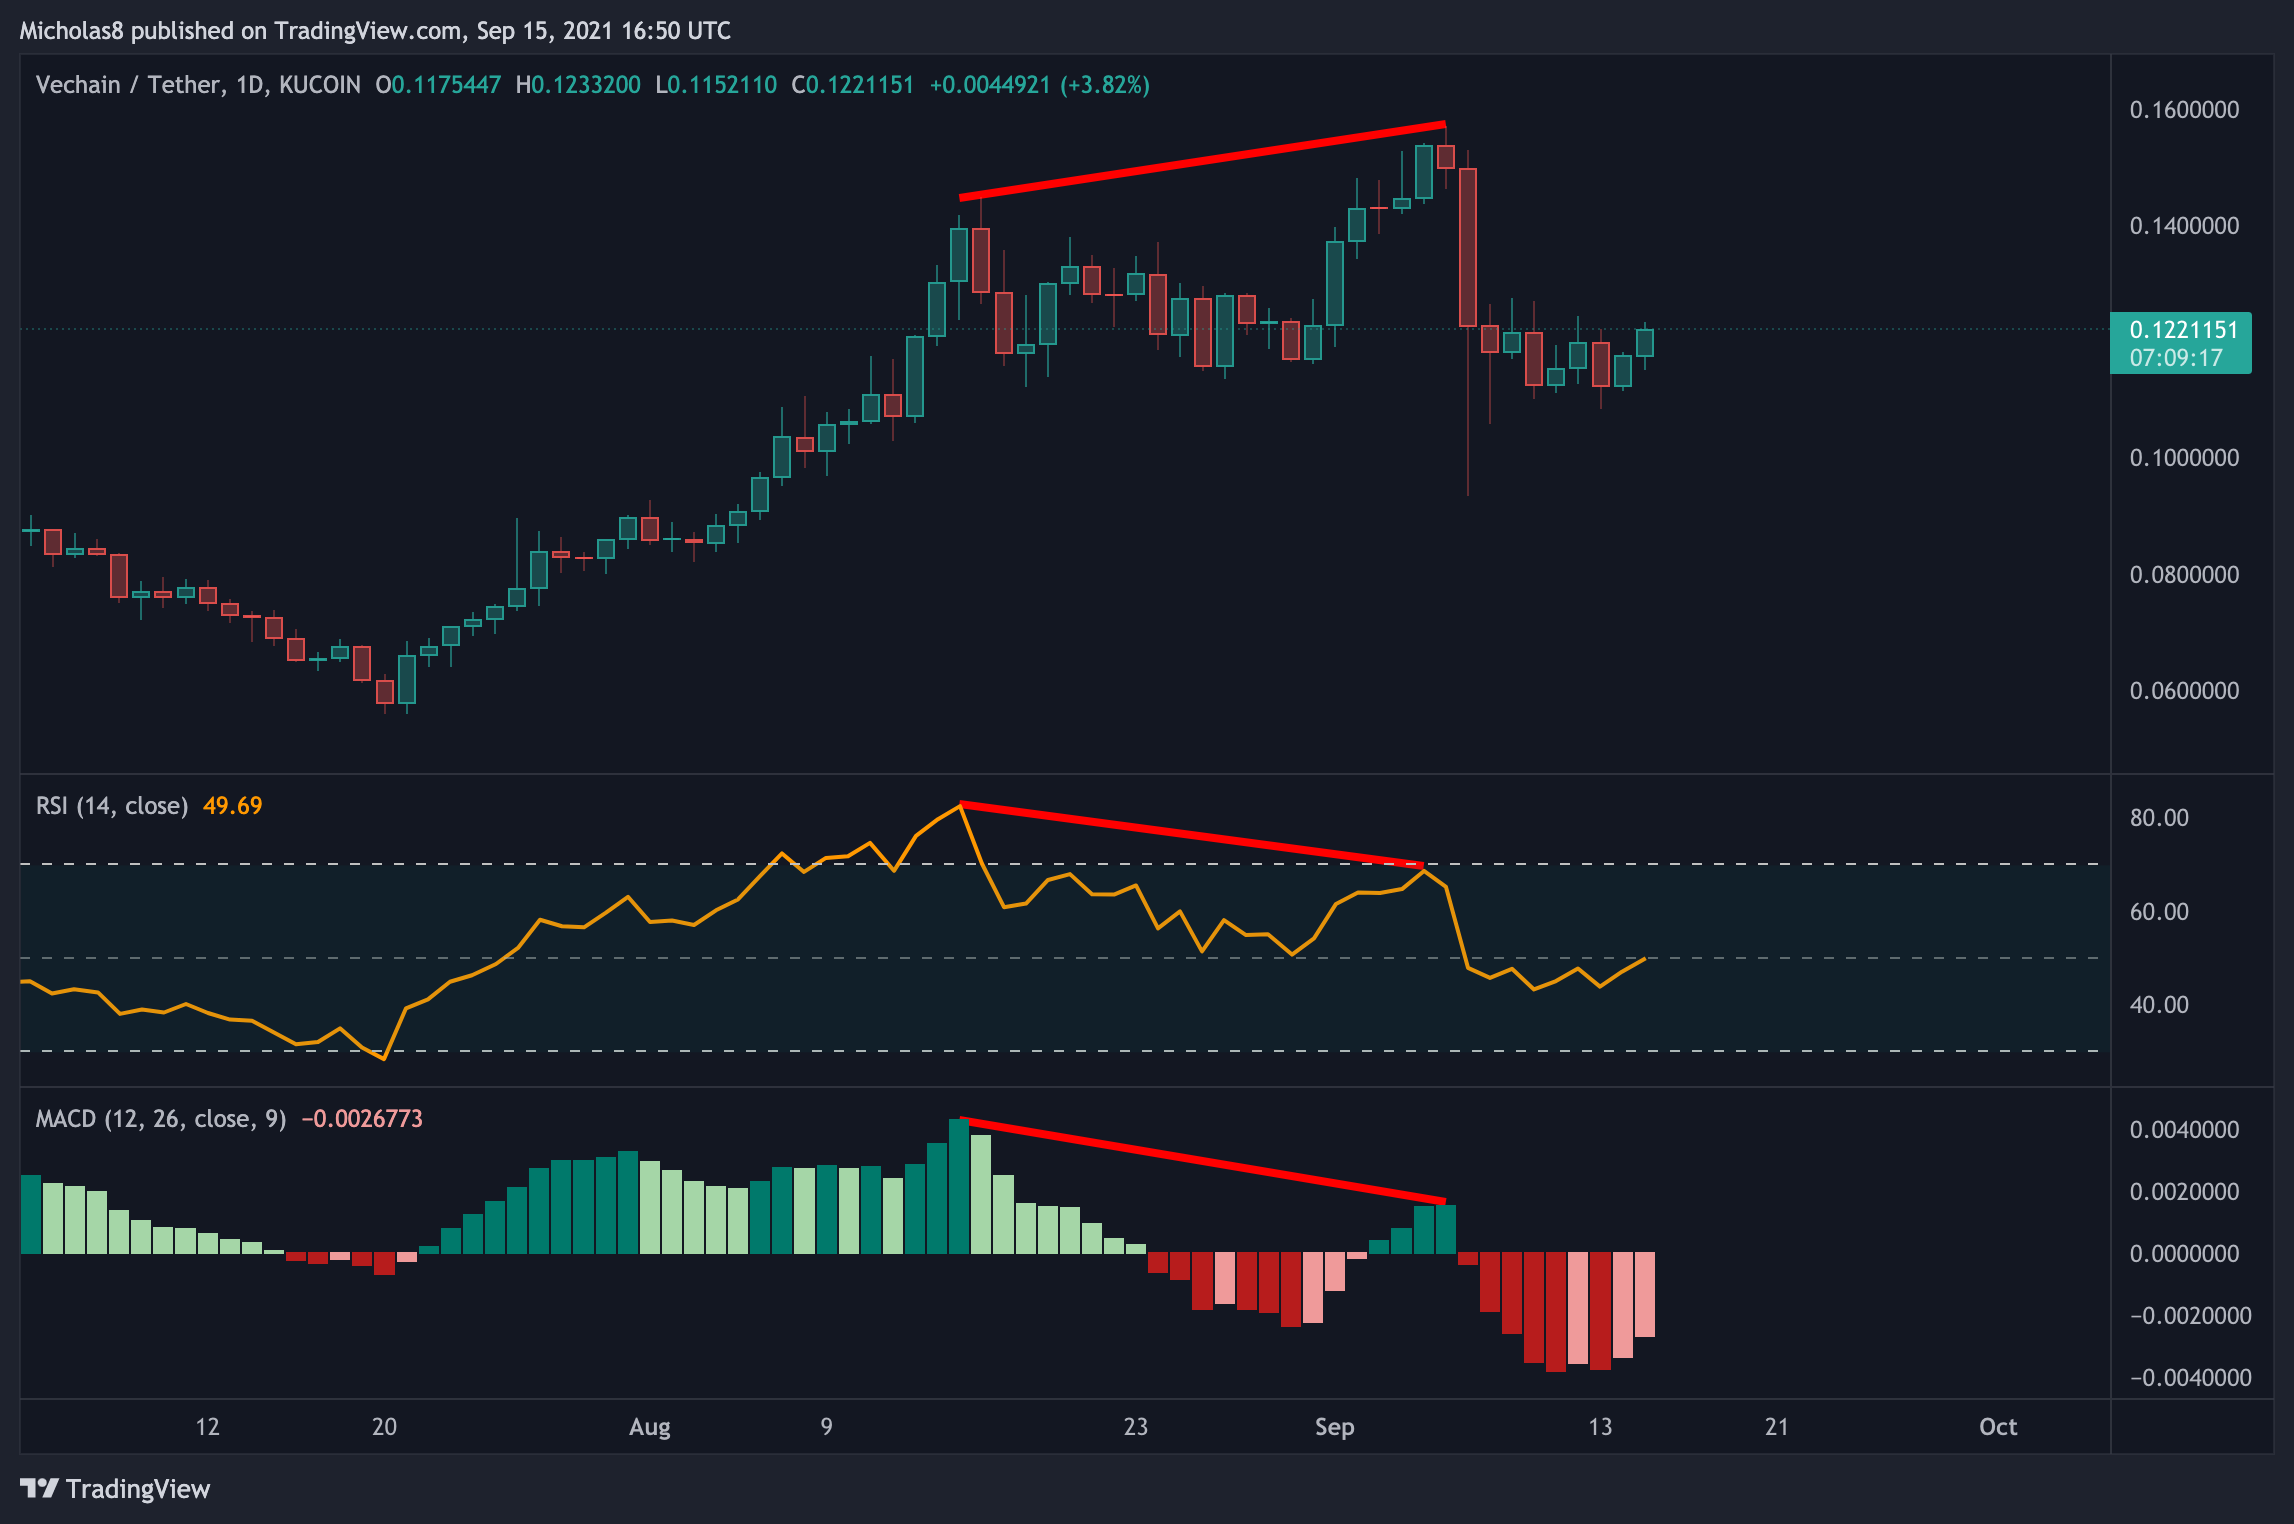
We have a higher high in price, with a lower high on the RSI. This is a bearish divergence, which signals a possible trend reversal. In this case, that means down.
Note: This may be done playing out due to the possible hidden bullish divergence (see below).
Invalidation: Higher high in price with a higher high in the RSI/MACD.
Hidden Bullish Divergence (green)
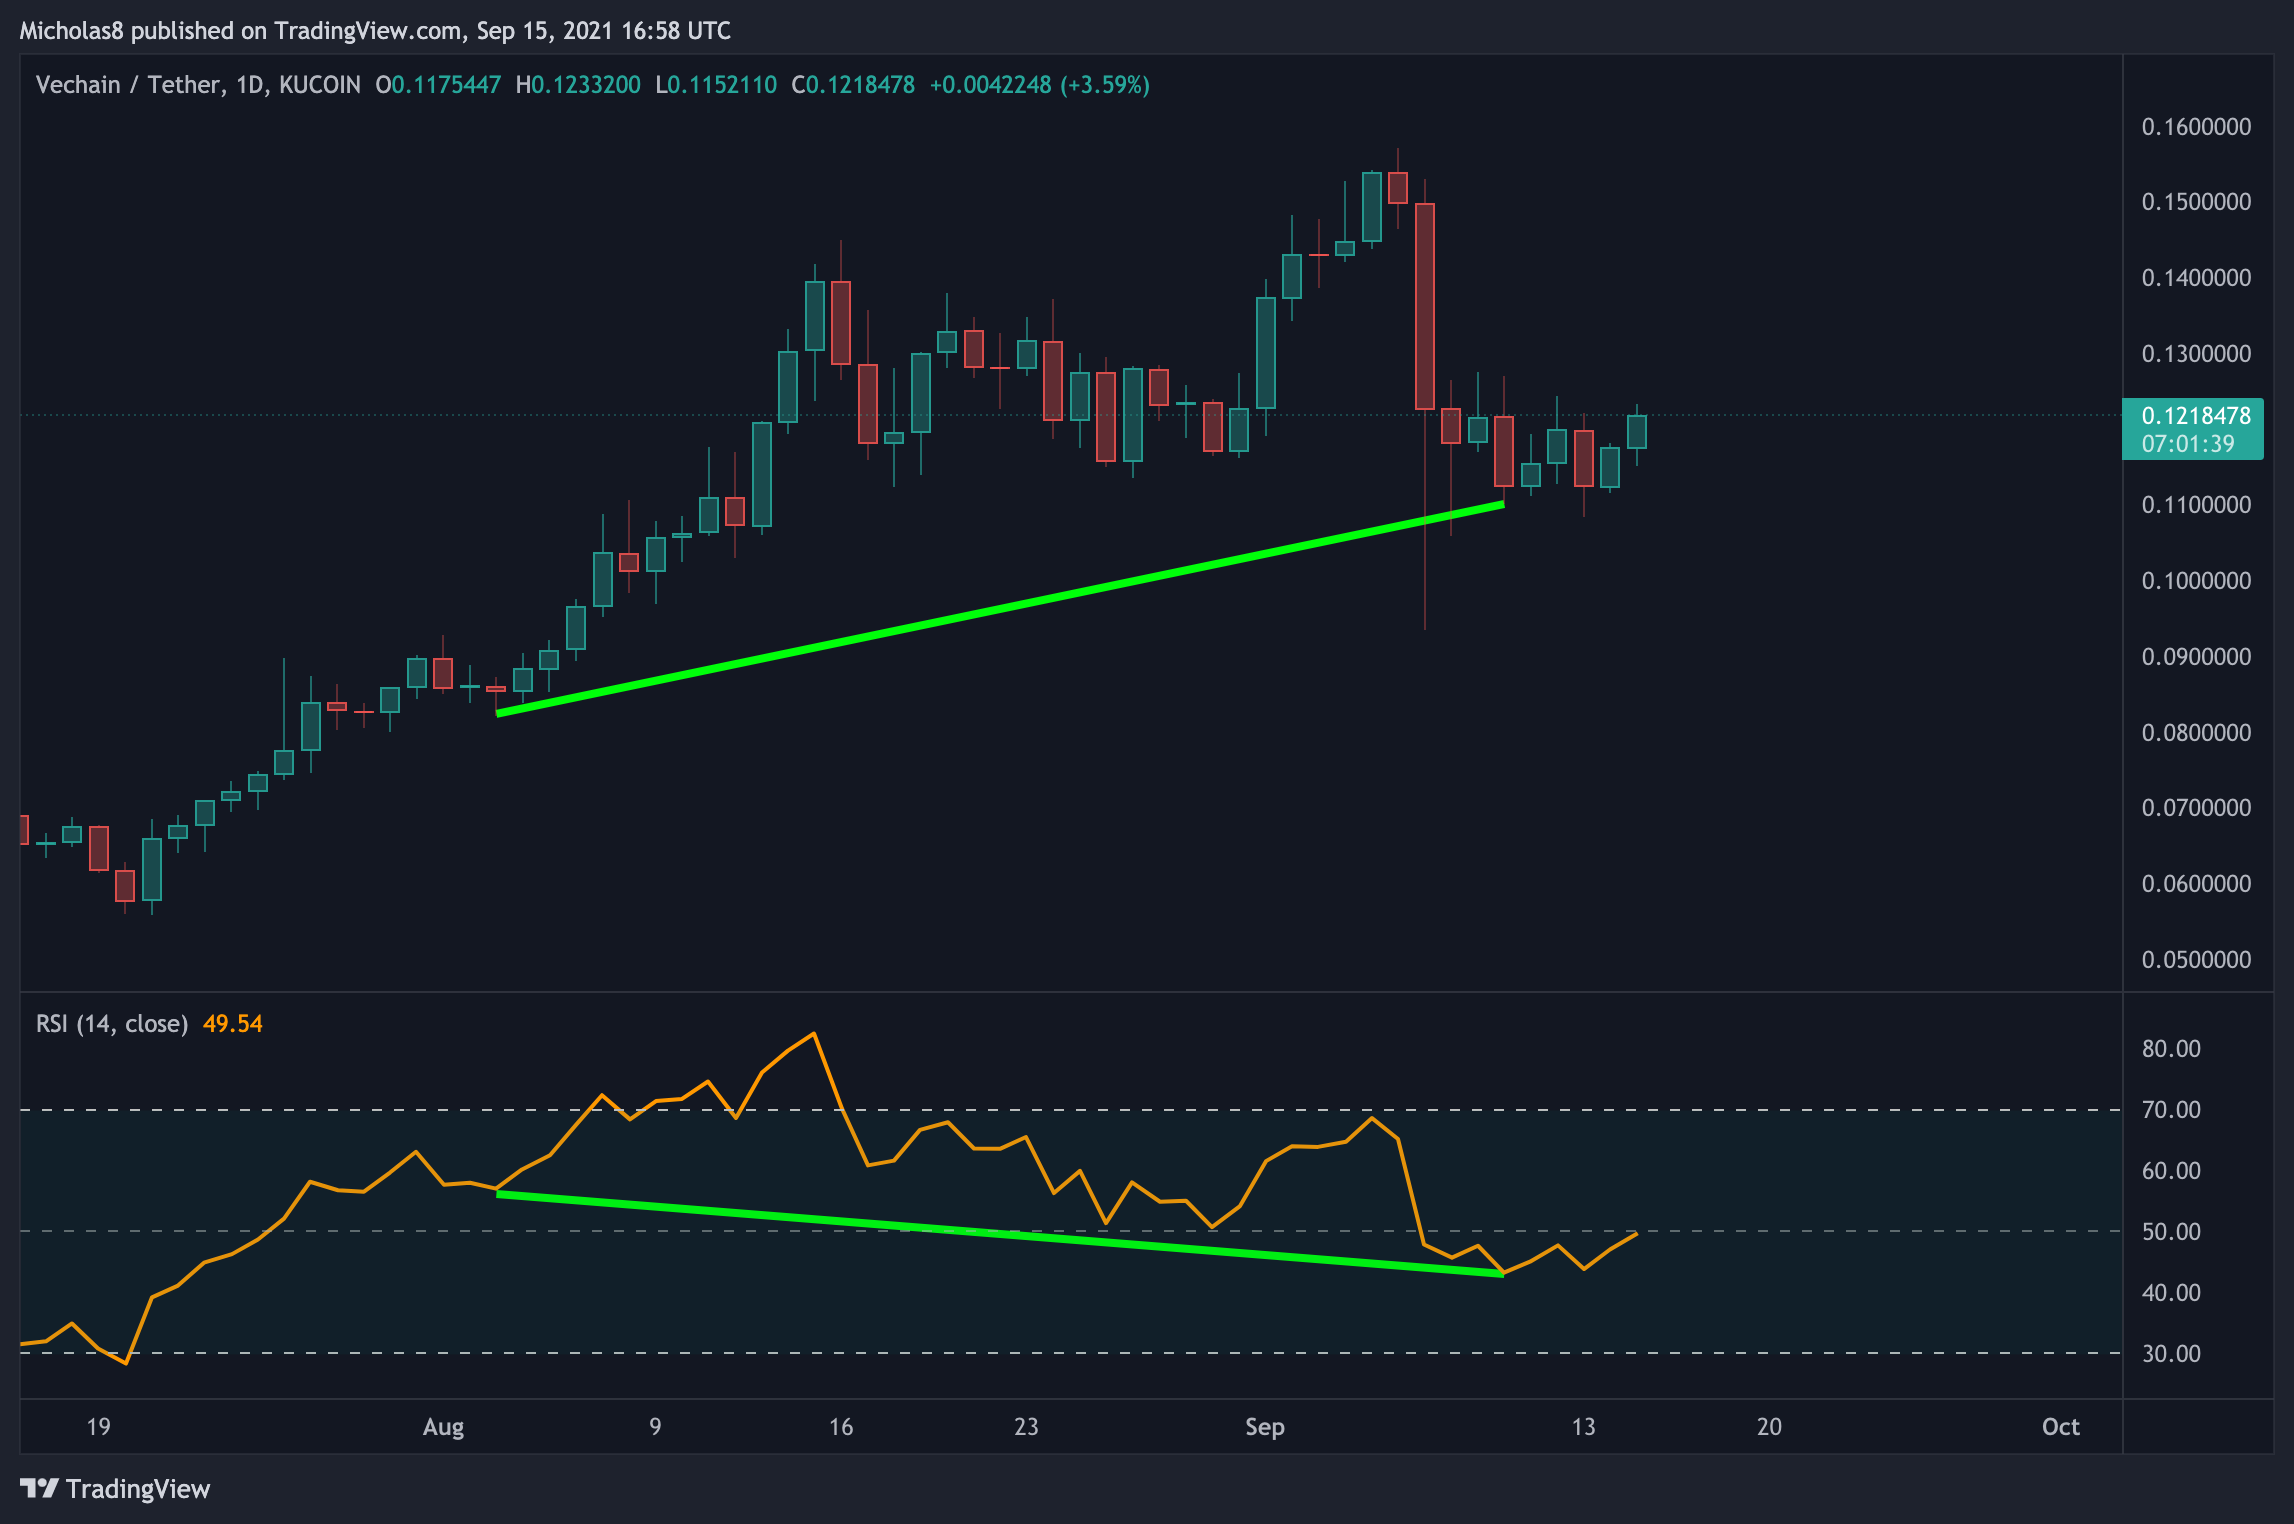
We have a higher low in price, with a lower low in the RSI. This is a hidden bullish divergence, which signals a possible trend continuation. In this case, that means up.
Invalidation: Lower low in price, with a lower low in the RSI.
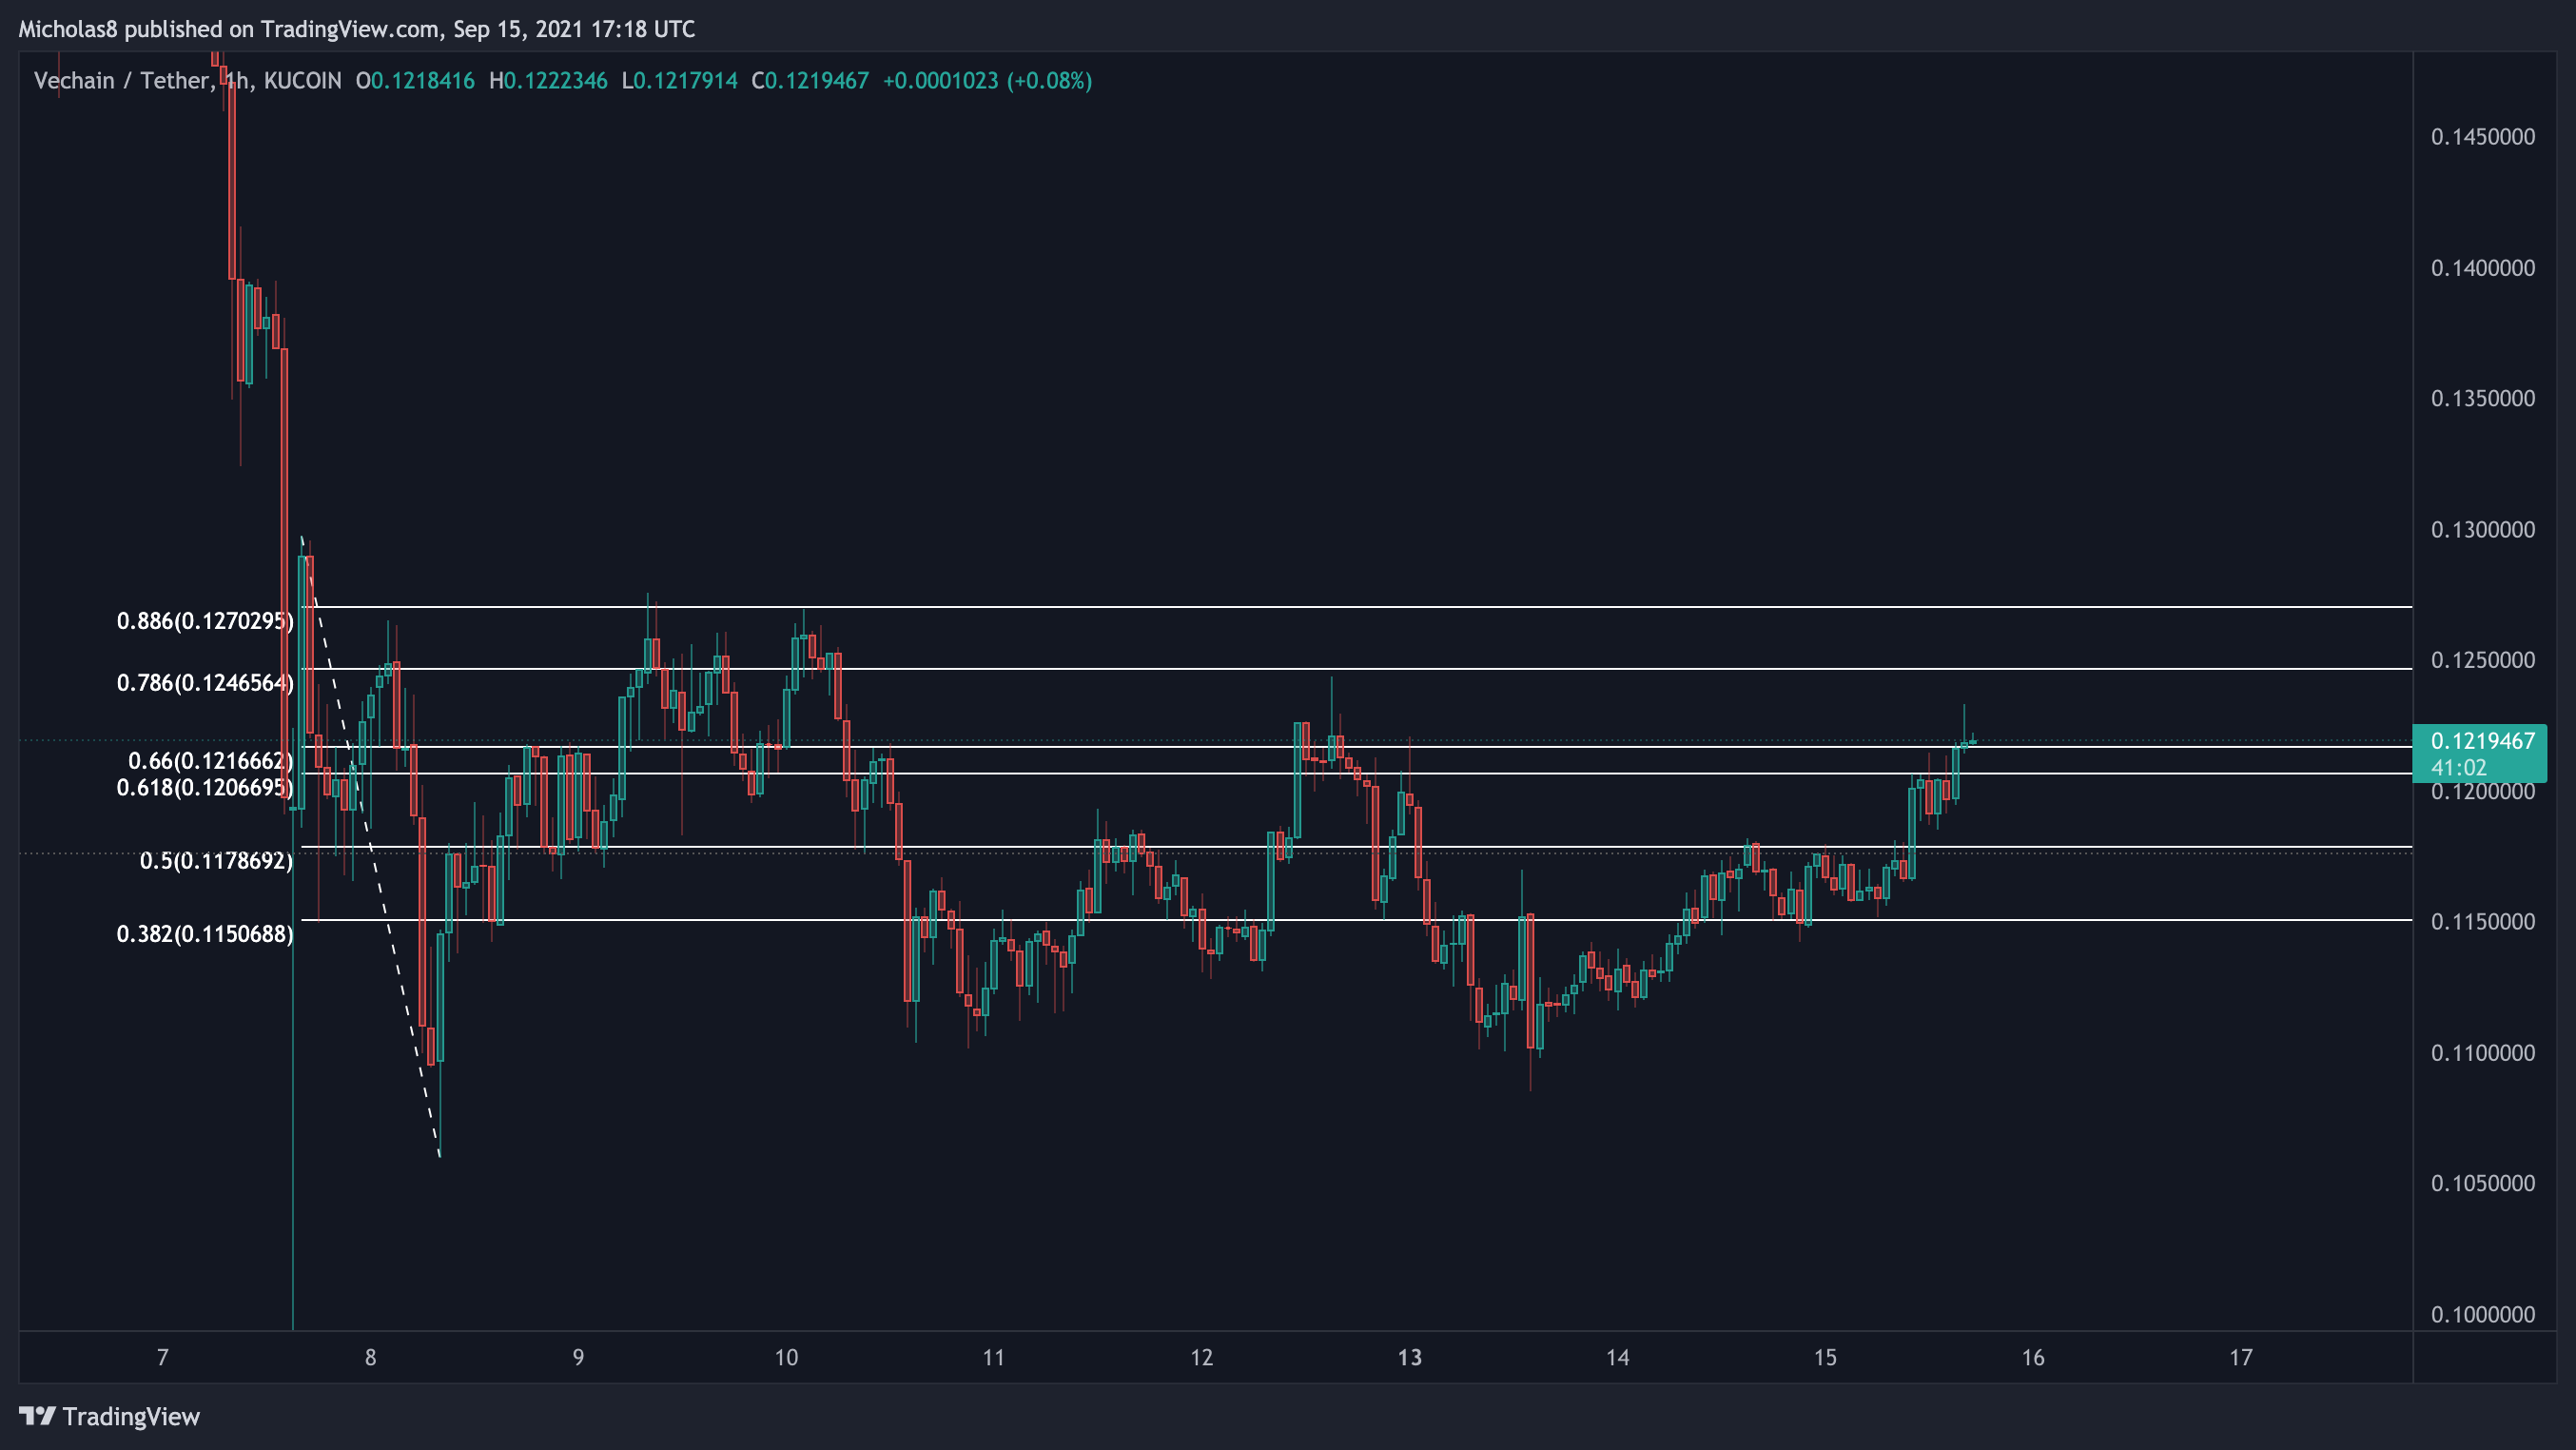
4-hour Timeframe
Liquidity Zone
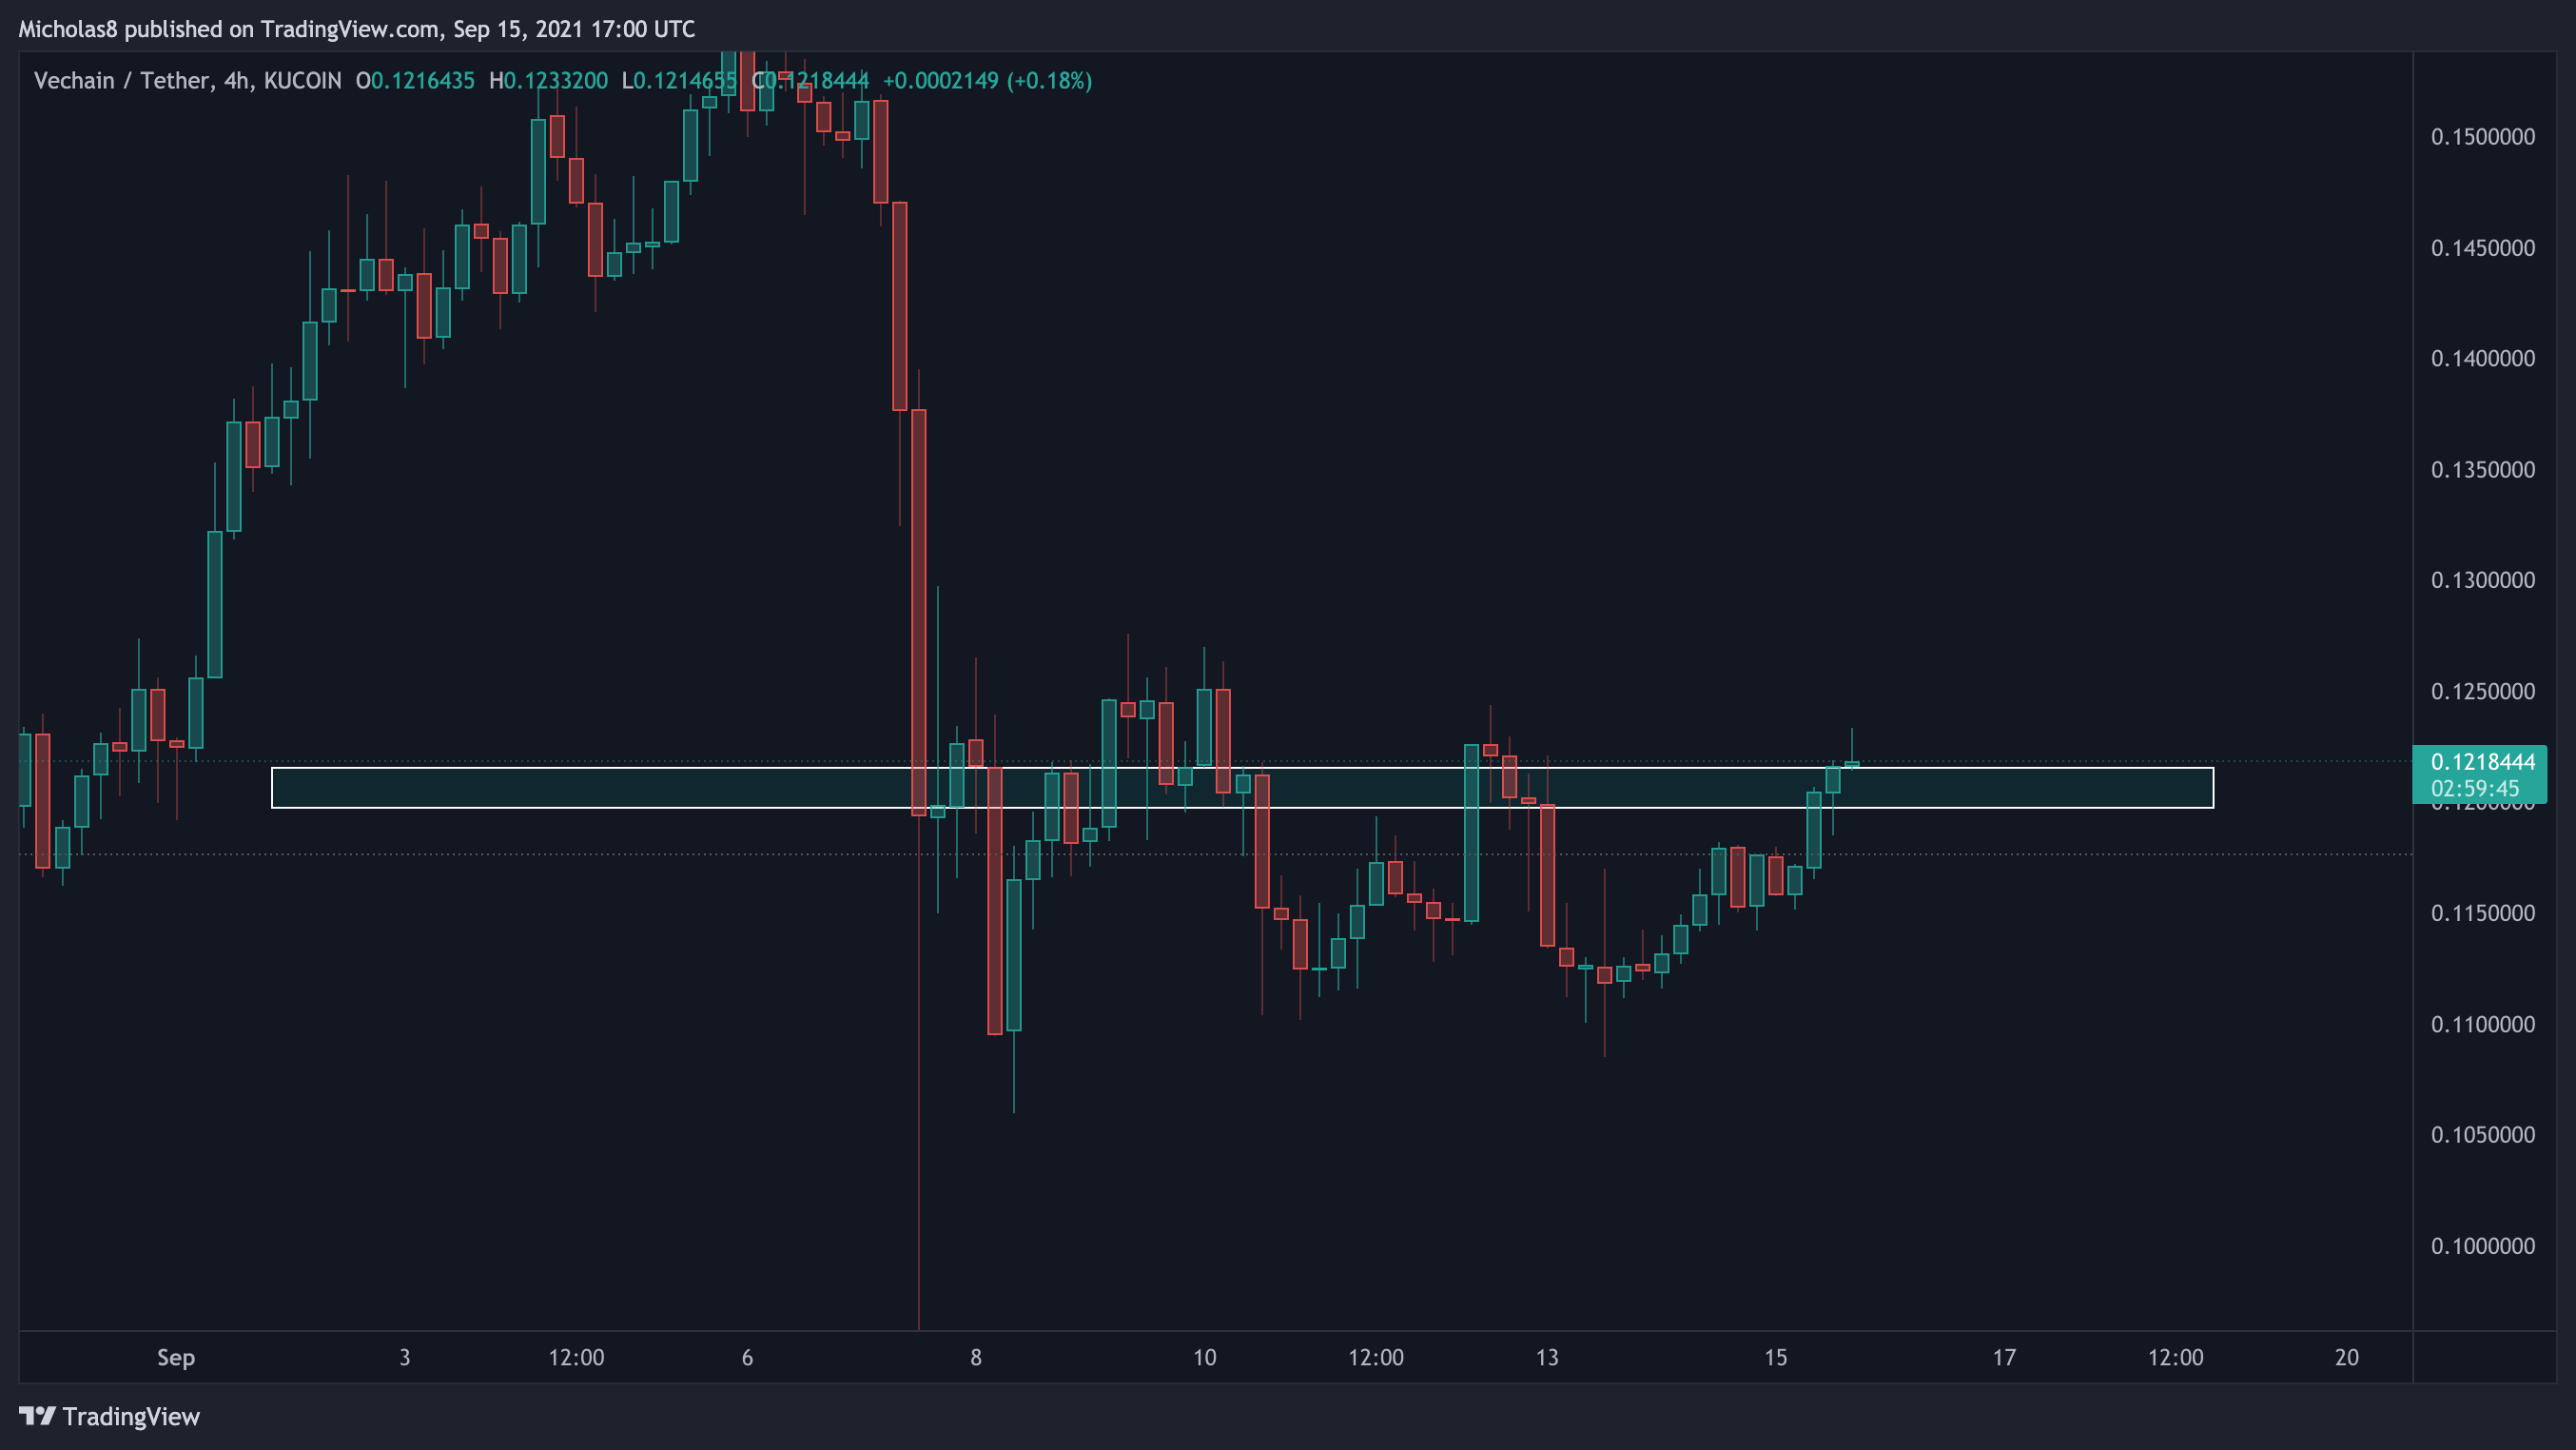
The Liquidity Zone on this timeframe currently sits between 0.12 – 0.122. If we can see a 4H candle close above this zone, it increases the likelihood it serves as support moving forward.
EMA Ribbon
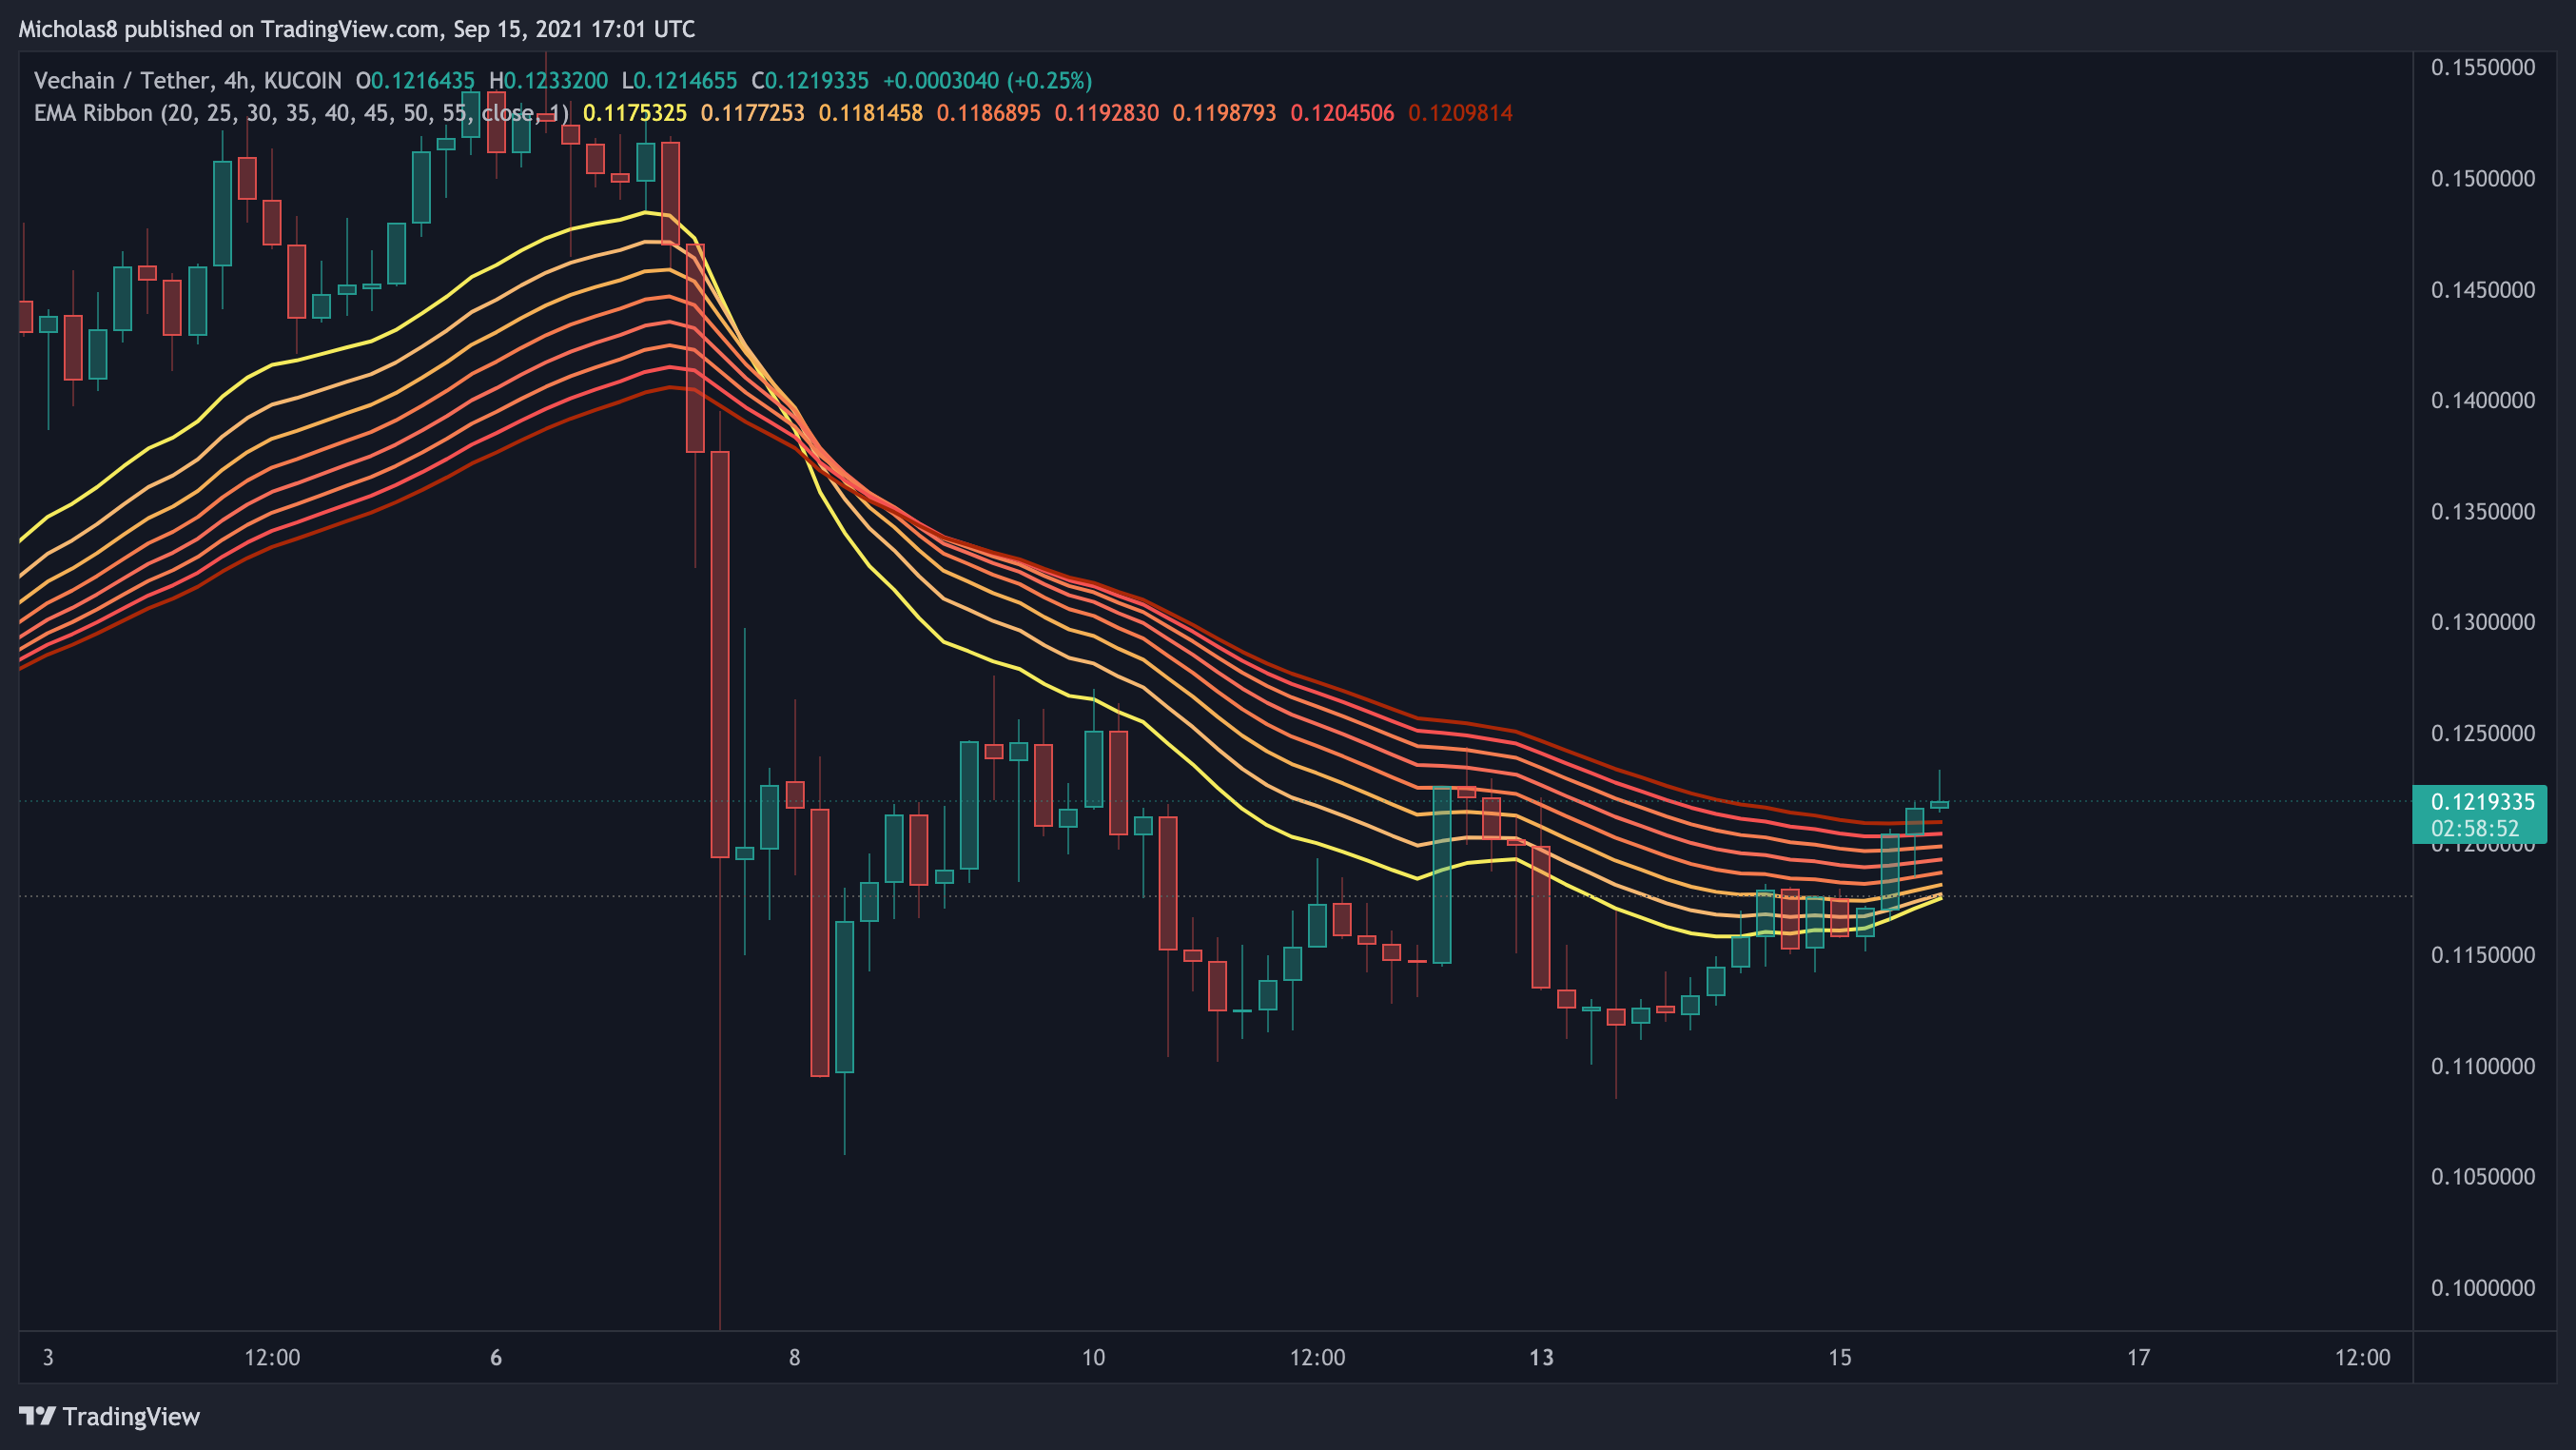
VET is currently trading above the EMA ribbon. Ideally, the next time we come down to test it, it will serve as a level of support. It would be nice to see as well a separation from this EMA ribbon to further solidify the idea for bullish continuation.
Moving Averages (MA): 20, 50, 200
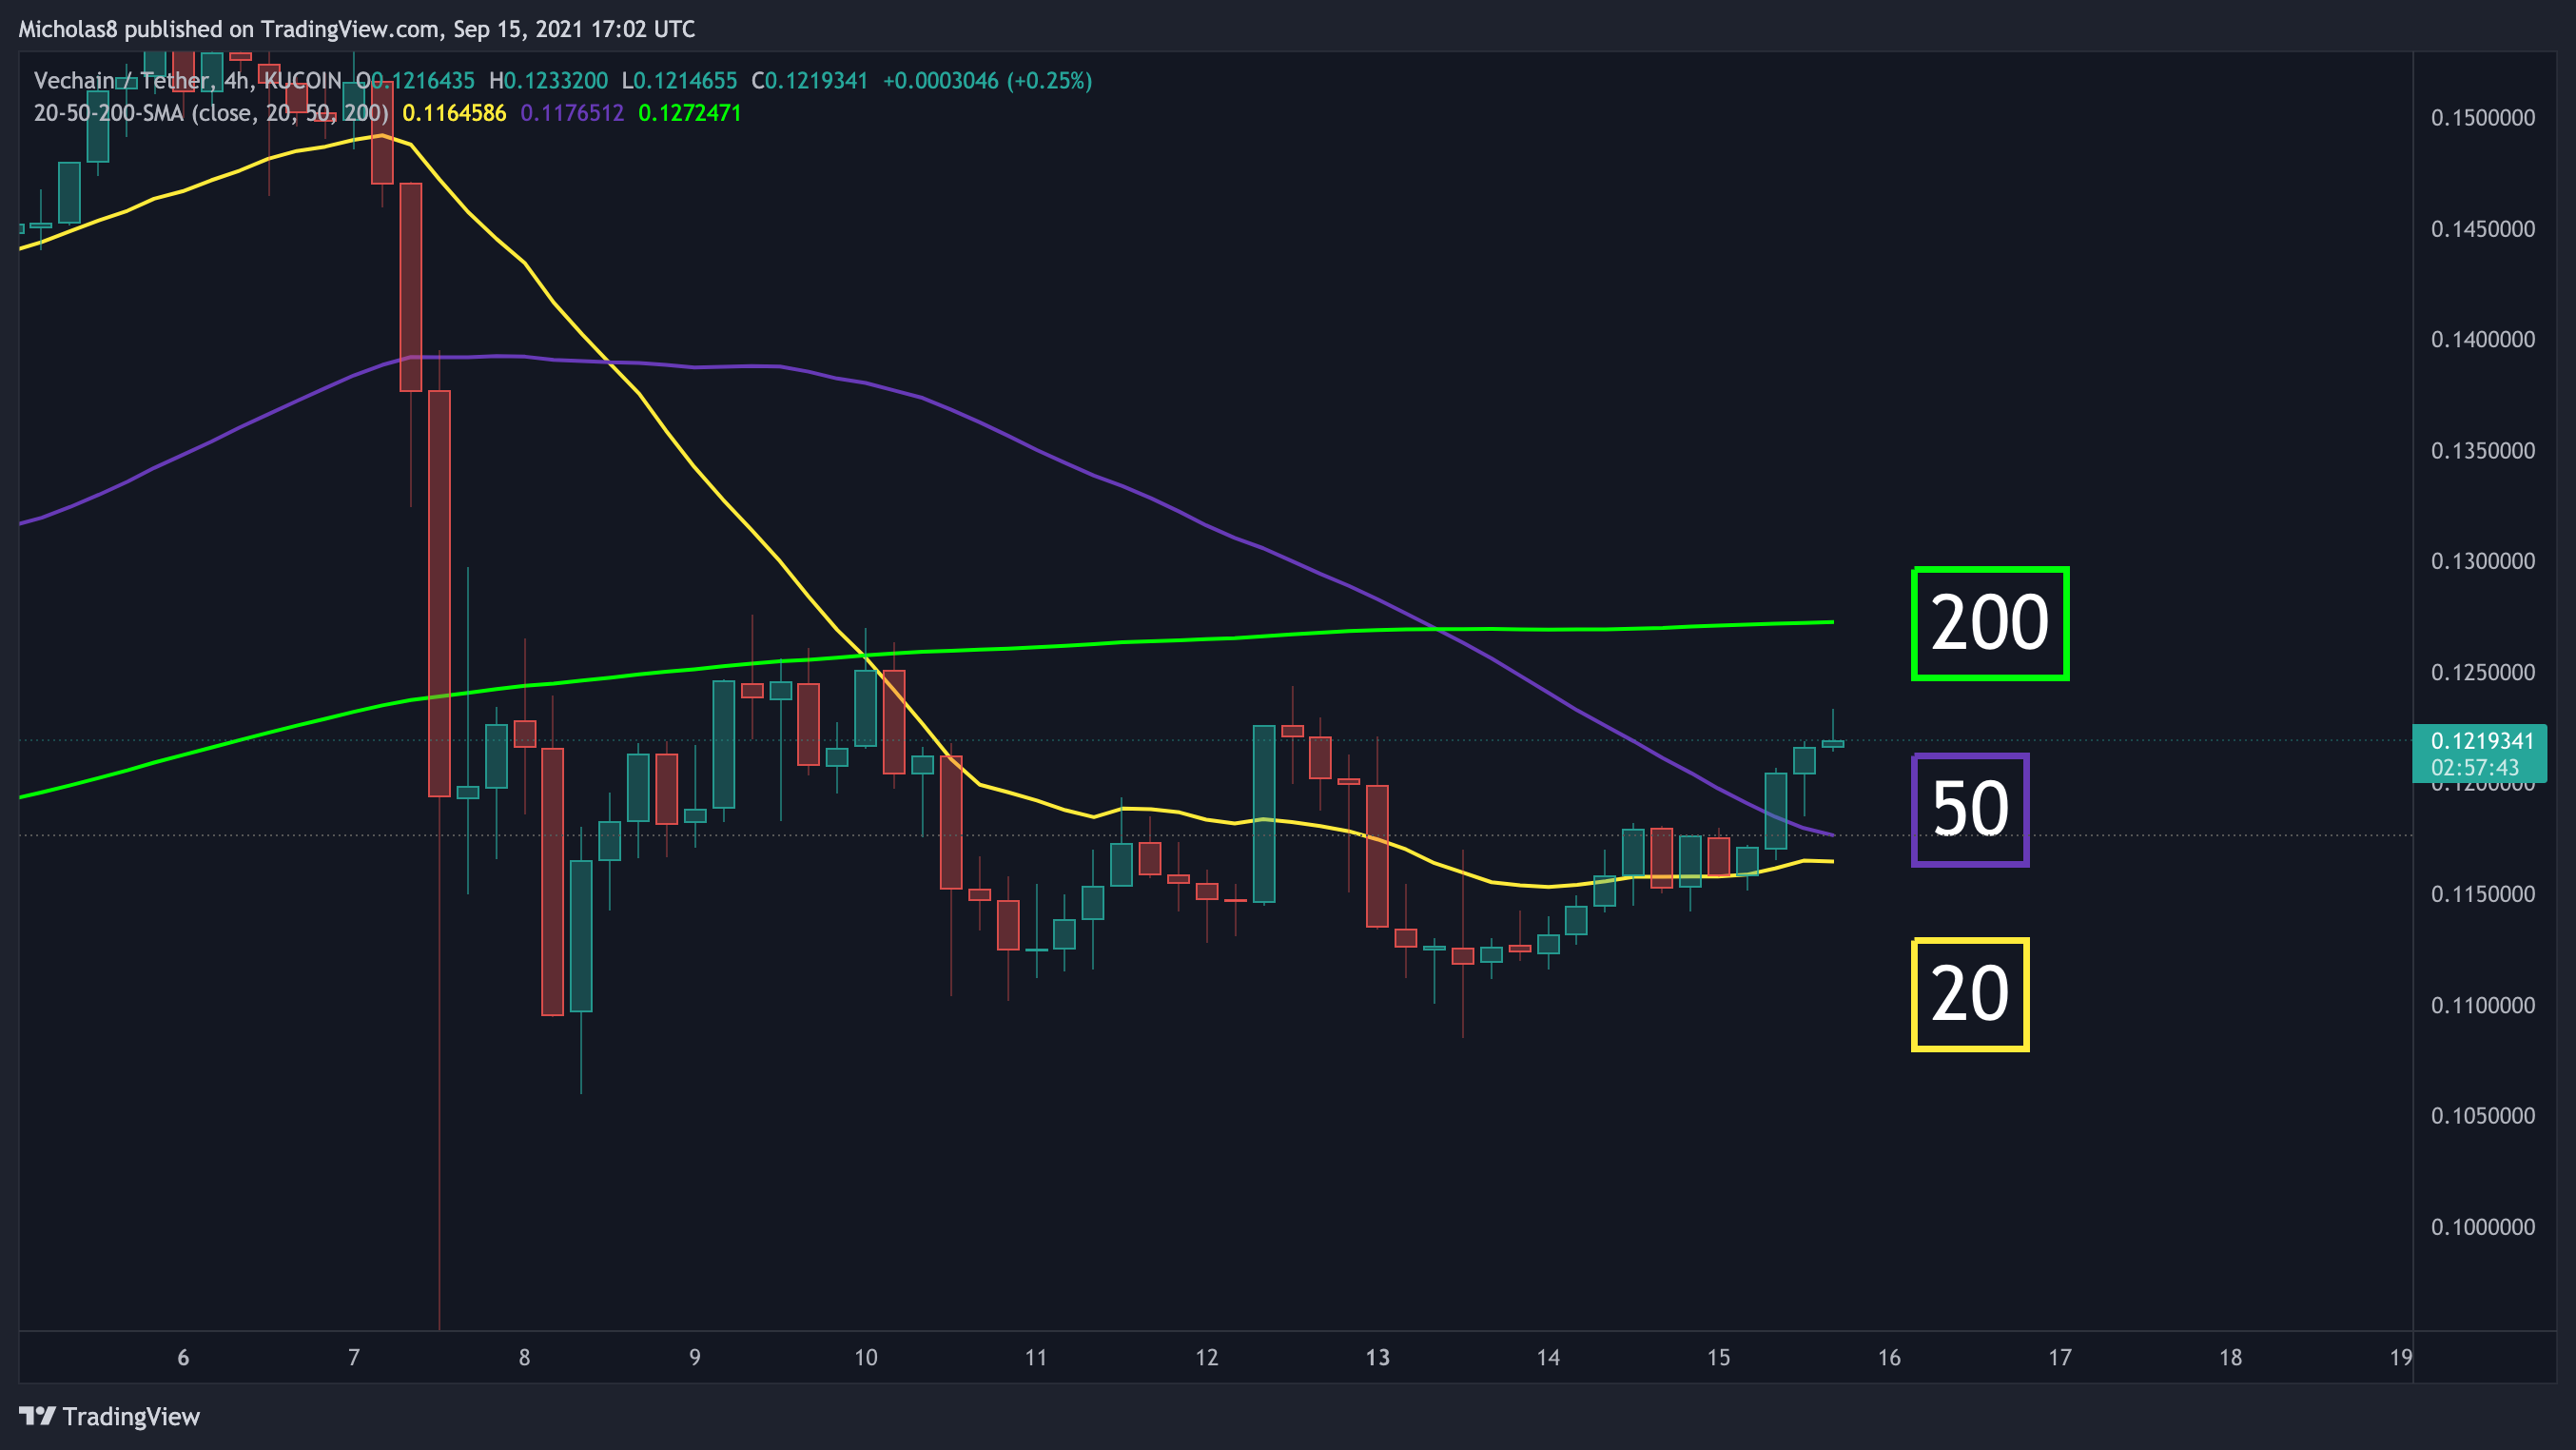
VET is trading above both the 20 and 50 SMAs, ideally, they serve as support. If we do see a move to the upside, the 200 SMA will likely provide some resistance.
Divergences
Hidden Bearish Divergence (red)
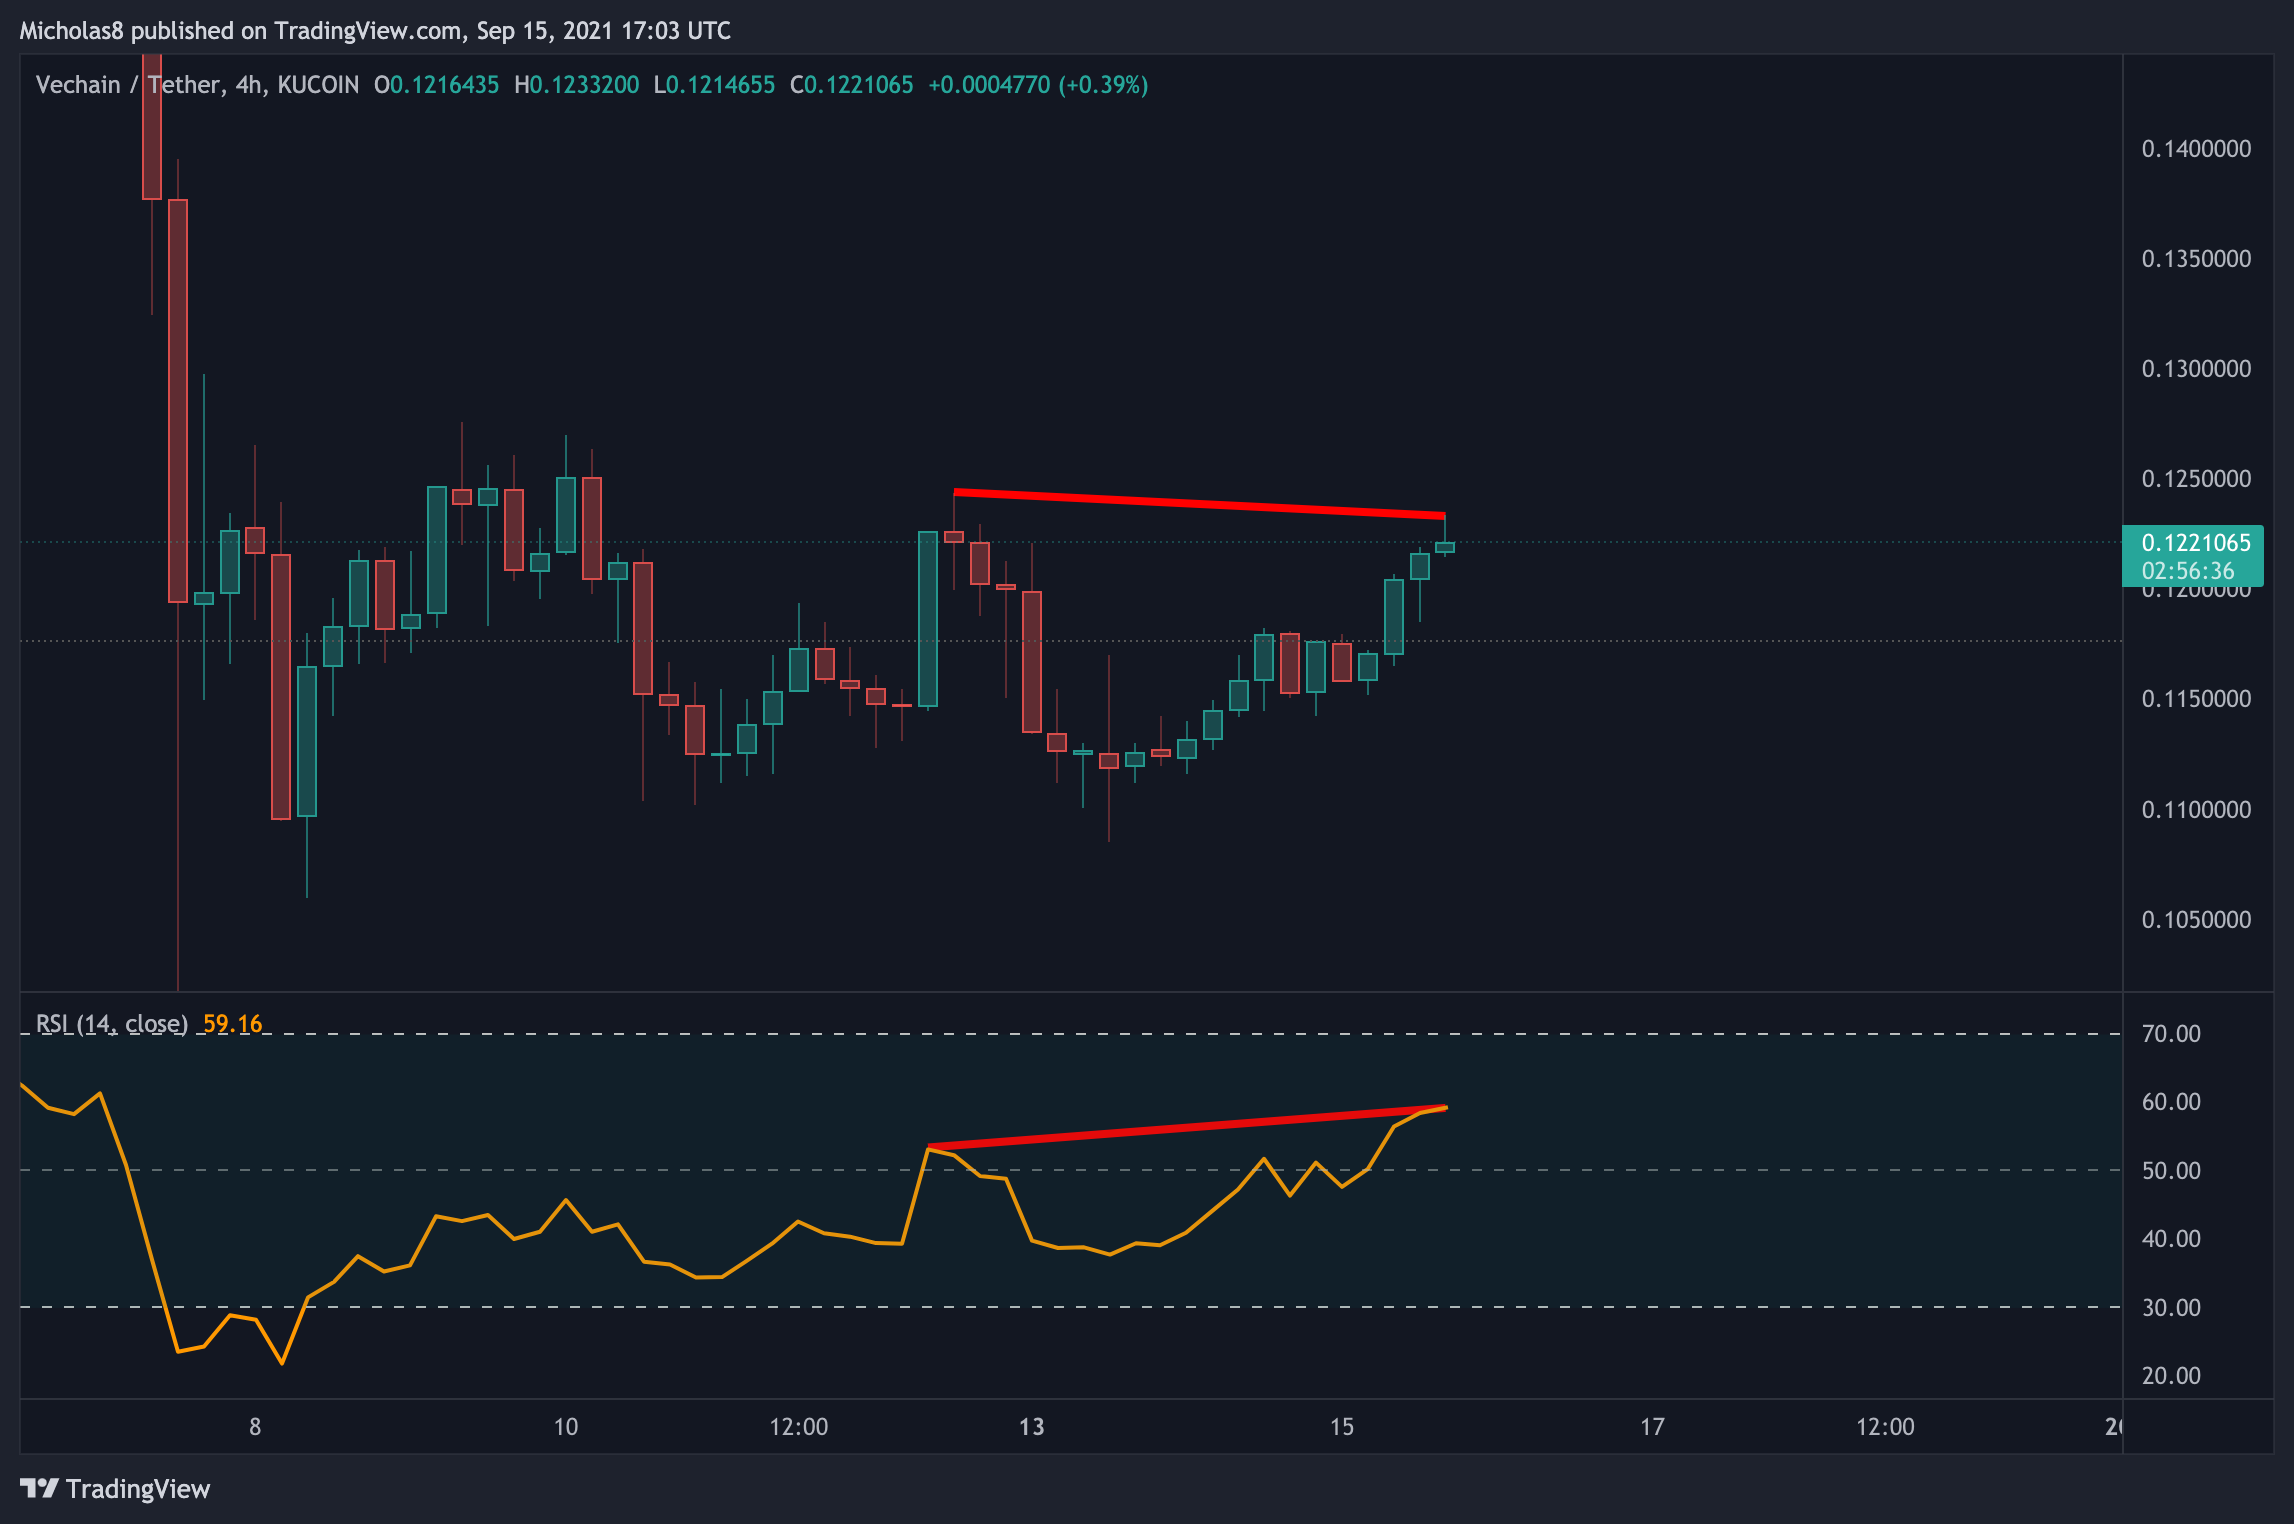
We have a lower high in price, with a higher high on the RSI. This is a hidden bearish divergence, which signals a possible trend continuation. In this case, that means down.
Note: This is rather close to being invalidated. Another thing as well – the strongest divergences are in oversold/overbought conditions.
Invalidation: Higher high in price with a higher high RSI.
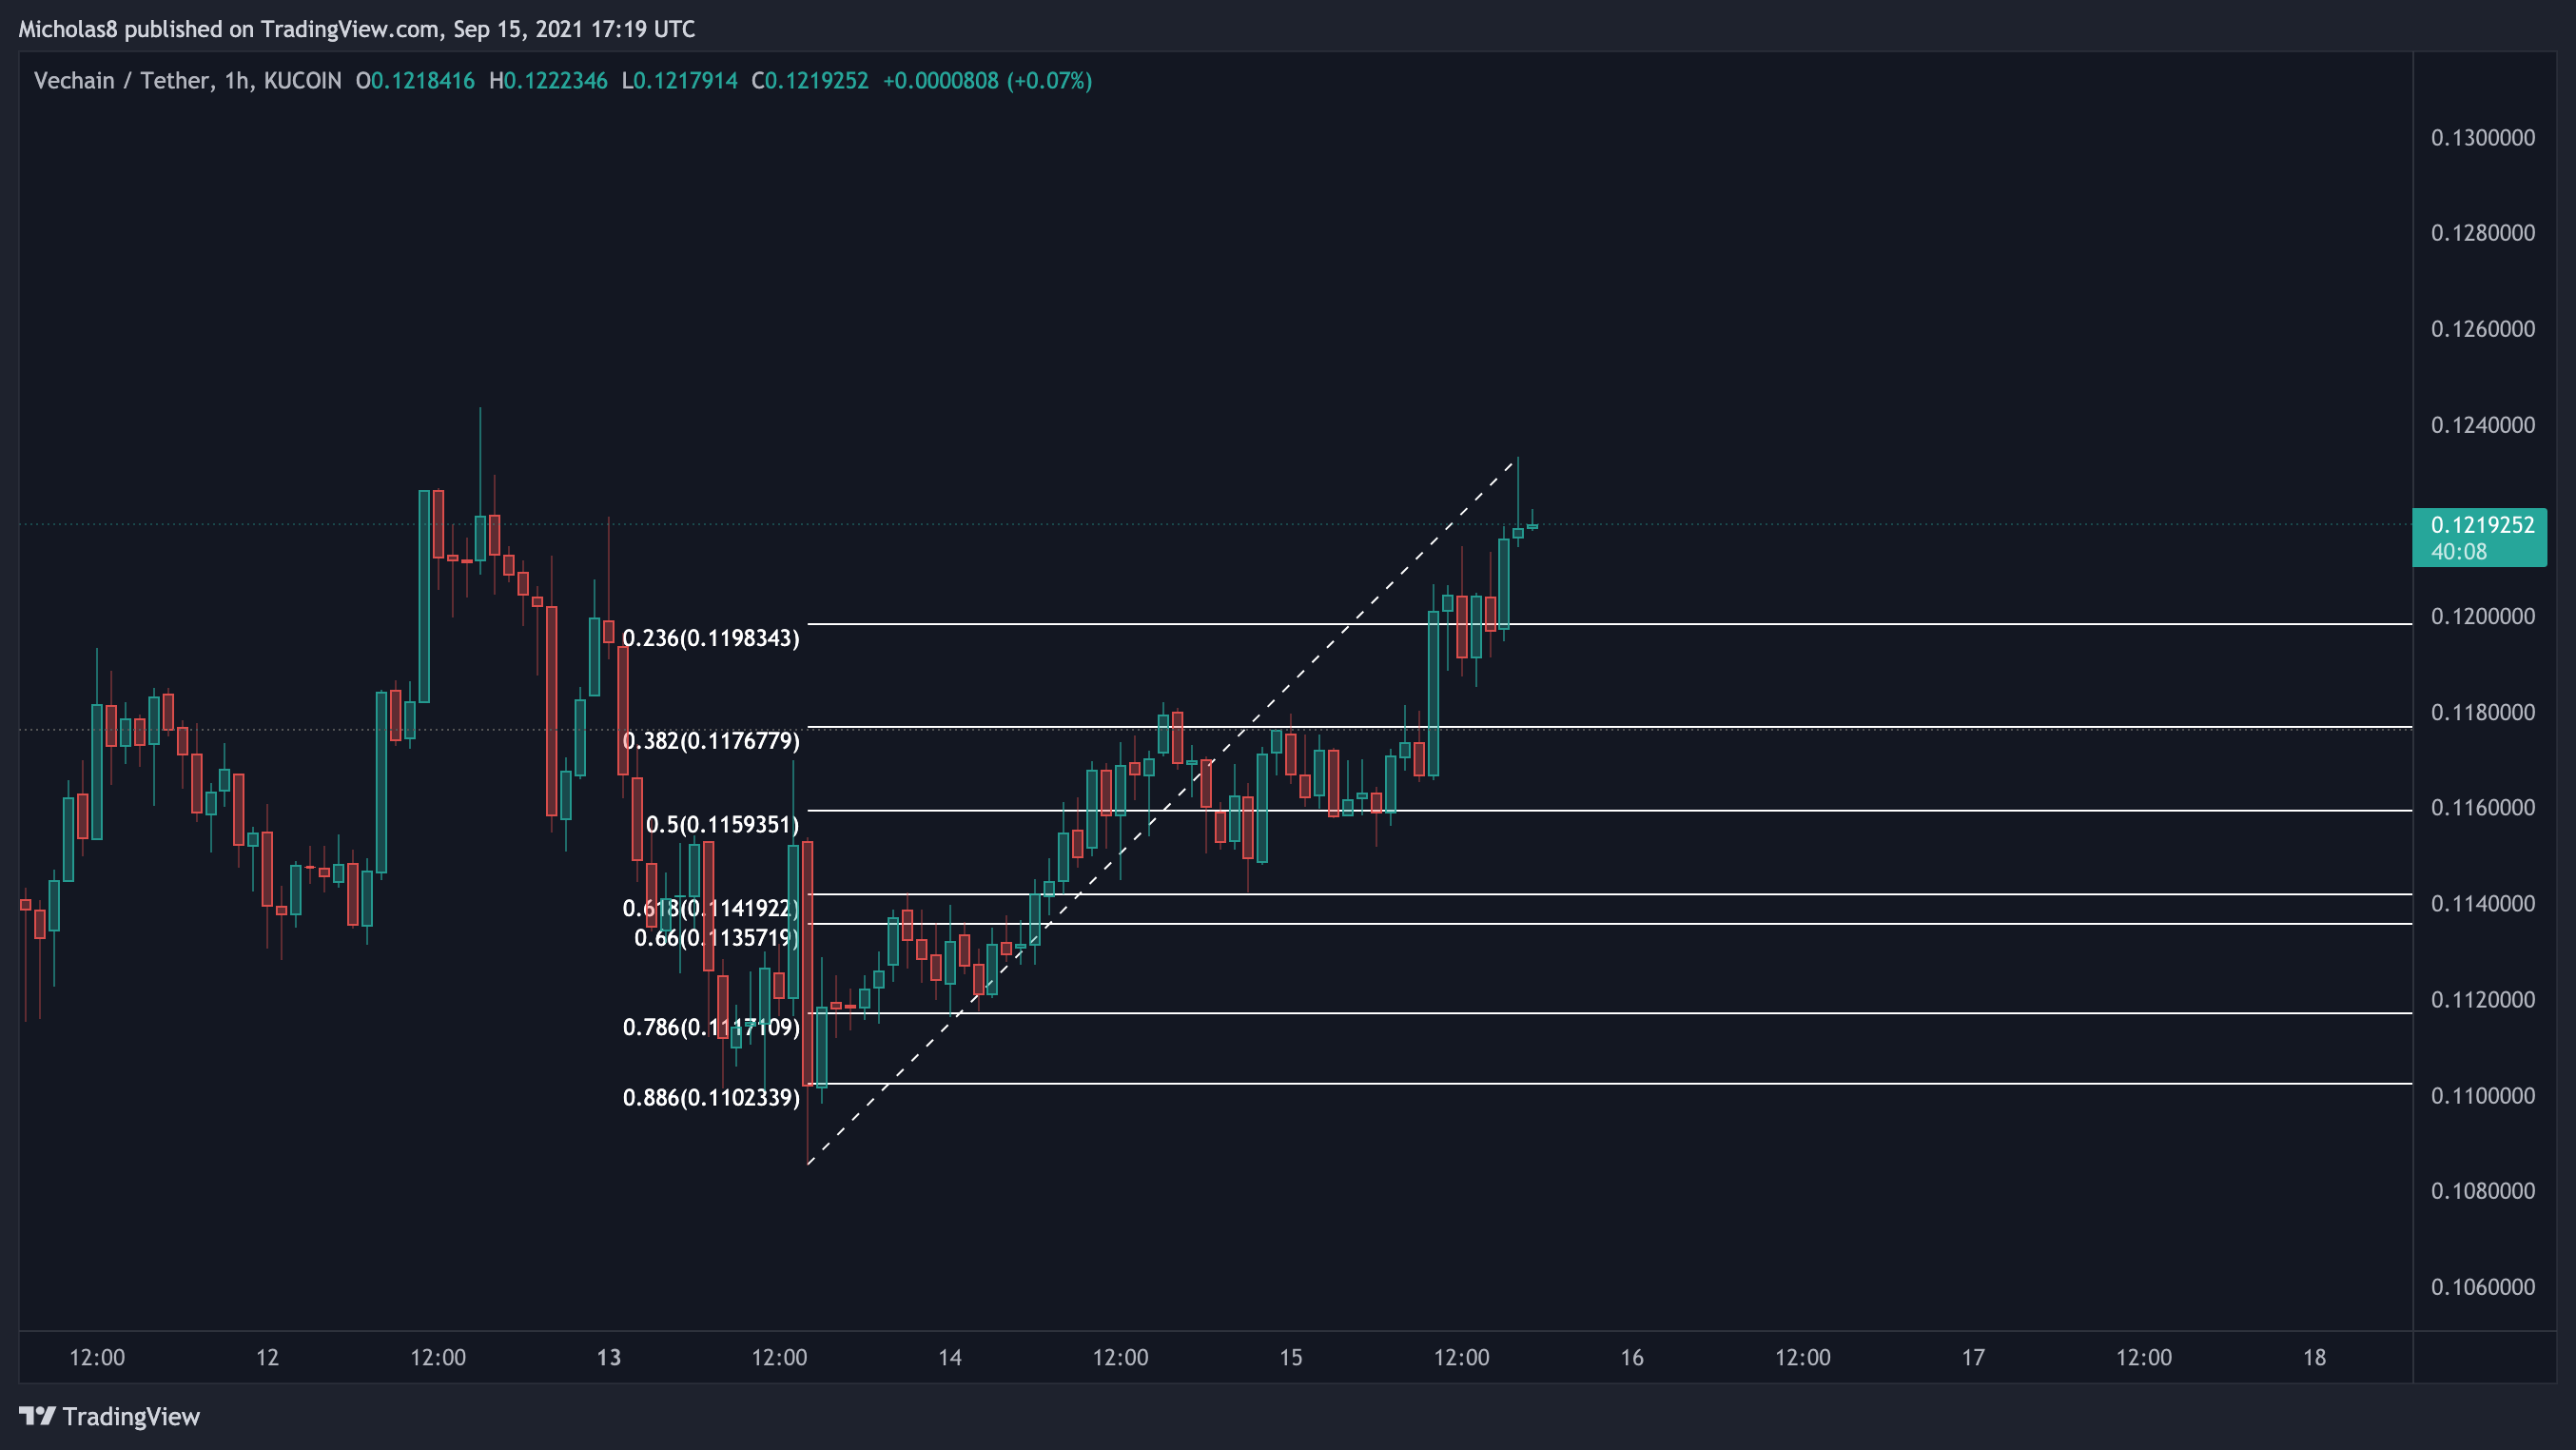
Patterns
*Please note not all technical targets will be hit, so be aware of all key levels and Fibonacci Levels, and also look out for divergences as they have the power to reverse a trend
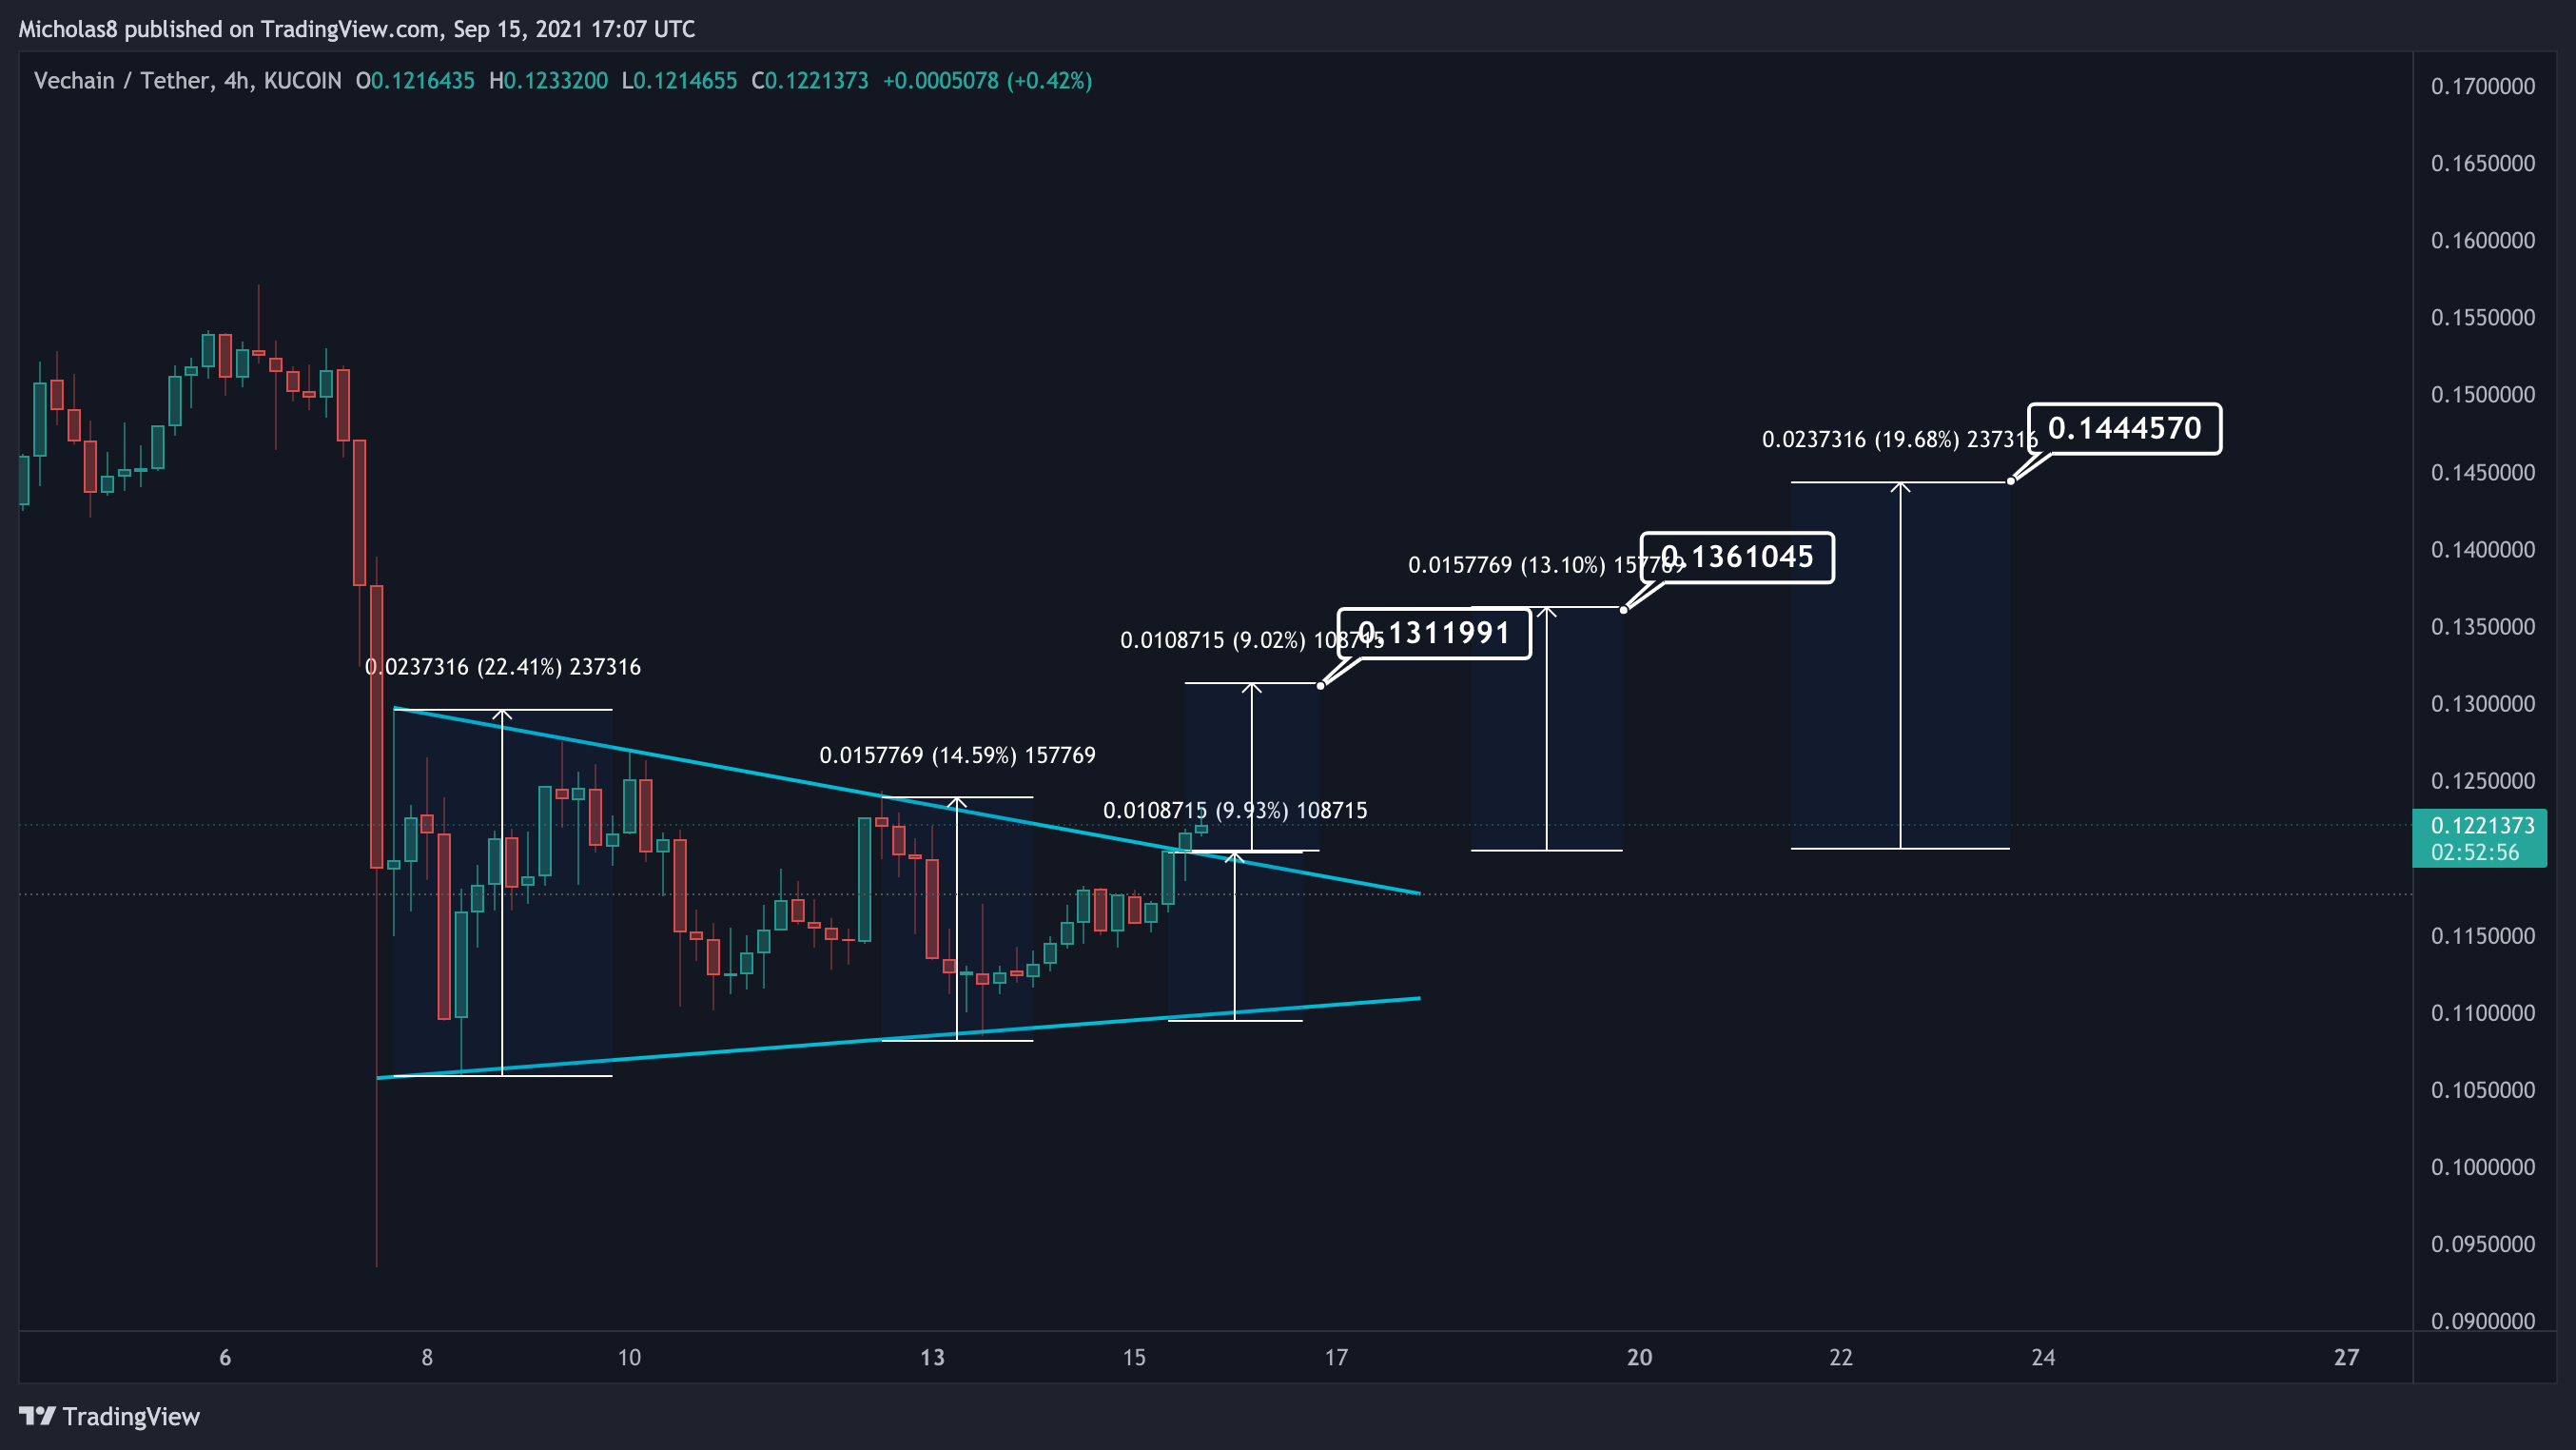
Technical targets:
0.1311991
0.1361045
0.1444570
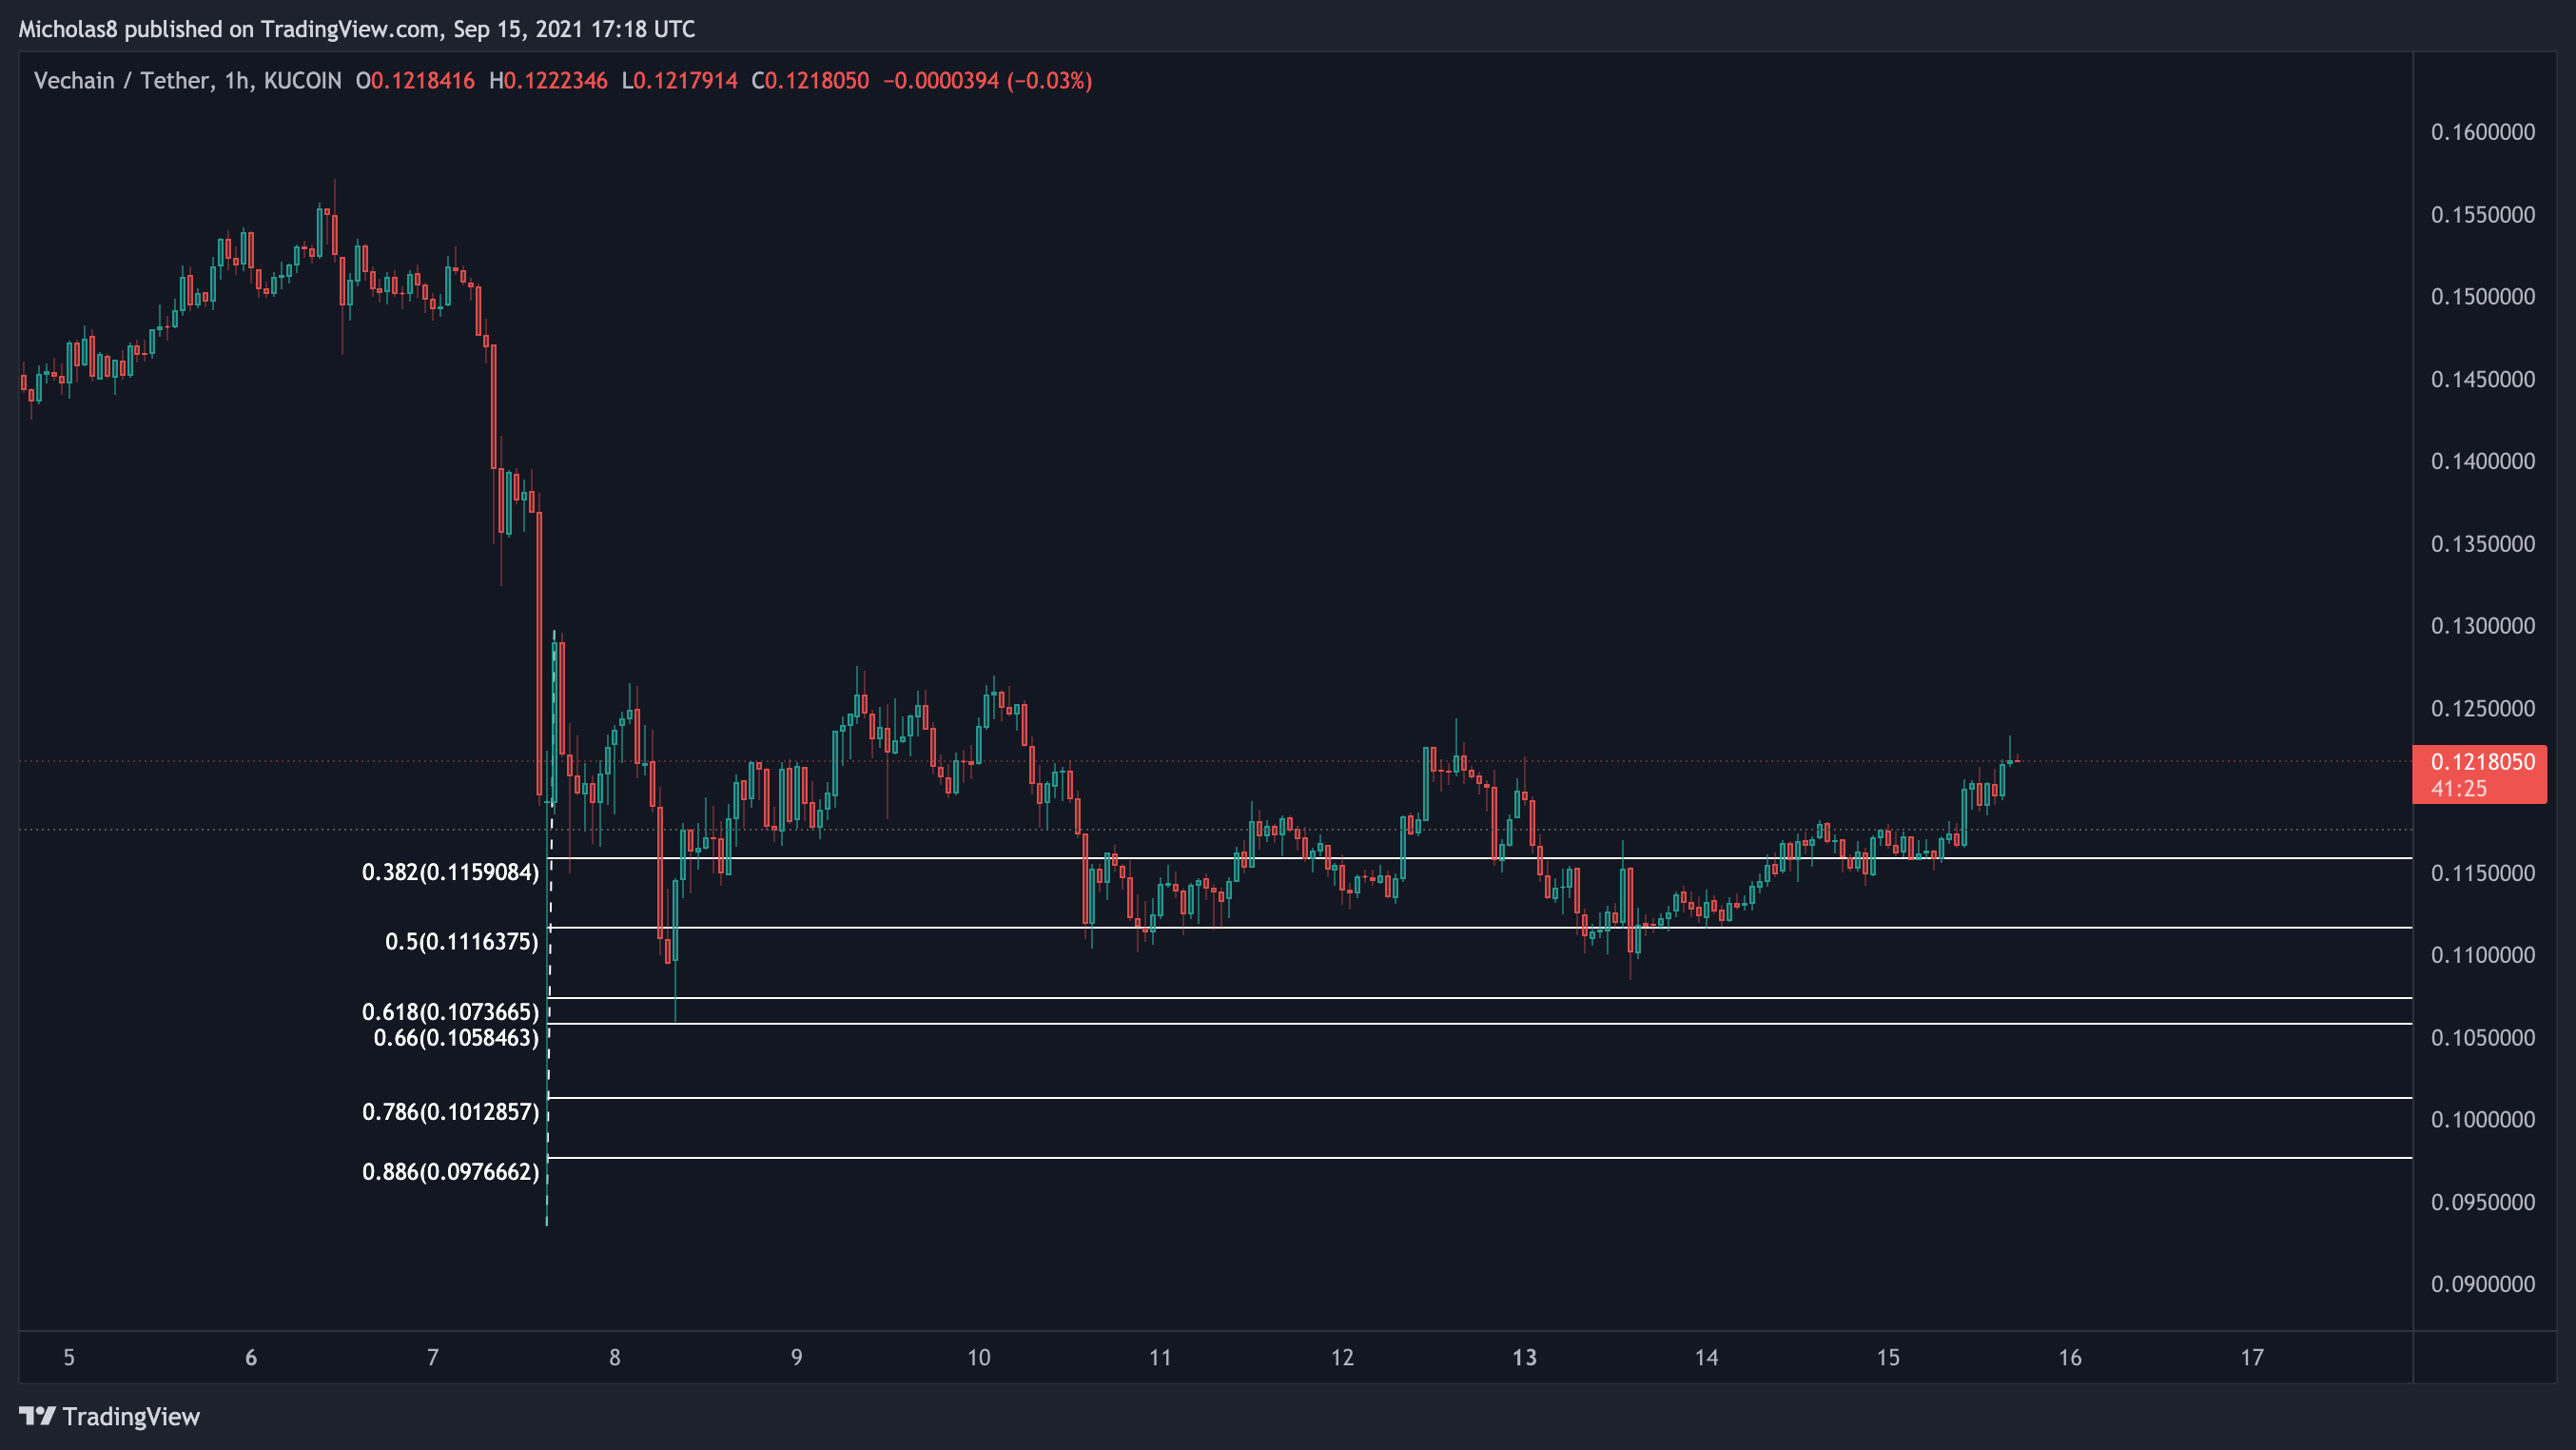
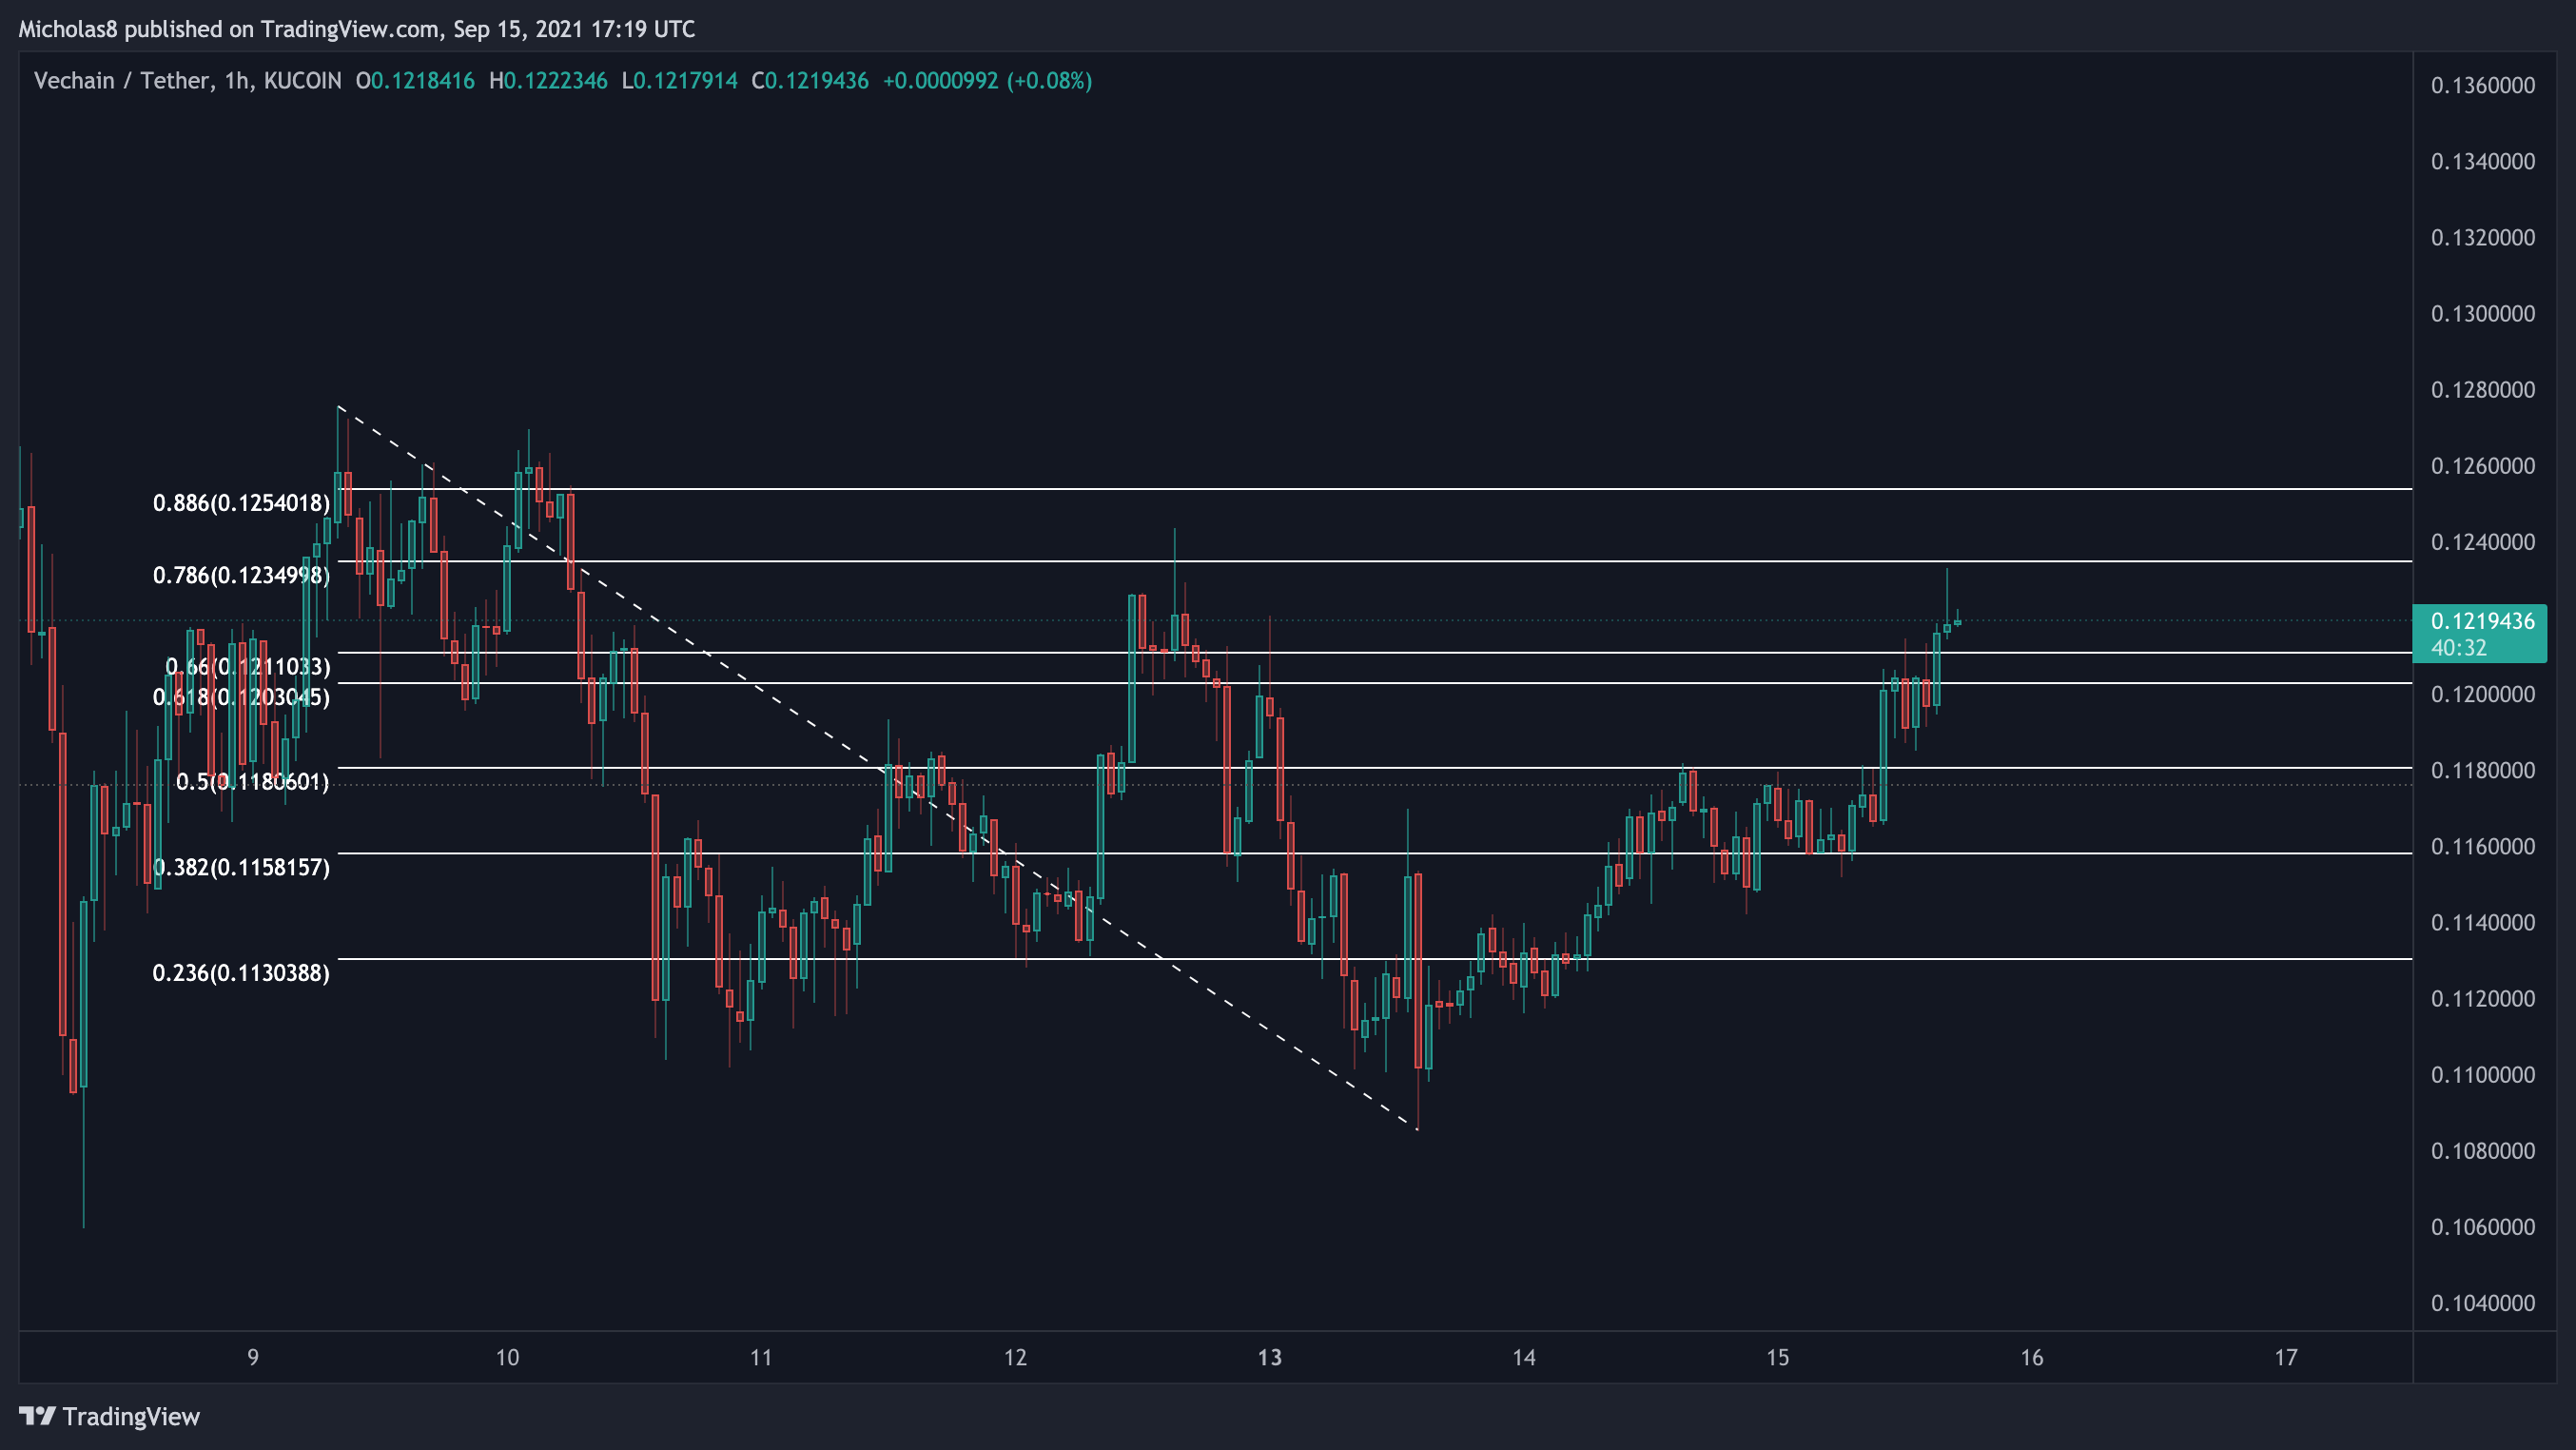
1-hour Timeframe
EMA Ribbon
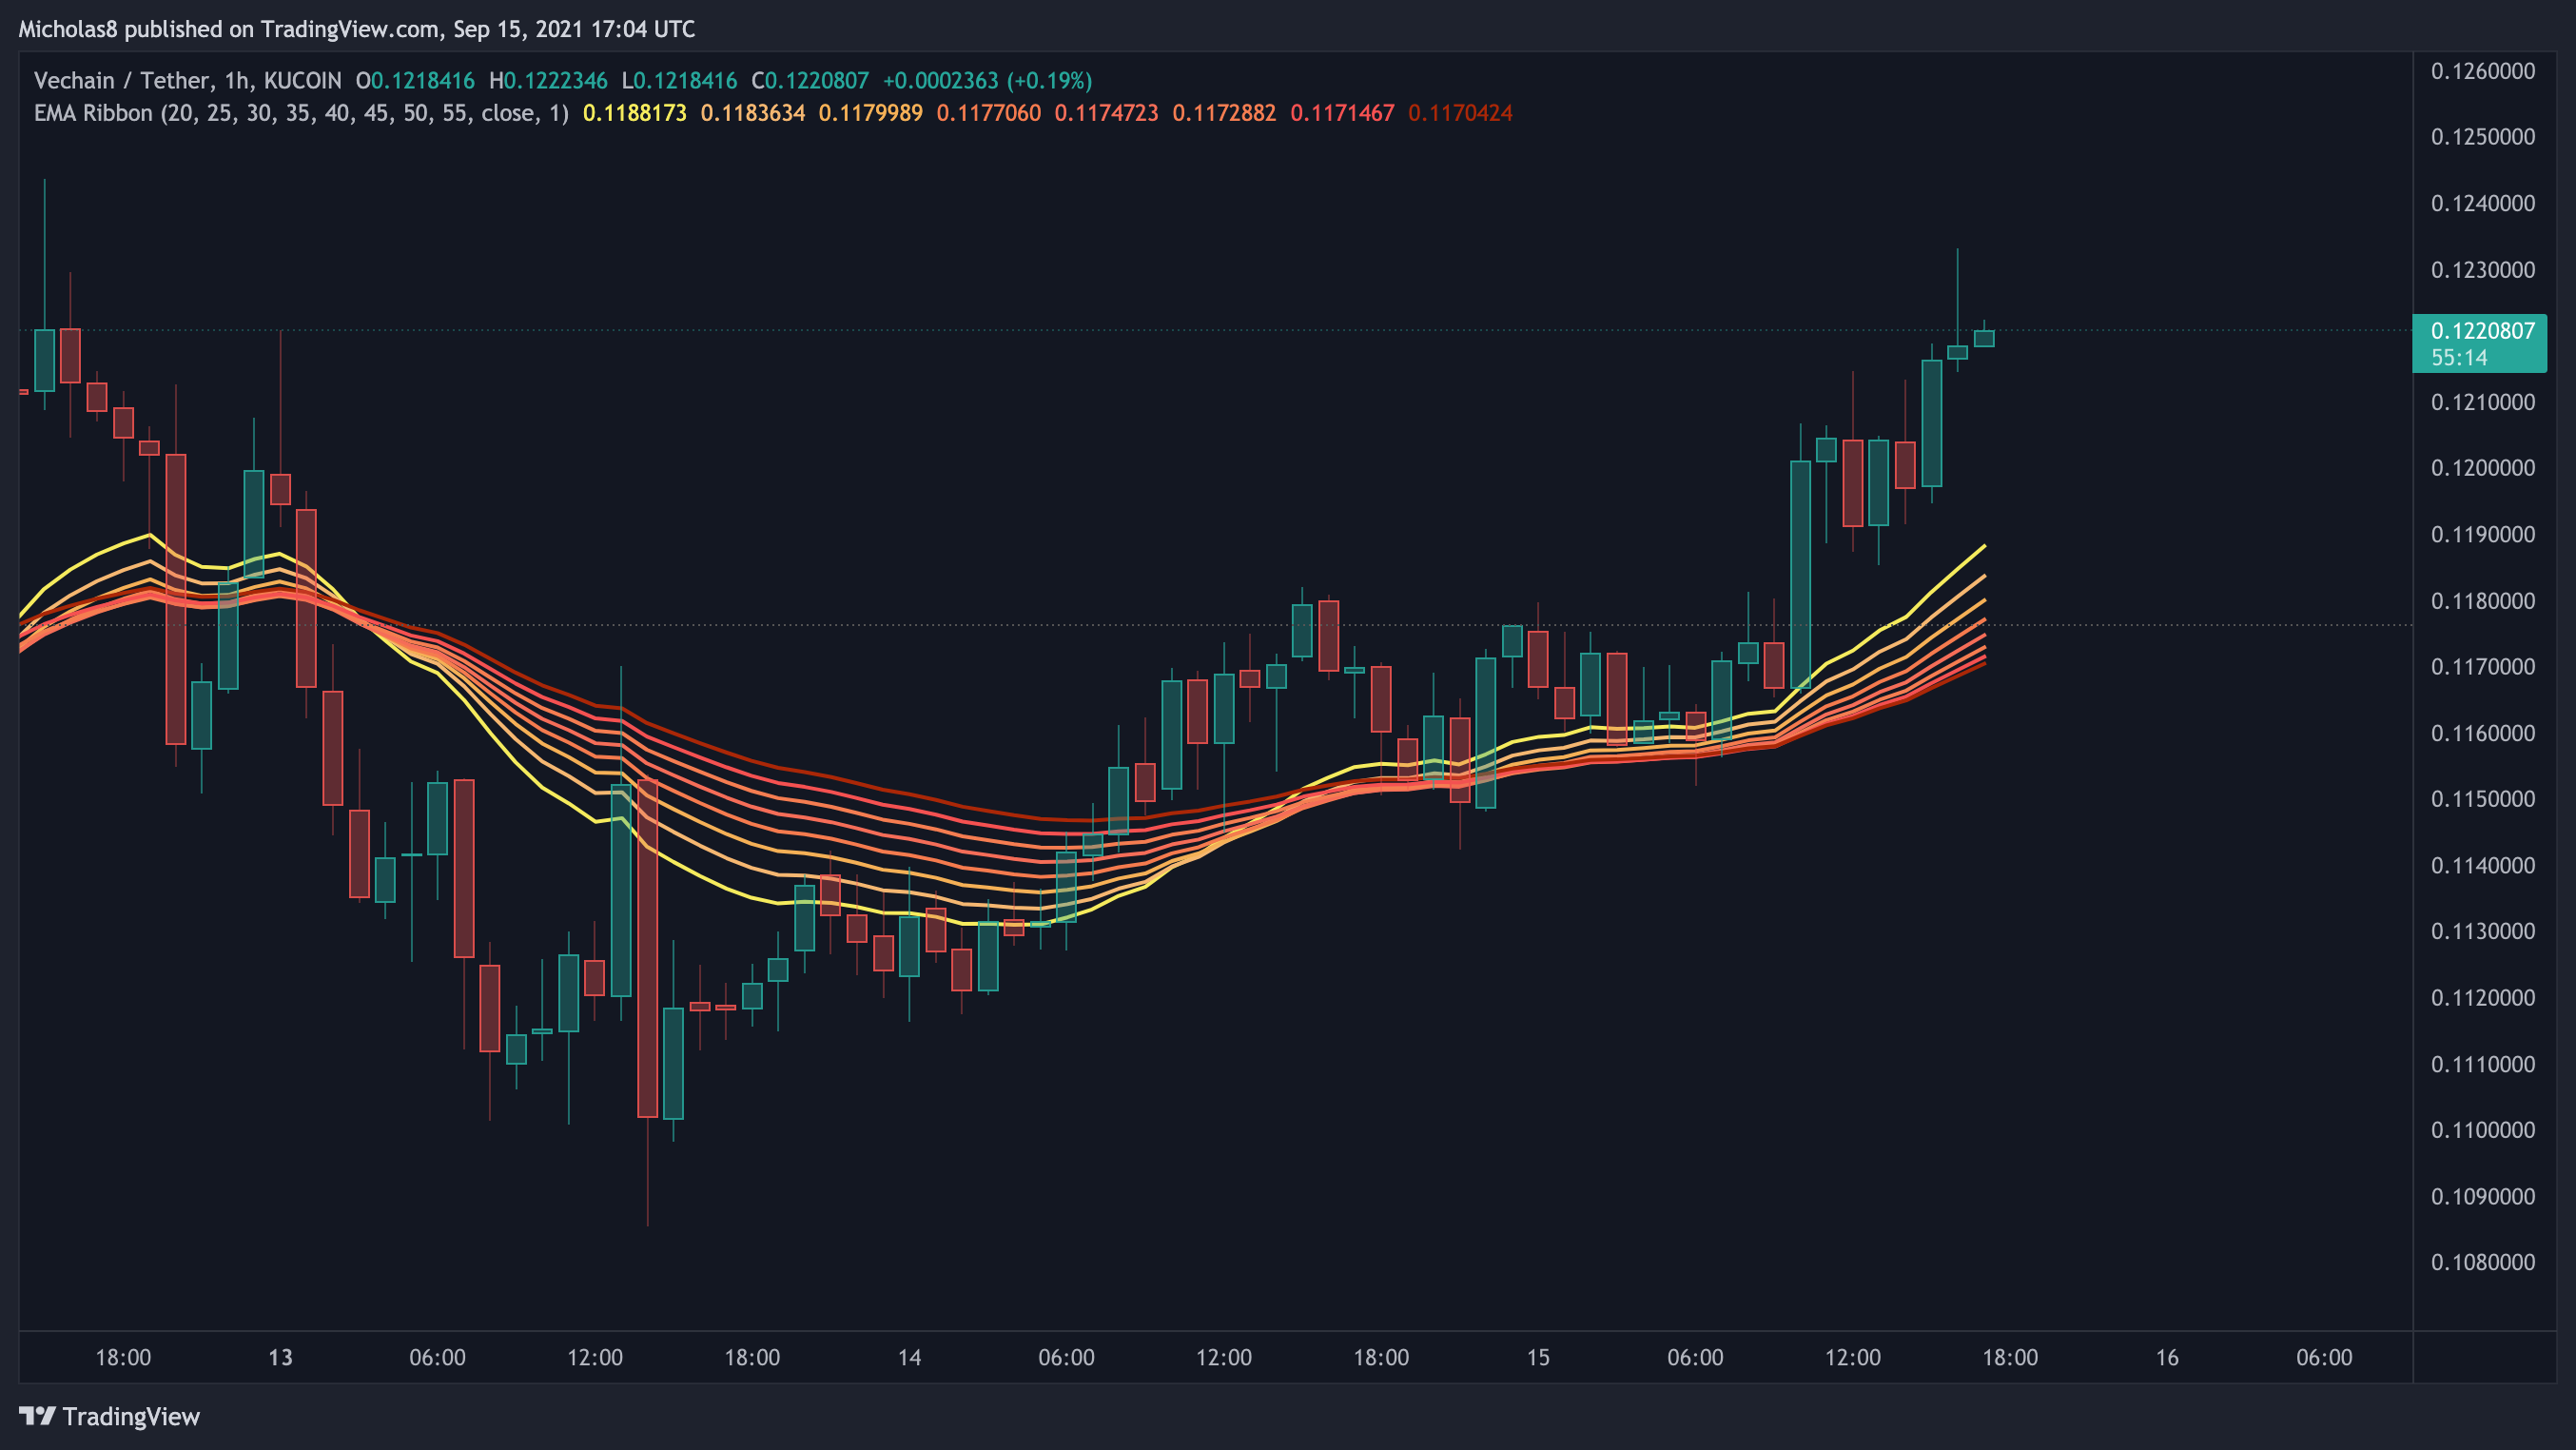
VET is currently trading above the 1H EMA ribbon on this timeframe. Ideally, it will serve as support the next time we test it.
Divergences
Bearish Divergence (red)
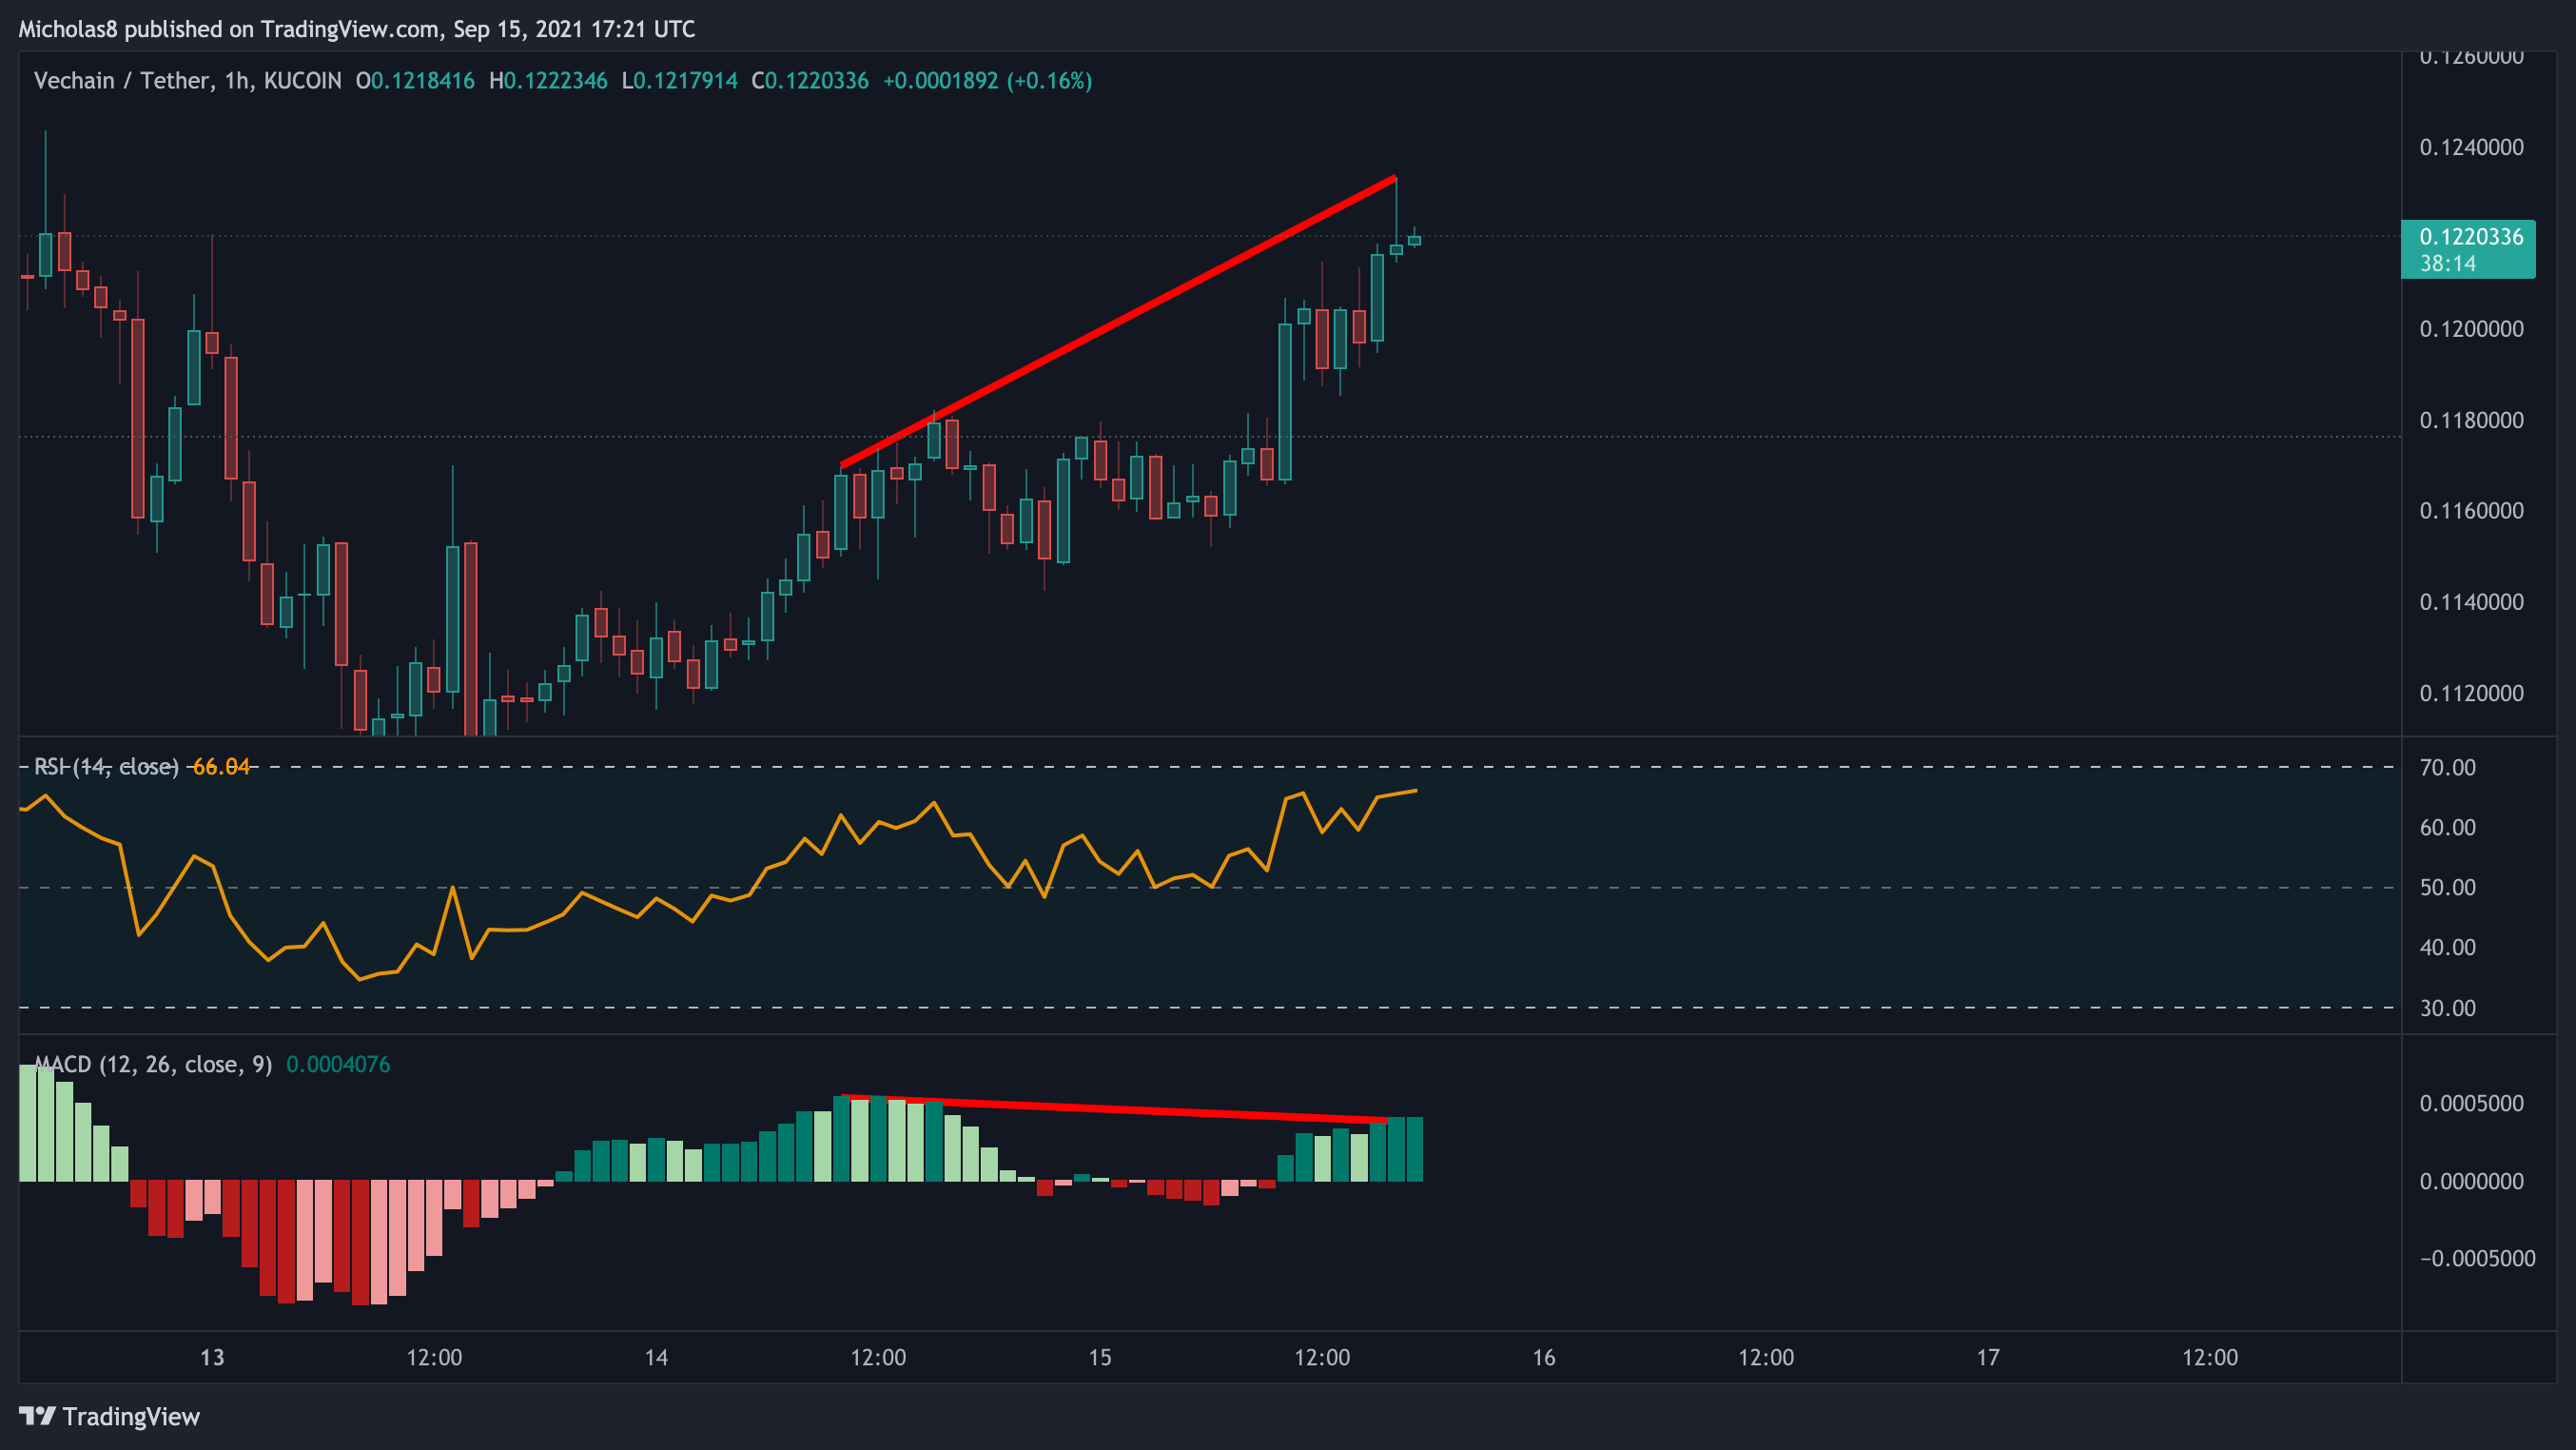
We have a higher high in price, with a lower high on the MACD. This is a bearish divergence, which signals a possible trend reversal. In this case, that means down.
Note: This is close to being invalidated, and the RSI still looks rather clean.
Invalidation: Higher high in price, with a higher high on the MACD.
.
.
.
KEY LEVELS
Weekly Timeframe
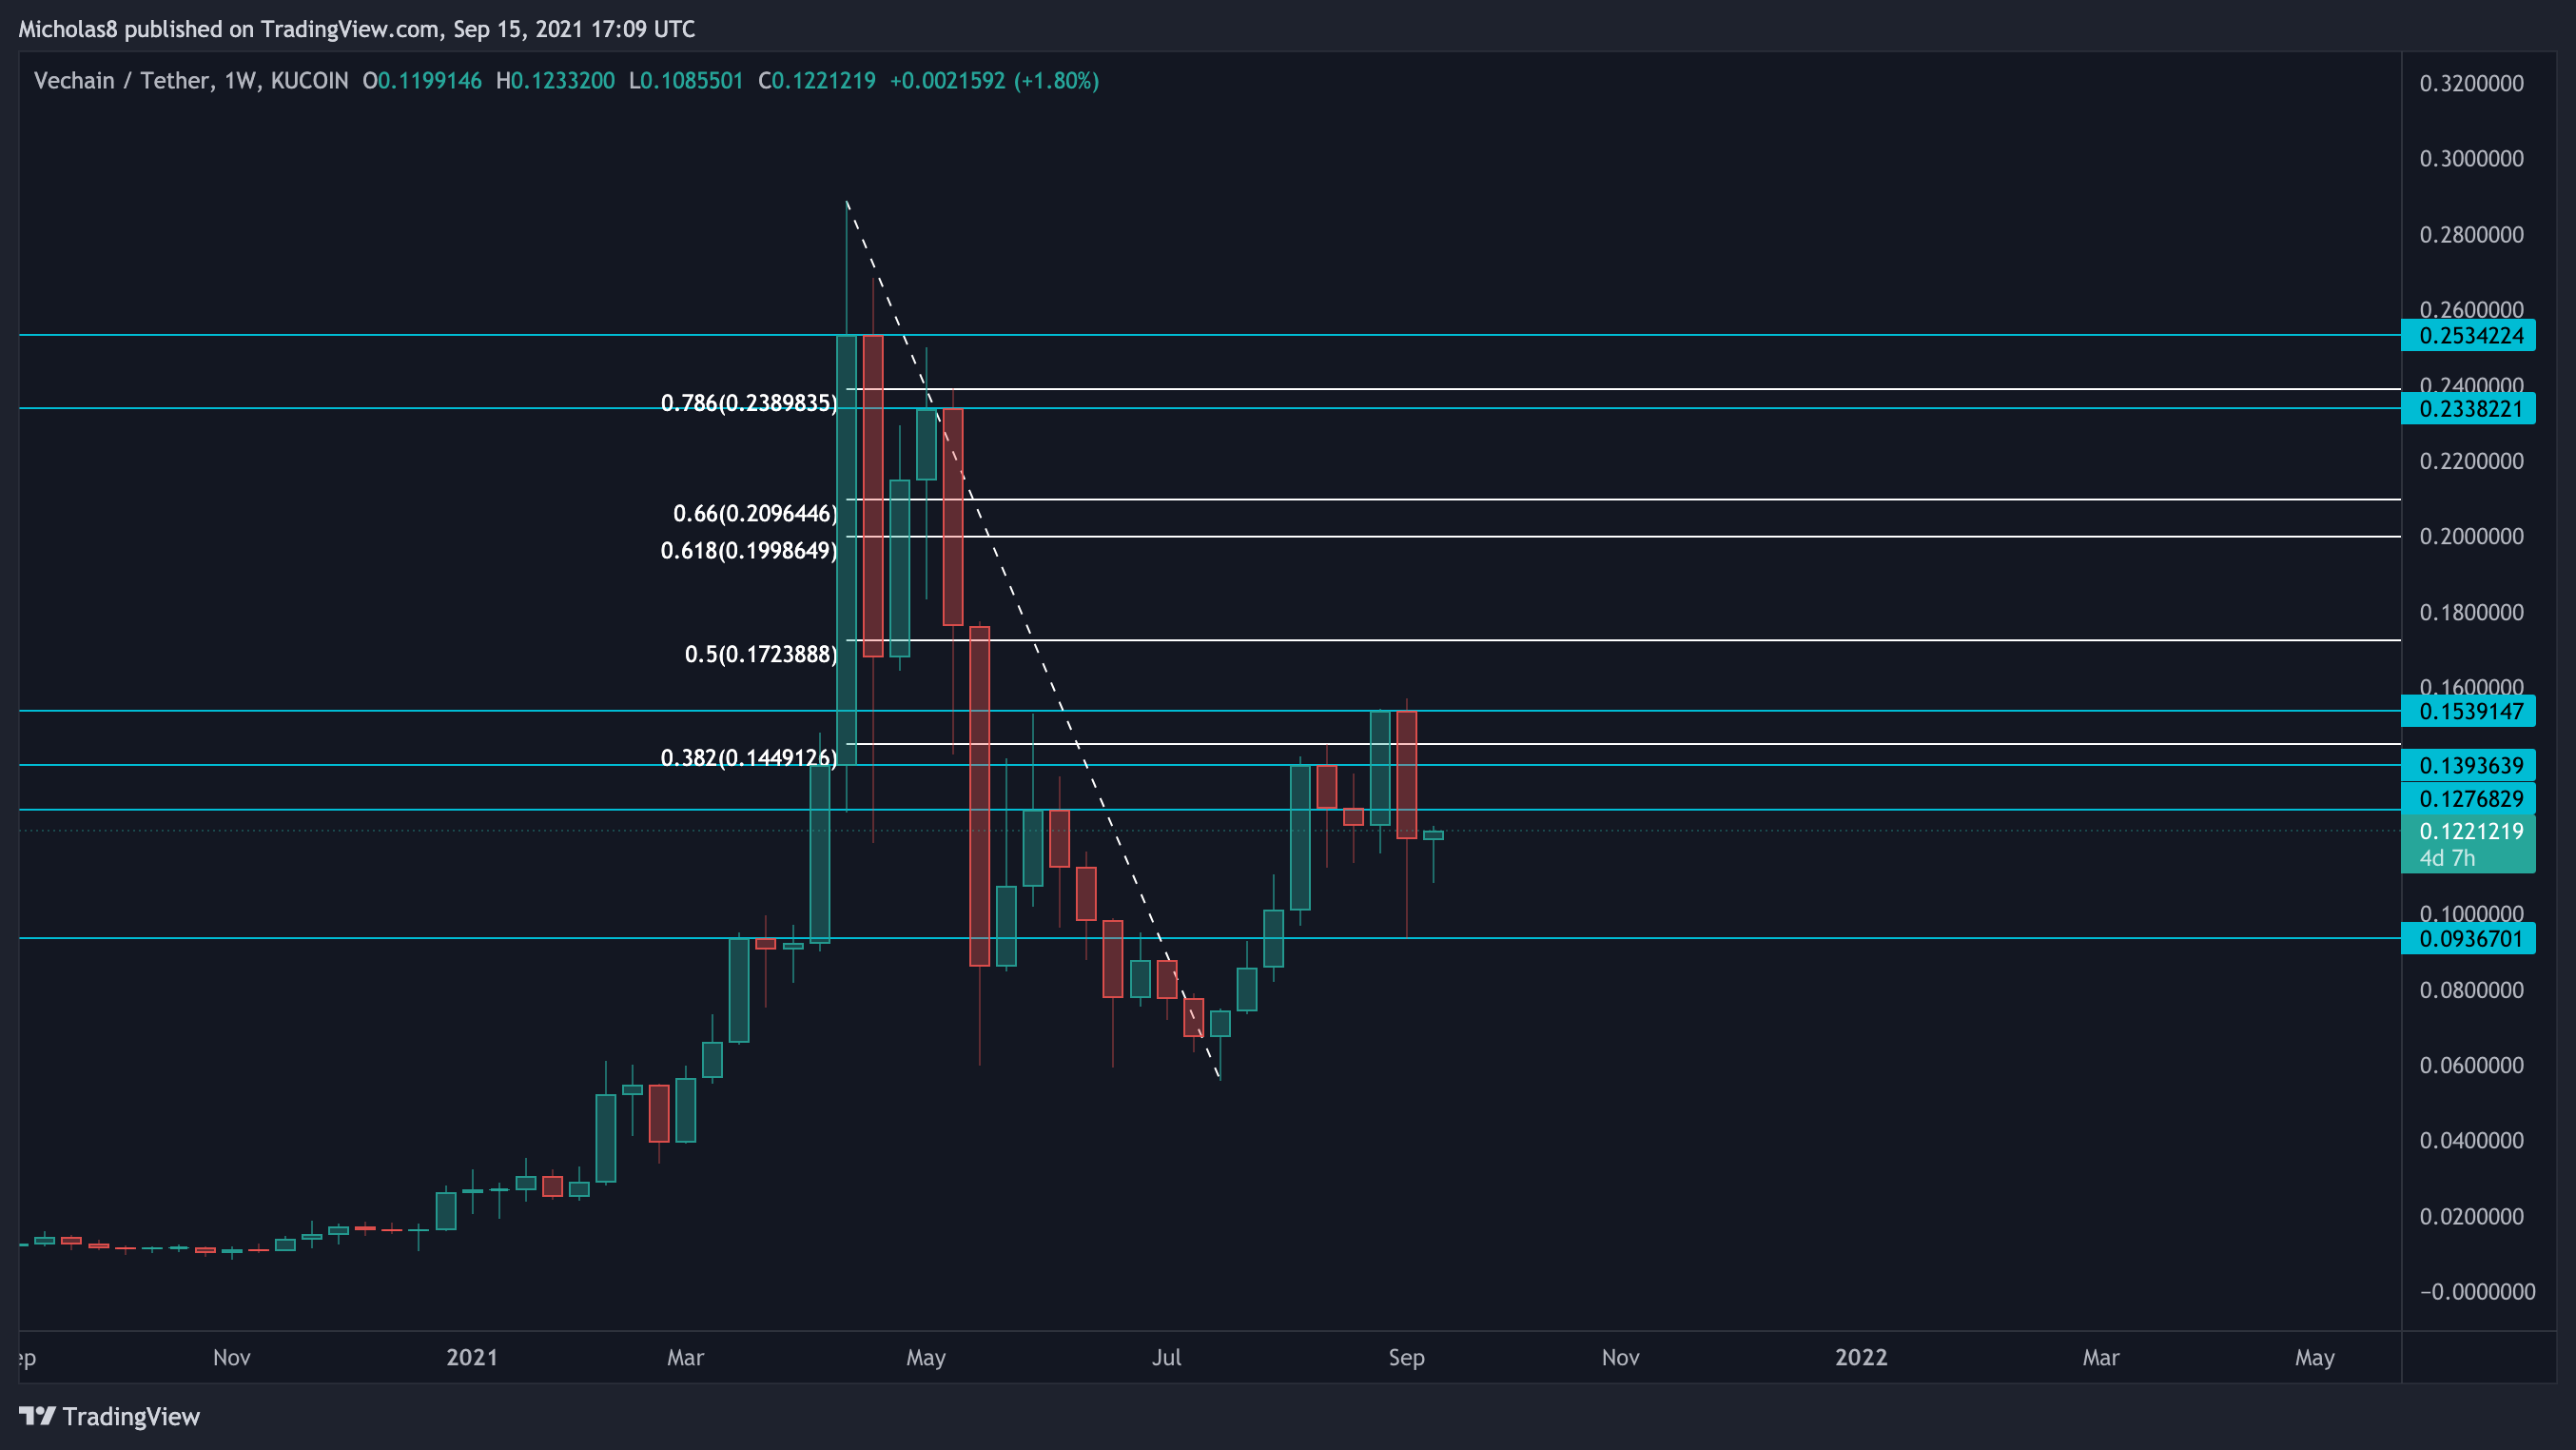
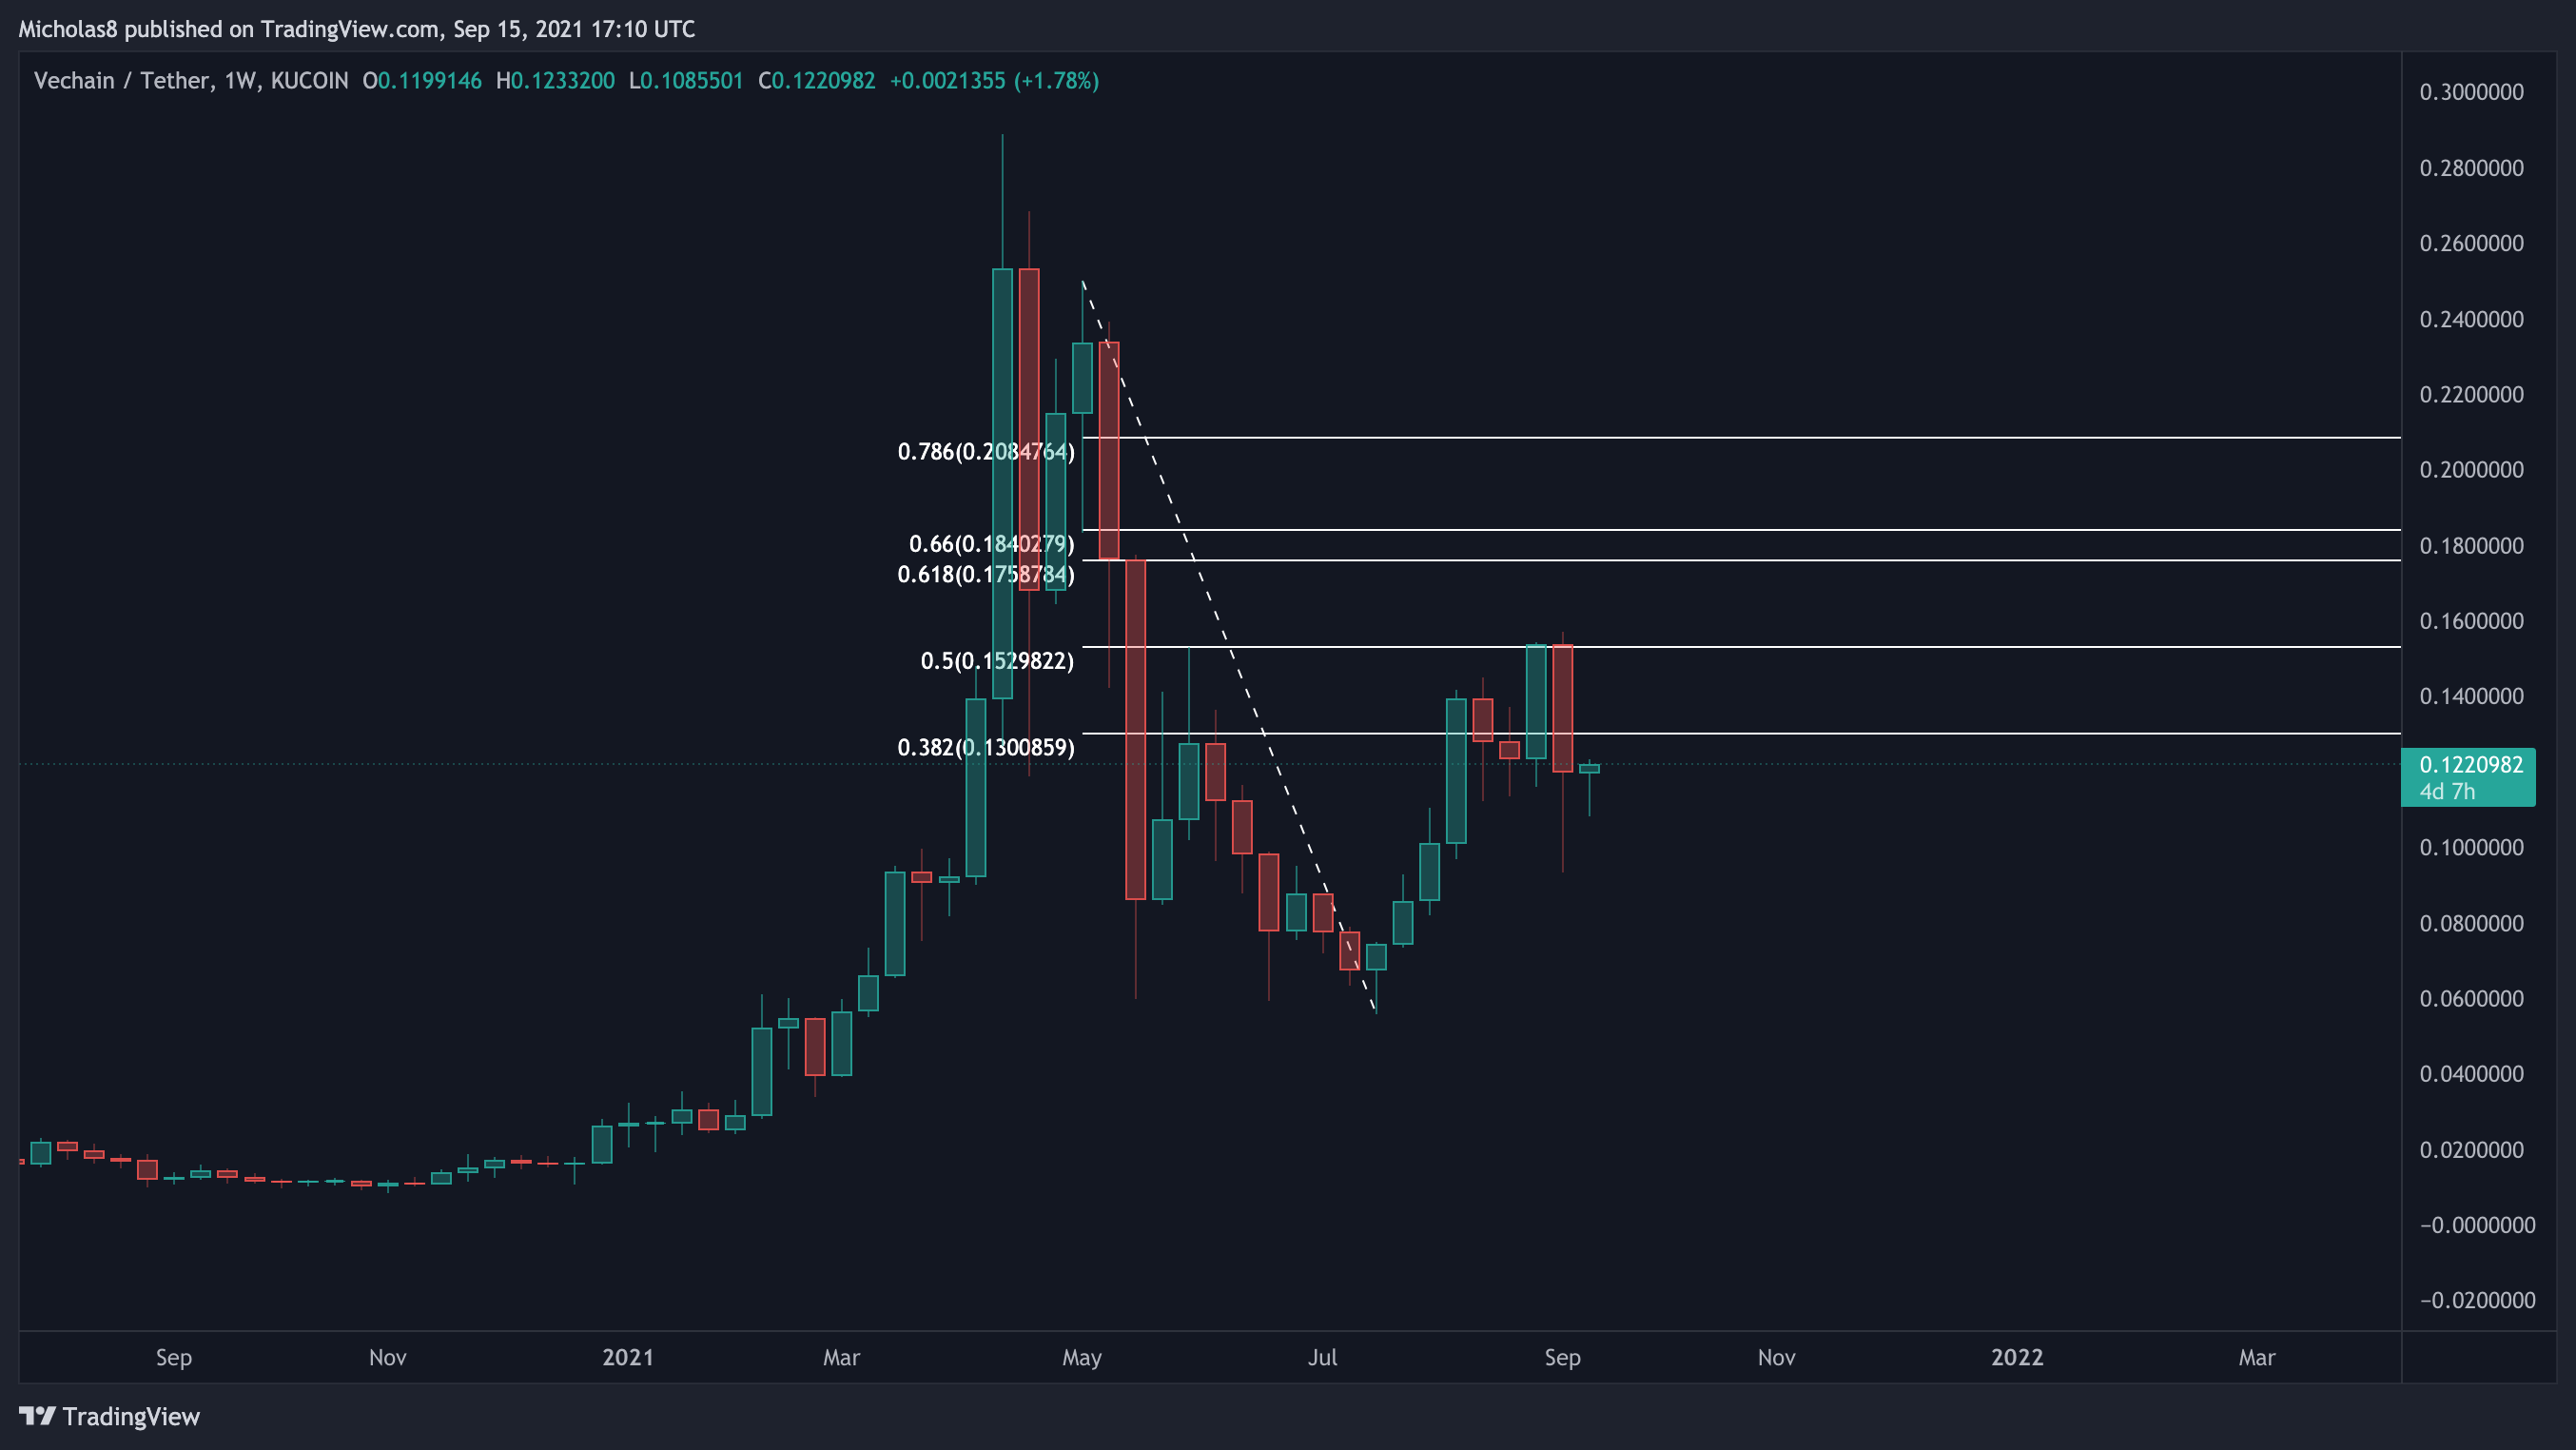
0.0937
0.1277
0.1394
0.1539
0.2338
0.2534
Fib levels
Daily Timeframe
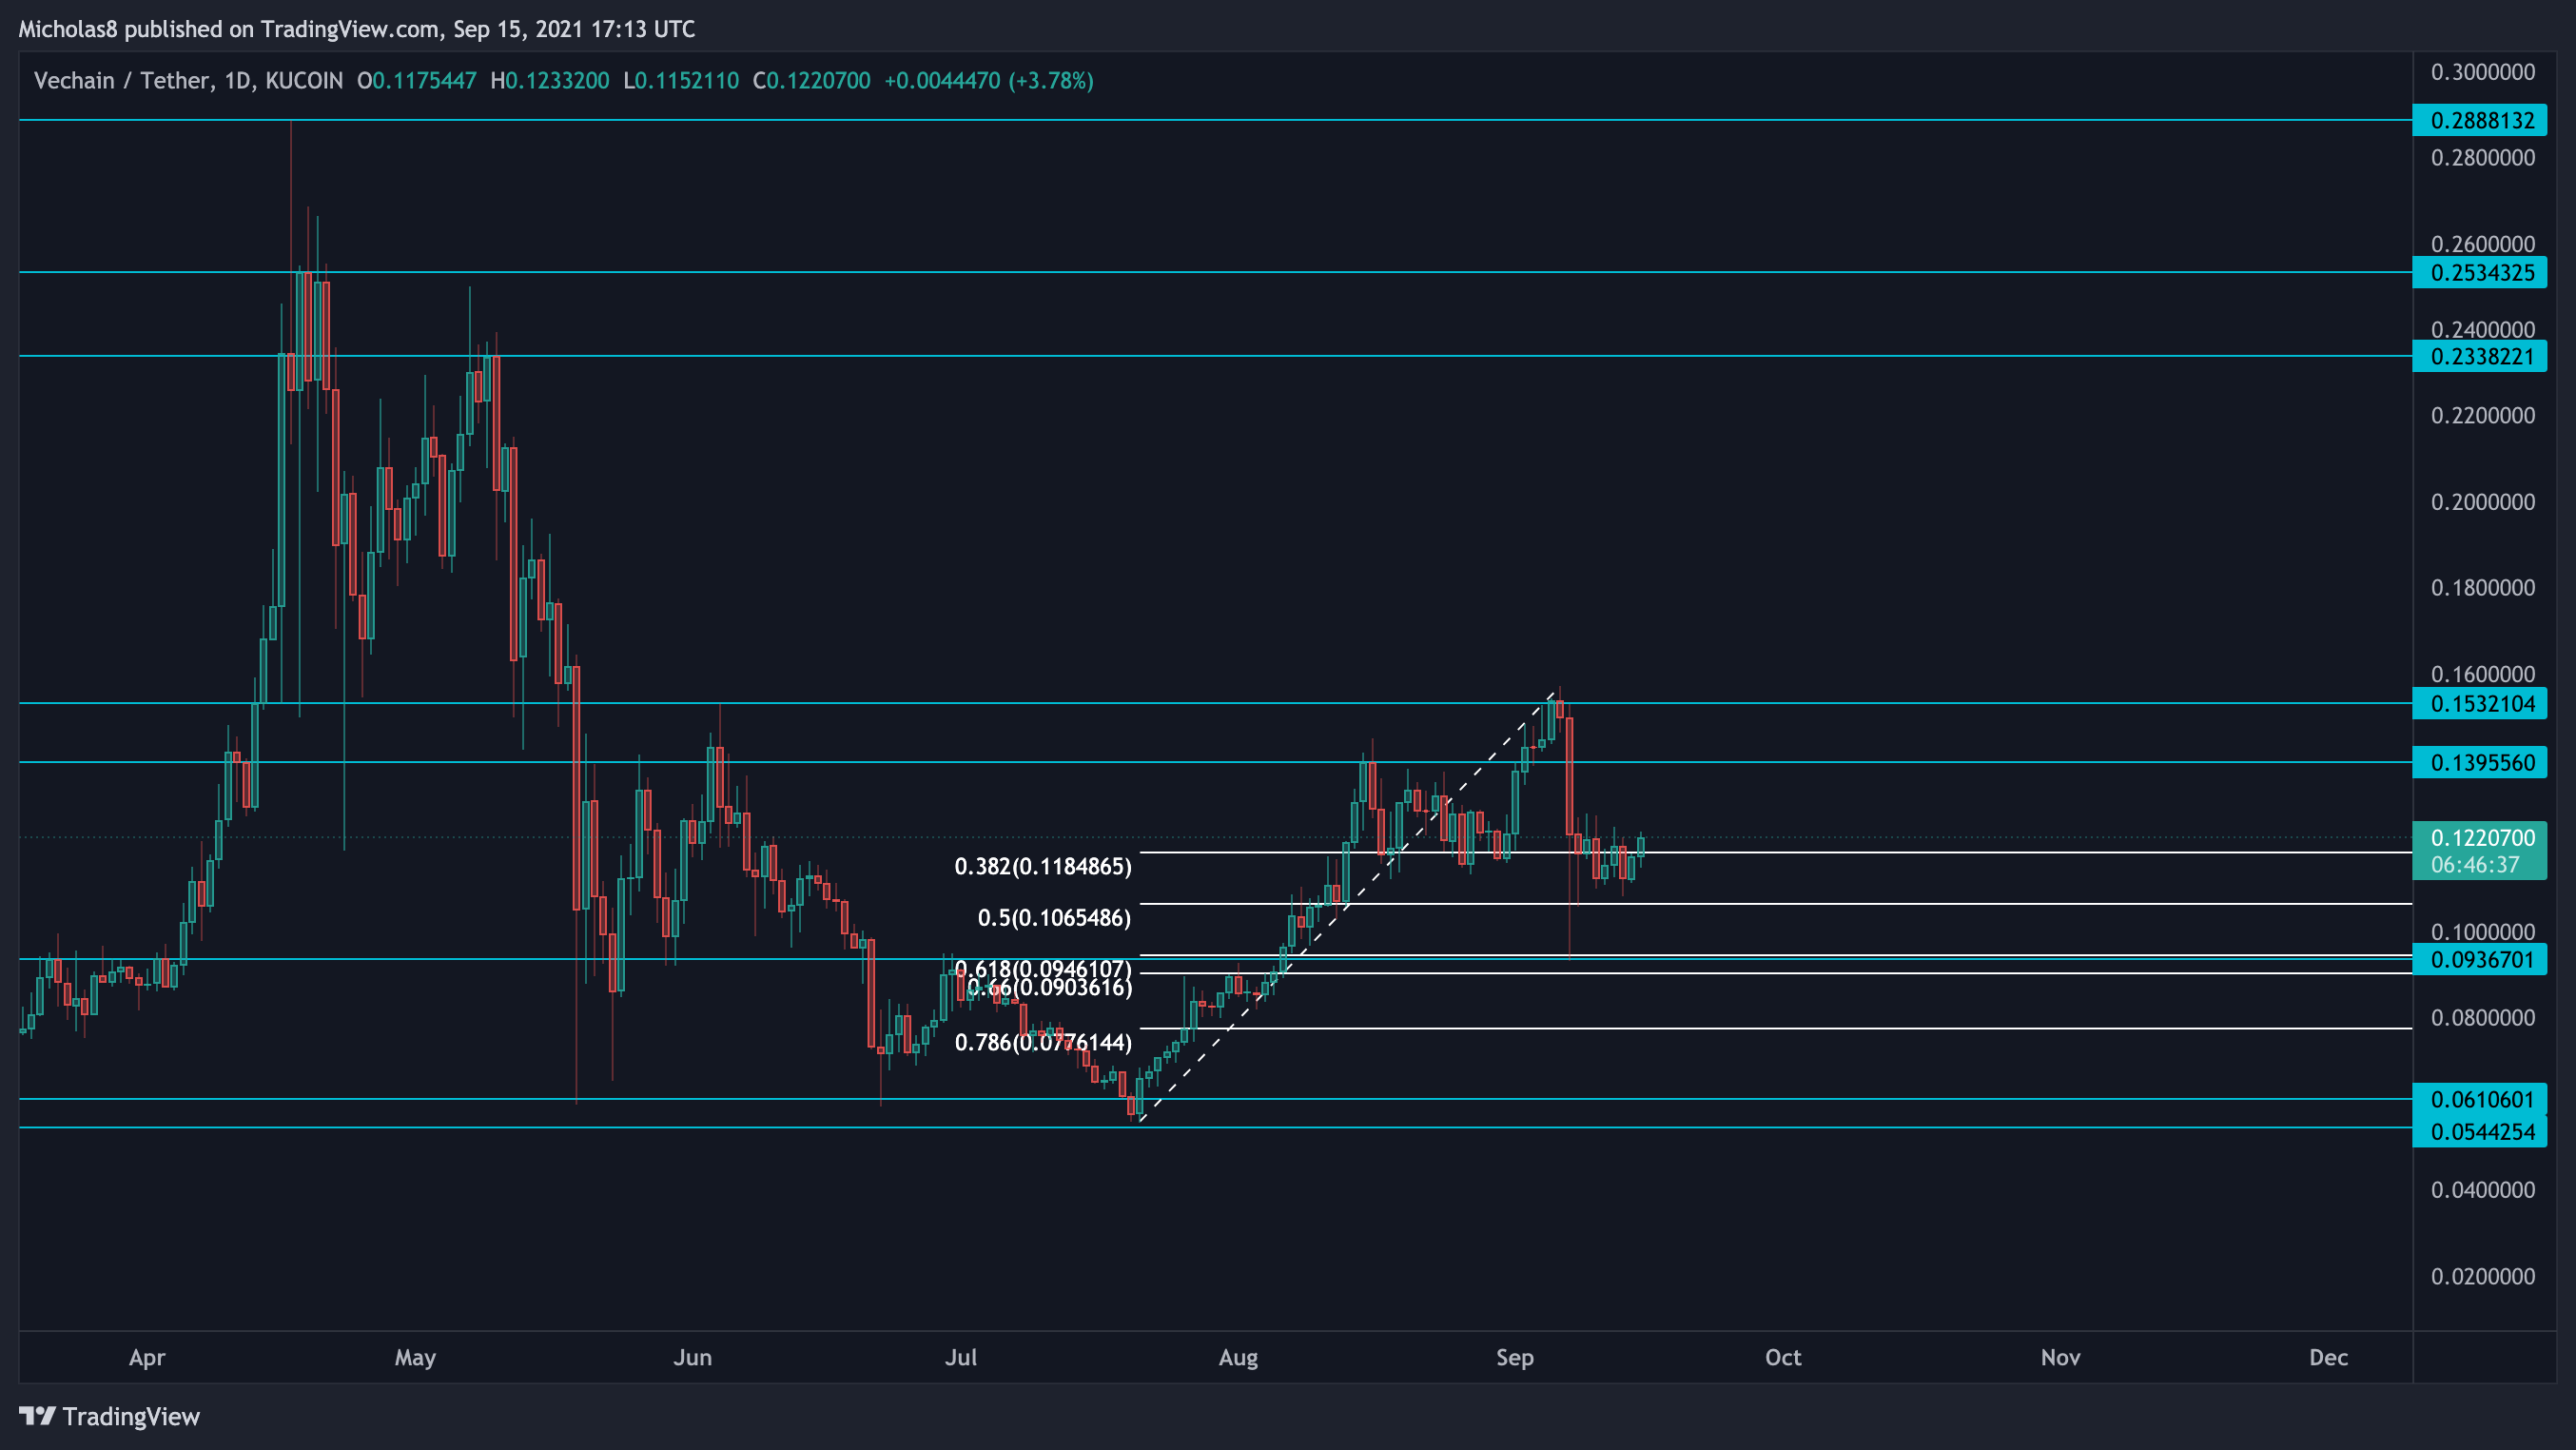
0.0544
0.06106
0.0937
0.1396
0.1532
0.2338
0.2534
0.2888
Fibonacci levels
Trend-based fib extension levels as further targets
4-hour Timeframe
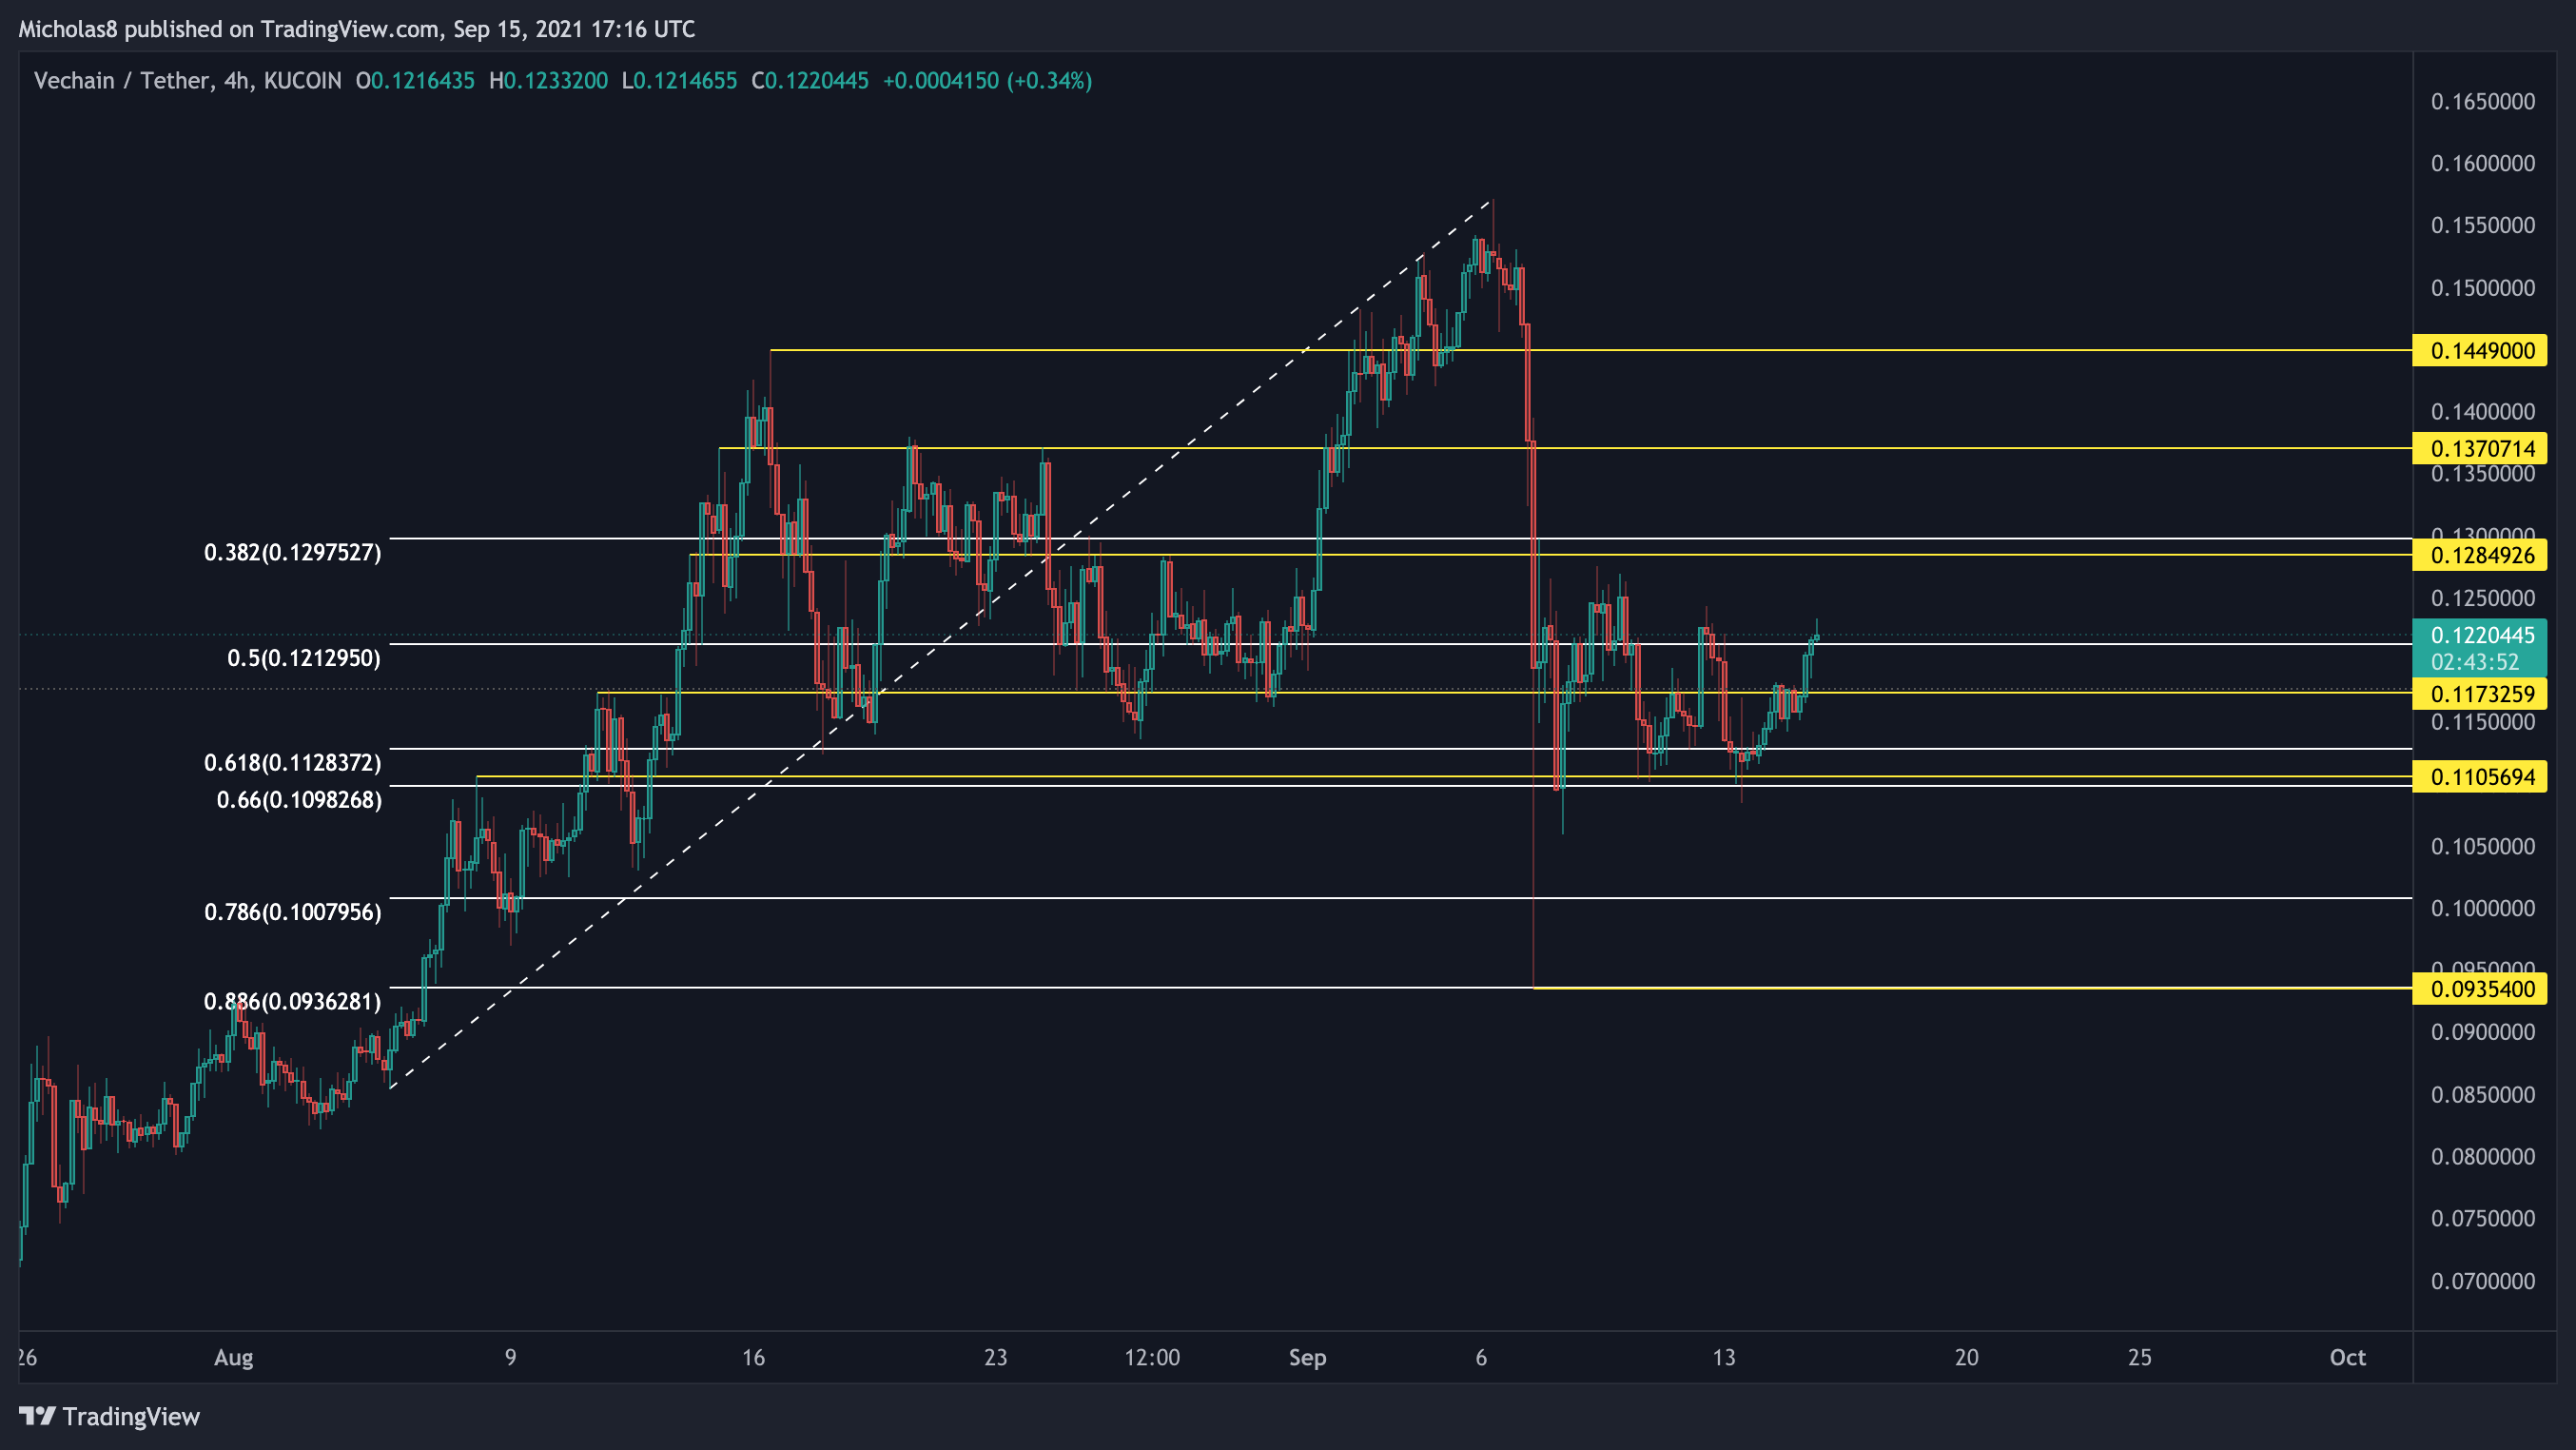
0.09354
0.11106
0.11733
0.12849
0.13707
0.1449
Fibonacci levels
1-hour Timeframe
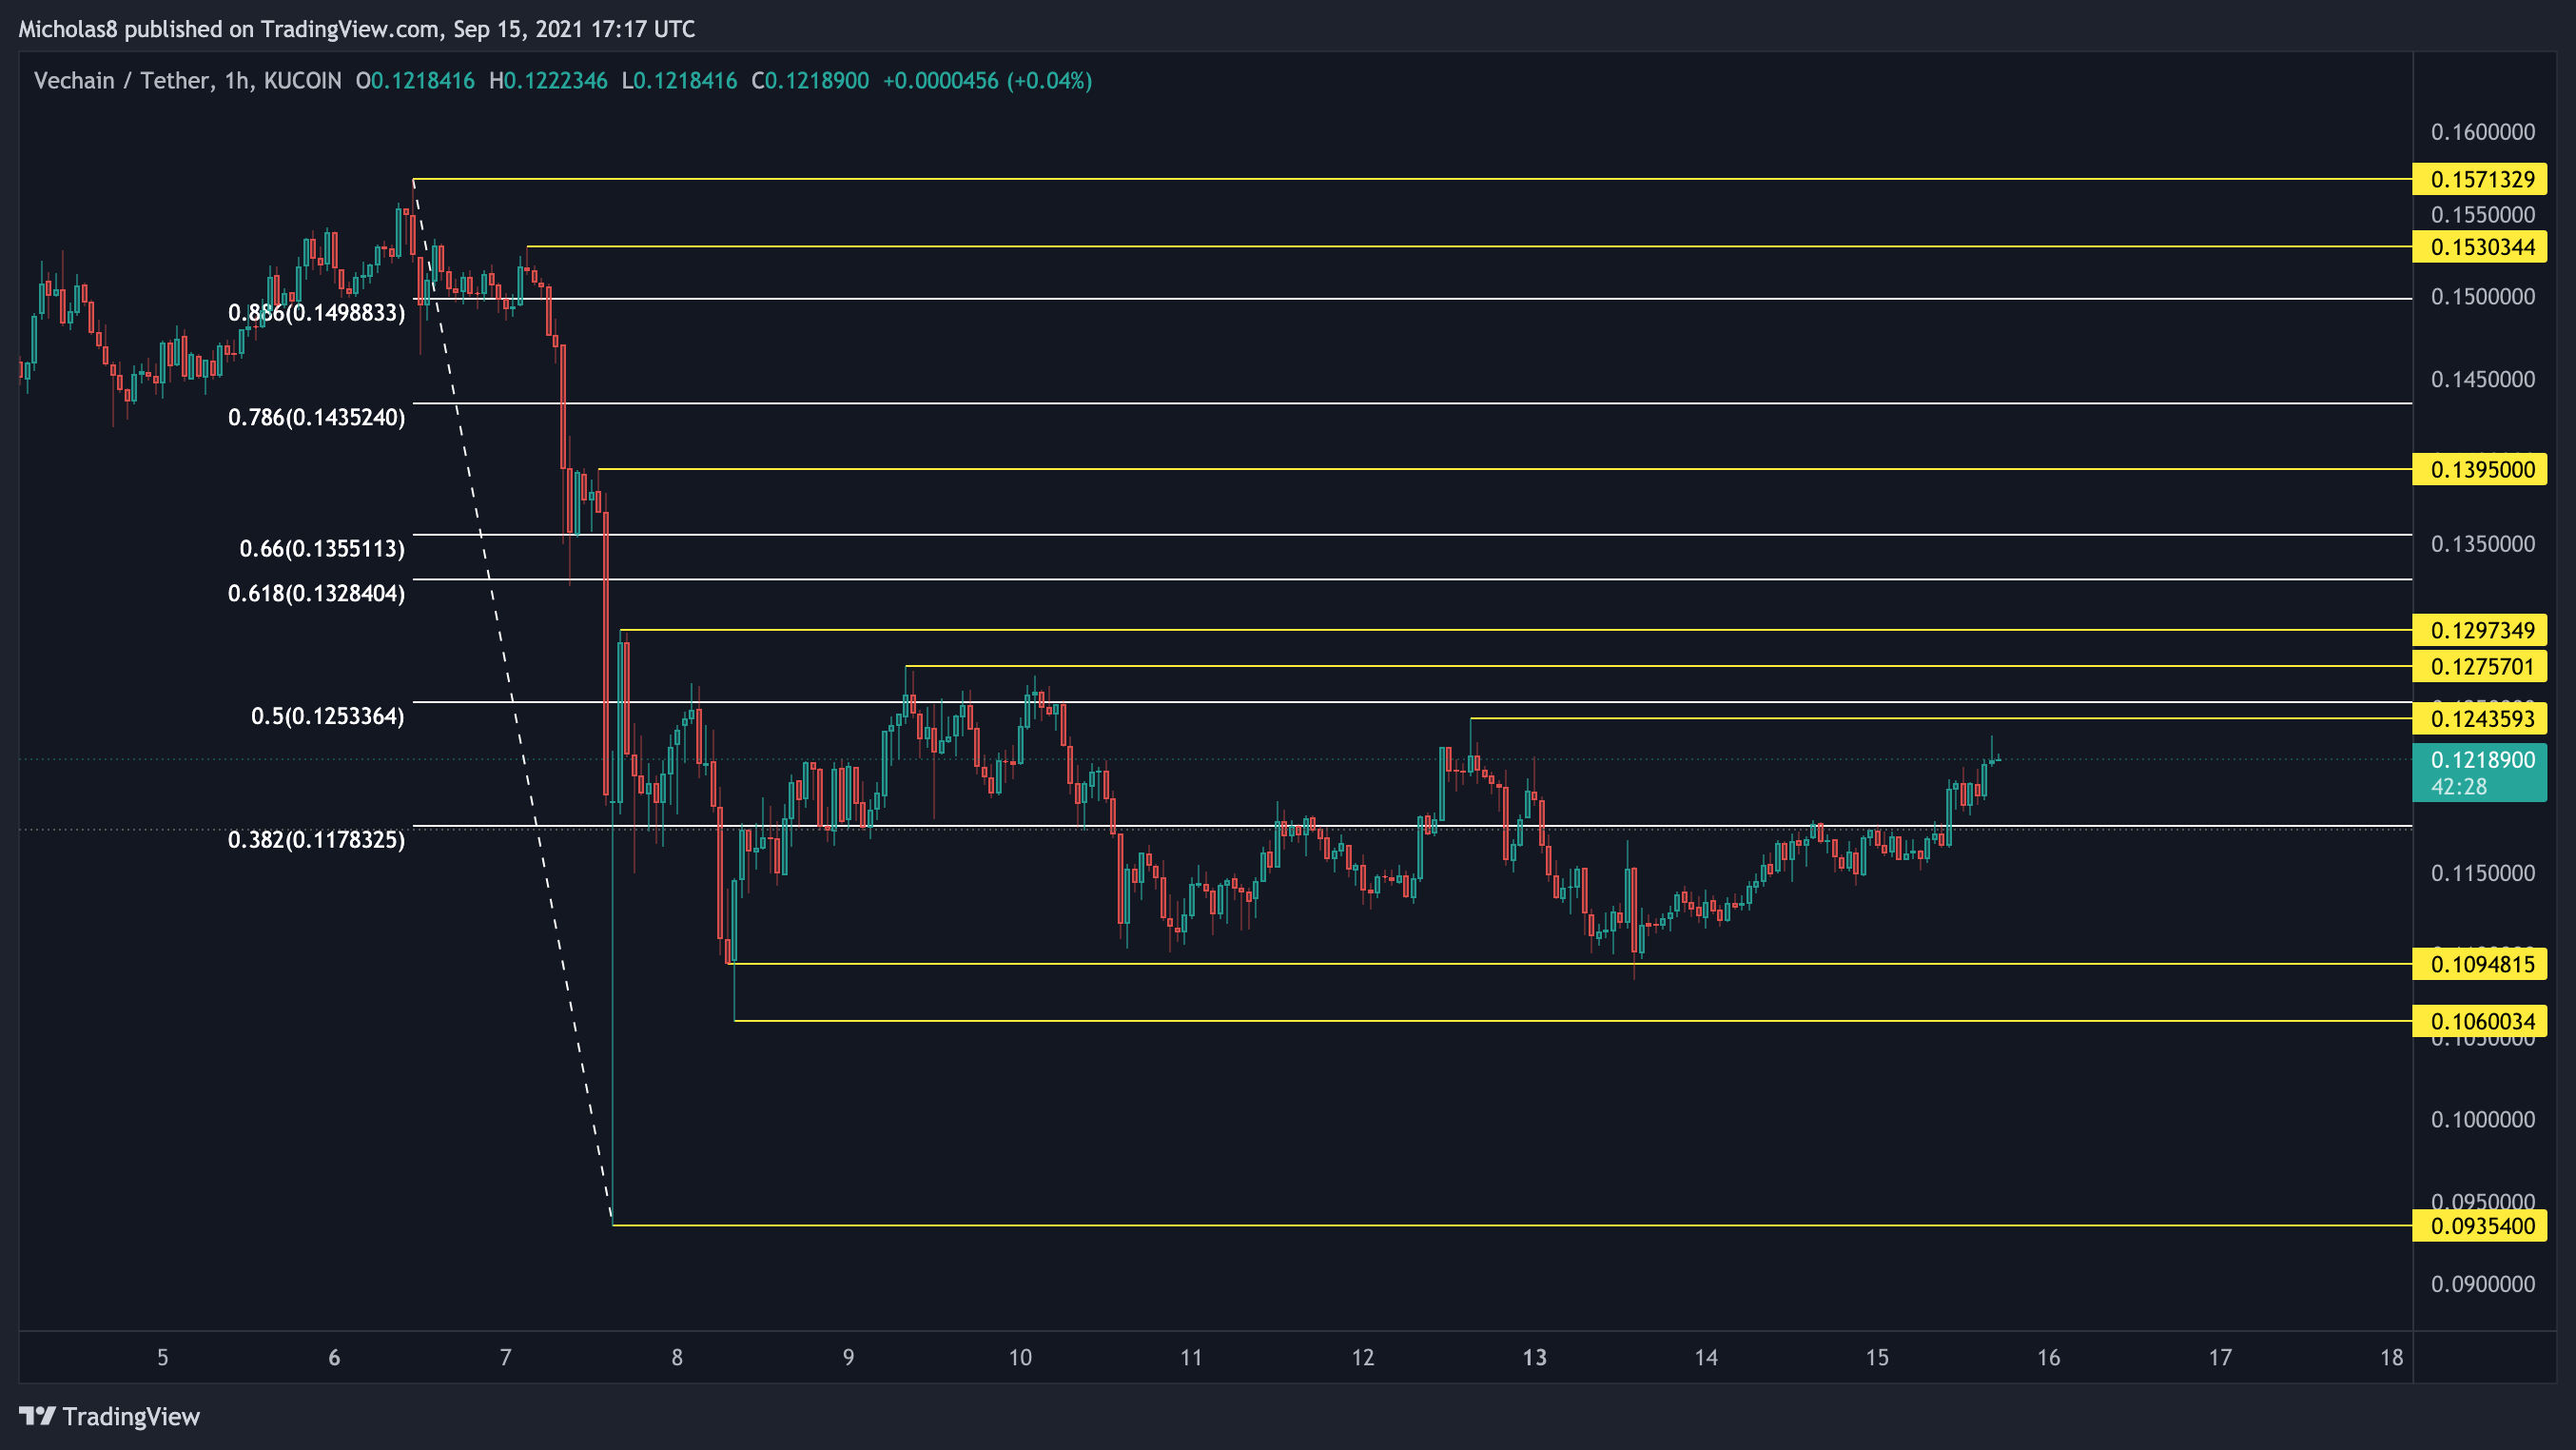
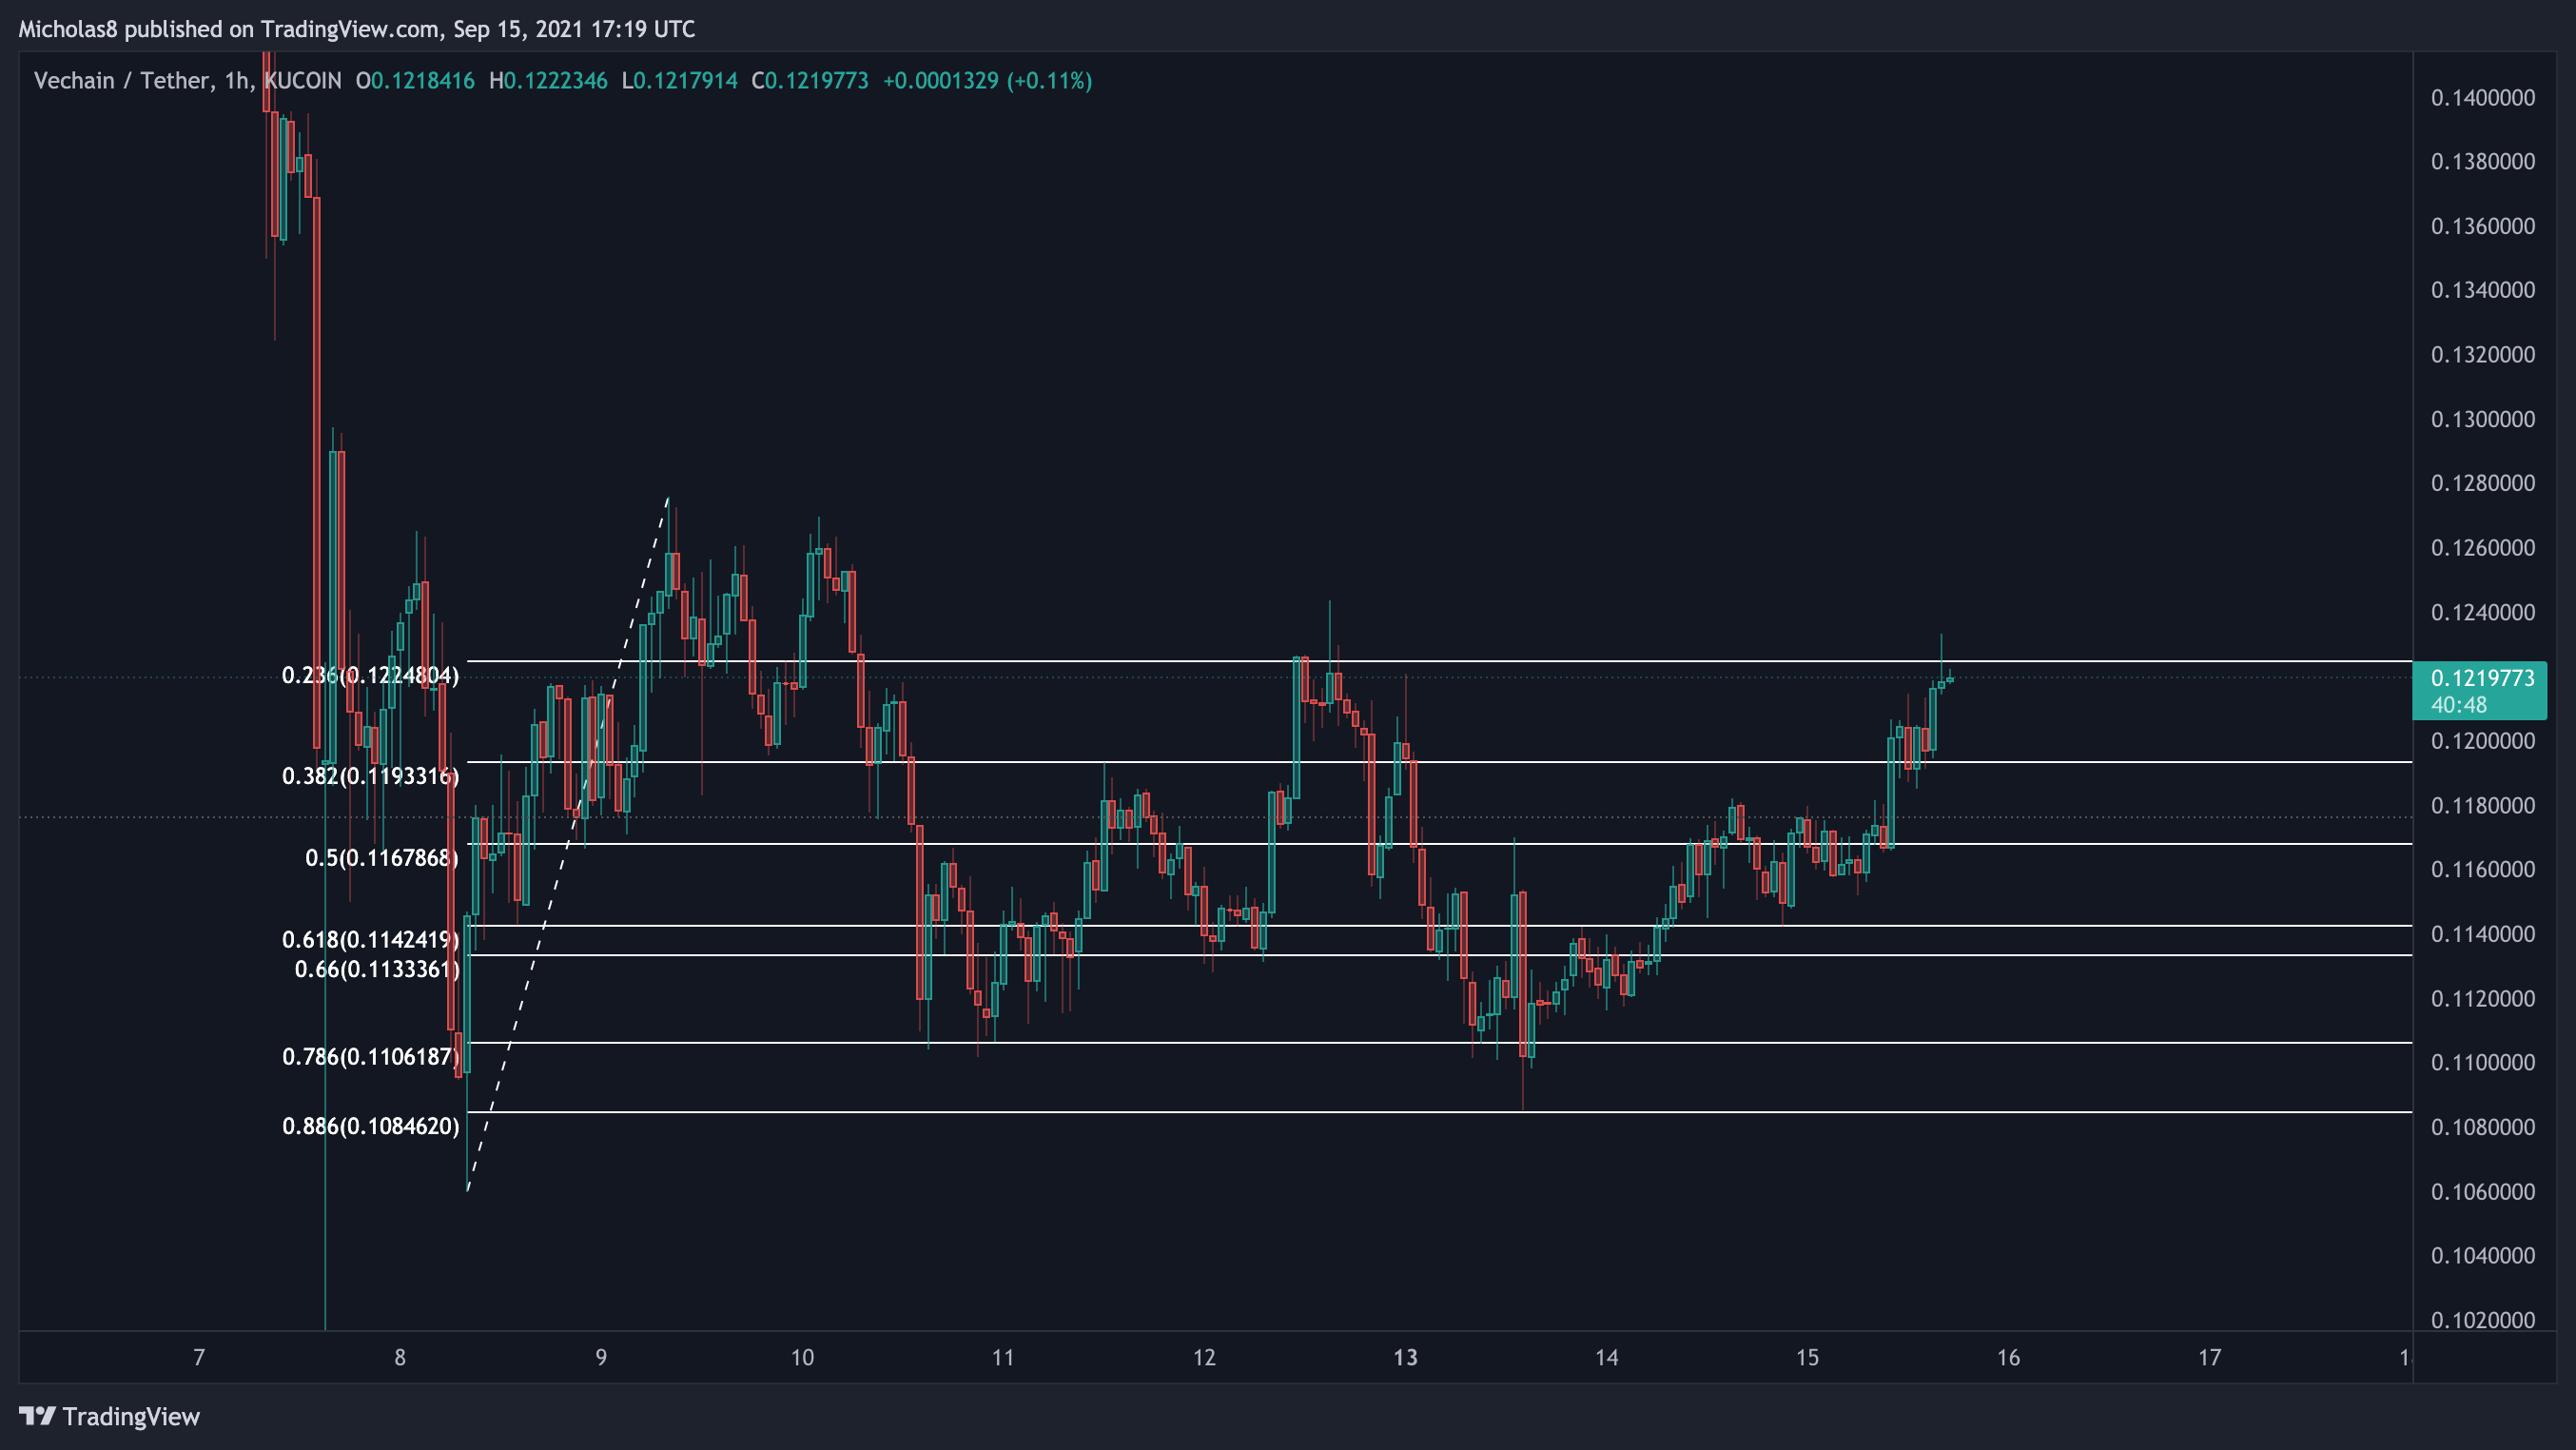
0.09354
0.106
0.10948
0.12436
0.12757
0.12973
0.1395
0.15303
0.15713
Fibonacci levels in white
_
Thank you for your continued support! Hope you enjoyed this analysis. If you have any questions, feel free to let me know!
Cheers!