I recommend reading these reports on the Buy Me A Coffee platform for optimal formatting.
You will find the content below in this order:
1. Definitions
2. The Good
3. The Bad
4. CME Gaps
5. Key Levels
6. Final Thoughts
DEFINITIONS
Liquidity zones are high volume levels that offer support and resistance
Hidden bearish divergence: creating a lower high in price, with a higher high on the oscillators. This signals a possible trend continuation down.
Bearish divergence: higher high in price, lower high on the oscillators. This signals a possible trend reversal down.
Hidden bullish divergence: creating a higher low in price, with a lower low on the oscillators. This signals a possible trend continuation up.
Bullish divergence: creating a lower low in price, with a higher low on the oscillators. This signals a possible trend reversal up.
SR flip: turning old resistance into support, and vice-versa.
Fractal: recurring geometric pattern.
THE GOOD
Daily Timeframe
SR Flip
Bitcoin has risen back above this SR, and ideally, it serves as strong support.
Bullish Structure
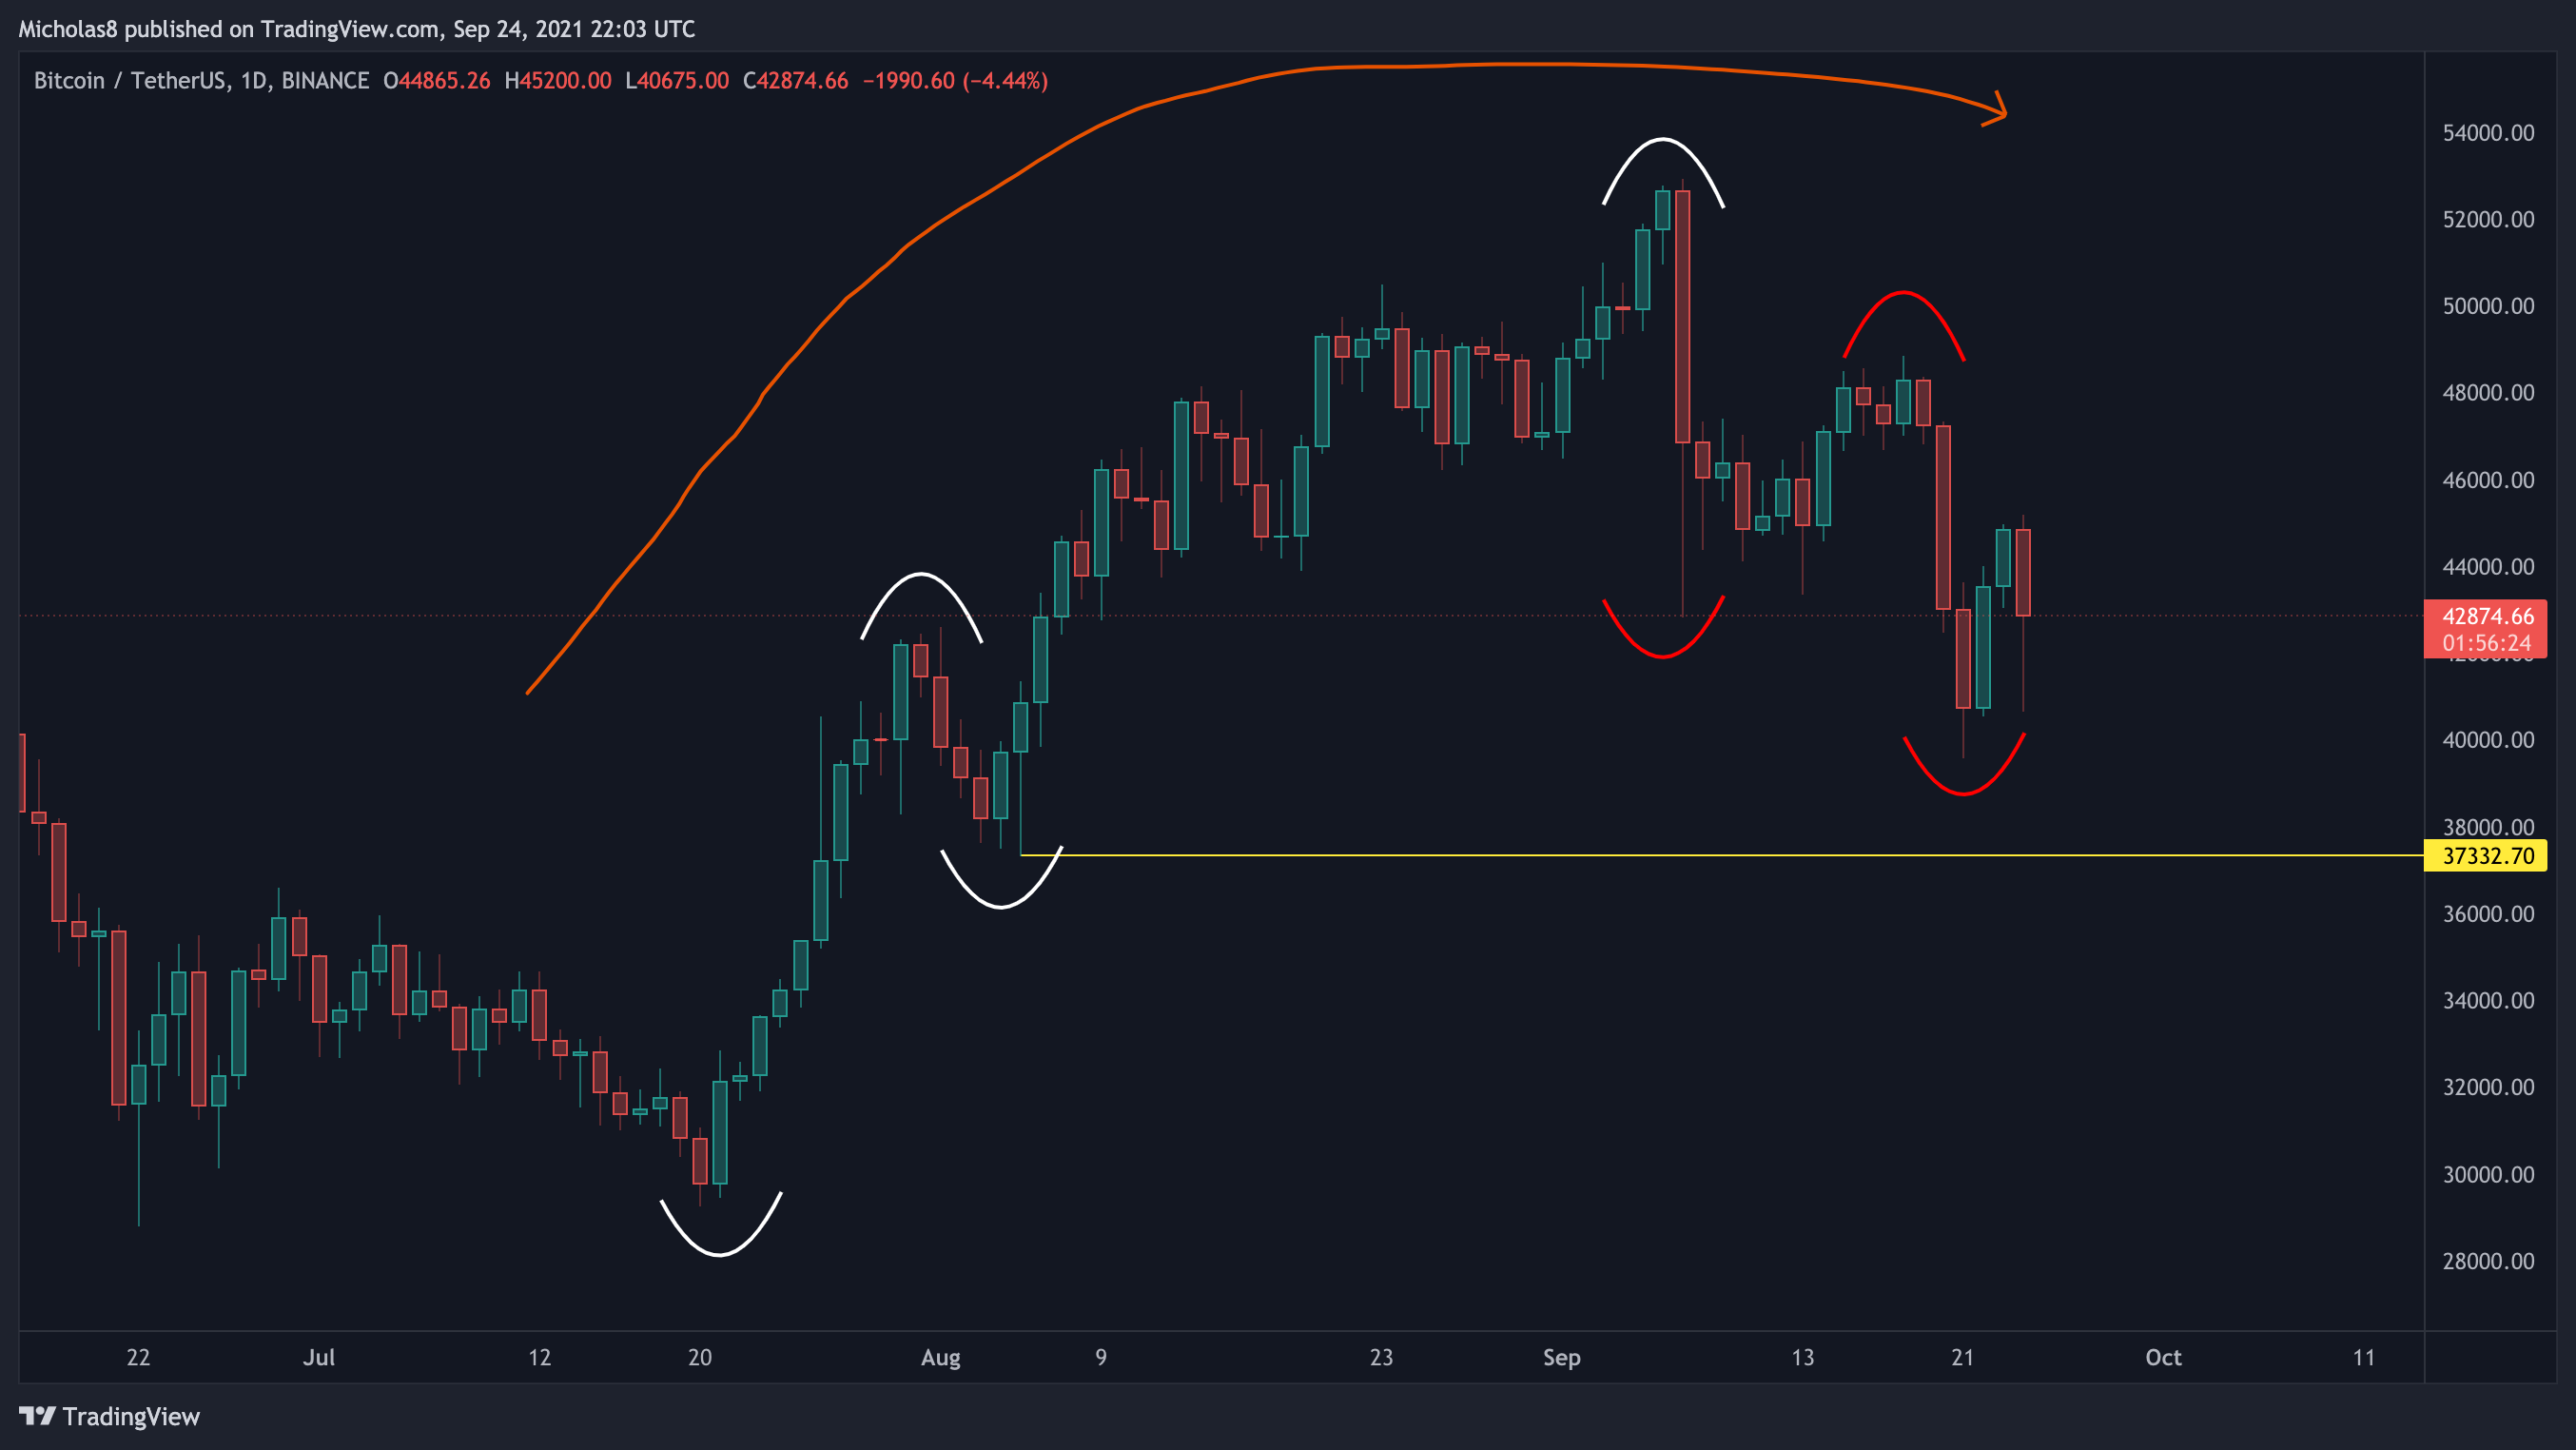
As long as Bitcoin continues to build on this higher high, and higher low structure, we can remain reasonably bullish. We can technically come down to just above the 37.3k to create a higher low and potentially remain bullish, dependent on a new higher high.
I have mixed feelings about this stance. Indicated by the red curves, this is potentially a lower high and lower low. We won't know for sure until we know, but this is definitely a cause for concern.
Key Liquidity Zone (LQZ)
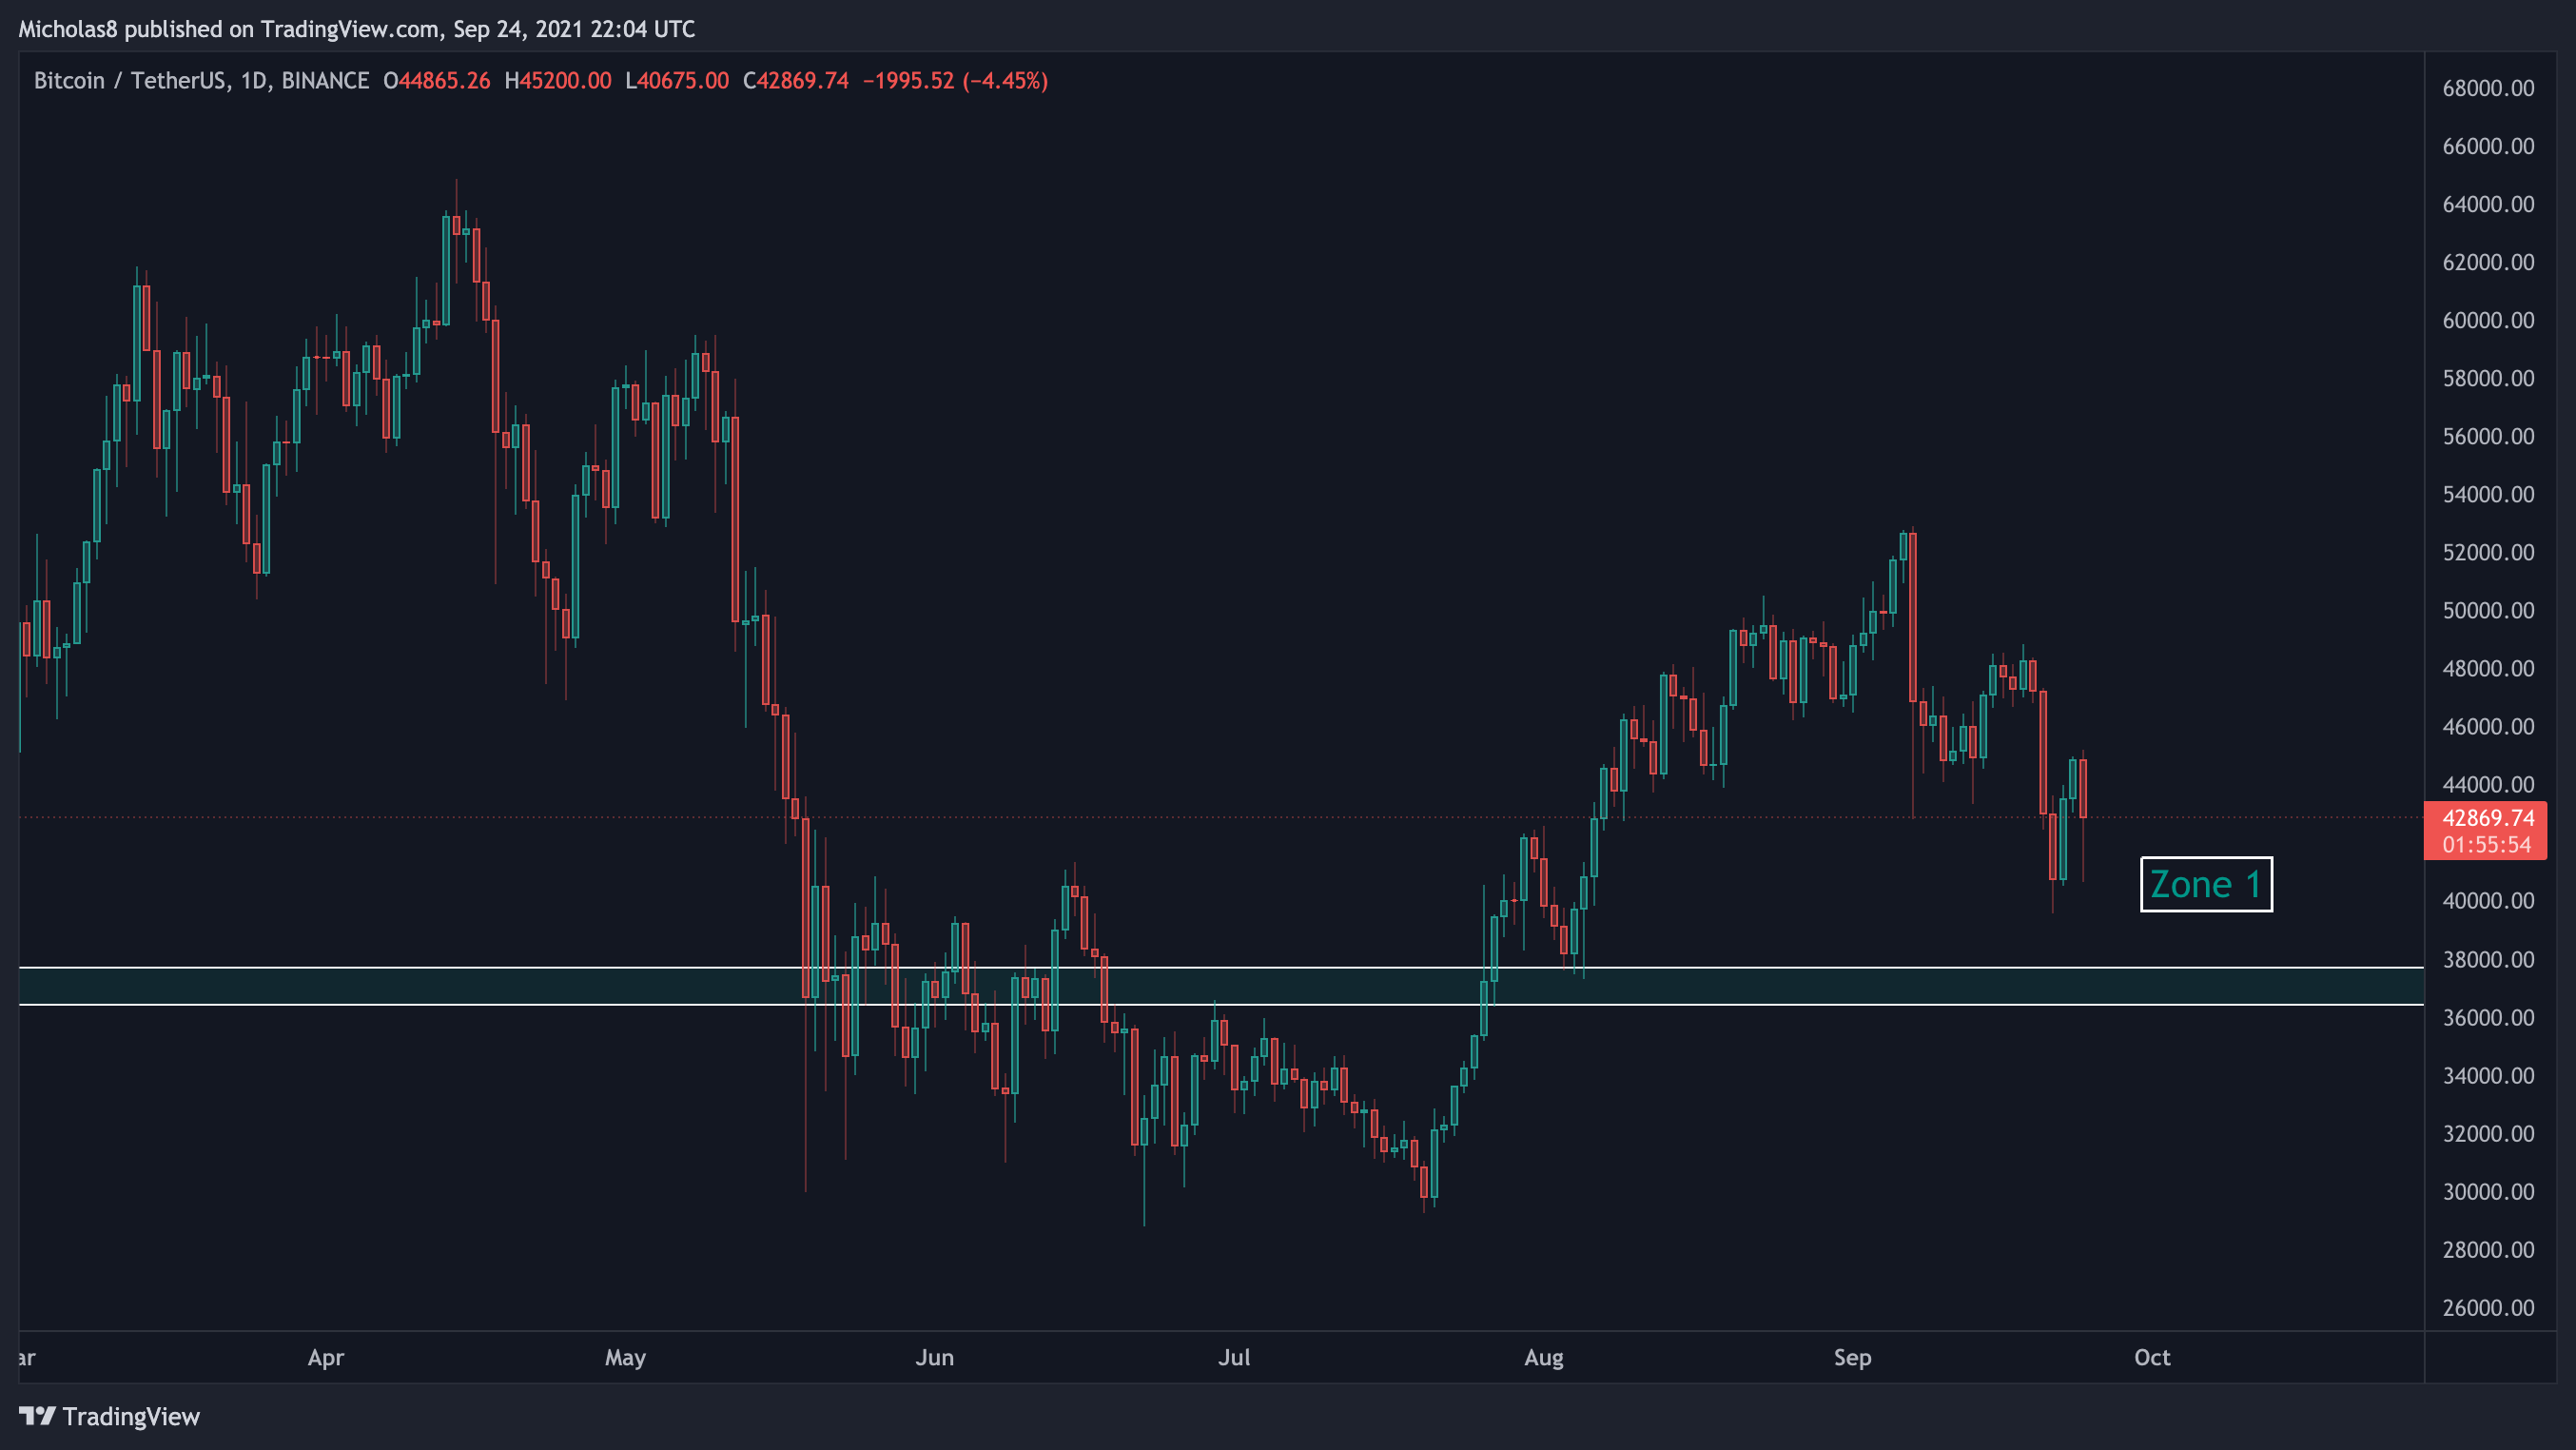
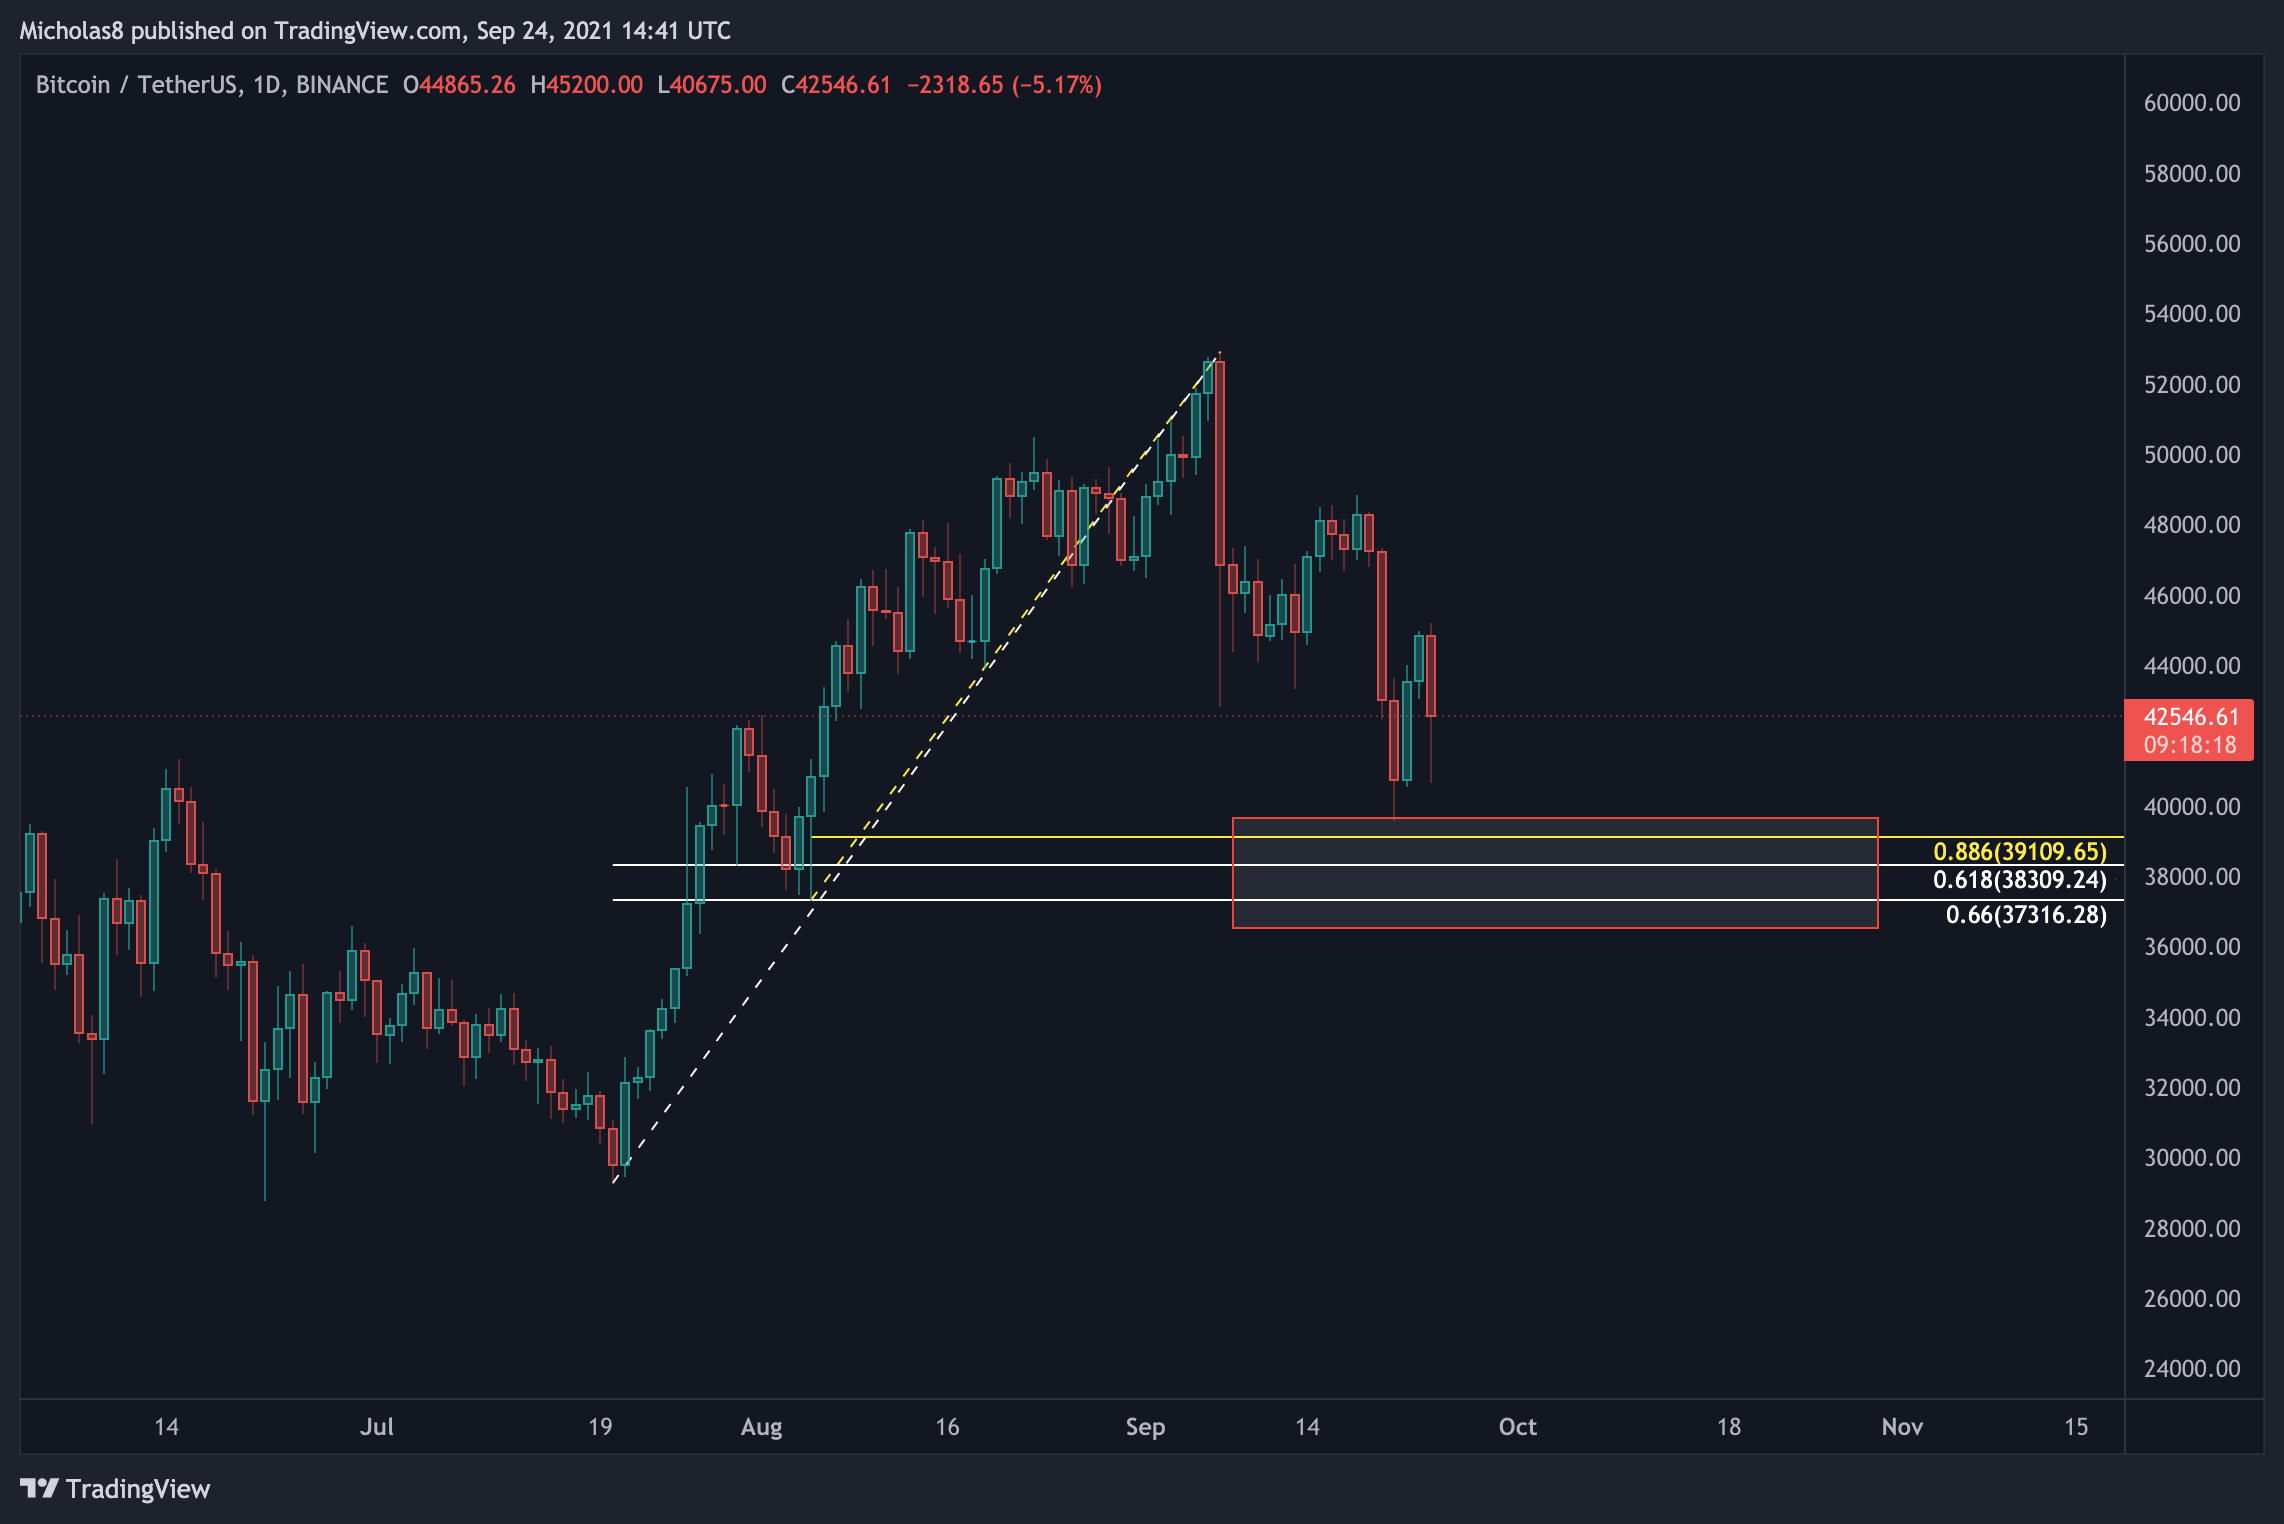
Zone 1: Sitting between 36.4k and 37.7k, Bitcoin is still trading above this Key Daily Liquidity Zone. As long Bitcoin remains above this zone, we can still be reasonably bullish from a macro perspective.
Simple Moving Average (SMA): 100
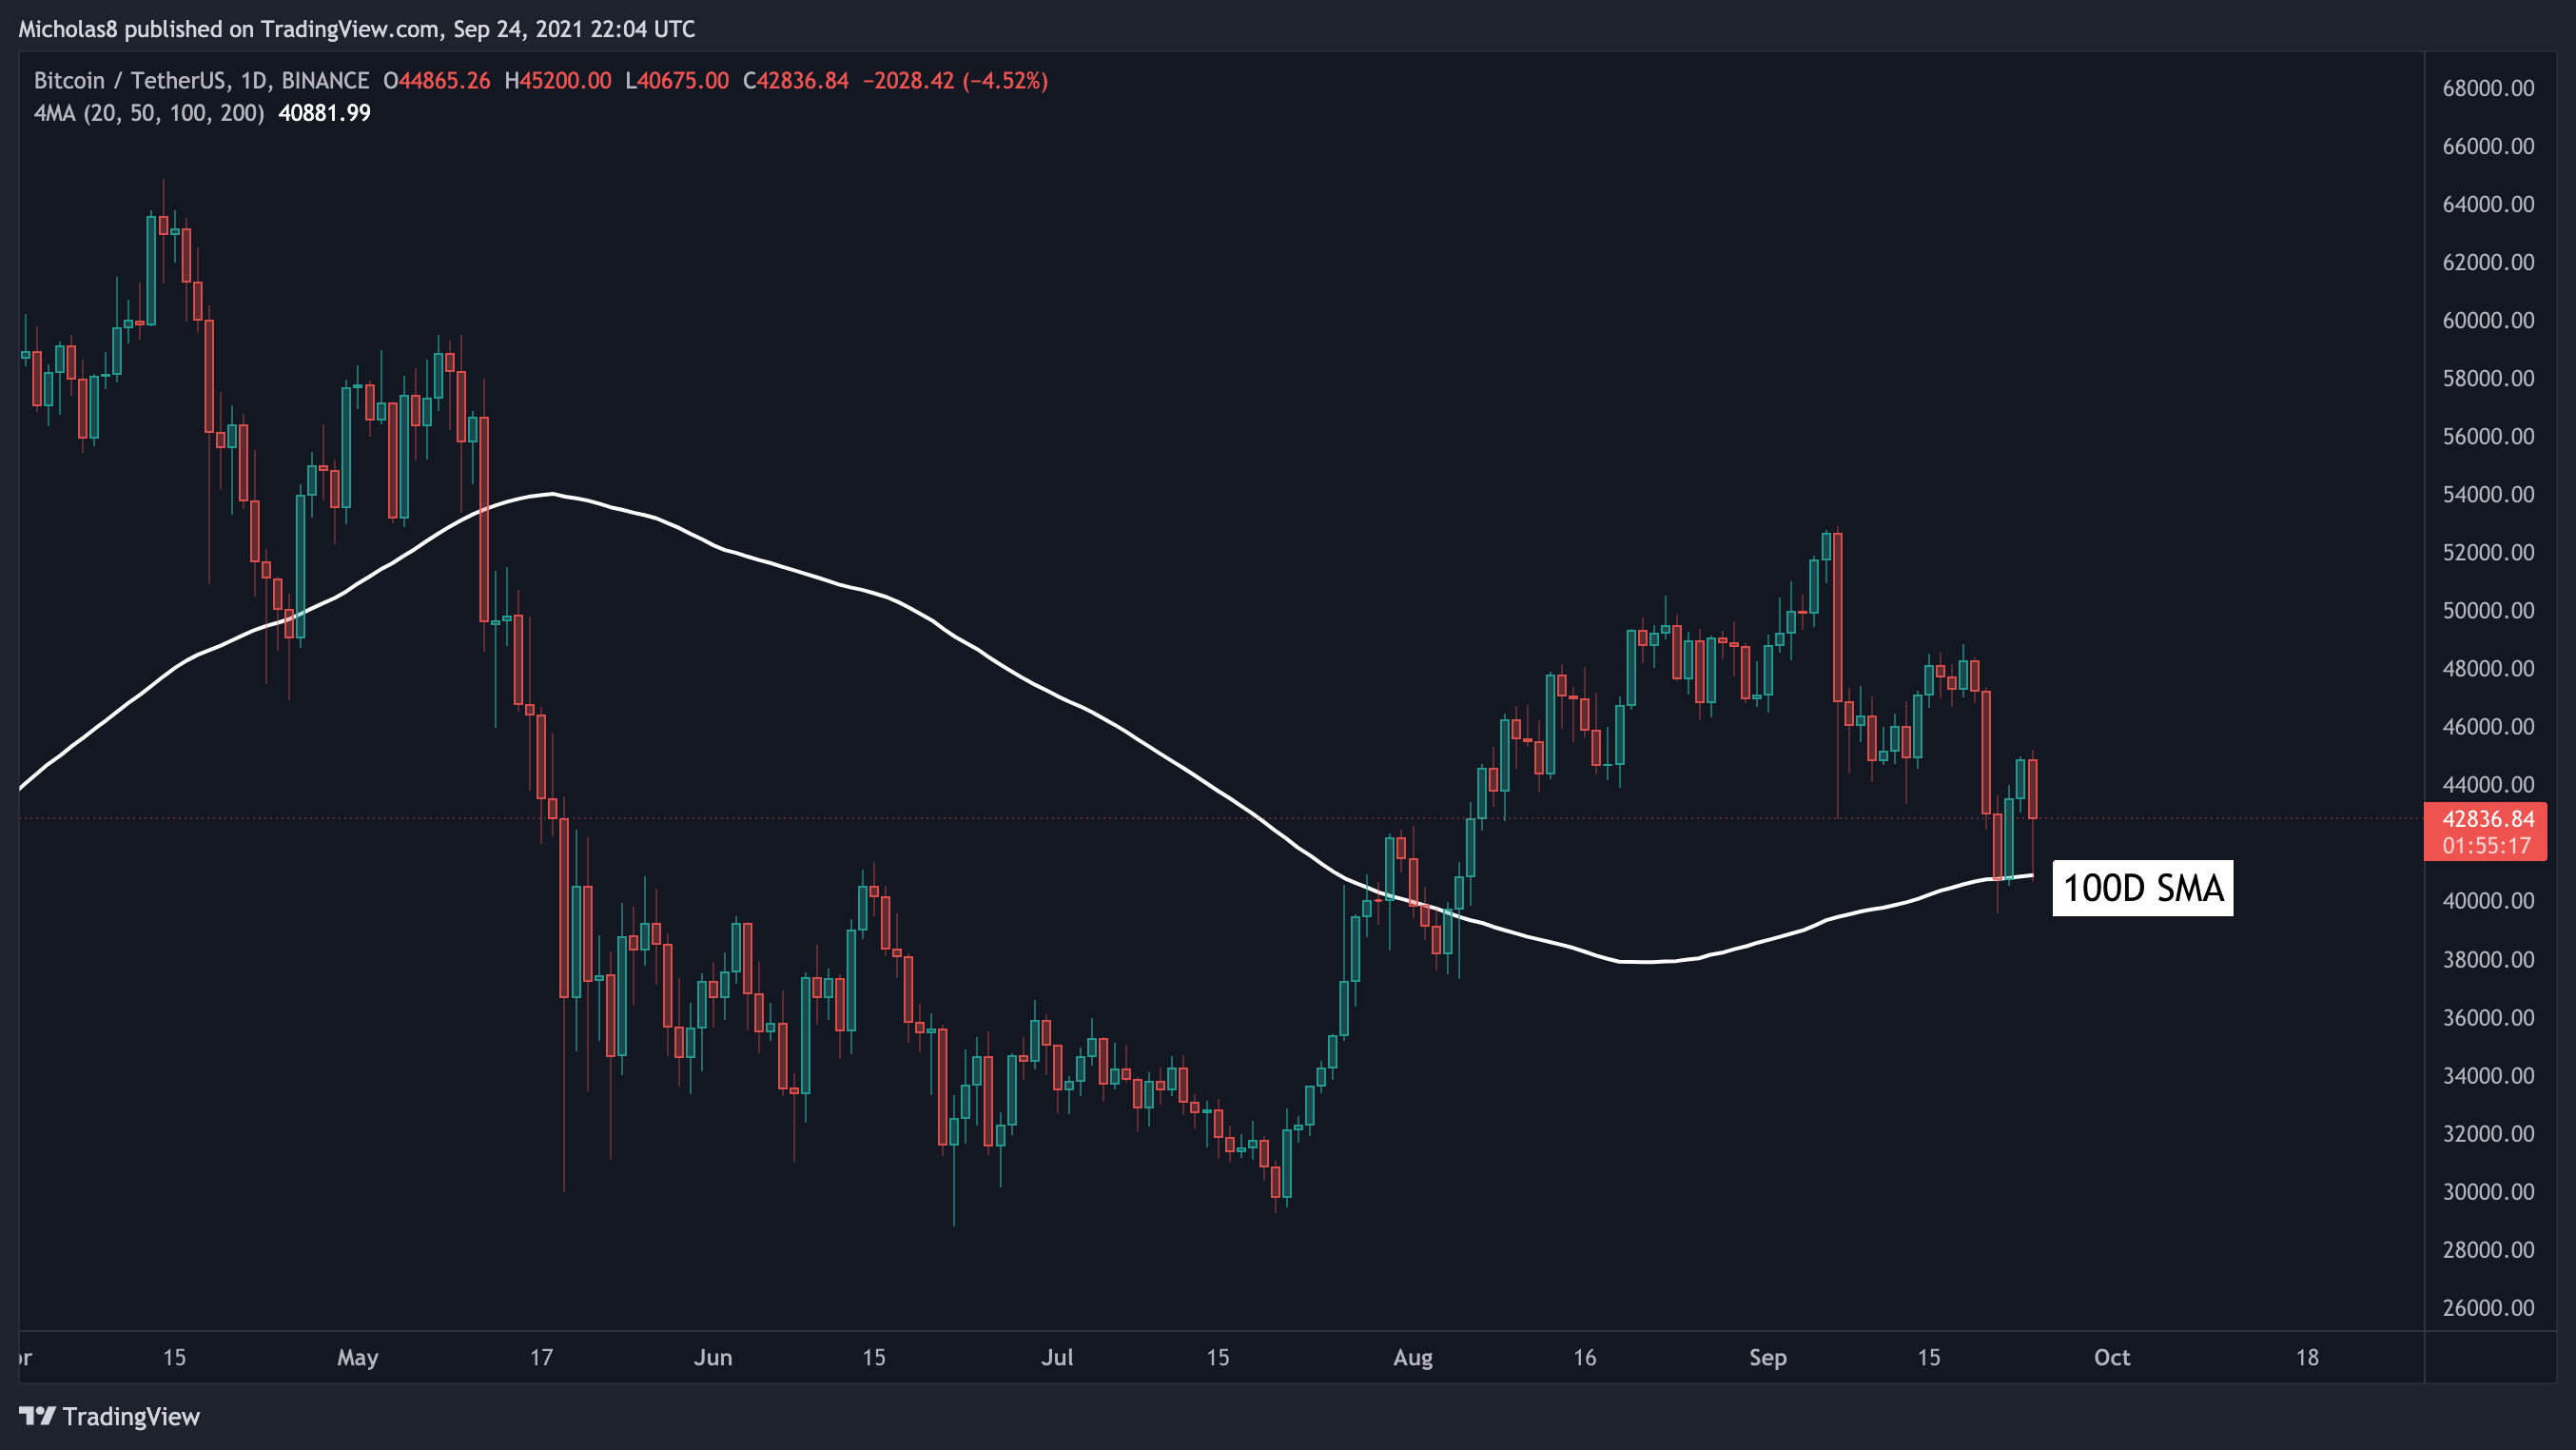
Bitcoin continues to trade above the 100-day SMA. As long as it continues to do so, it's reasonable to expect it to serve as a level of support as it did perfectly yesterday.
Exponential Moving Average (EMA): 200
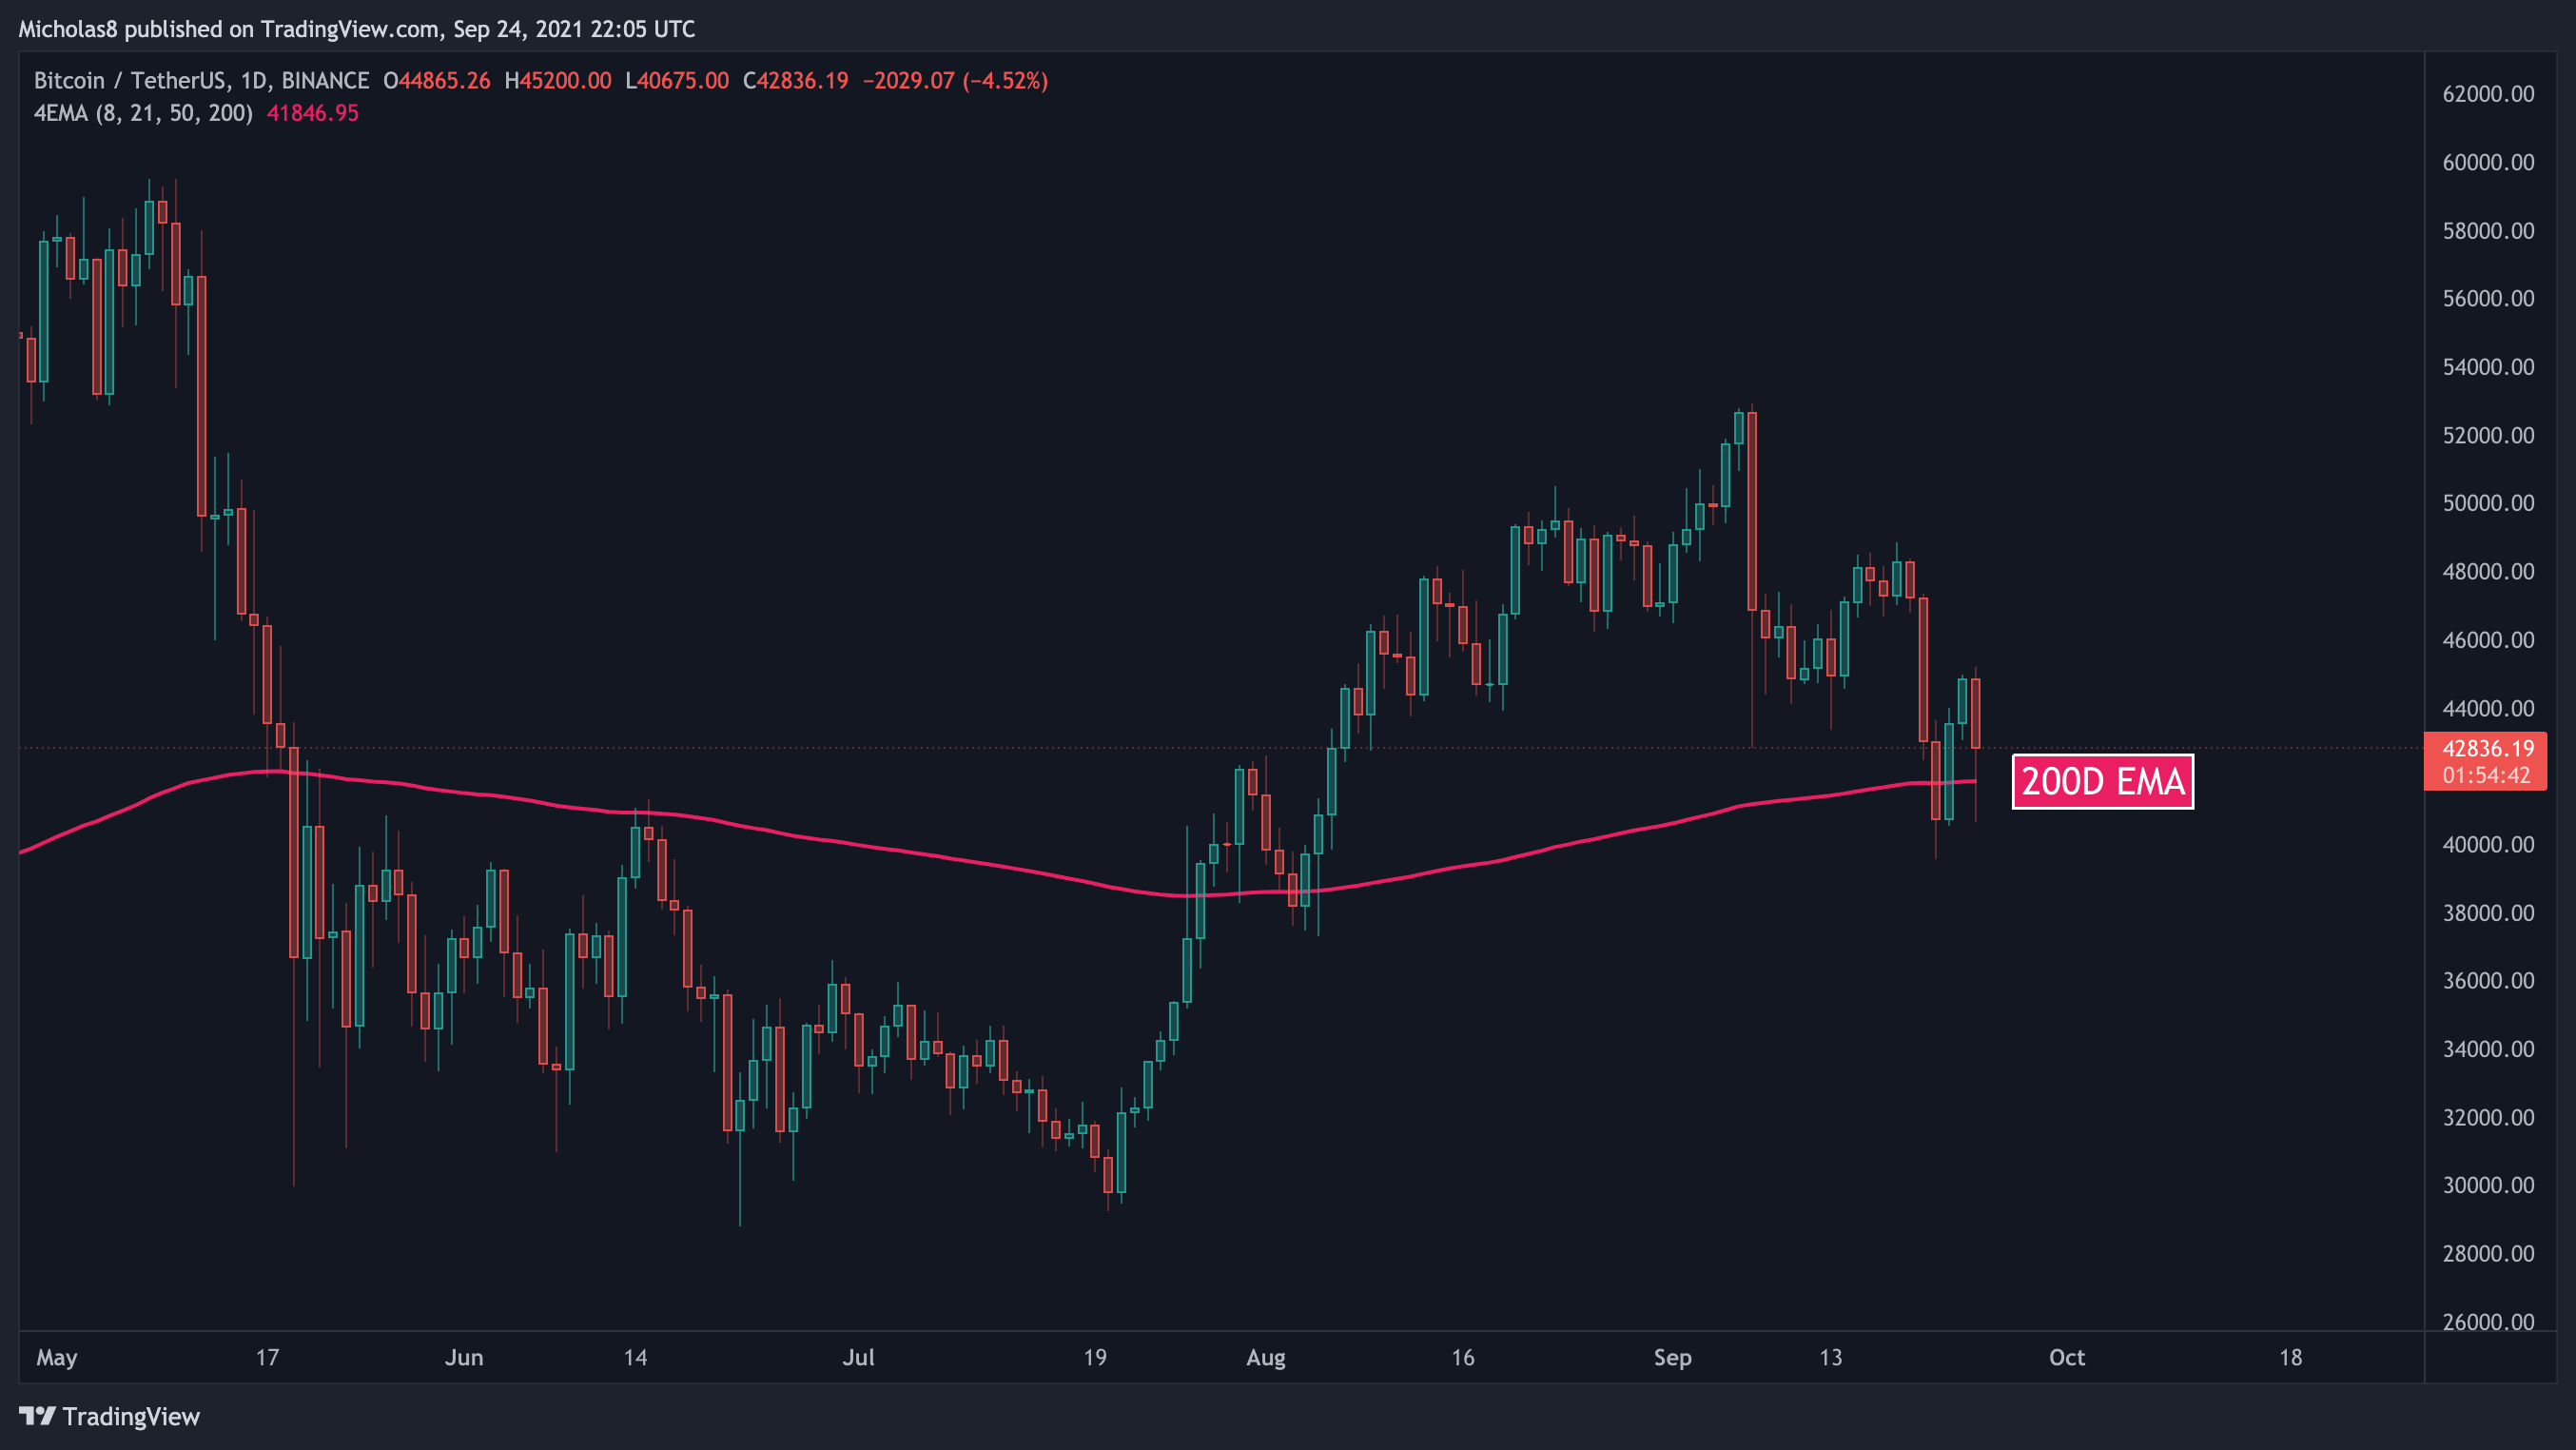
Bitcoin will likely close above the 200-day EMA again tonight.
Implication: Battlezone! The bulls and bears are fighting for territory as we speak. If we look left, we can see it is indeed quite significant. Many decisions are made at this EMA.
Bullish Fractal
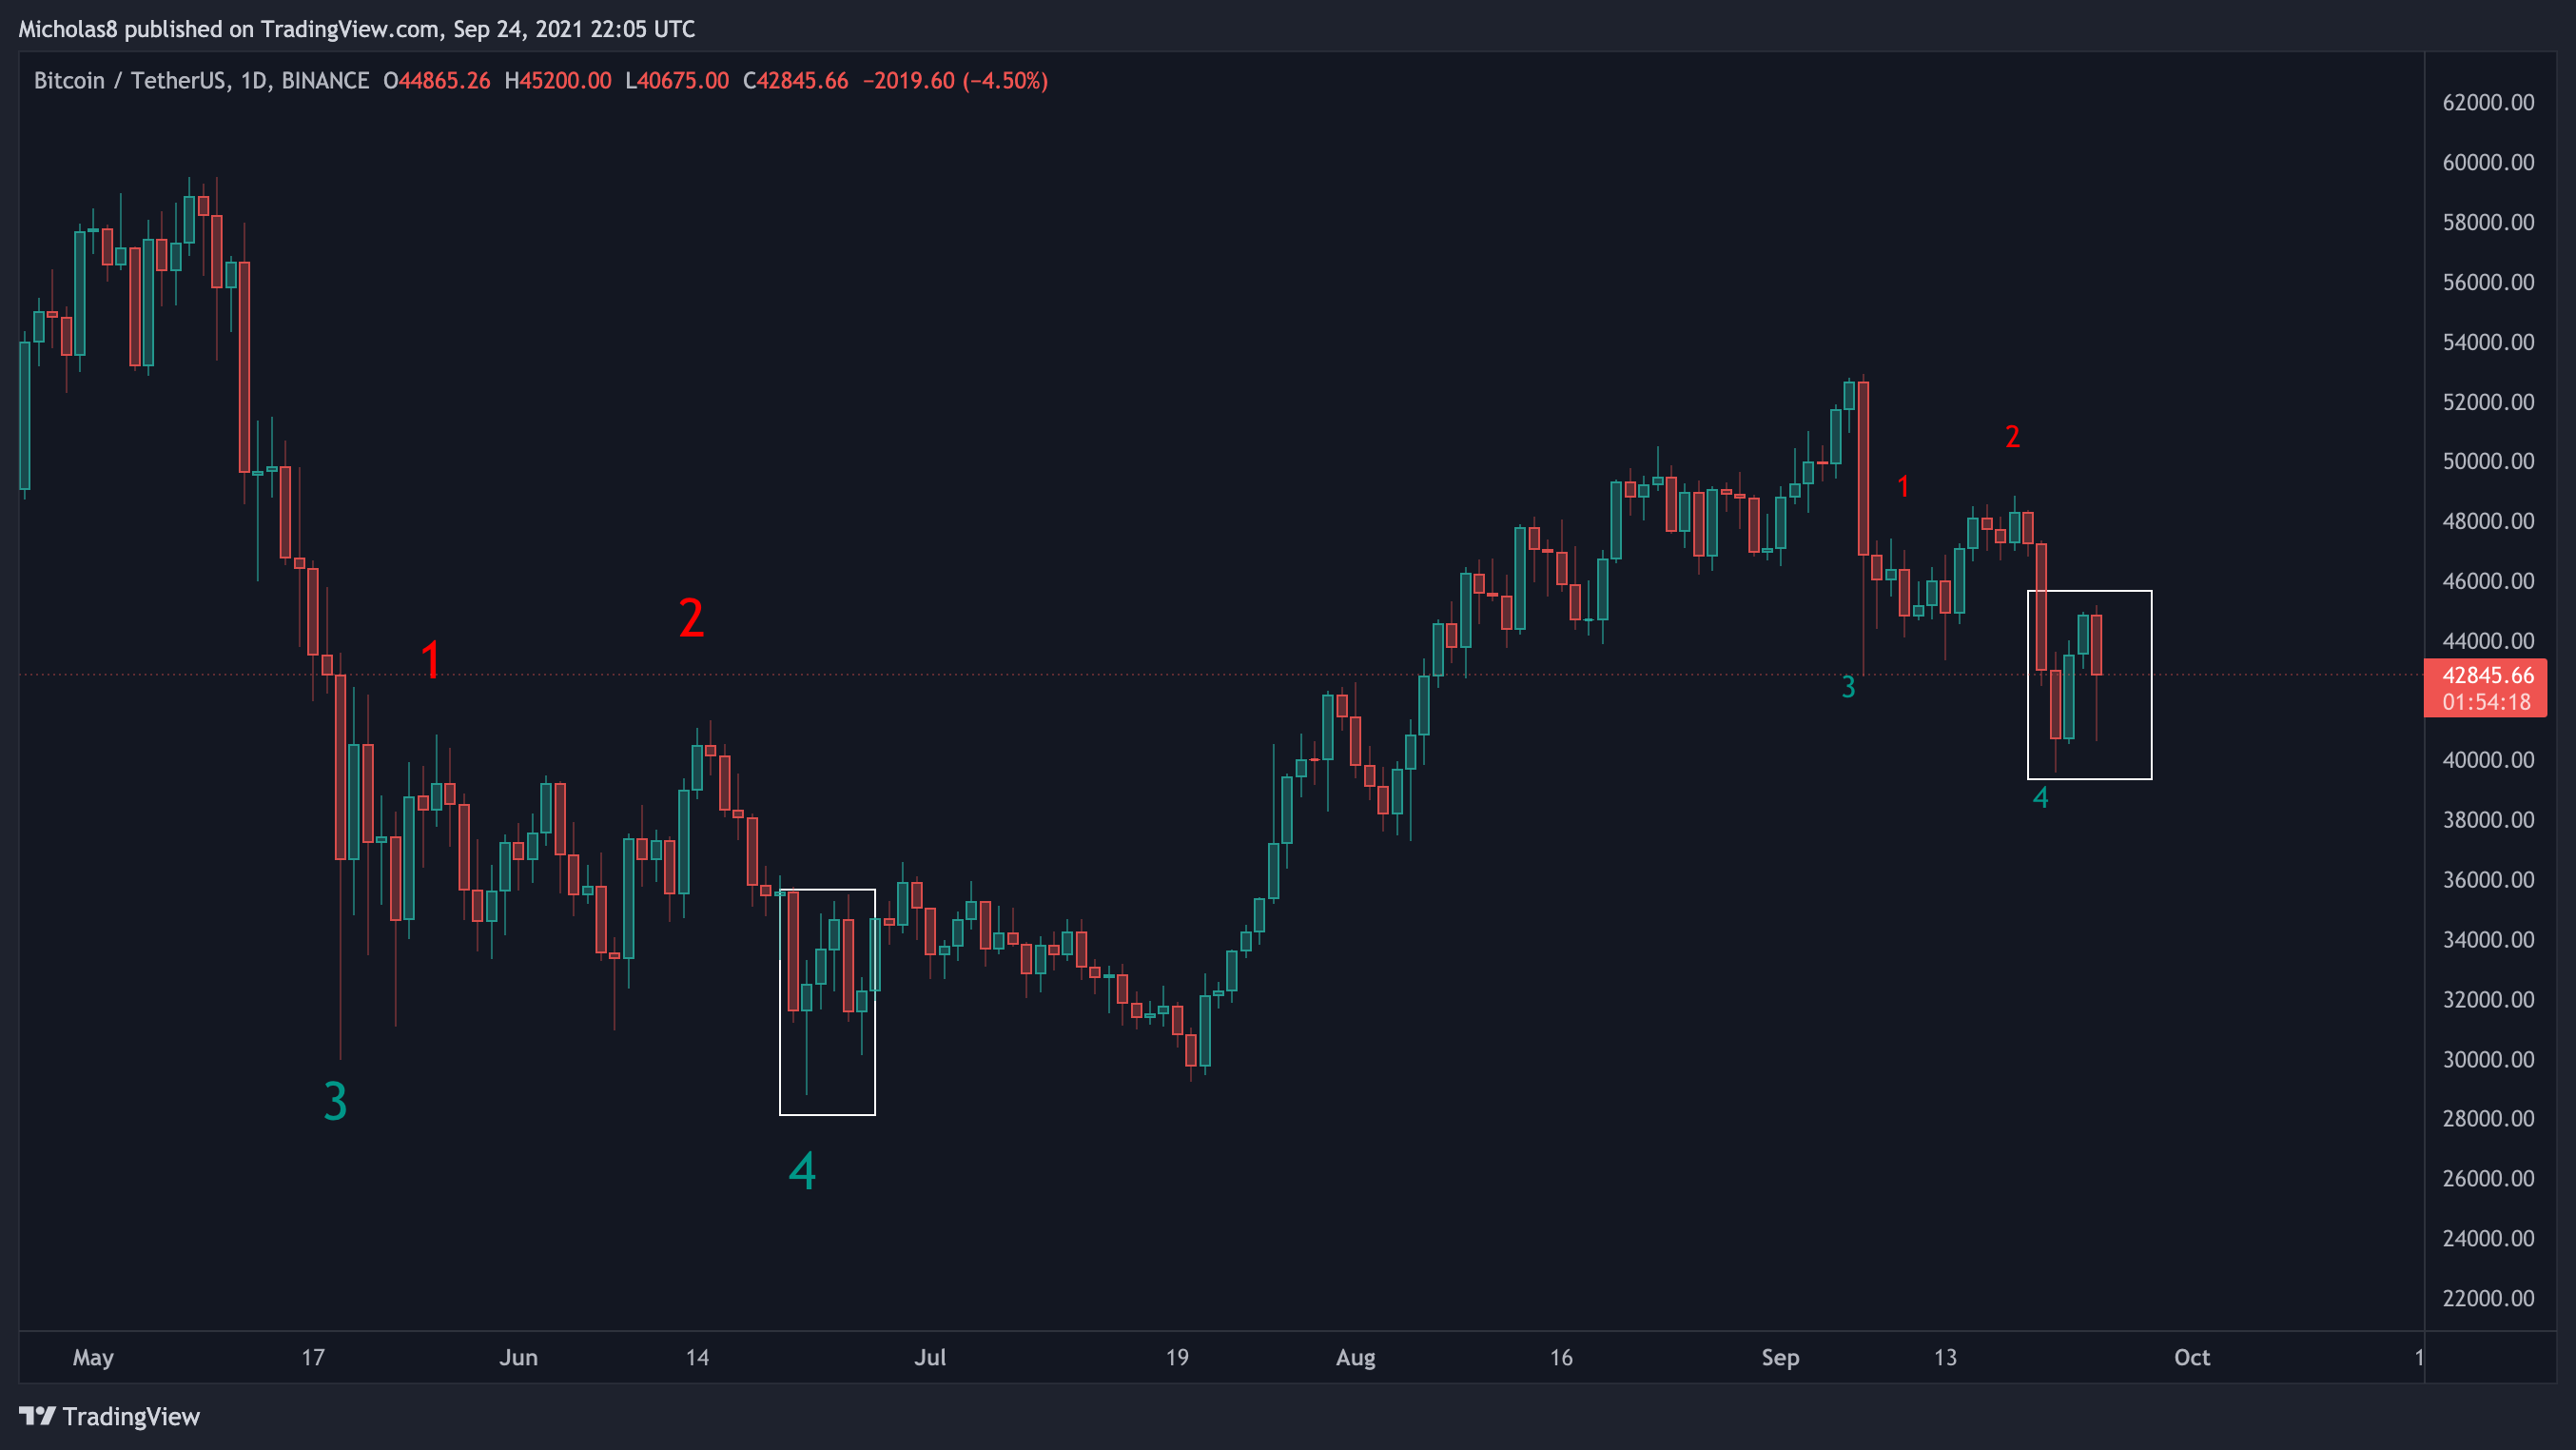
The PA we can see from this fractal is very similar to today's PA. Back in June/July, we formed a Triple Bottom pattern, where we had three similar lows, with a decline in volume at each consecutive low.
I do still believe this is a bit of a stretch right now. But we'll keep this here for the time being.
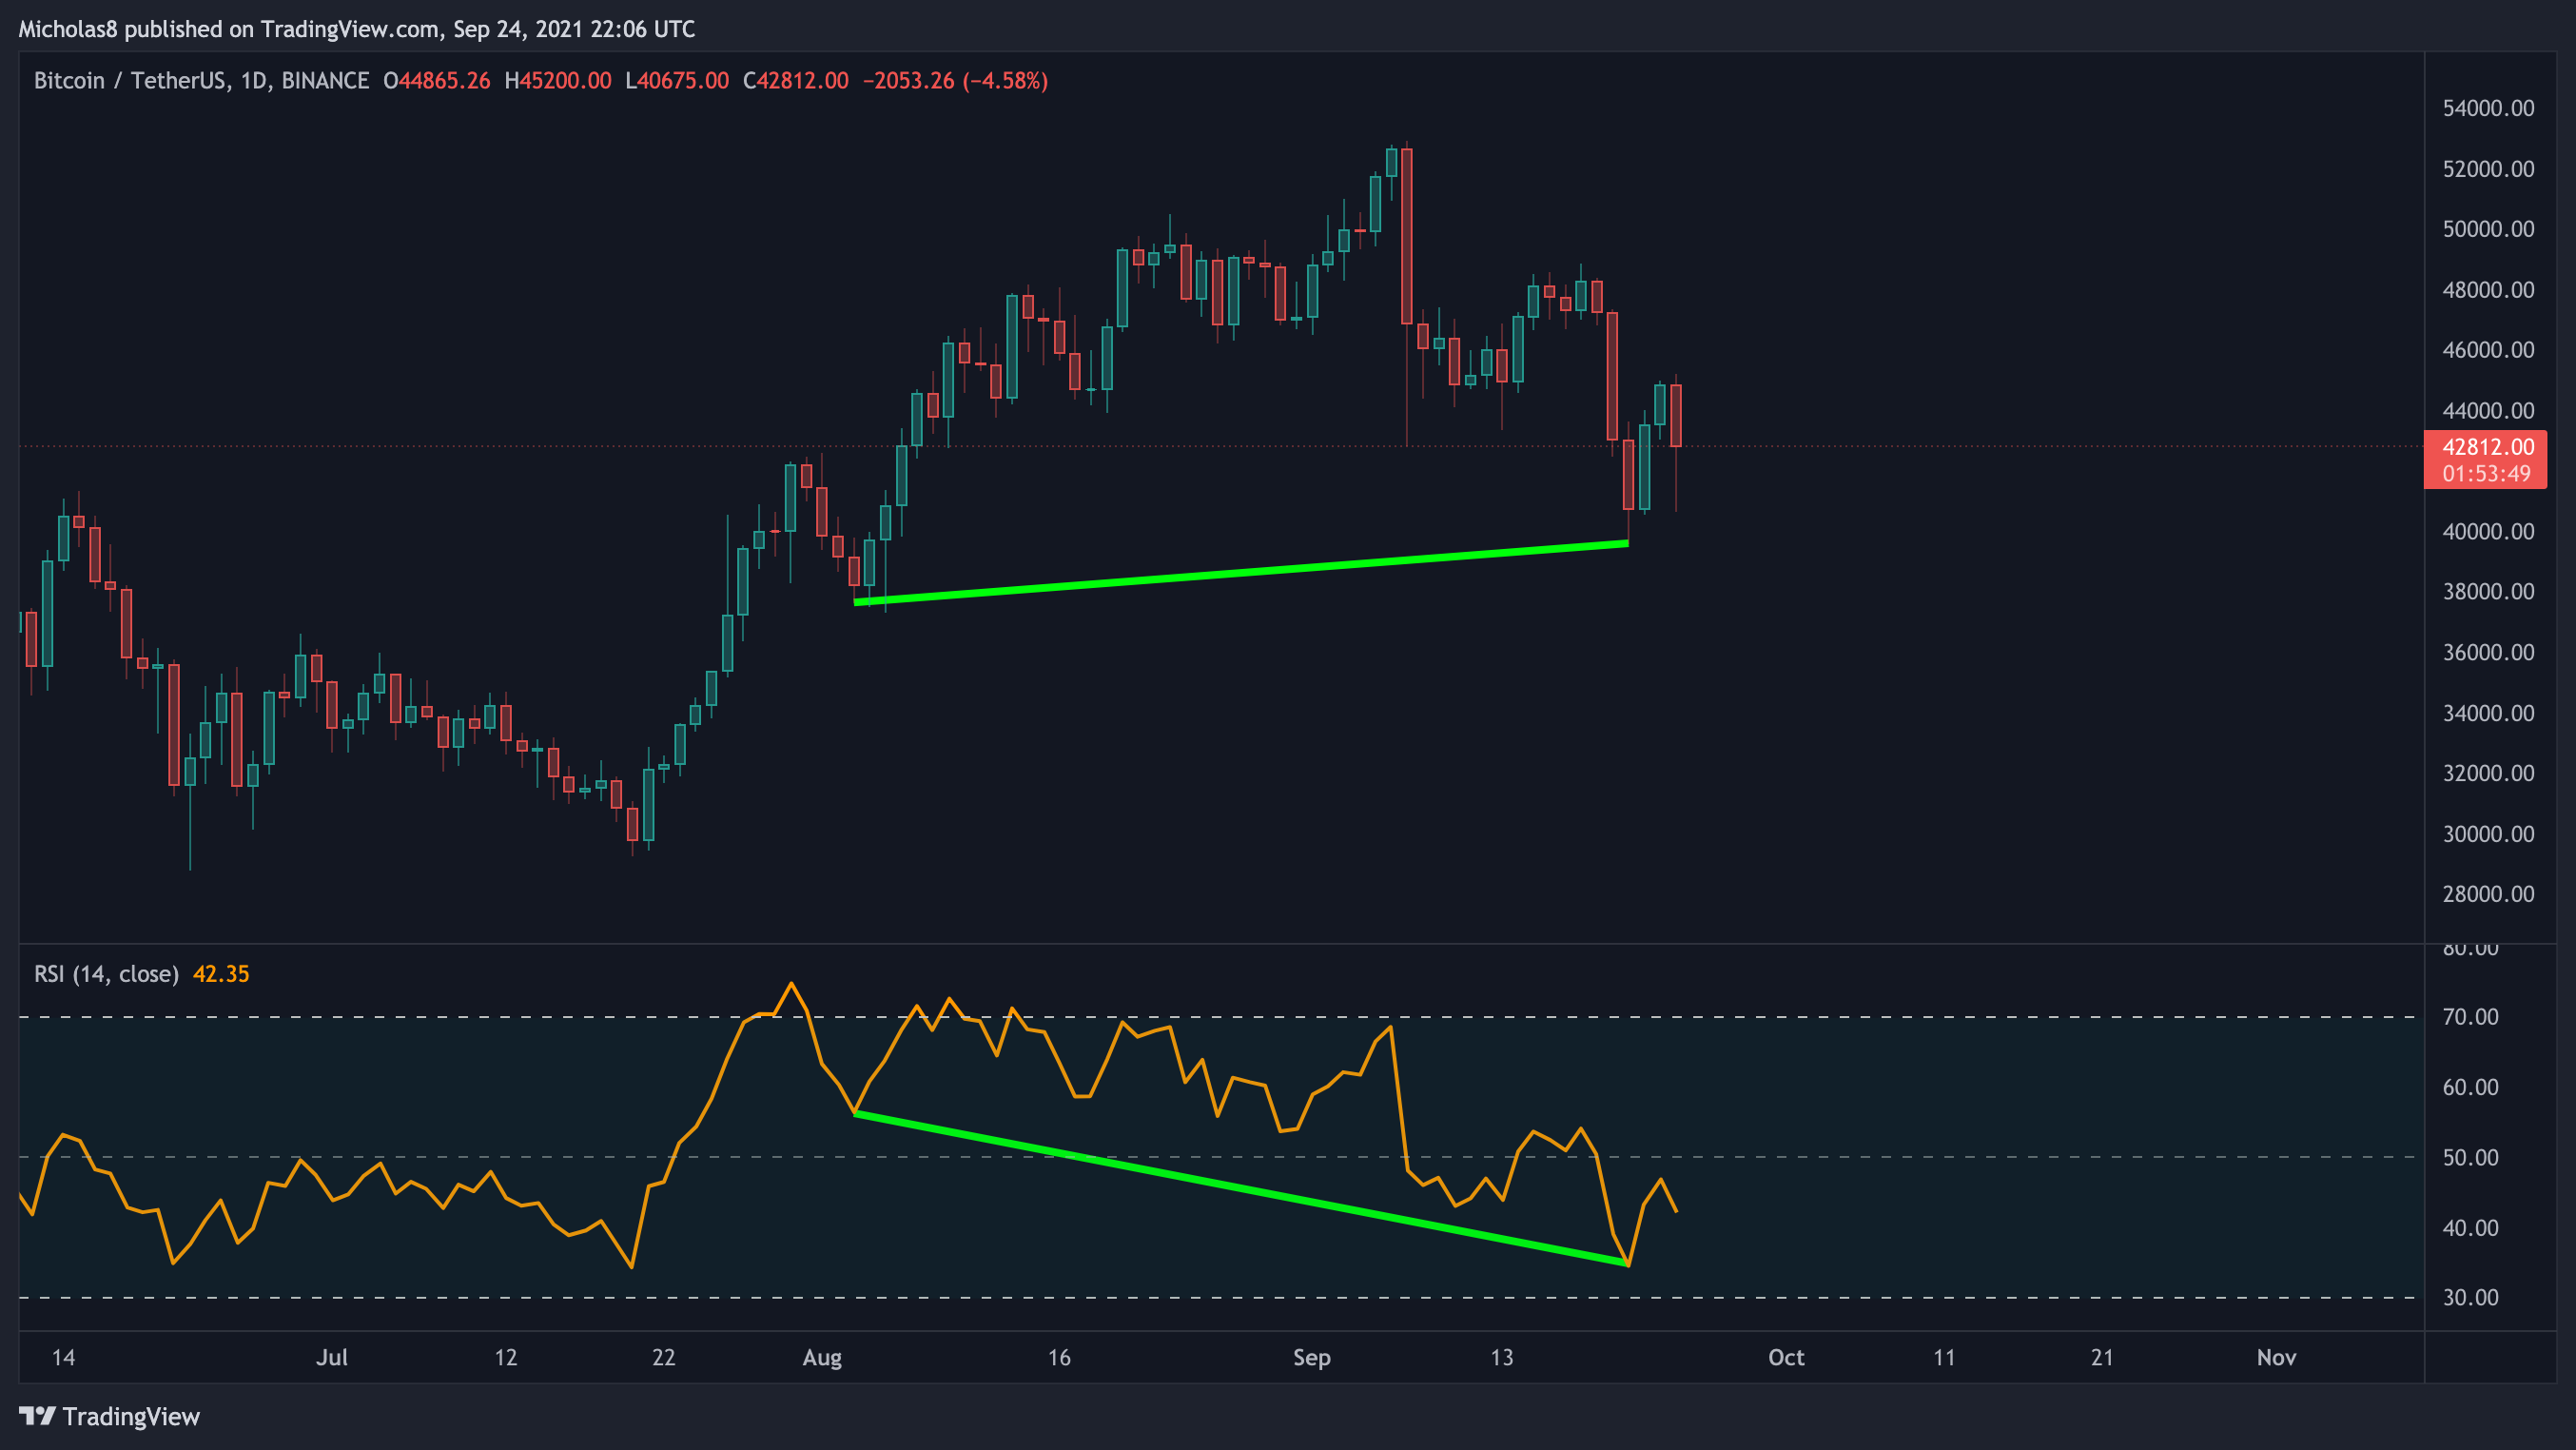
Divergences
Hidden Bullish Divergence (green)
We have a higher low in price, with a lower low in the RSI. This is a hidden bullish divergence, which signals a possible trend continuation. In this case, that means up.
Invalidation: Lower low in price, with a lower low in the RSI.
Bullish Divergence (green)
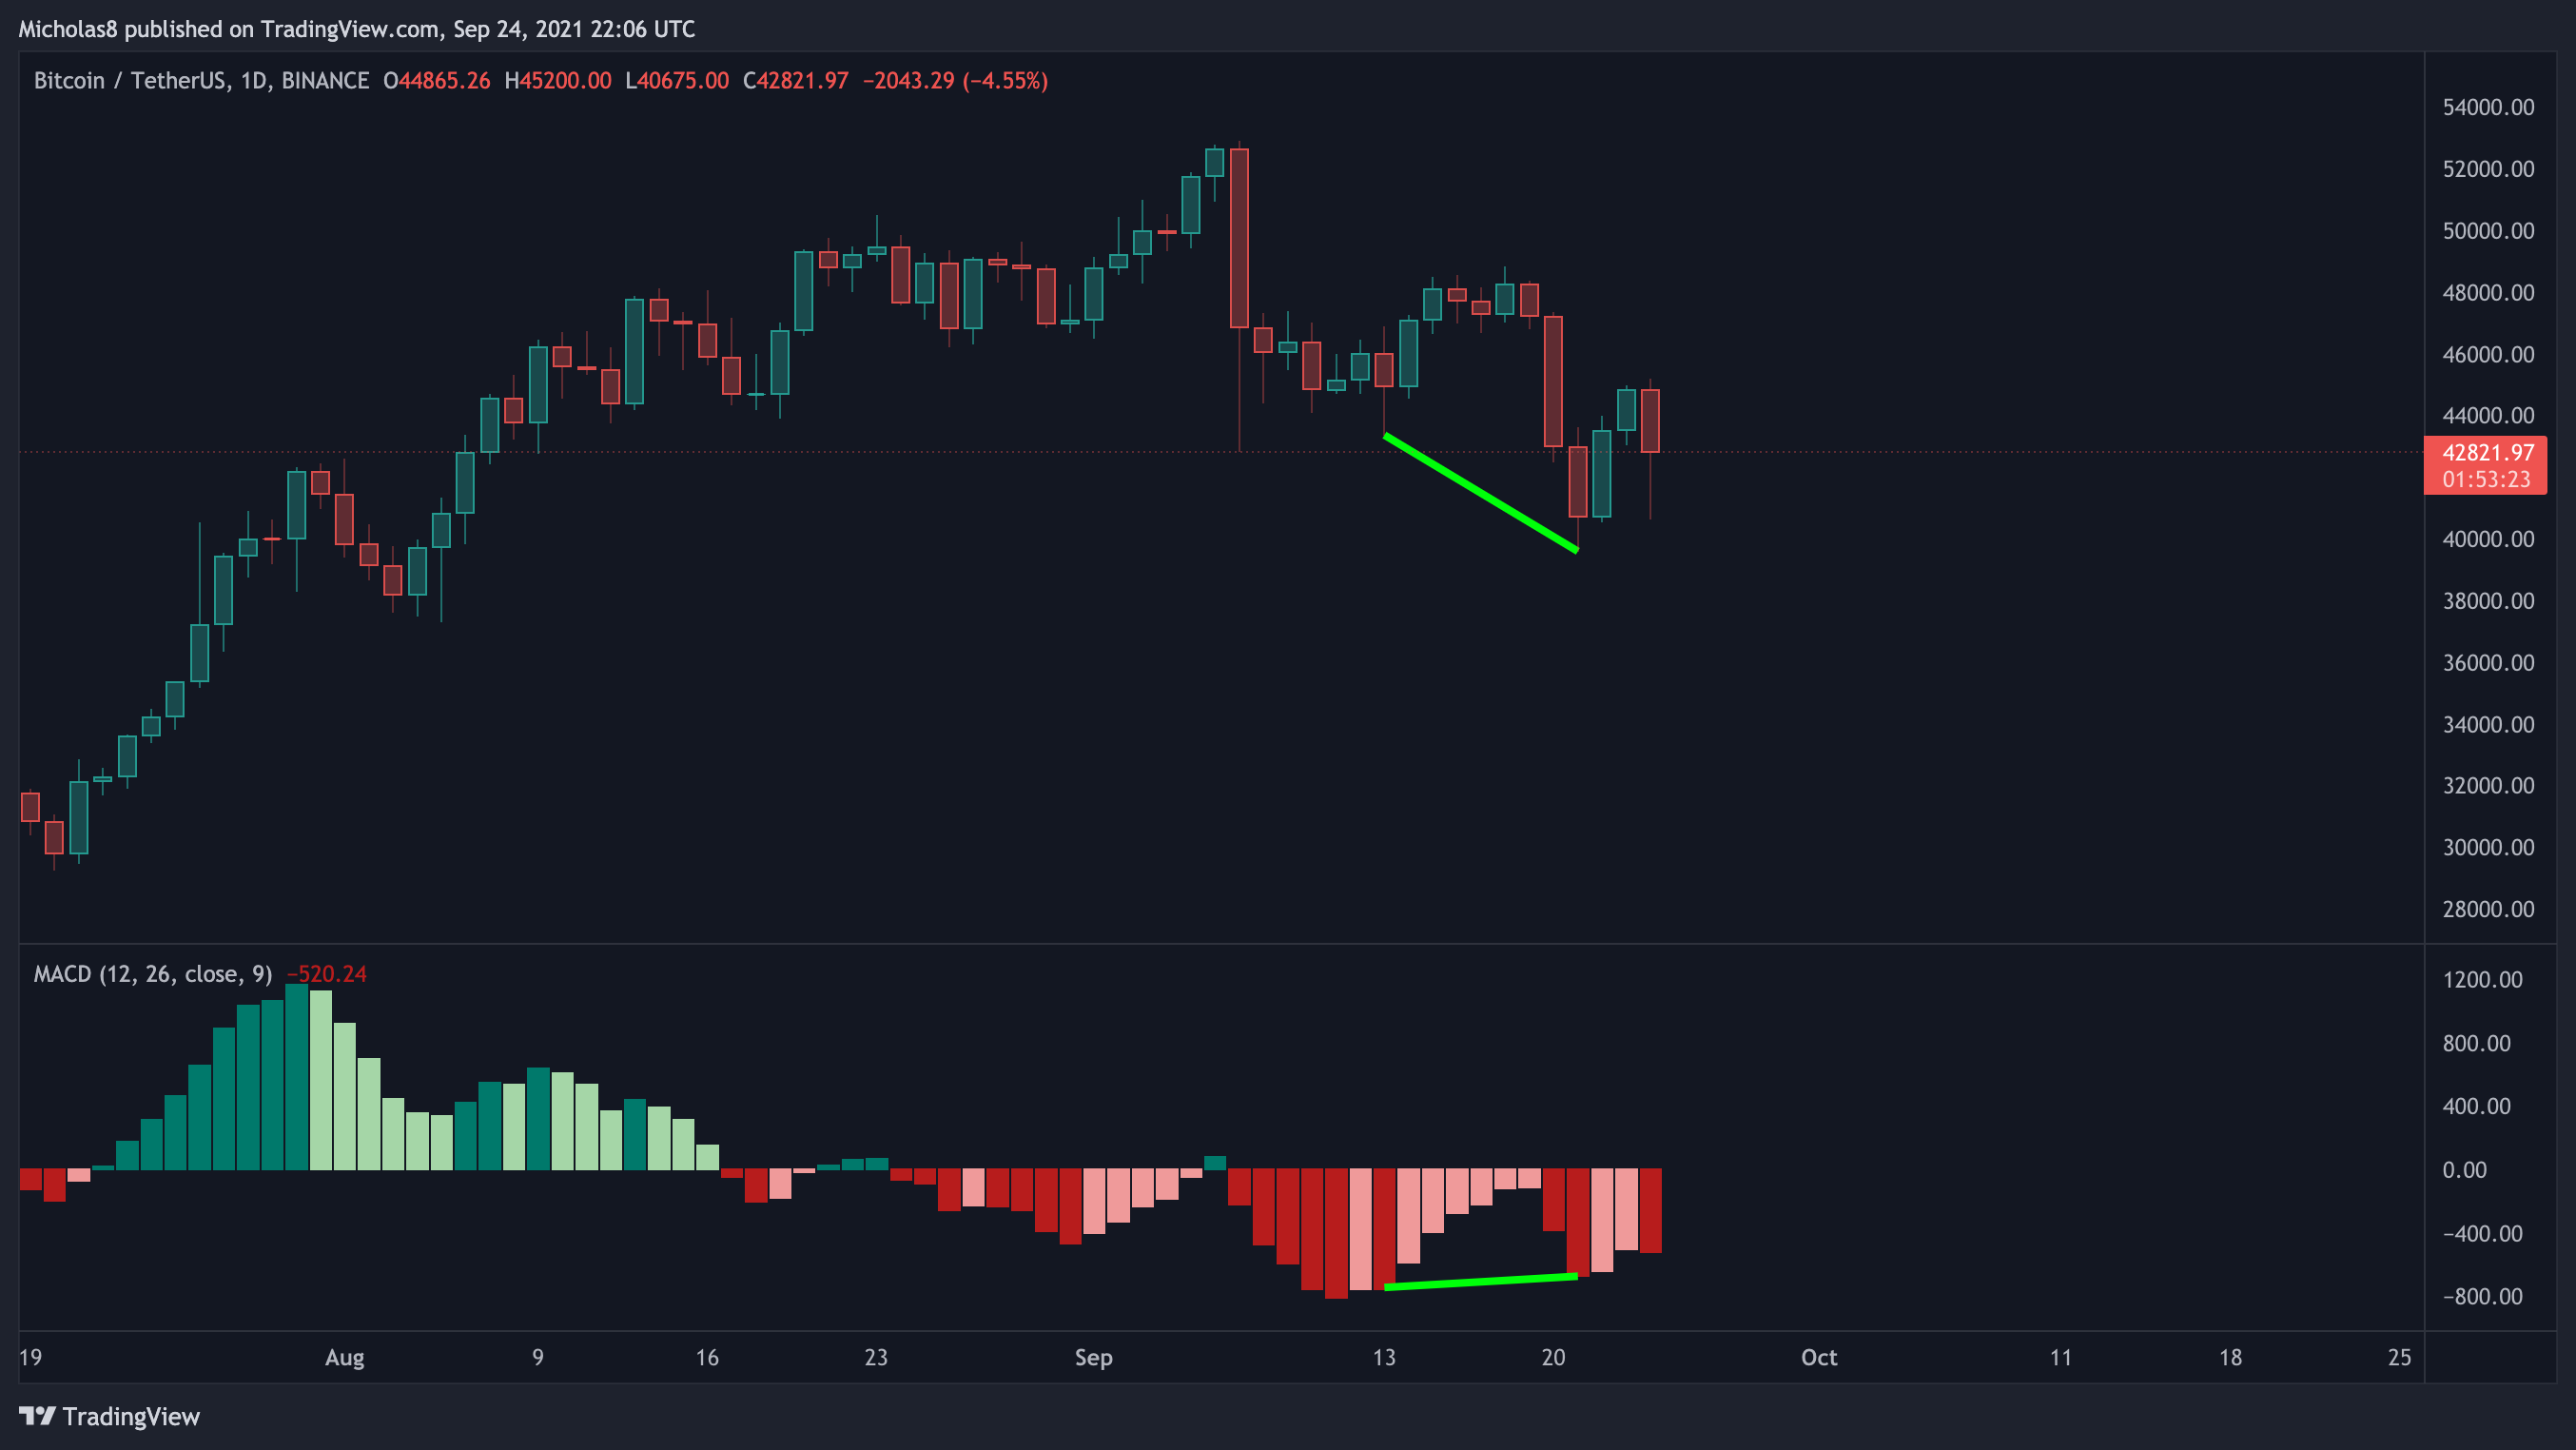
We have a lower low in price, with a higher low in the MACD. This is a bullish divergence, which signals a possible trend reversal. In this case, that means up.
Invalidation: Lower low in price with a lower low in the MACD.
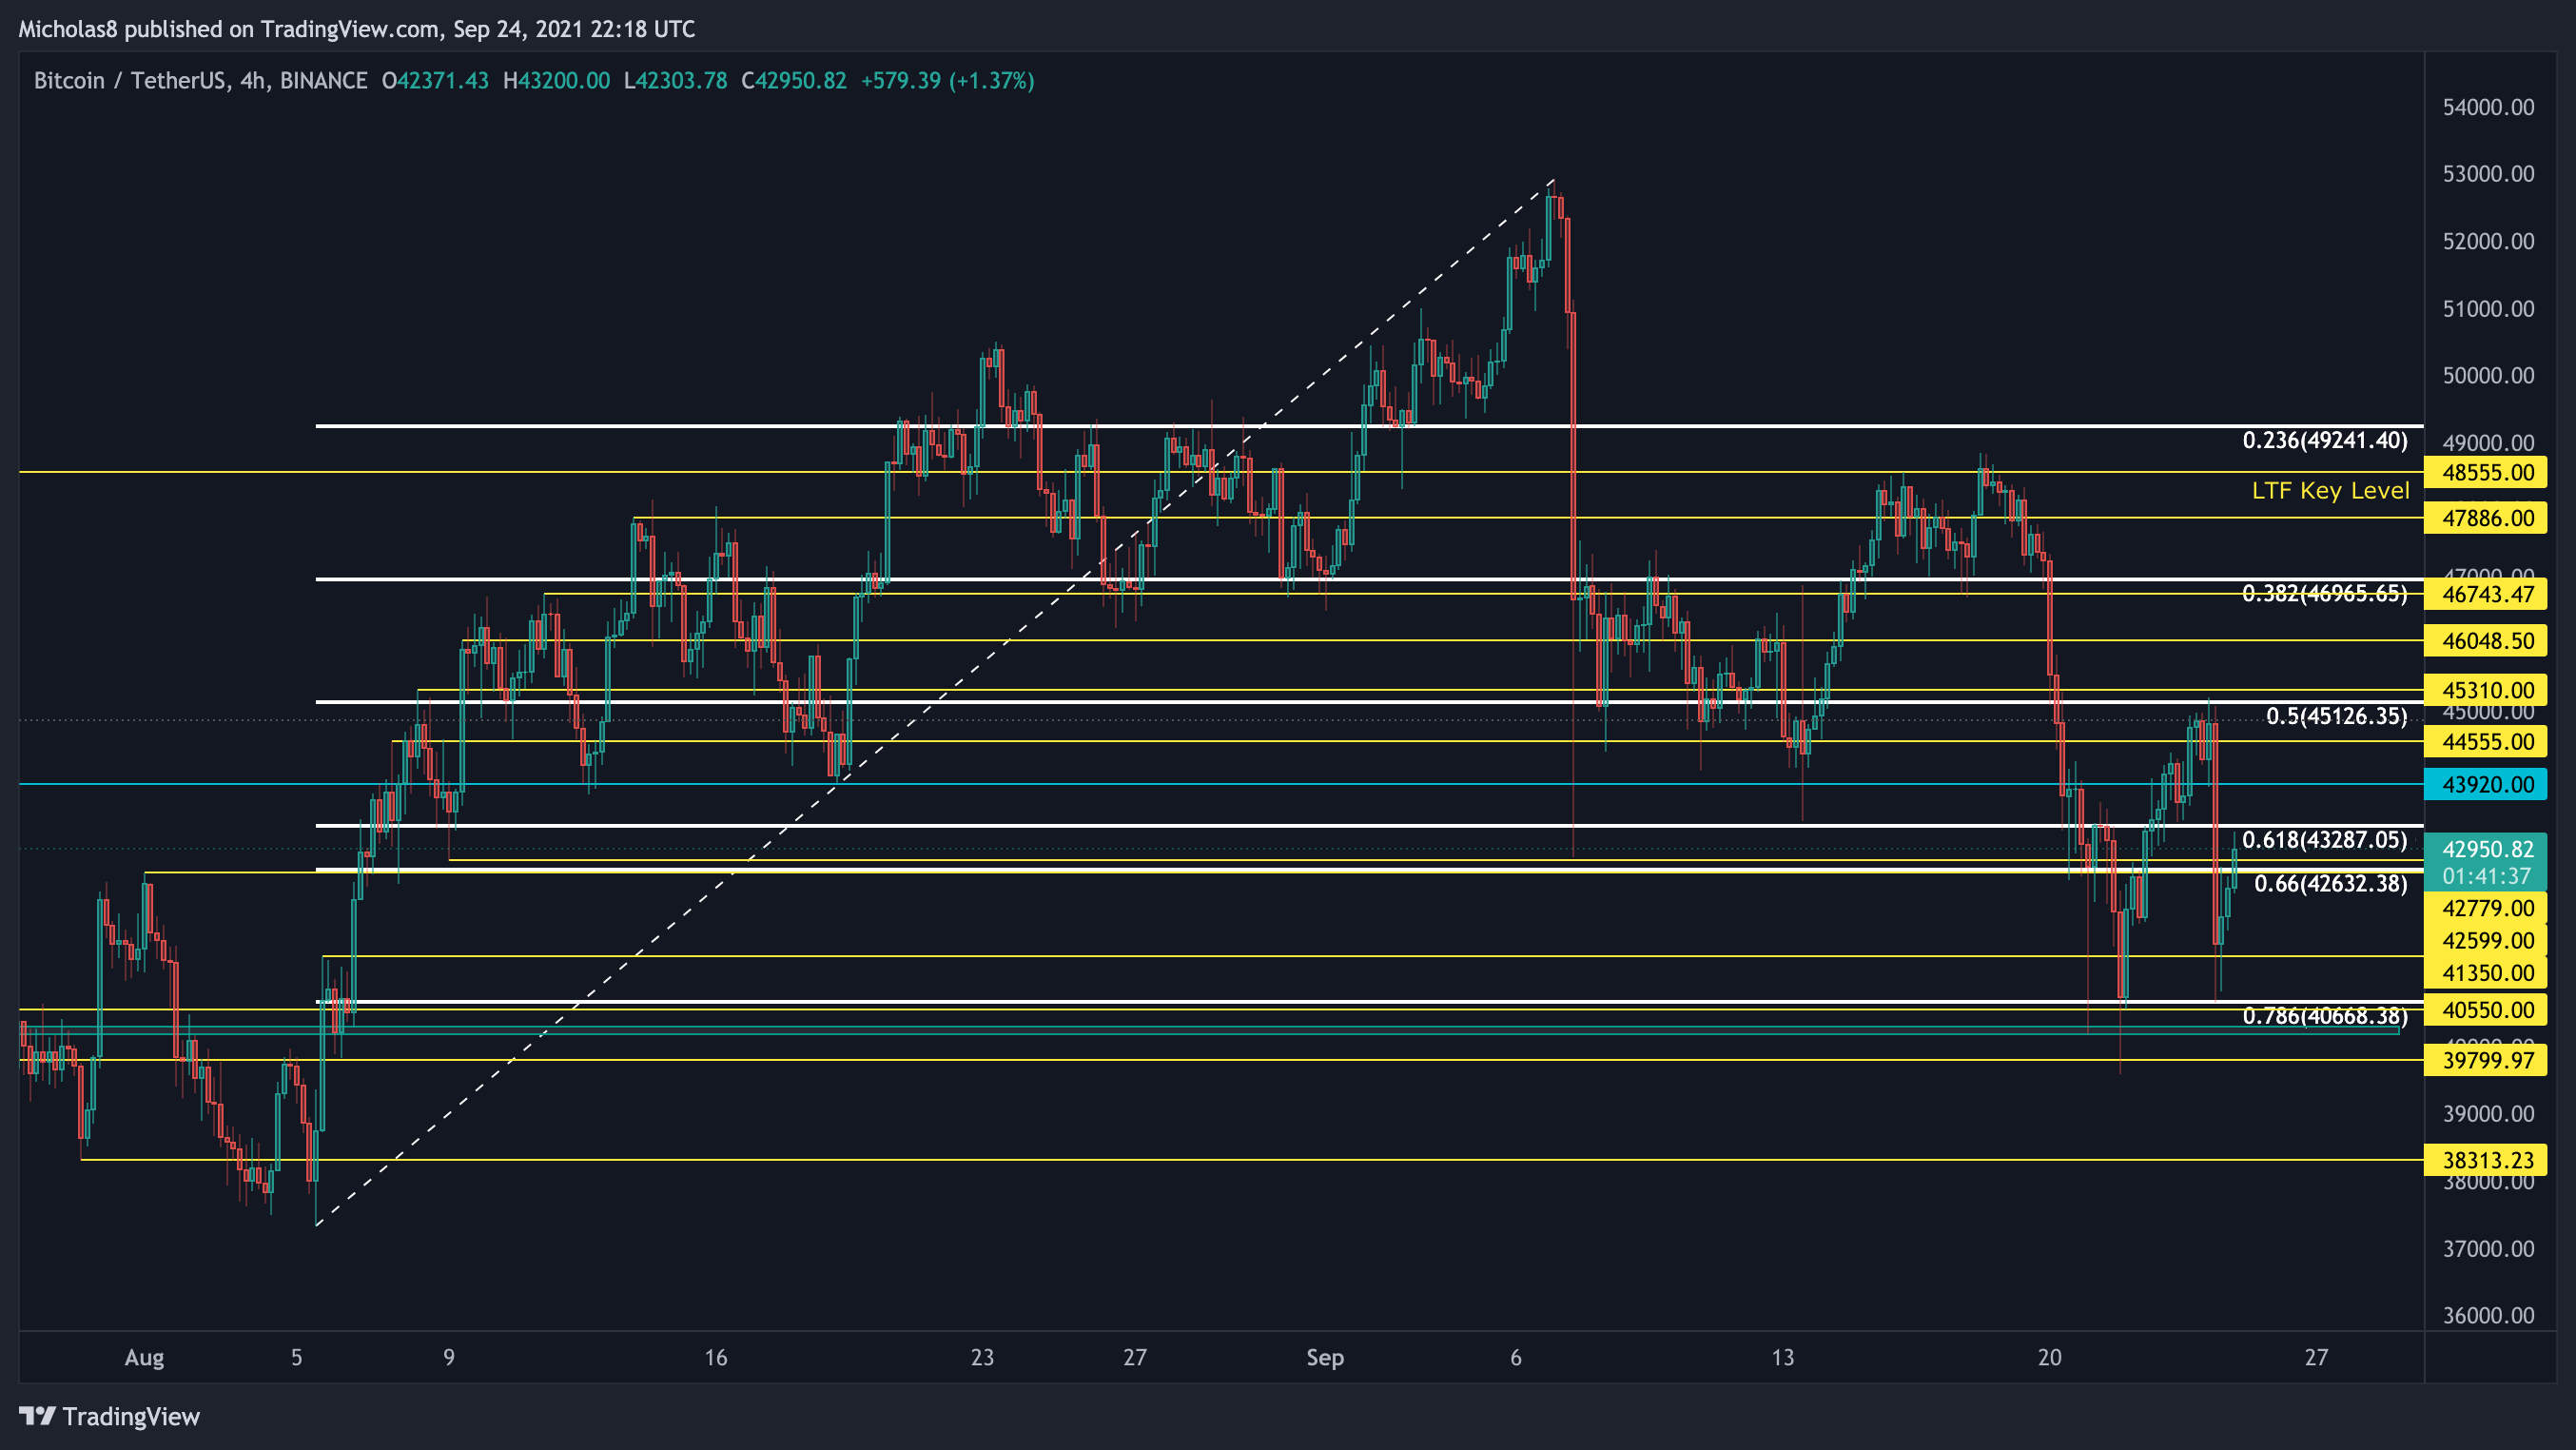
4H Timeframe
Patterns
*Please note not all technical targets will be hit, so be aware of all key levels and Fibonacci Levels, and also look out for divergences as they have the power to reverse a trend
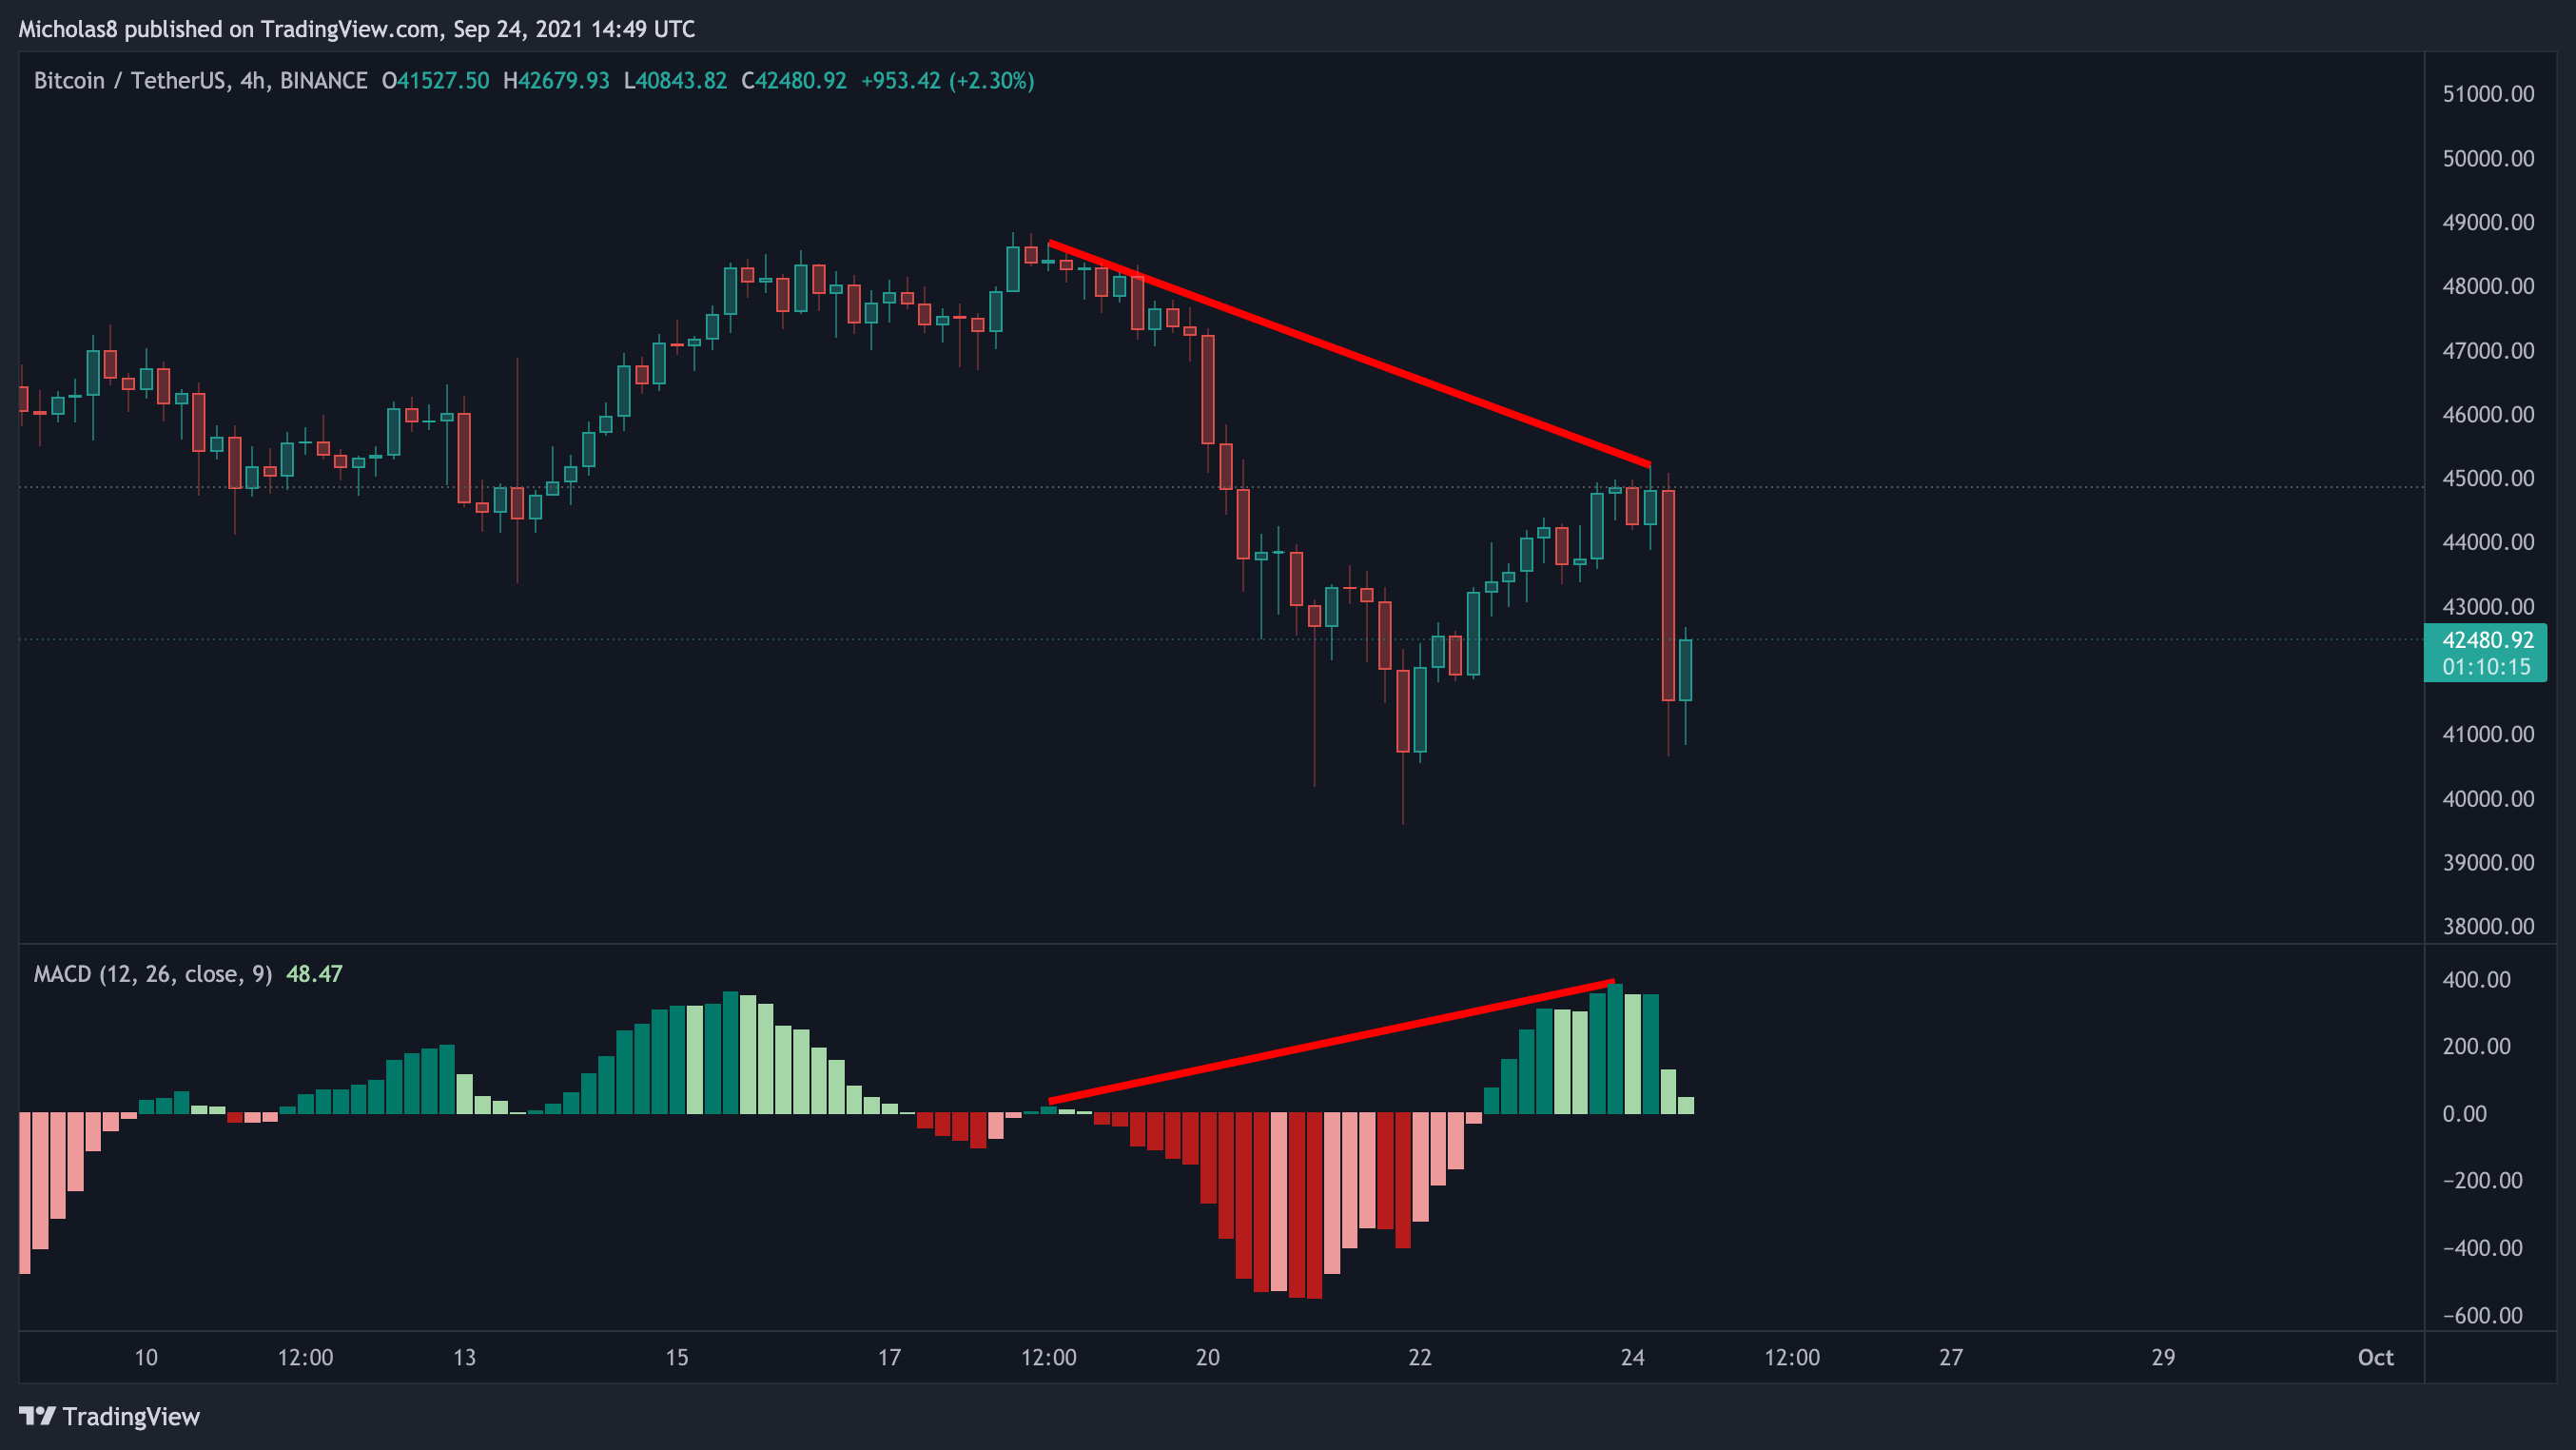
Falling Wedge (bullish bias)
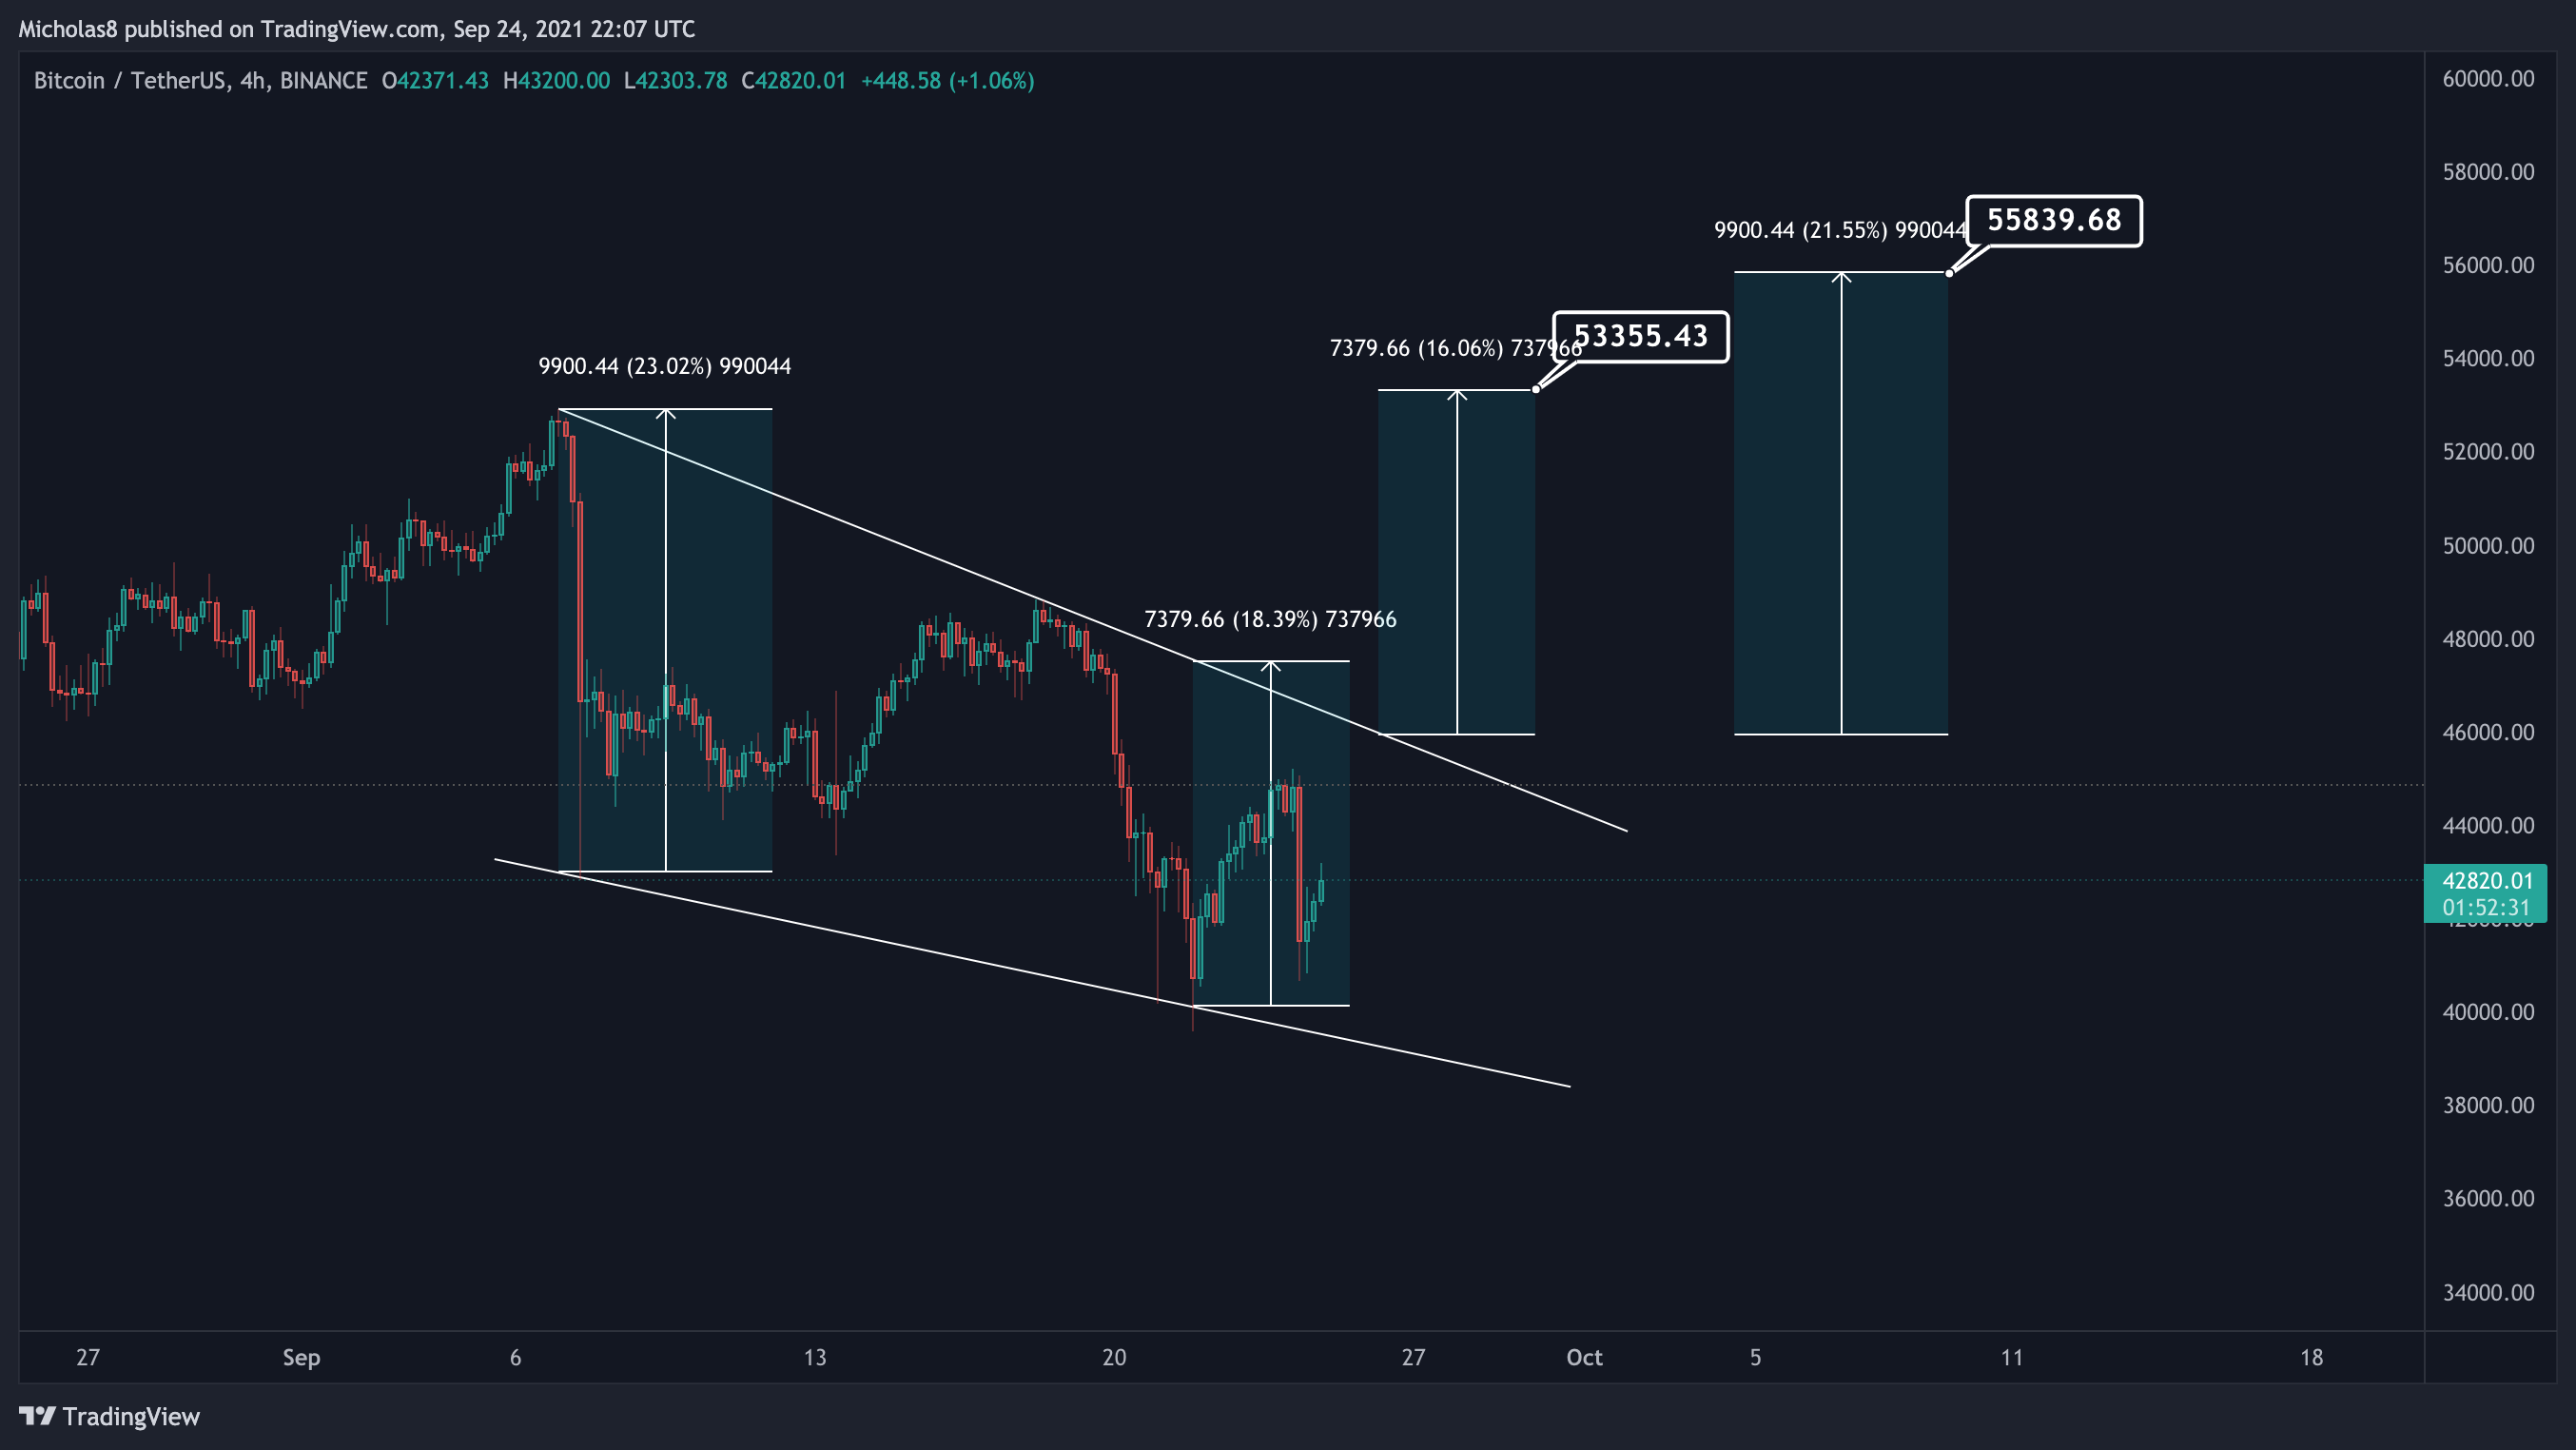
Measured moves should be taken from the point of breakout
53.3k
55.8k
1H Timeframe
Divergences
Hidden Bullish Divergence (green)
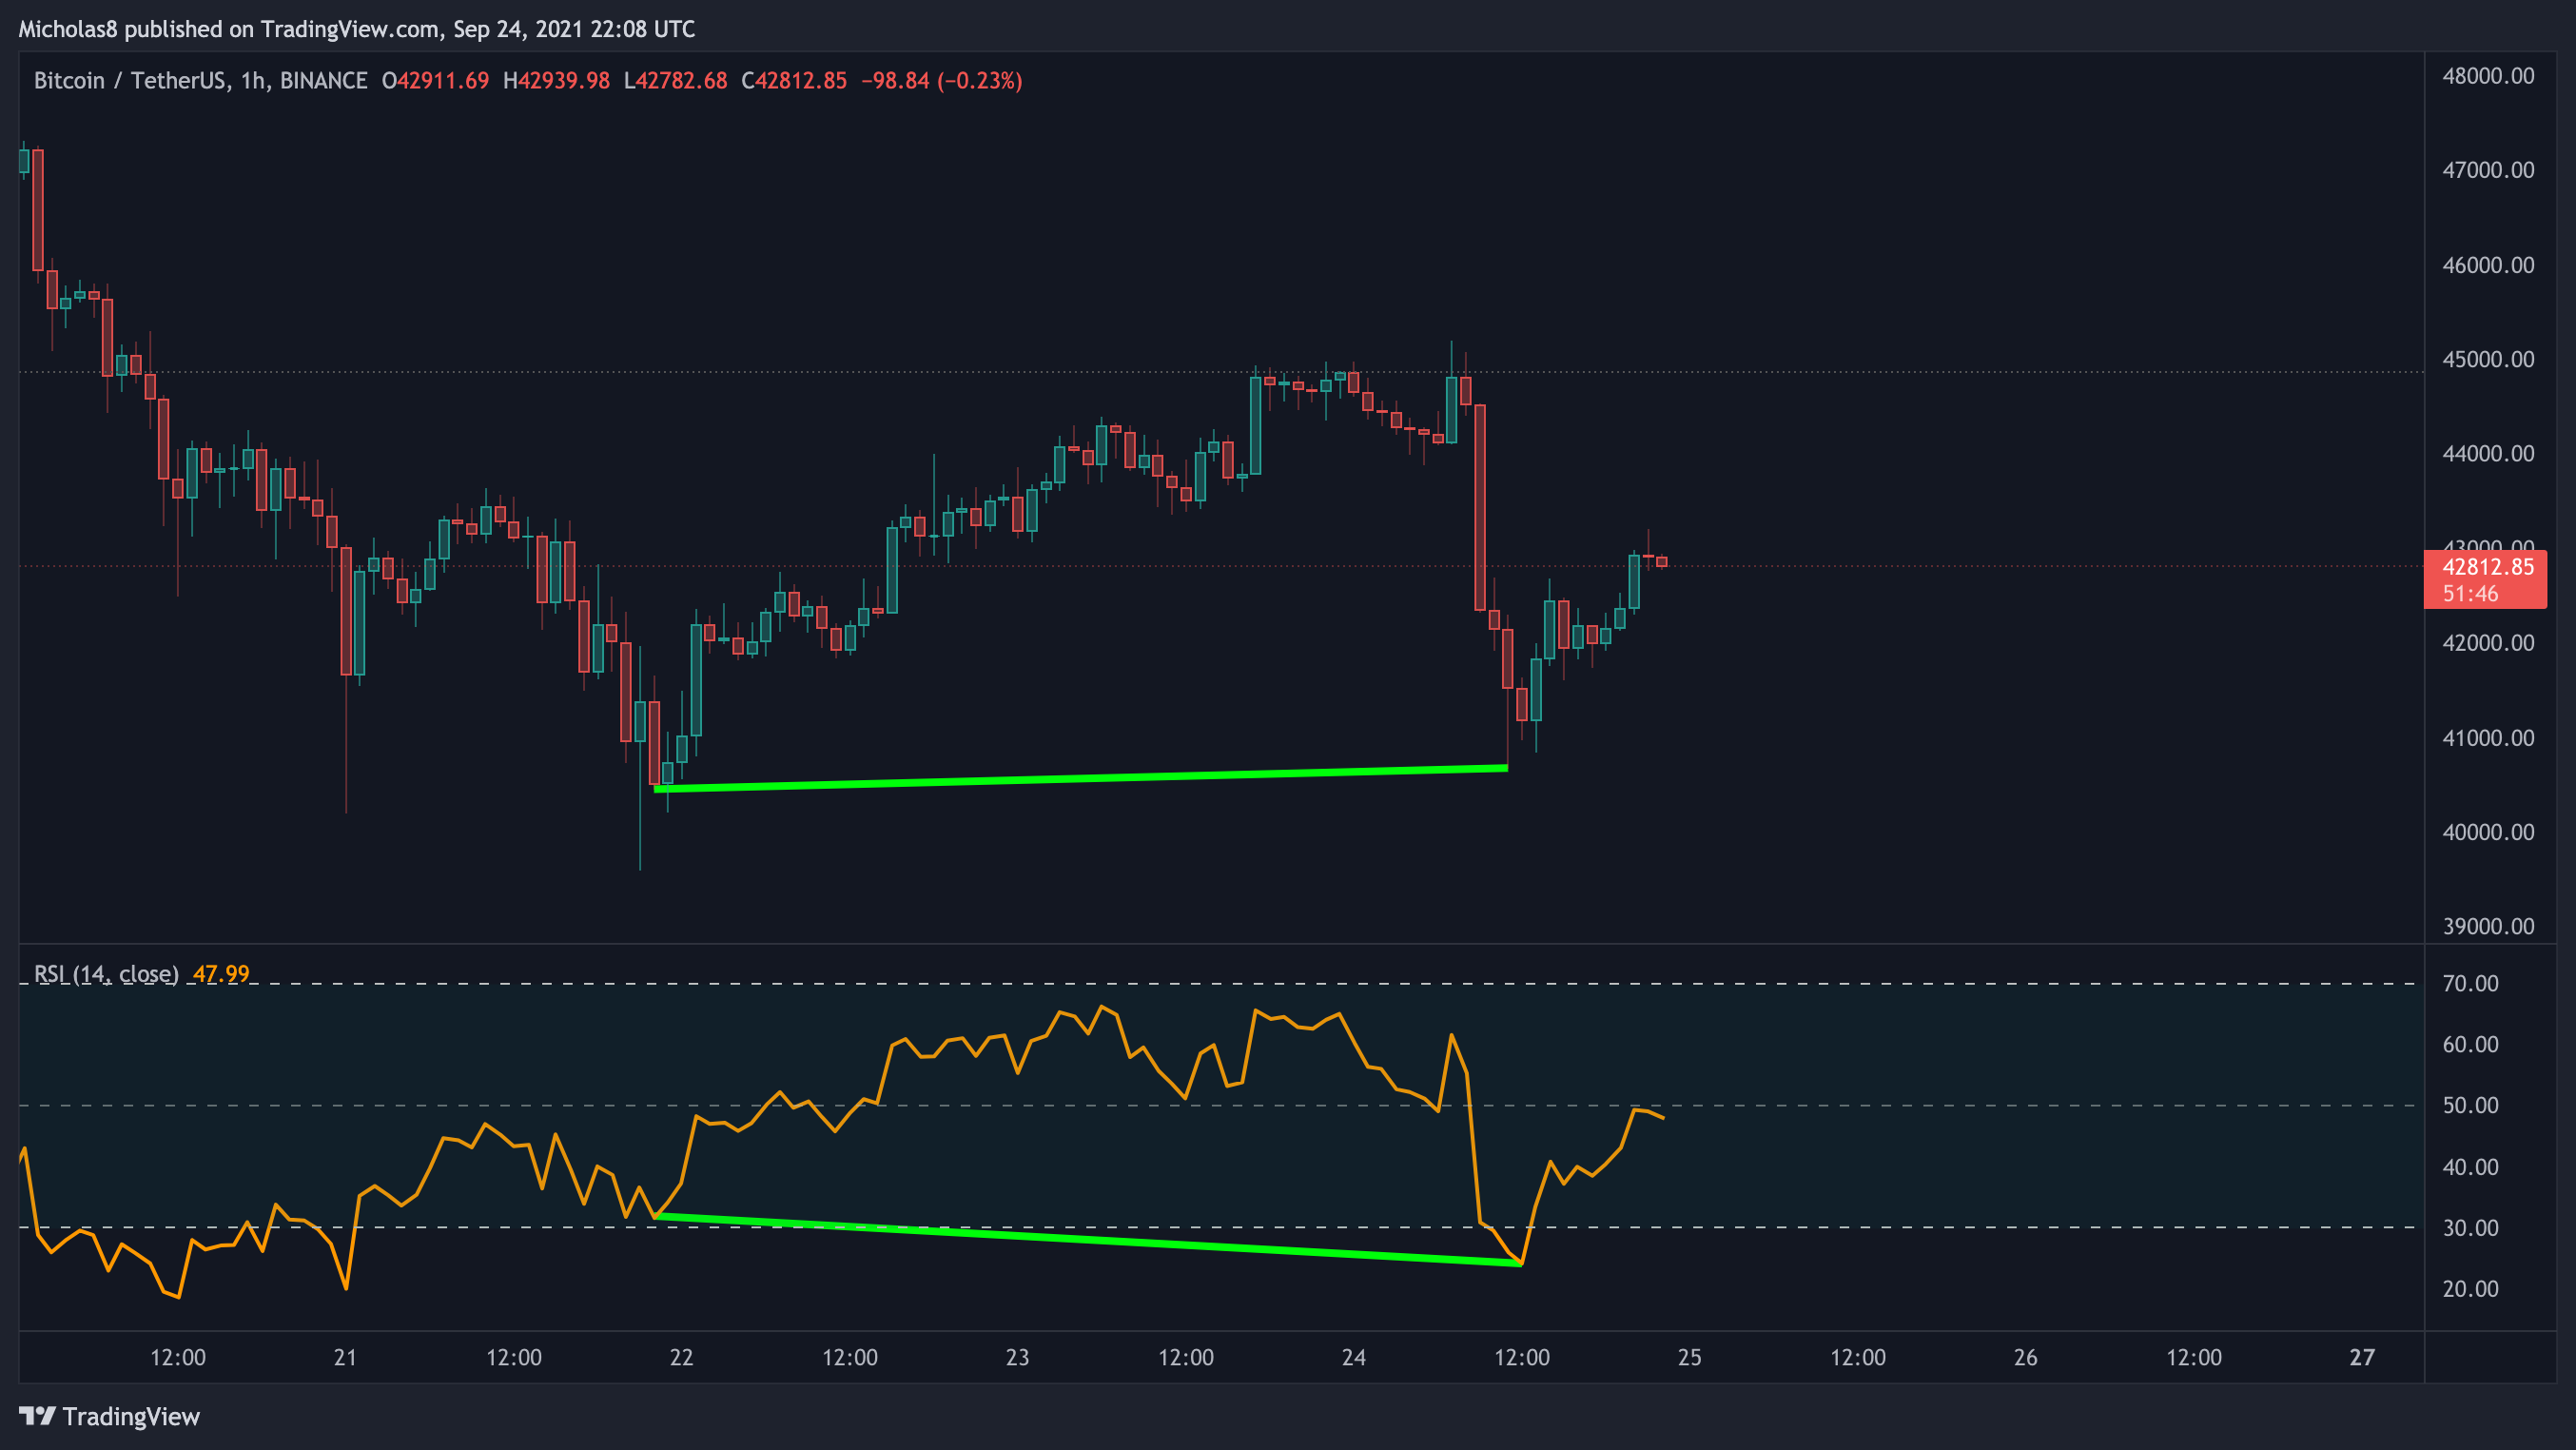
We have a higher low in price, with a lower low in the RSI. This is a hidden bullish divergence, which signals a possible trend continuation. In this case, that means up.
Note: This formed about 10 hours ago, but still may have some juice left.
Invalidation: Lower low in price, with a lower low in the RSI.
.
.
.
THE BAD
Daily Timeframe
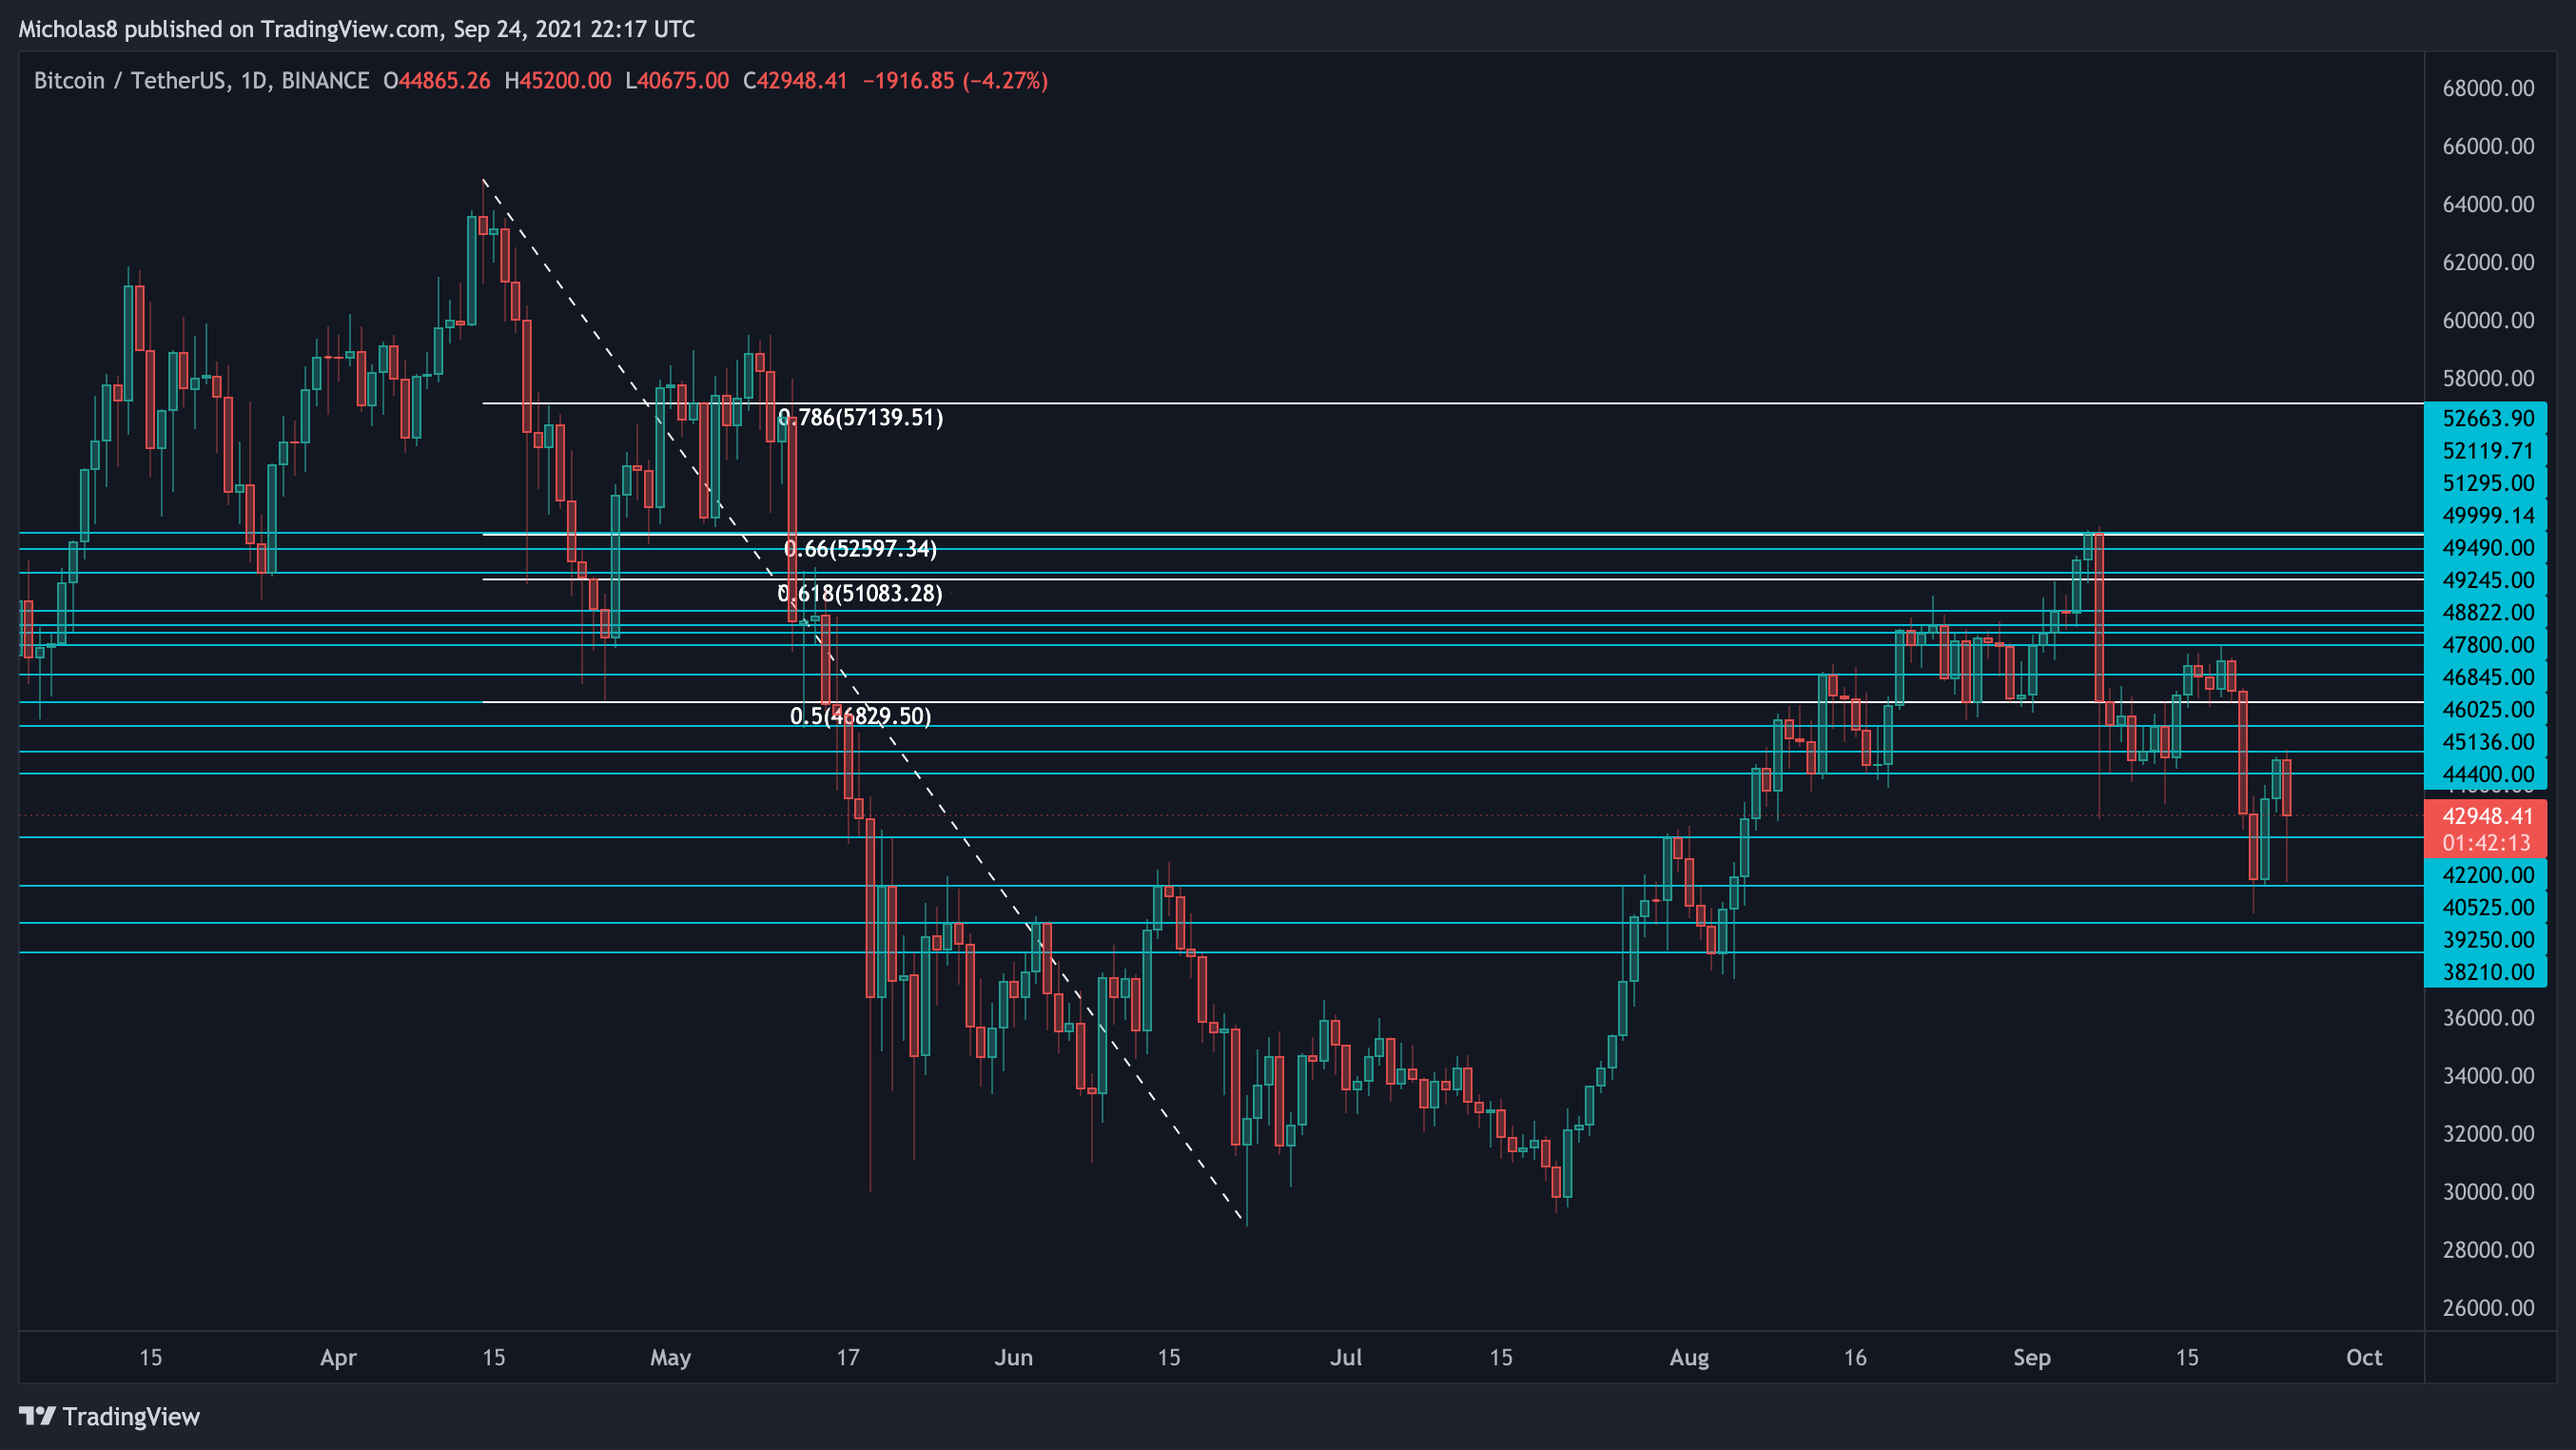
Logarithmic Curve
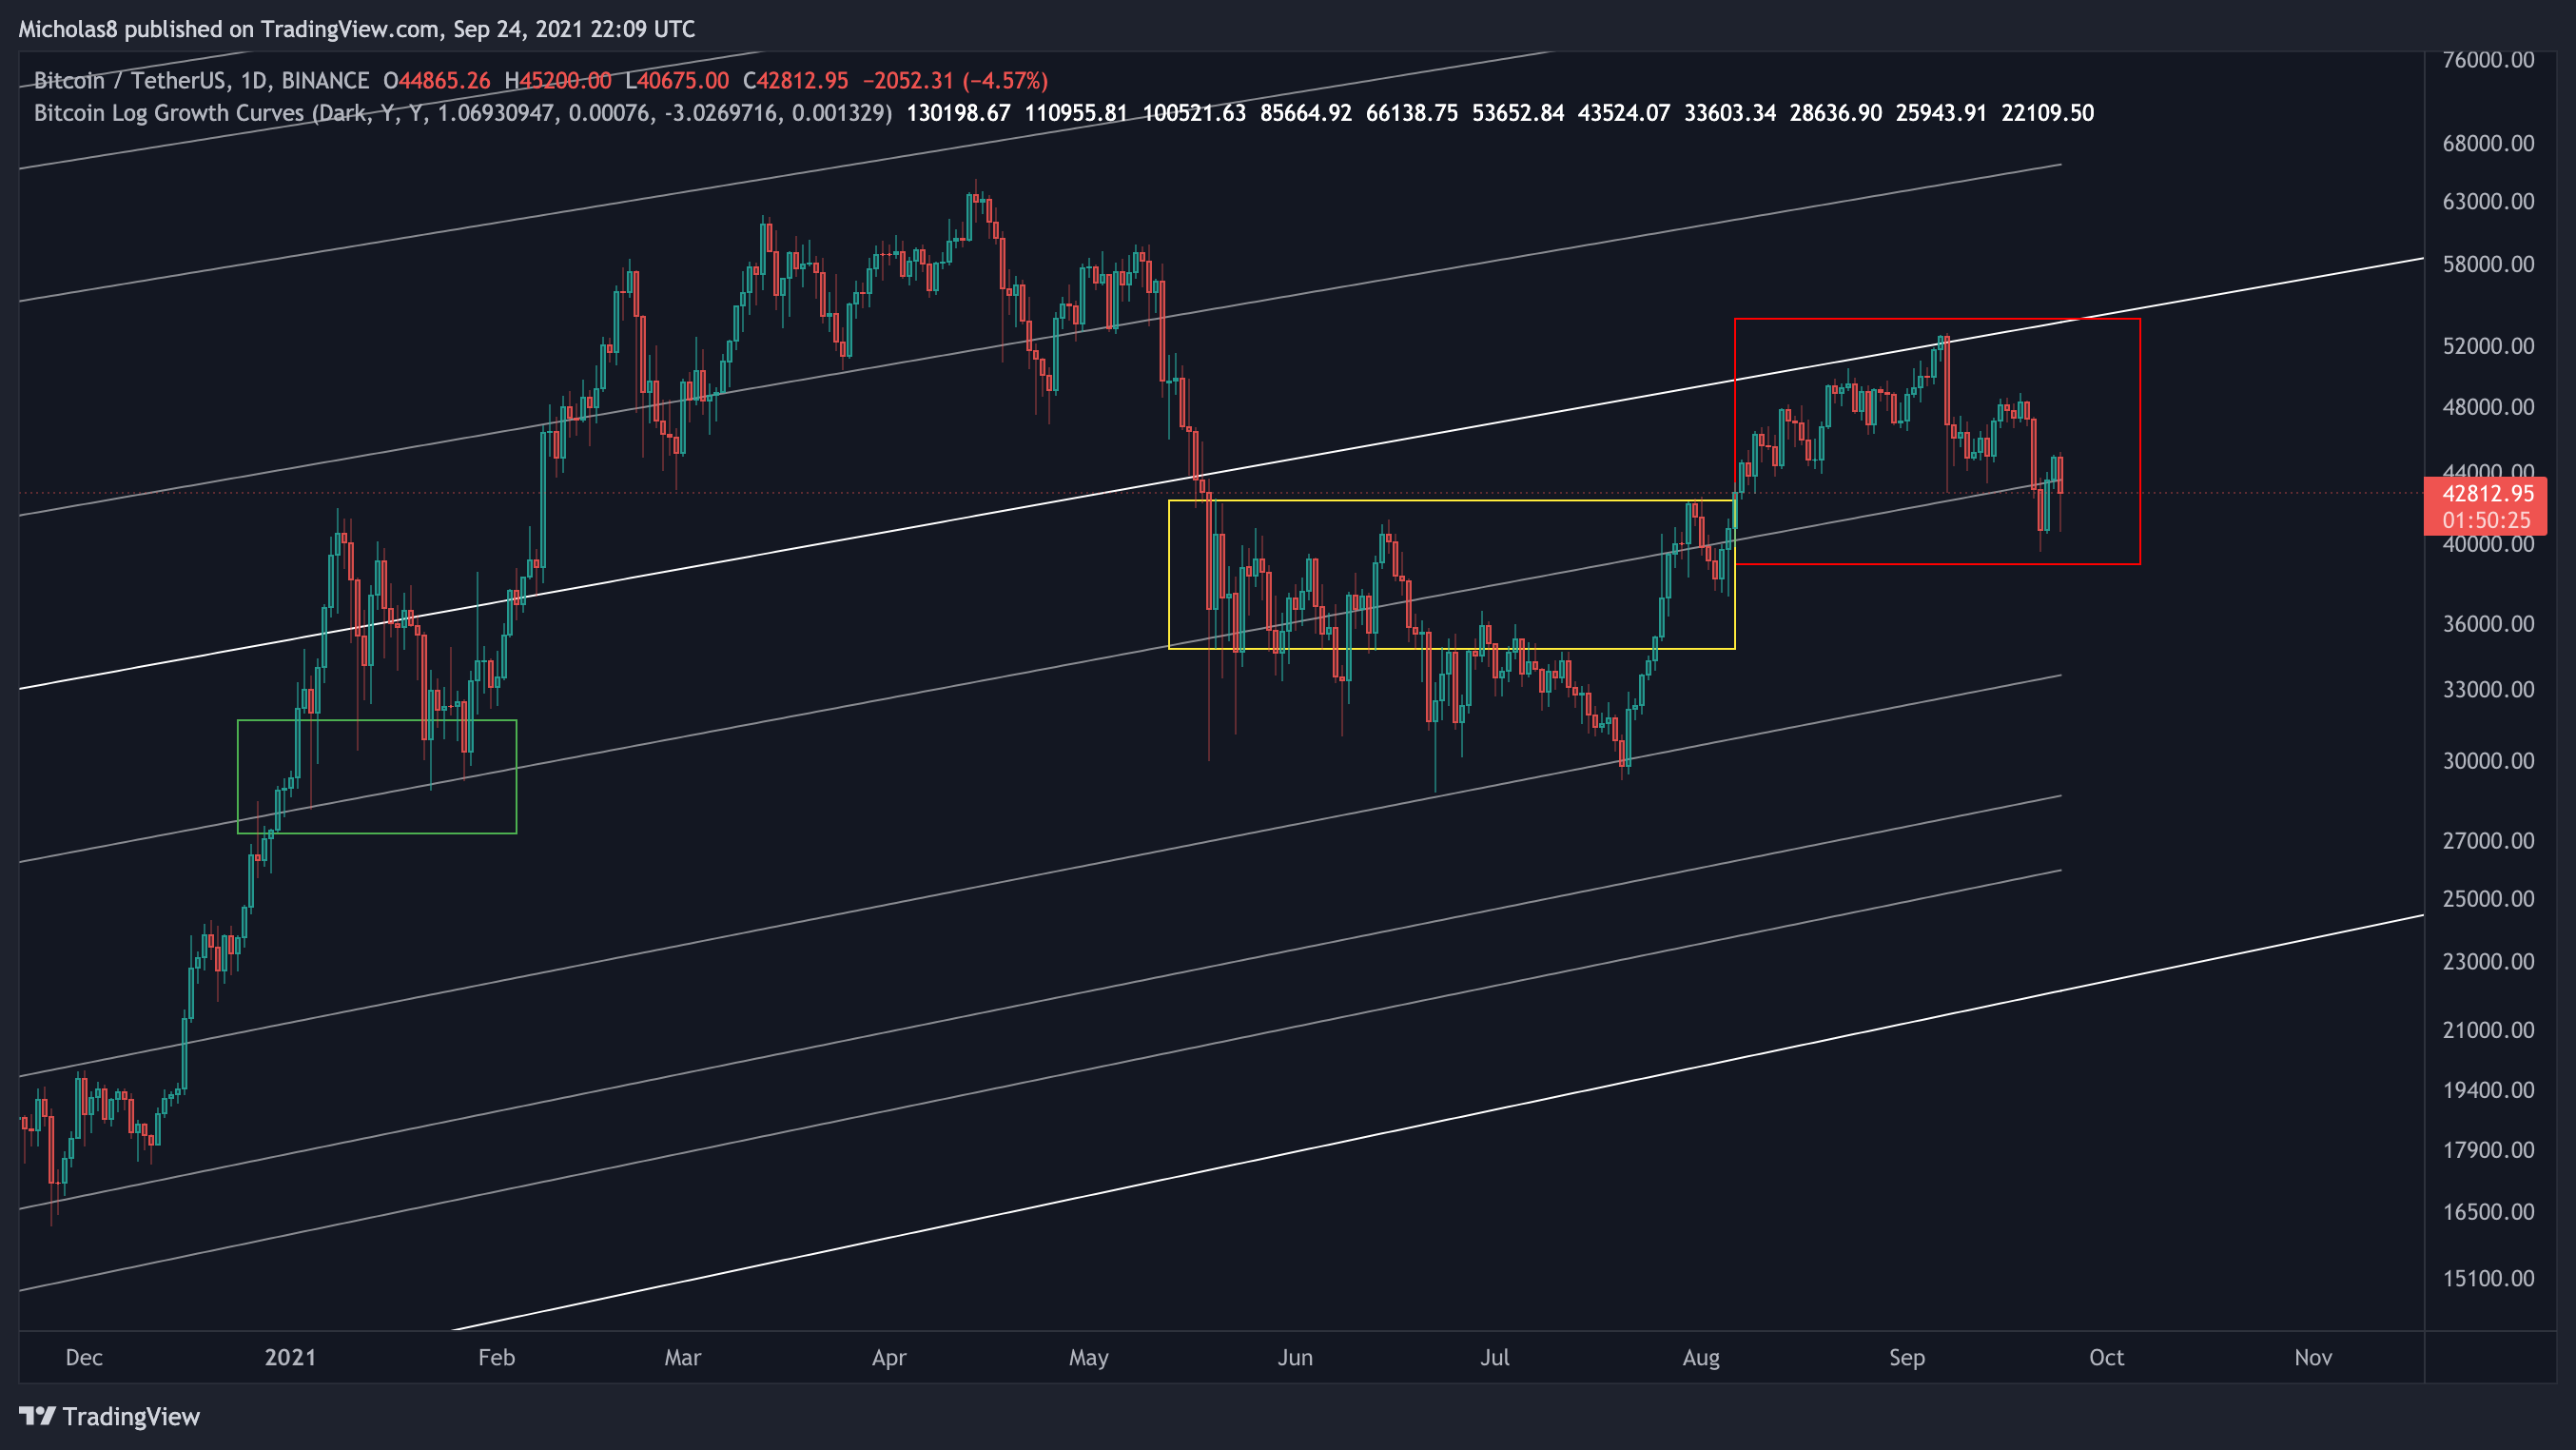
Outlined by the red rectangle, Bitcoin has seen a rejection at the middle line of this curve as we have seen in the past. If you haven't already, please read the Bonus Report on this topic: https://www.buymeacoffee.com/bitcoincharts/golden-cross-death-crosses-logarithmic-curve
It seems we are finding a bit of resistance from the line below the middle line, which is the 0.382 Fibonacci Level. Looking left, we can see it previously did serve as support back in Q1 (green). And most recently in Q2 and Q3, there was a congestion area (yellow) formed at that level. I'll continue monitoring this for new developments.
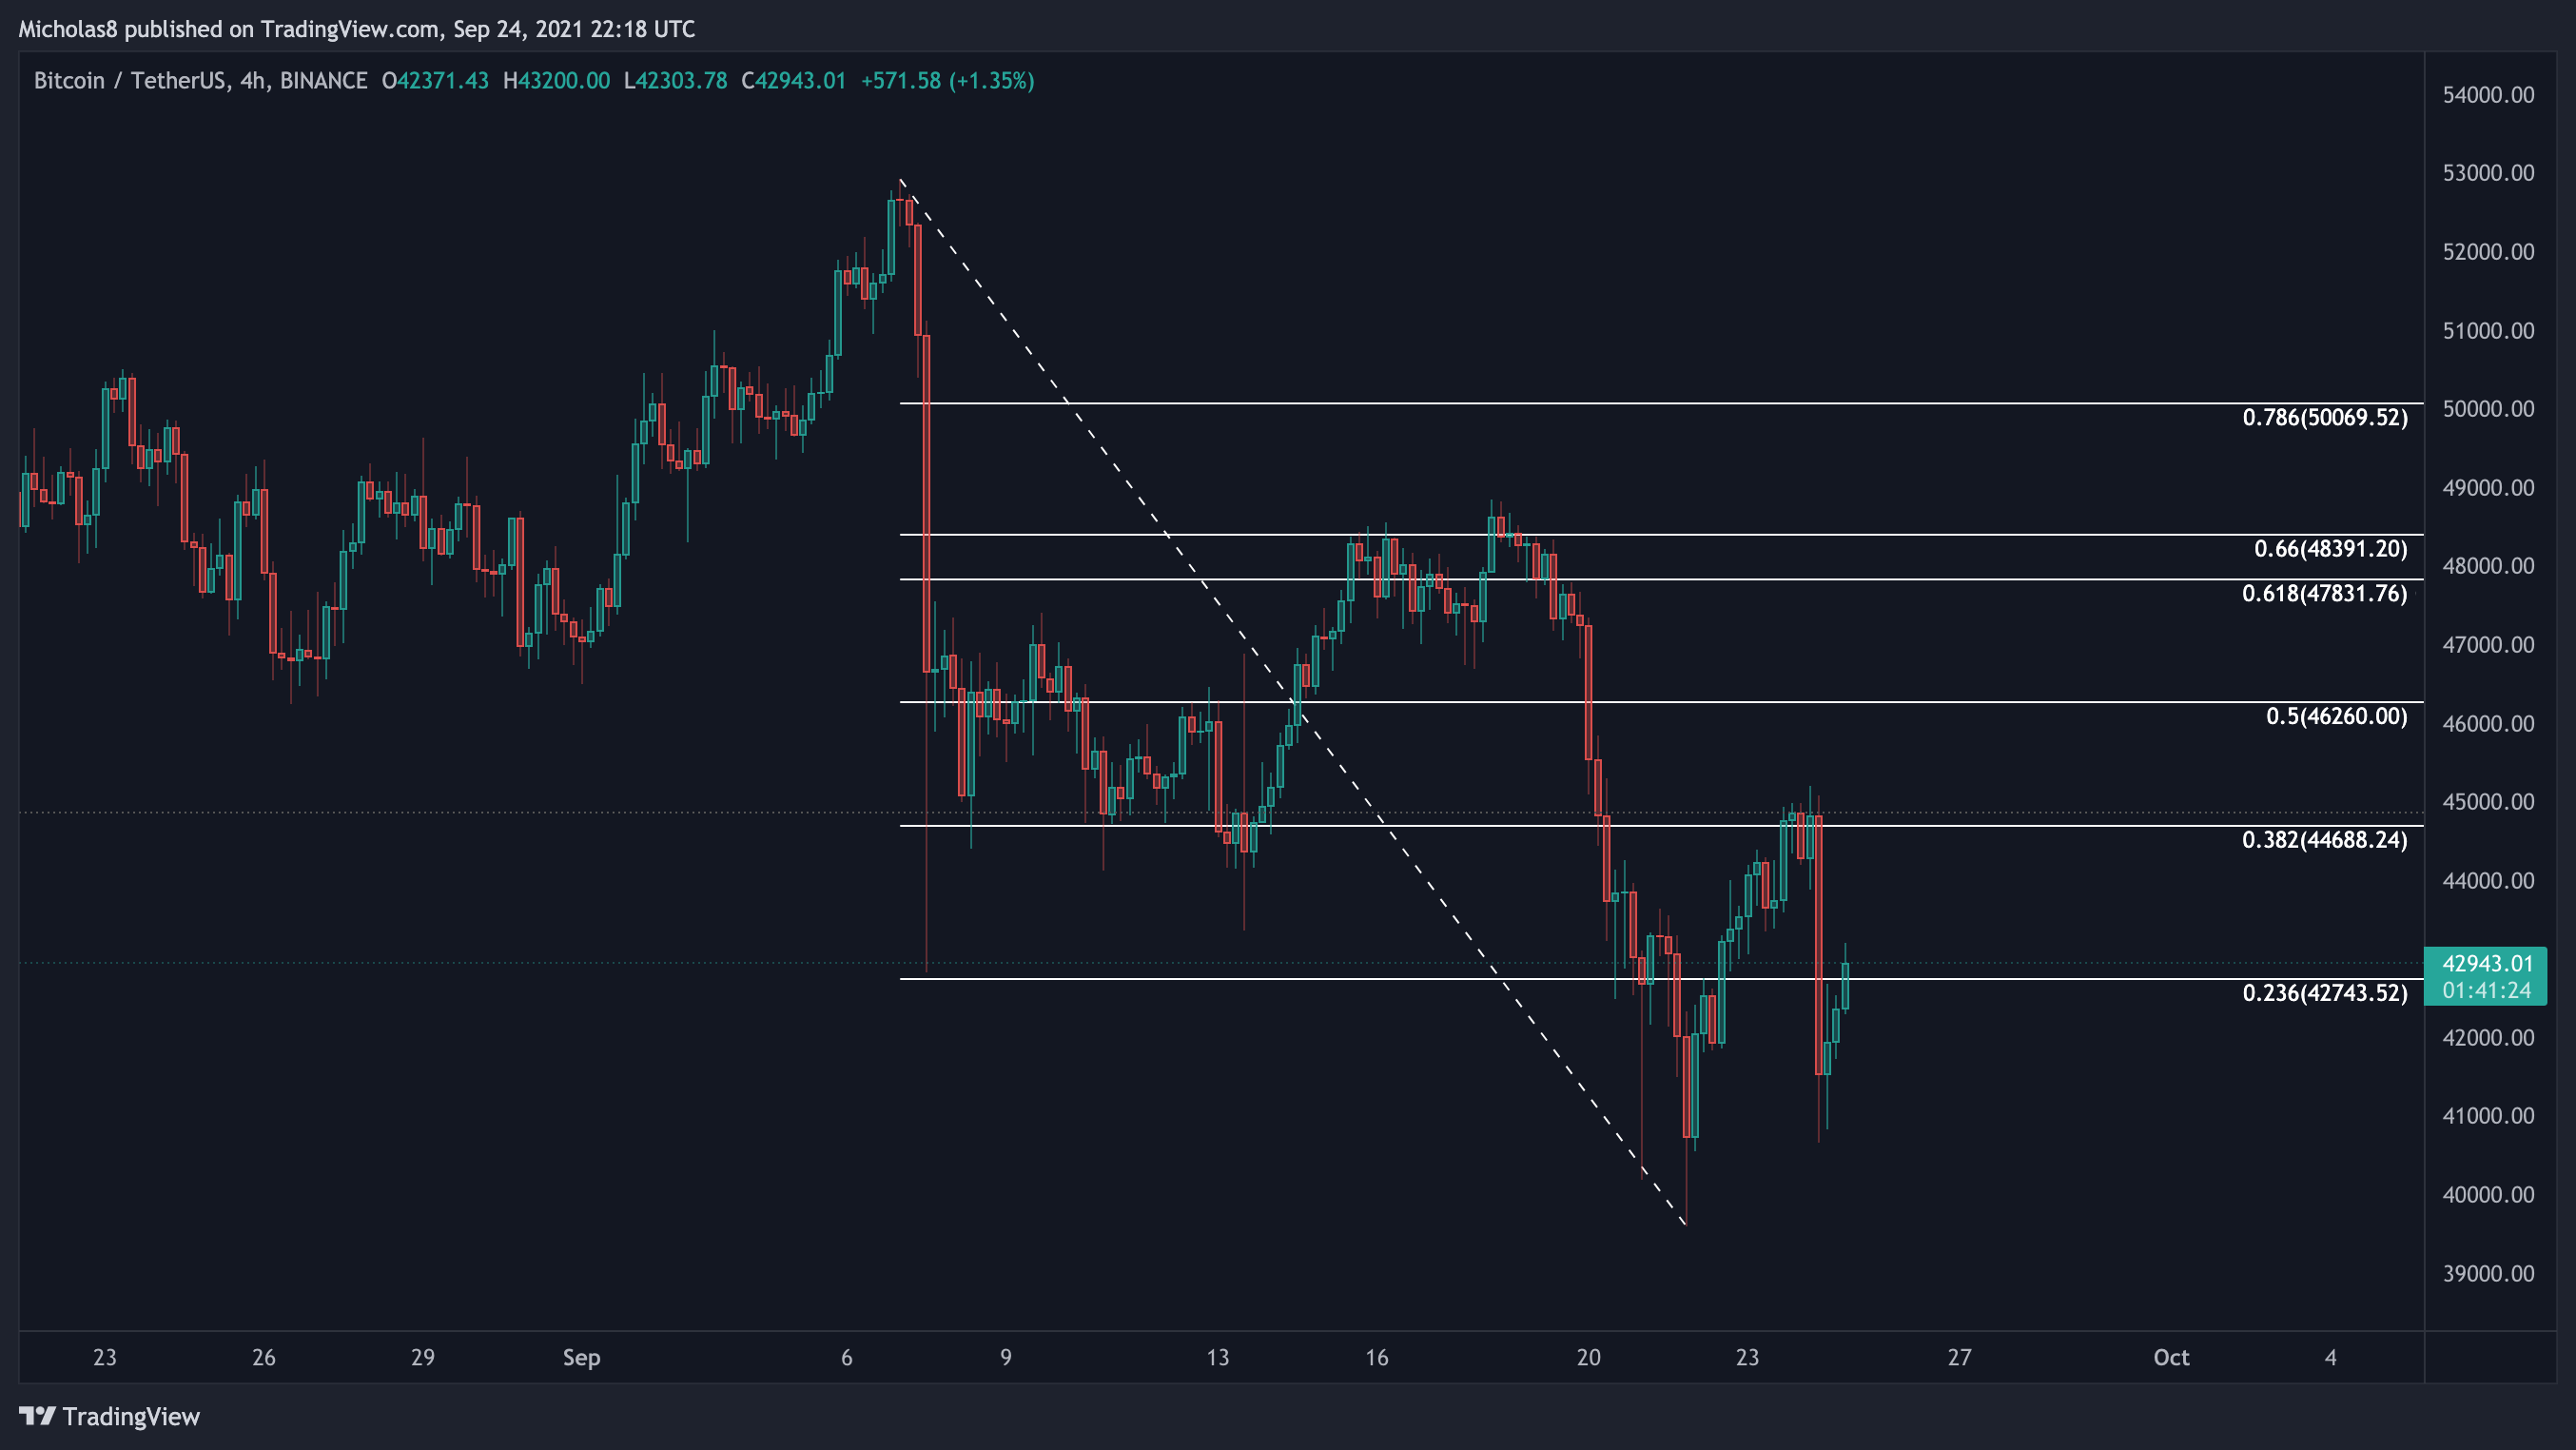
Bearish Fractal
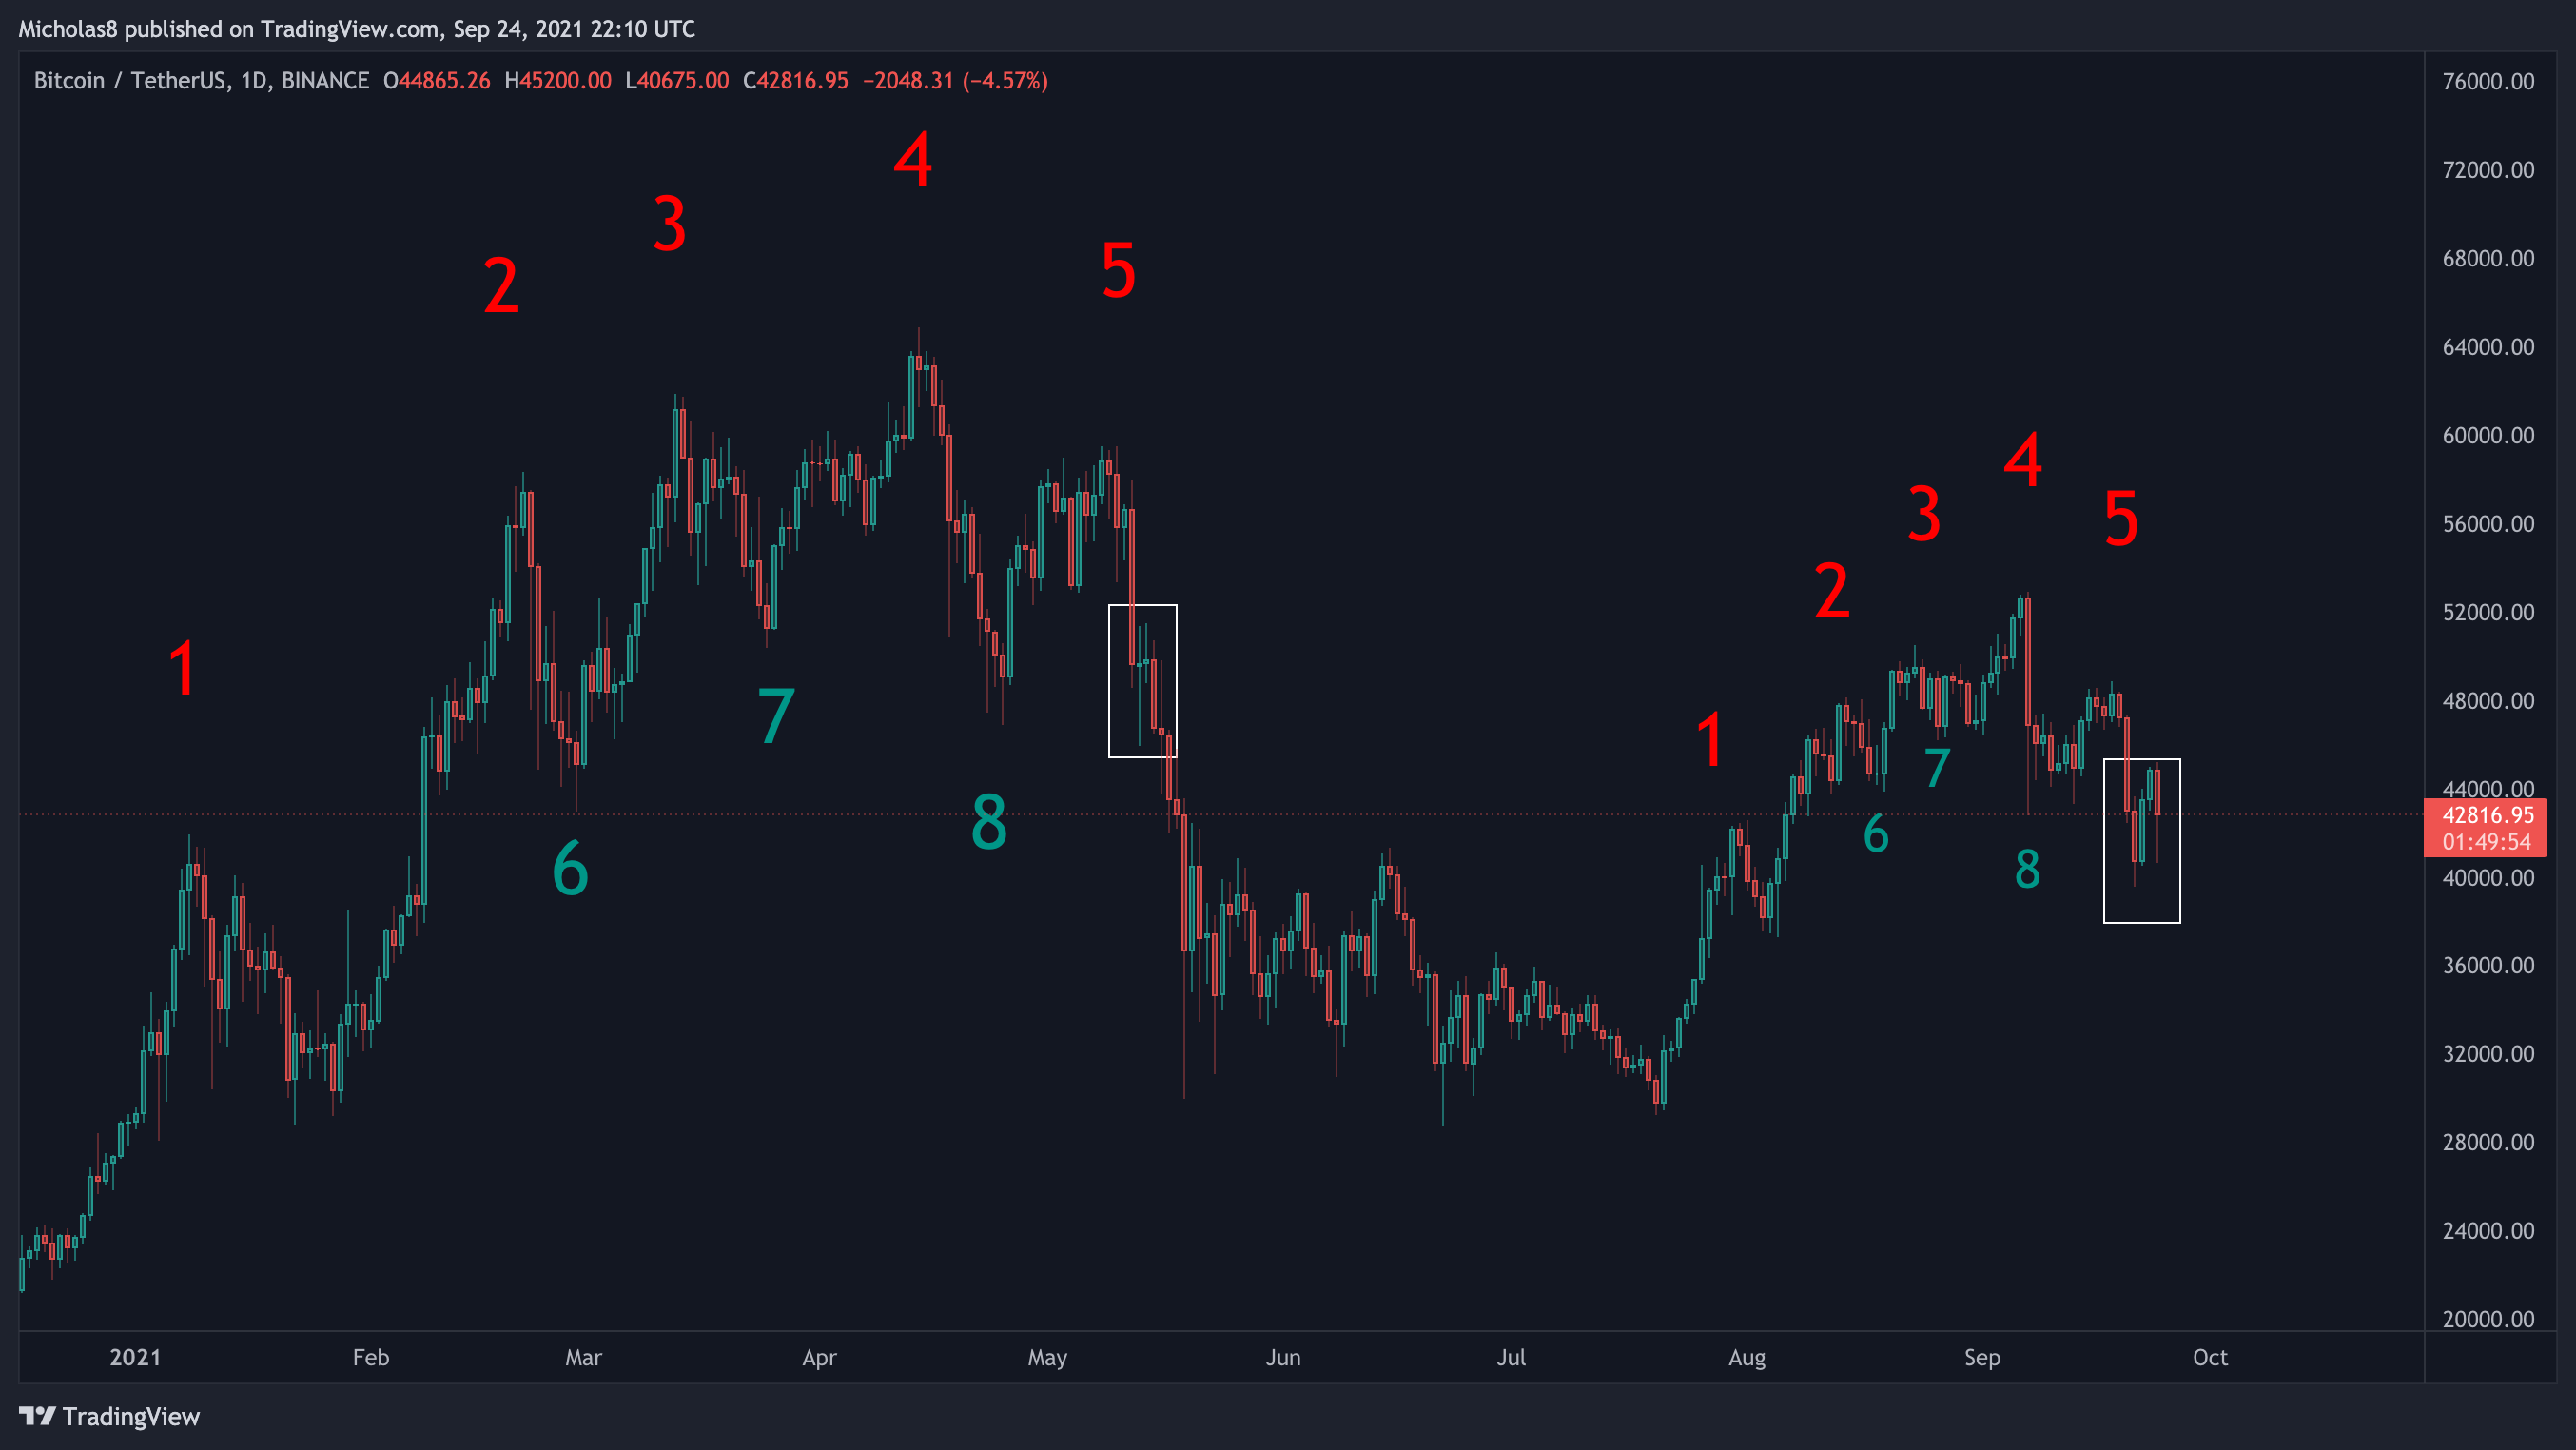
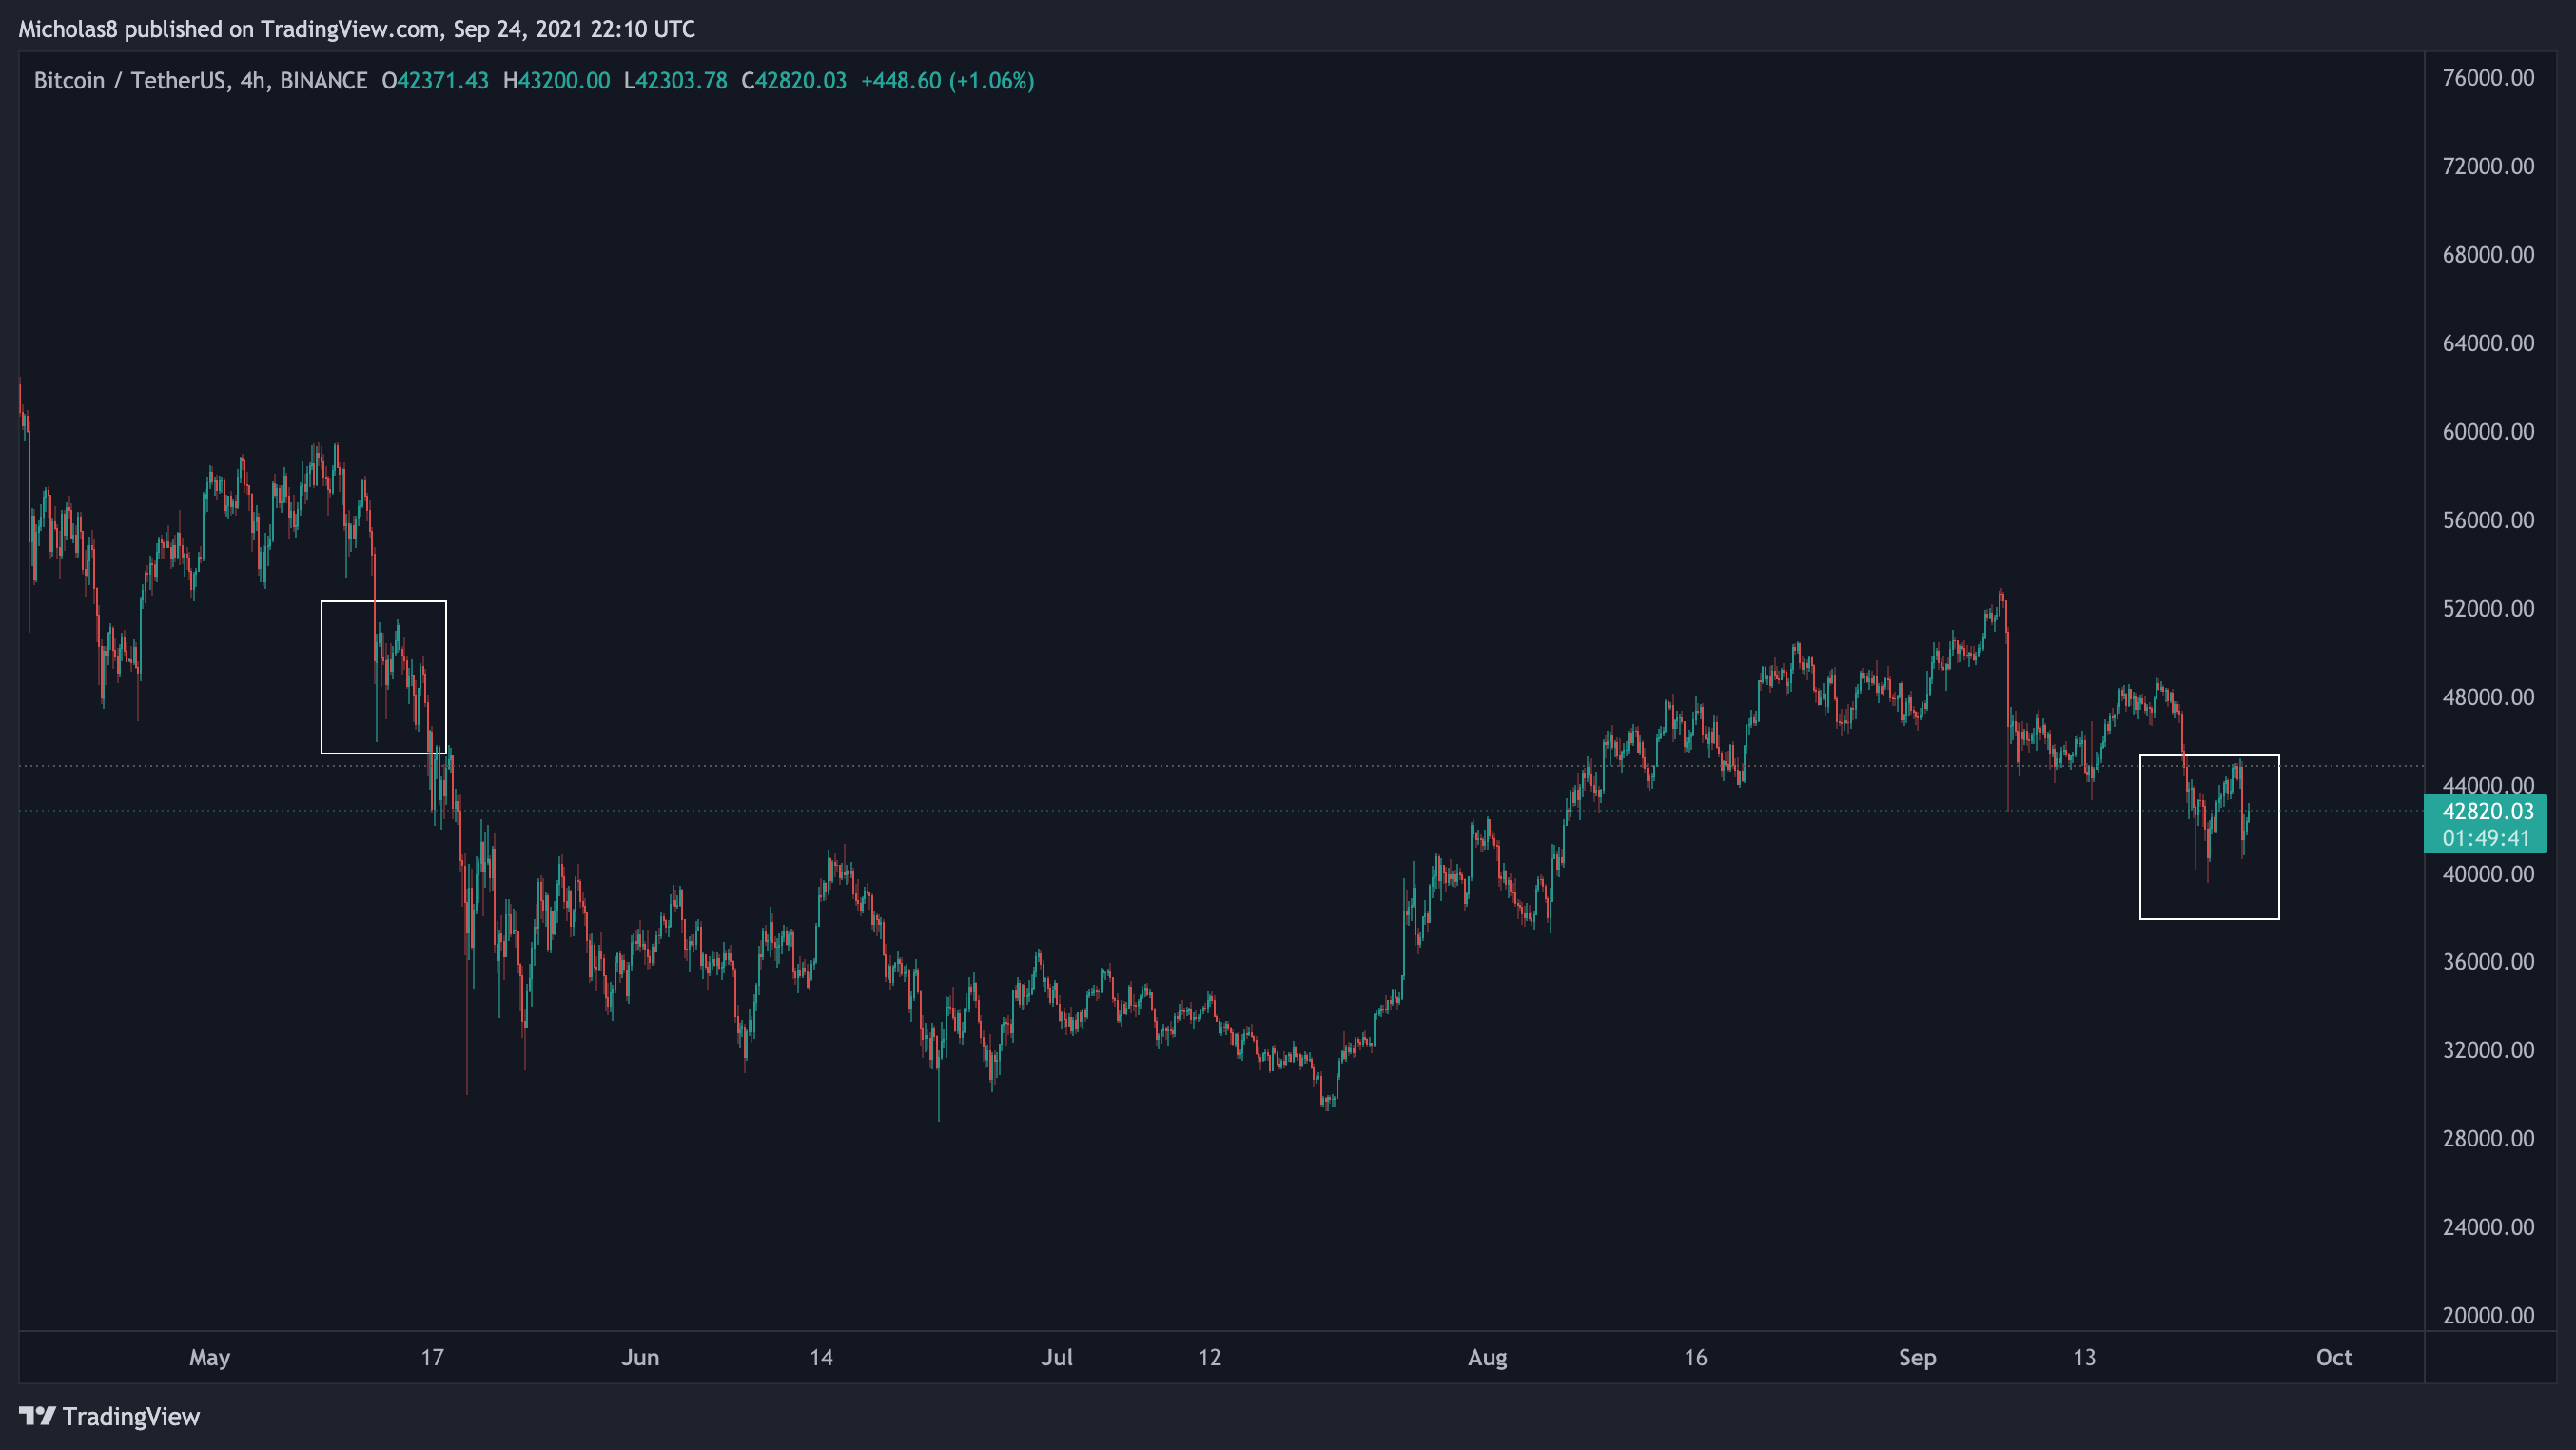
This is the same fractal we have been analyzing over the last few weeks. If you haven't already, please read the Bonus Report on this topic: https://www.buymeacoffee.com/bitcoincharts/is-history-repeating
On the 1D timeframe, inside the rectangle, you can see the PA isn't all that similar. But, if you go down to the 4H timeframe (second image), as this is a much smaller pattern, you can see the similarities.
Key Liquidity Zone (LQZ)
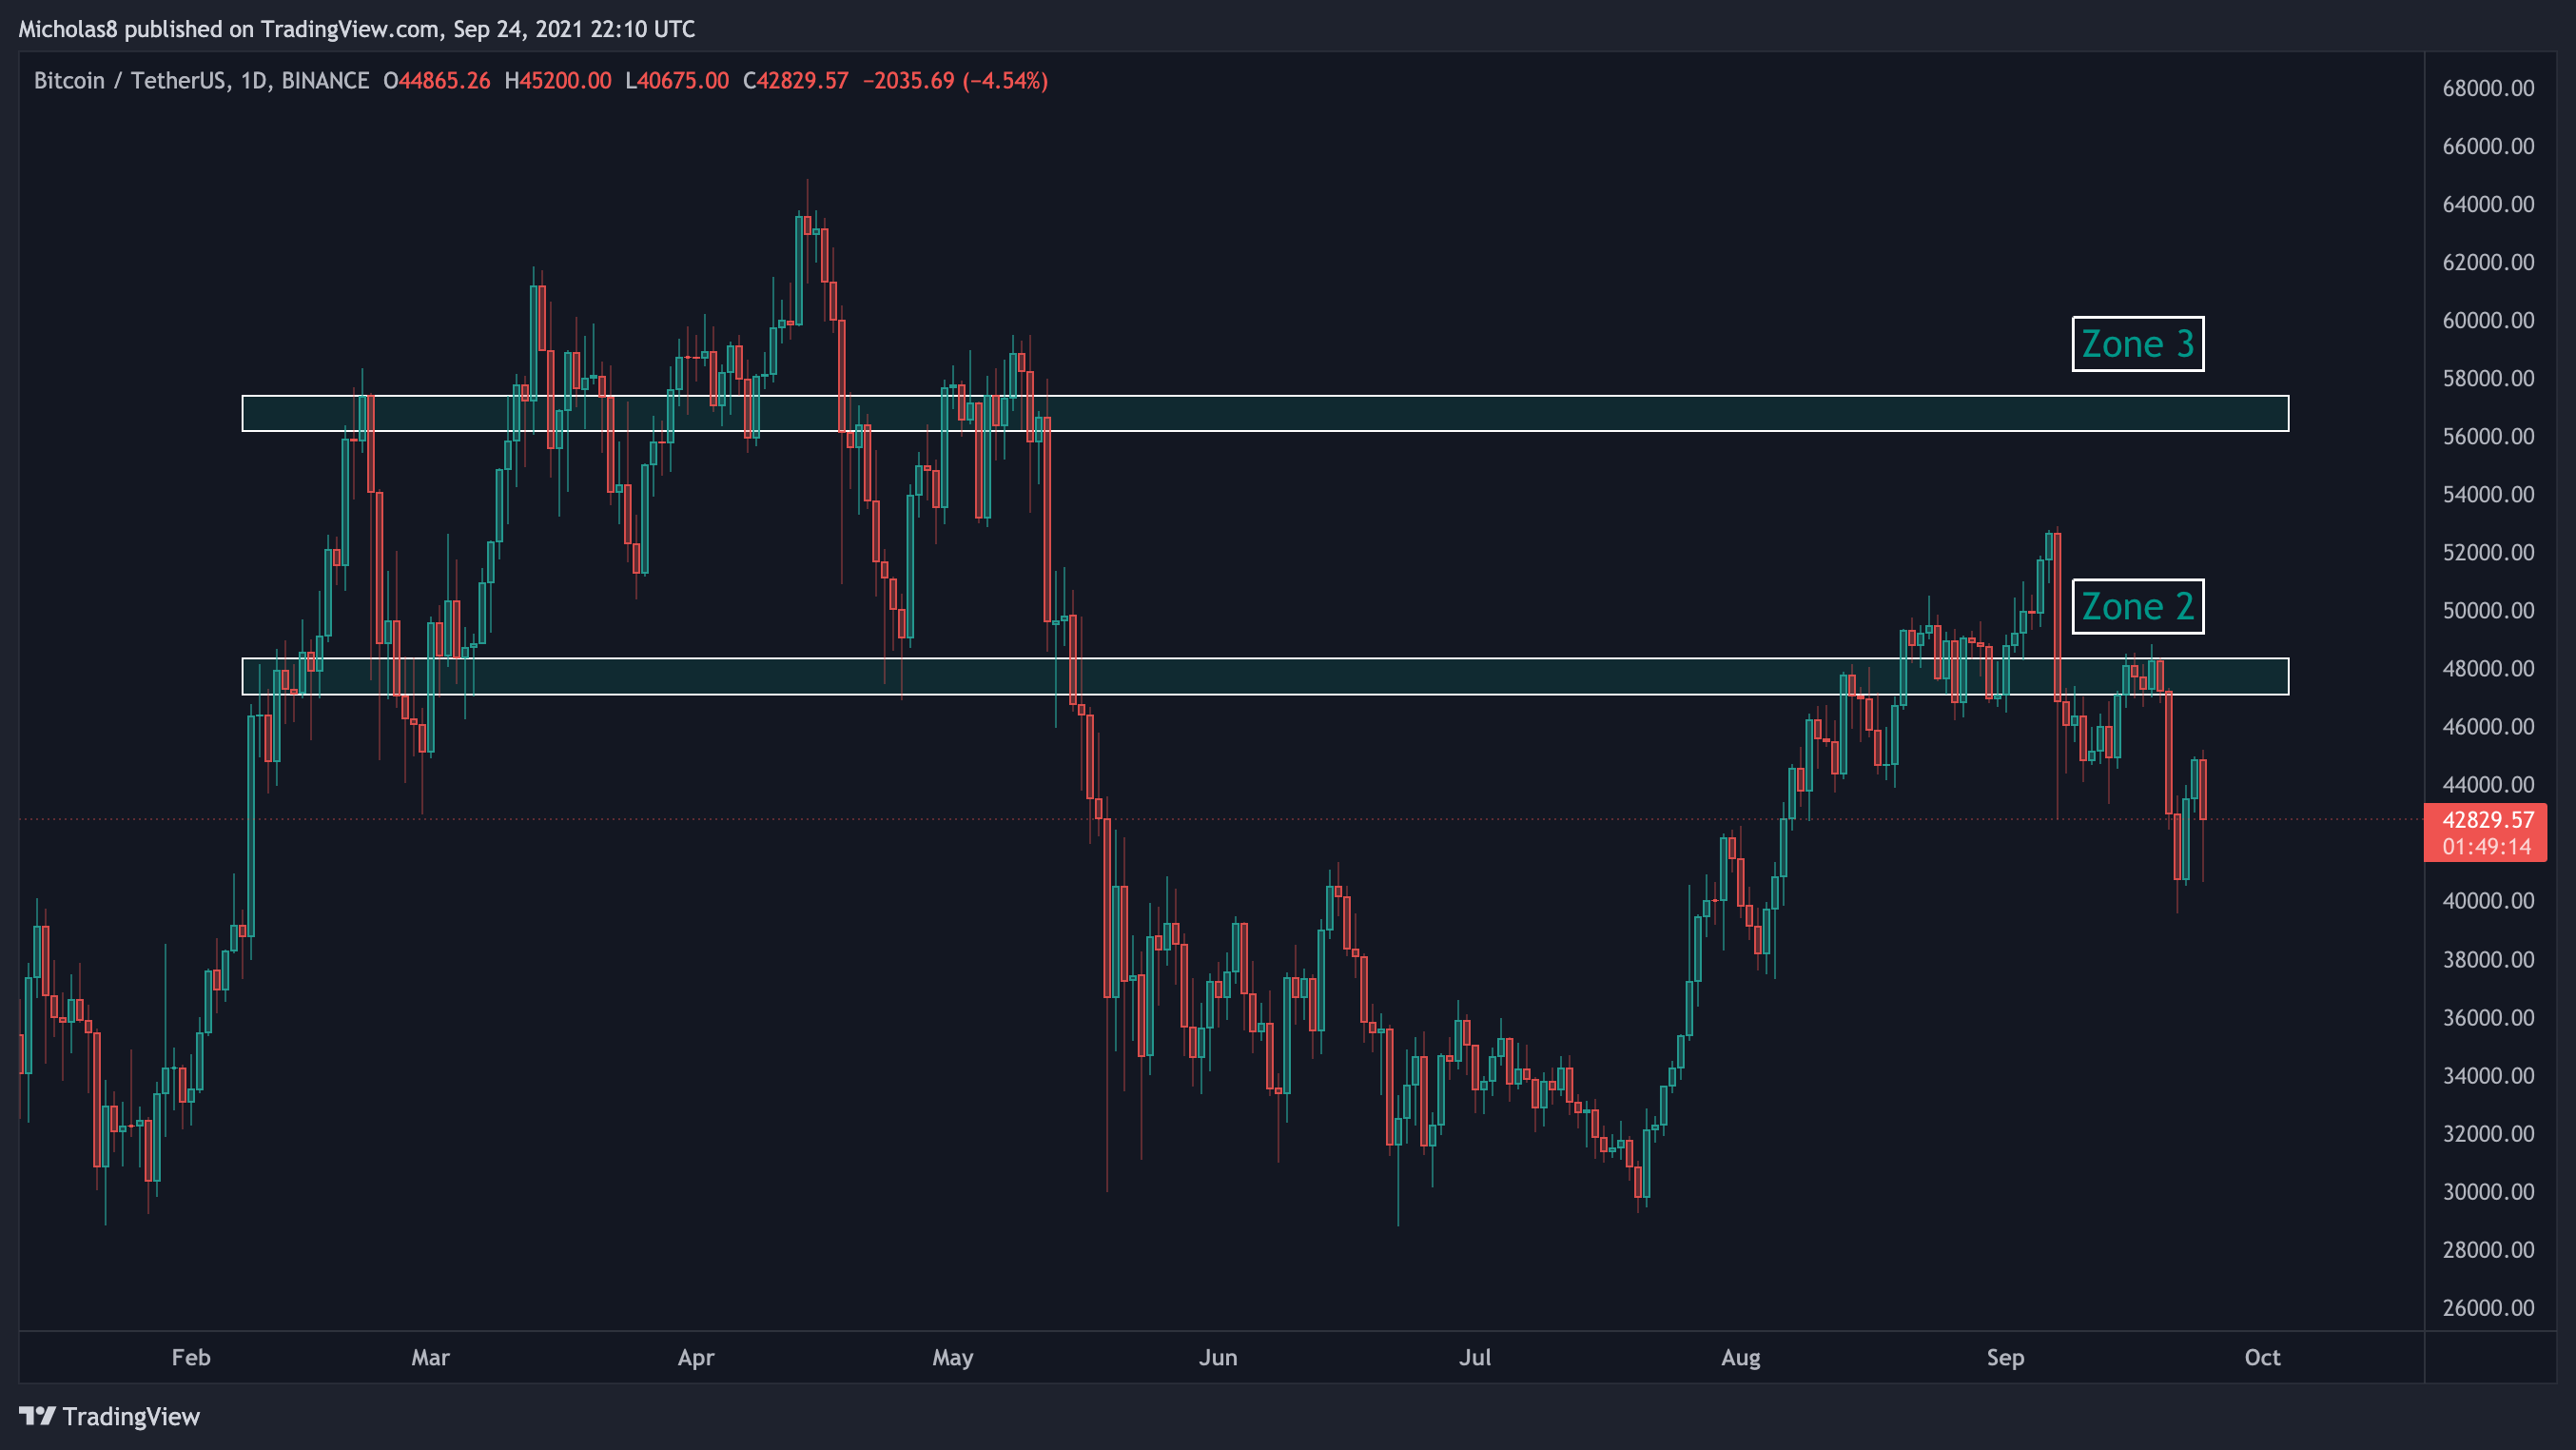
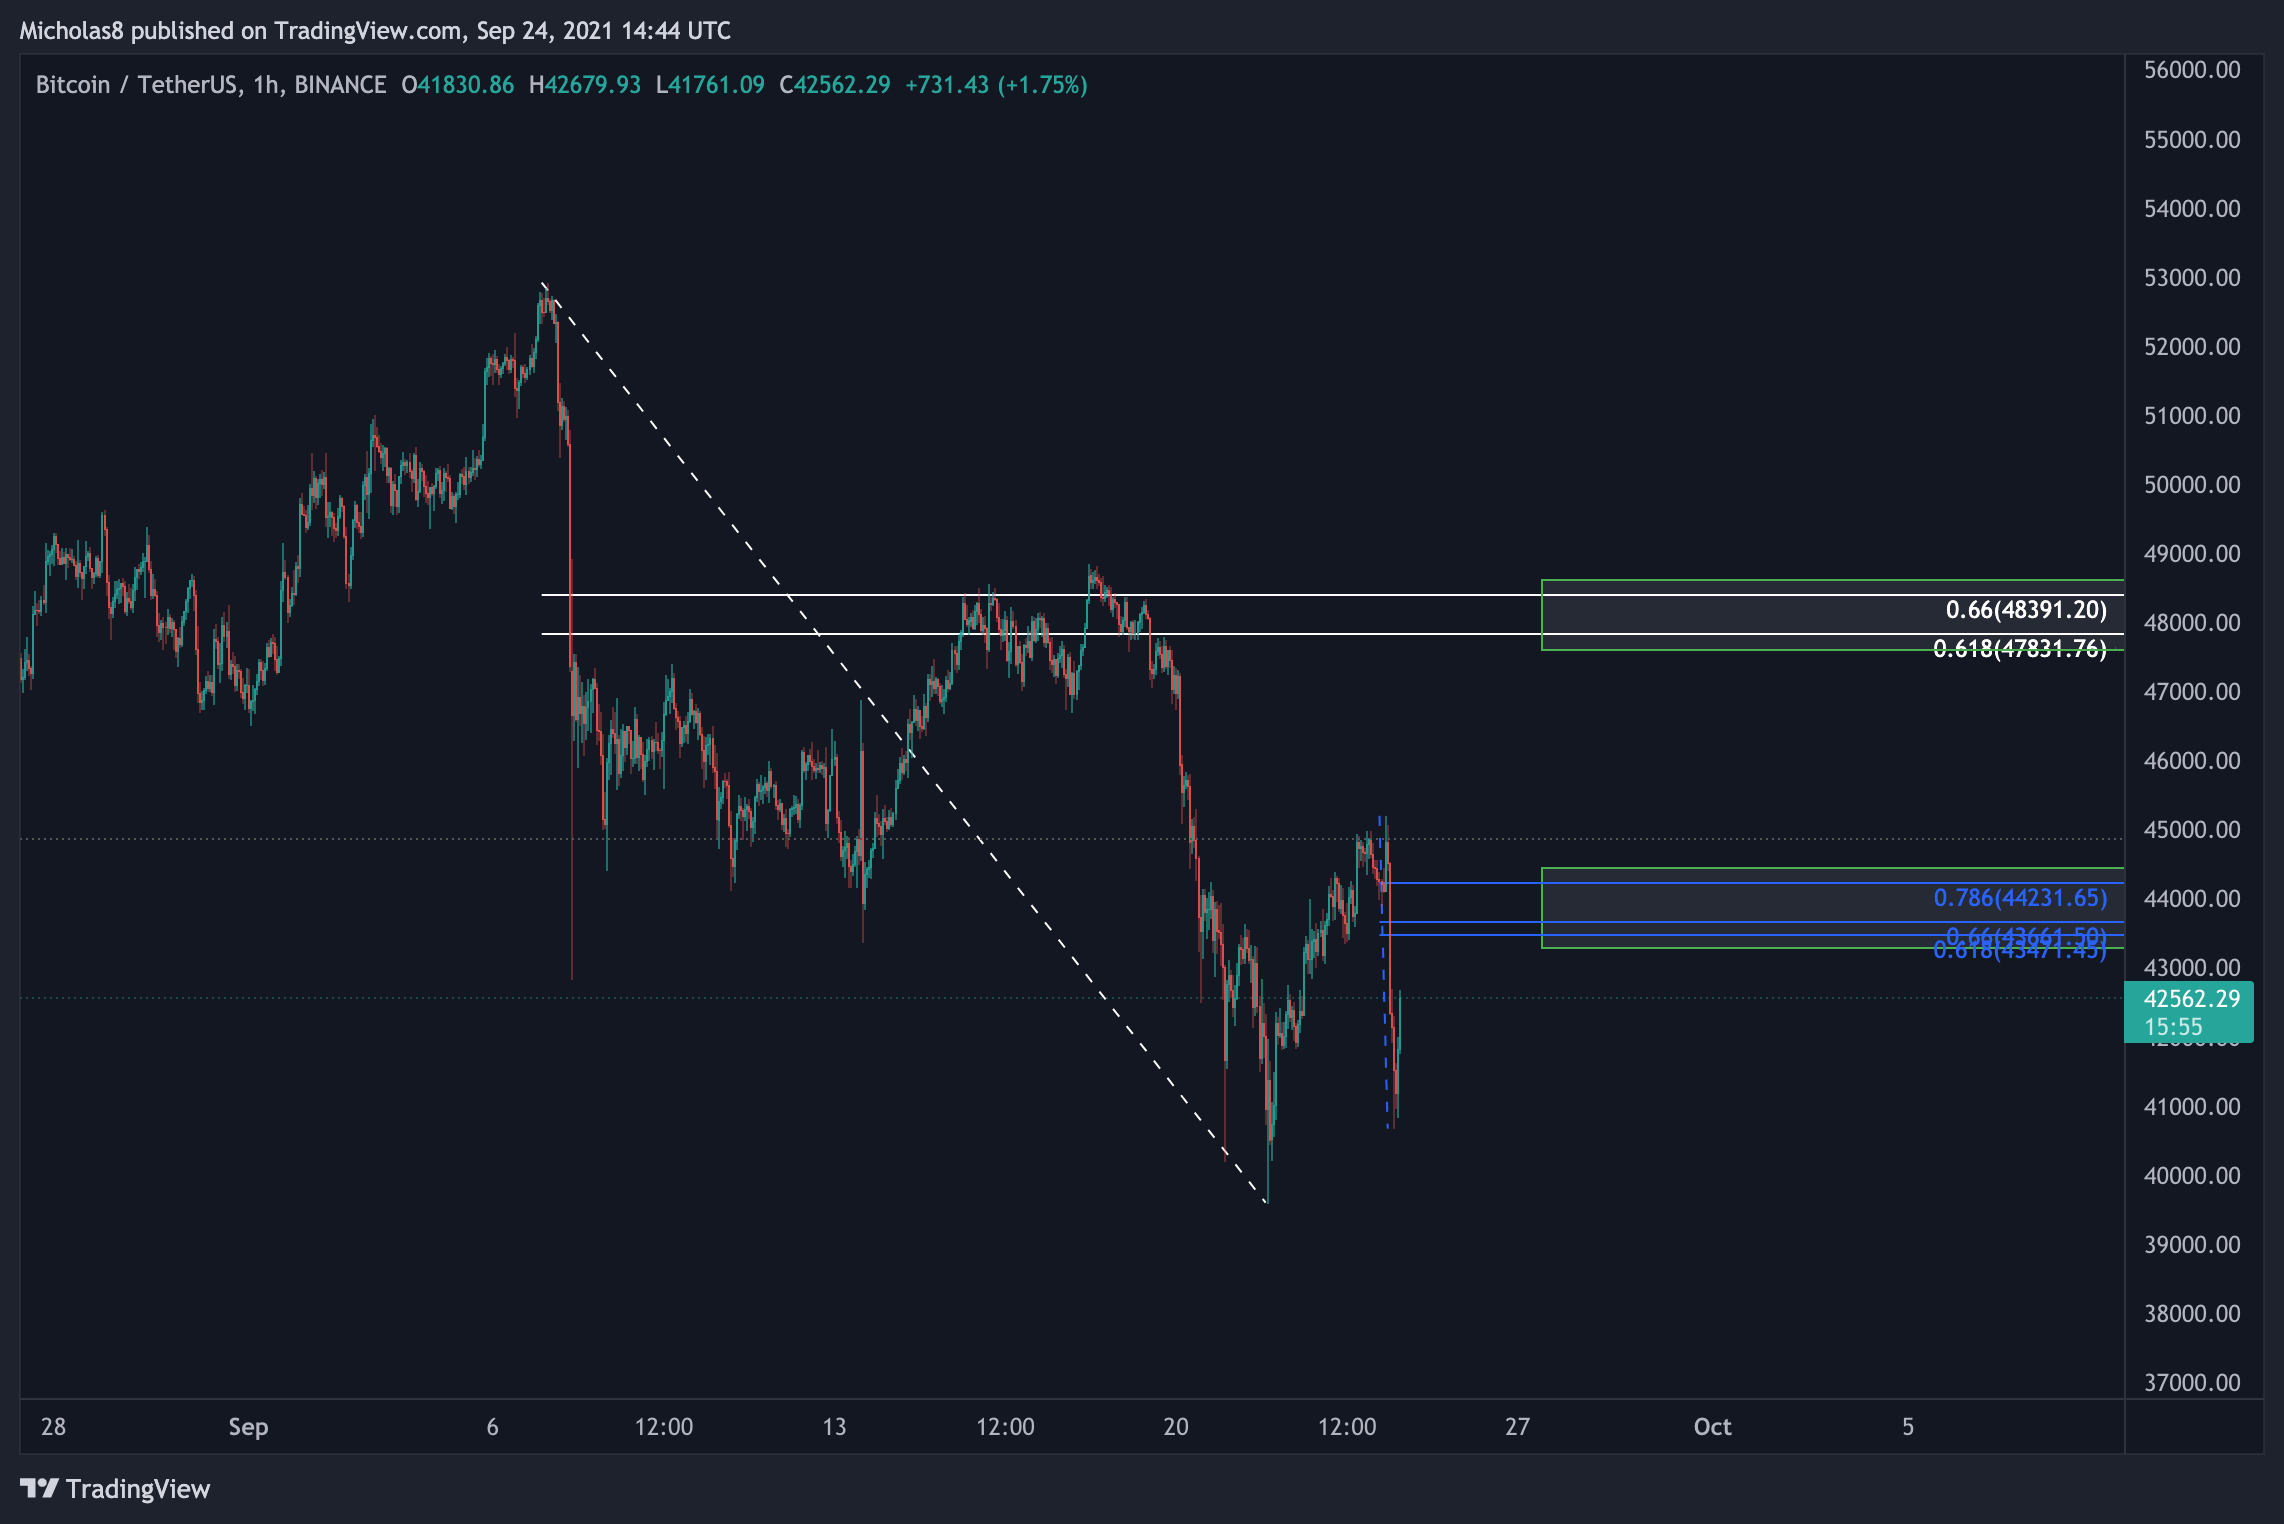
Zone 2: This liquidity has moved down to 47.1k - 48.4k. As the price of Bitcoin was unable to sustain PA above the zone, we can expect it to act as resistance.
Zone 3: The final daily liquidity zone sits at 56.2k-57.4k. If we are to break through 50k again, this is the next MAJOR liquidity zone that will likely act as strong resistance.
Network Value to Transaction (NVT)
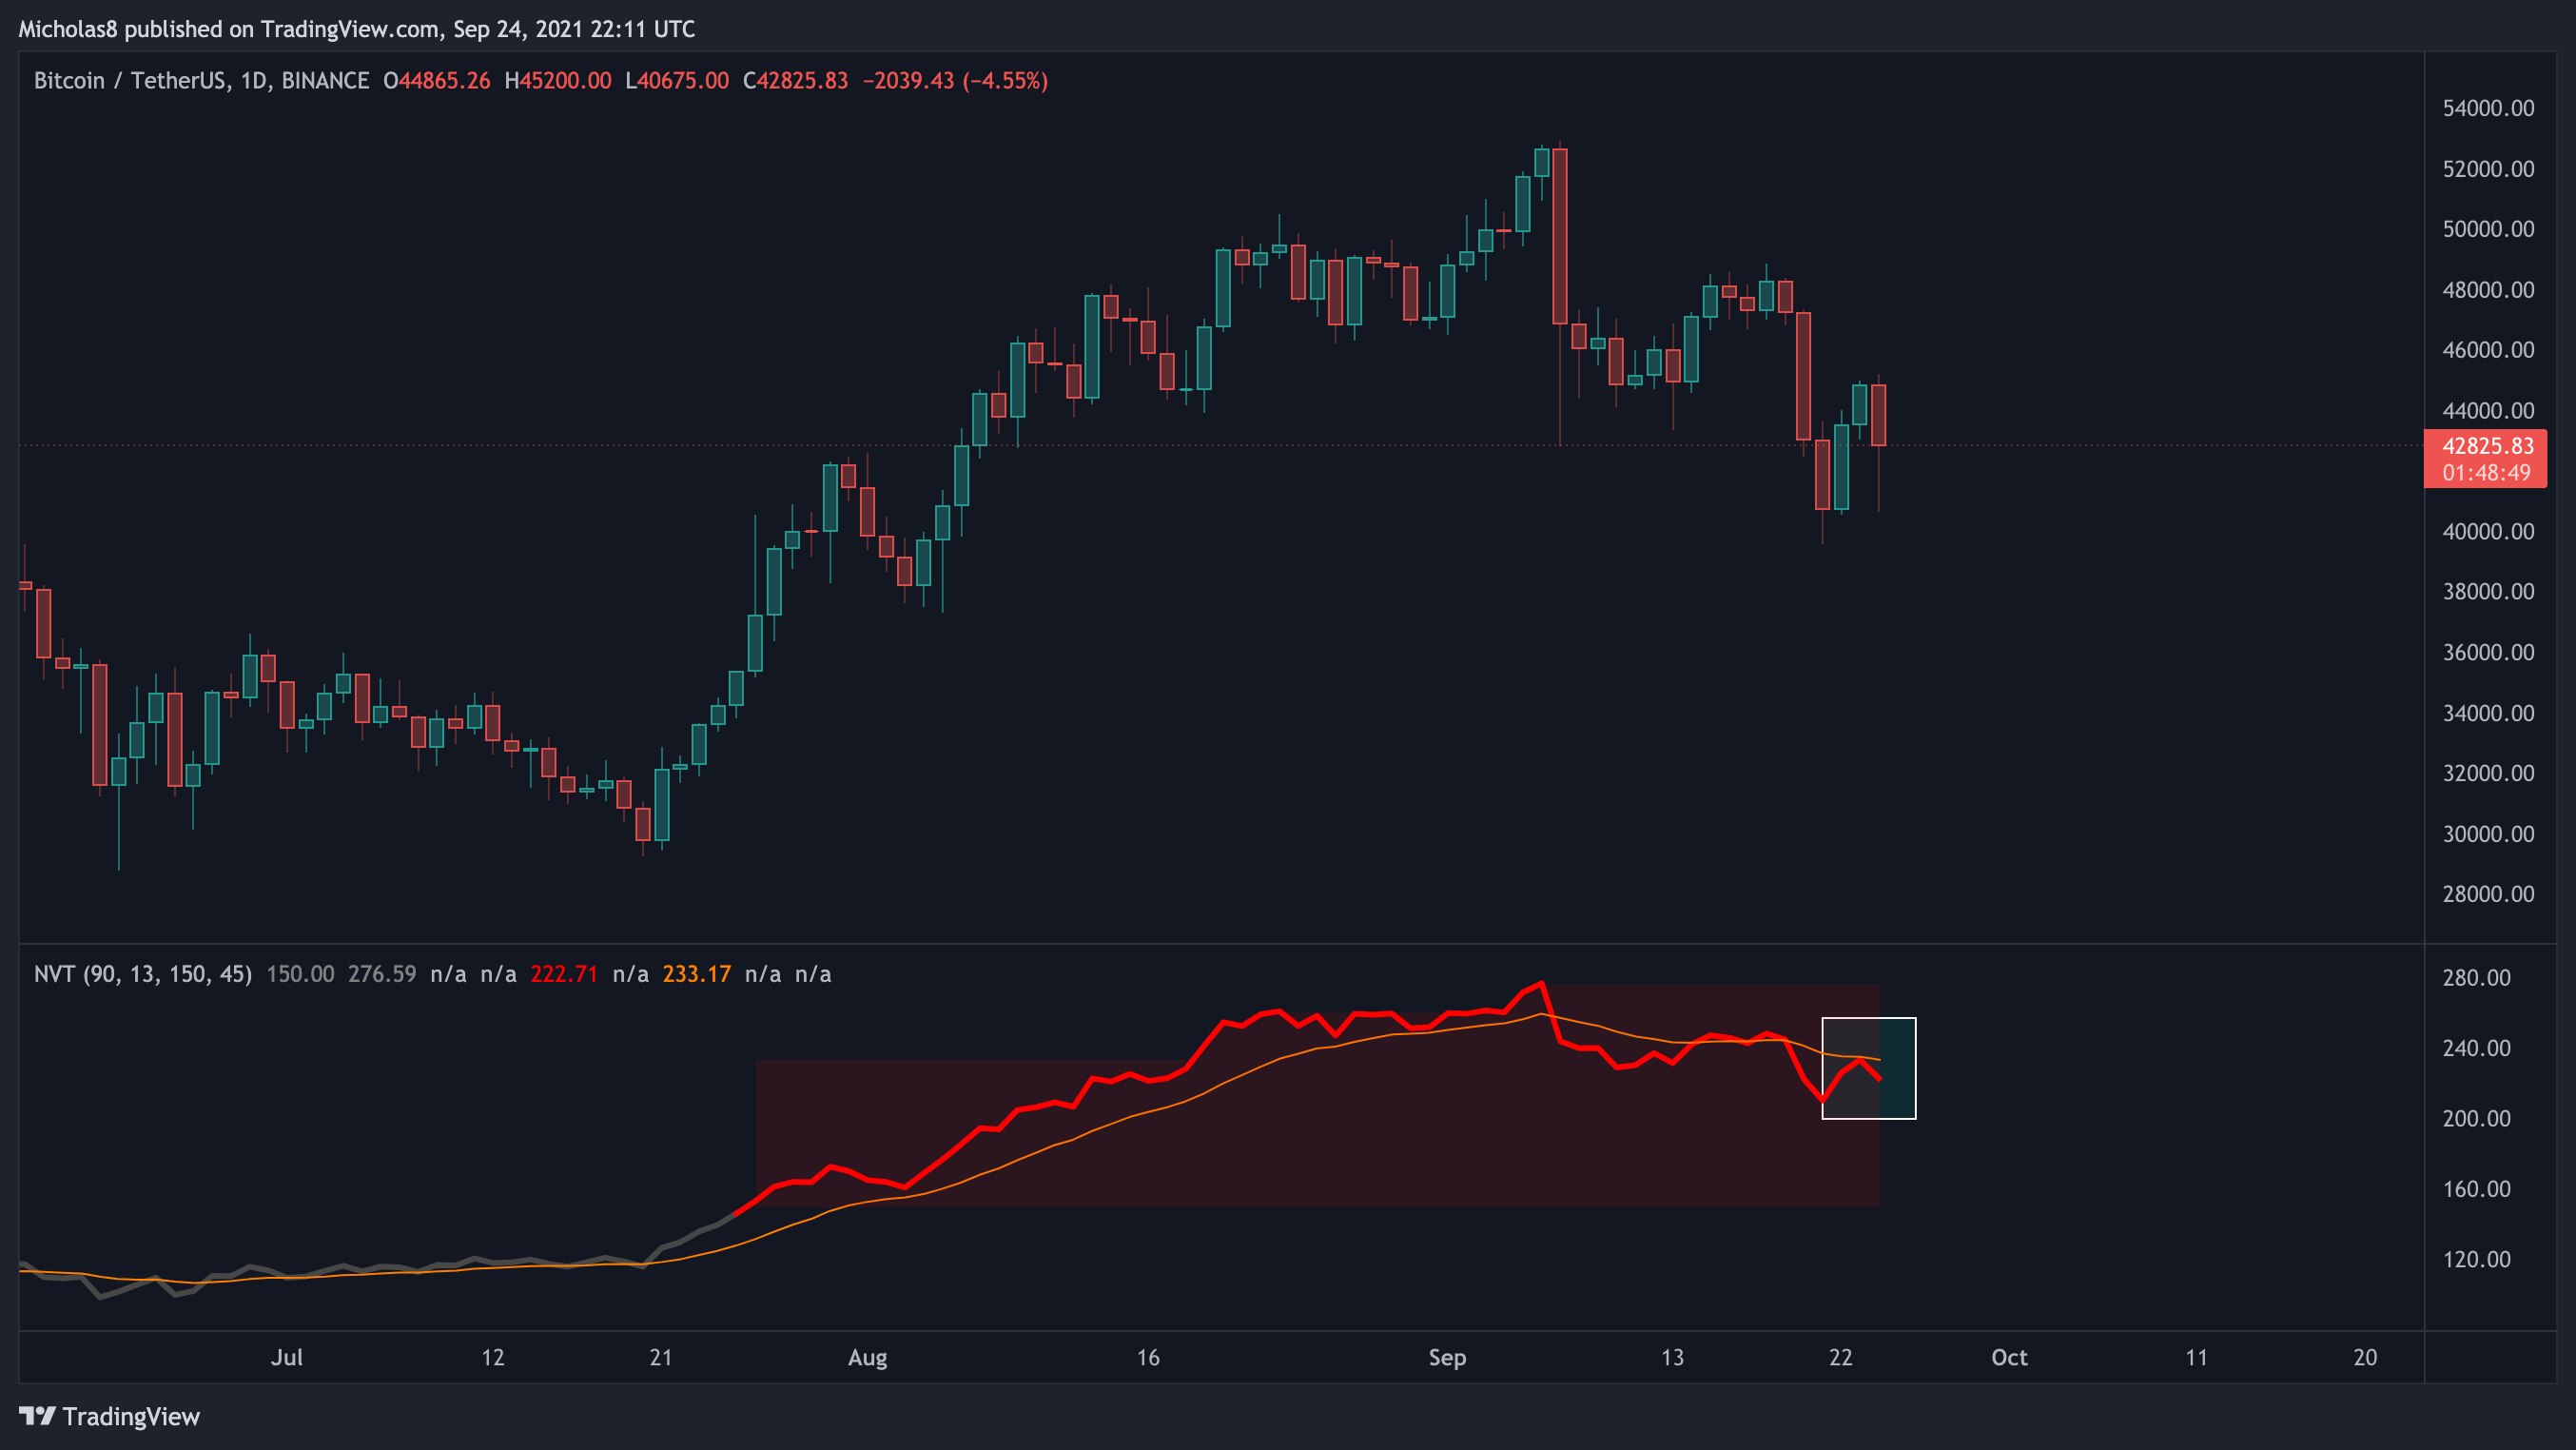
*This indicator describes the relationship between market cap and transfer volumes.
Bitcoin has fallen below the NVT Signal line, initiating a mega dump. It is now more likely we see a continuation in the coming days/weeks. I will keep an eye out here for potential rejection or reclaim of support.
NEW: We did indeed see a rejection from the NVT signal line, implying we may have more room to go to the downside.
Directional Movement Index (DMI)
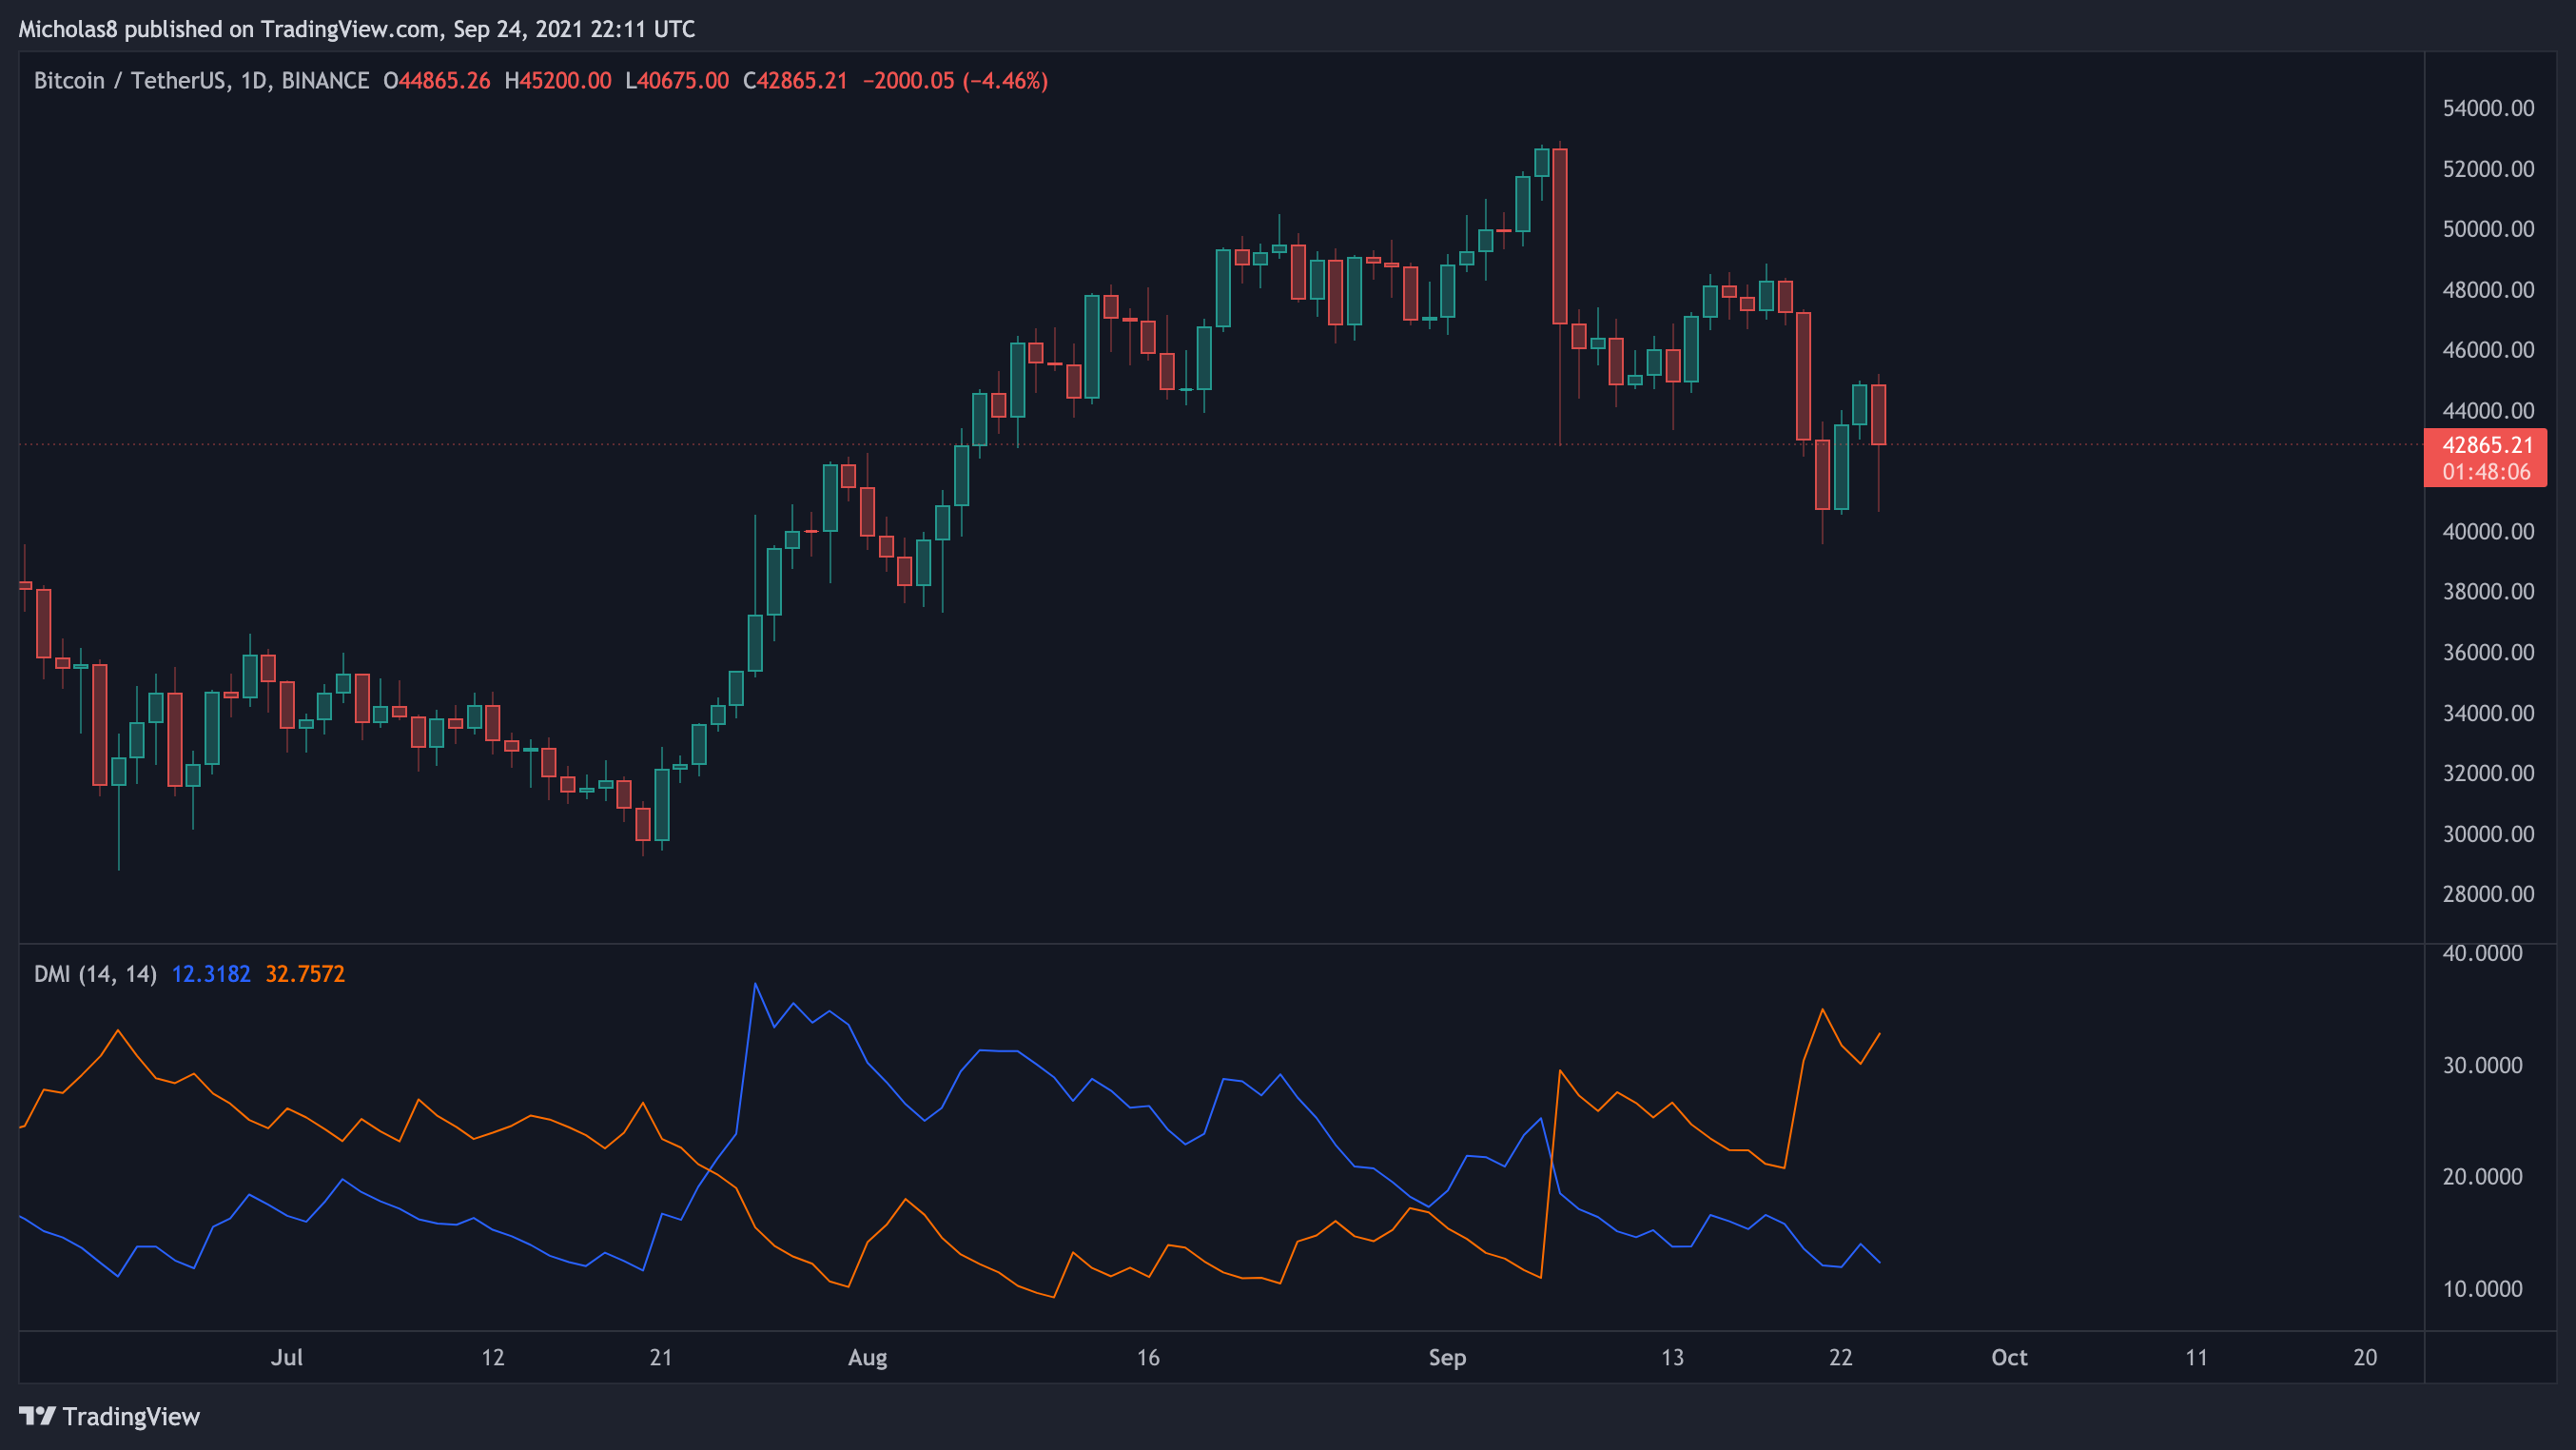
*This is another momentum indicator.
Generally speaking, when the blue line (bullish) crosses below the orange line (bearish), it signals a potential shift in momentum.
Exponential Moving Averages (EMA): 8, 21 and 50
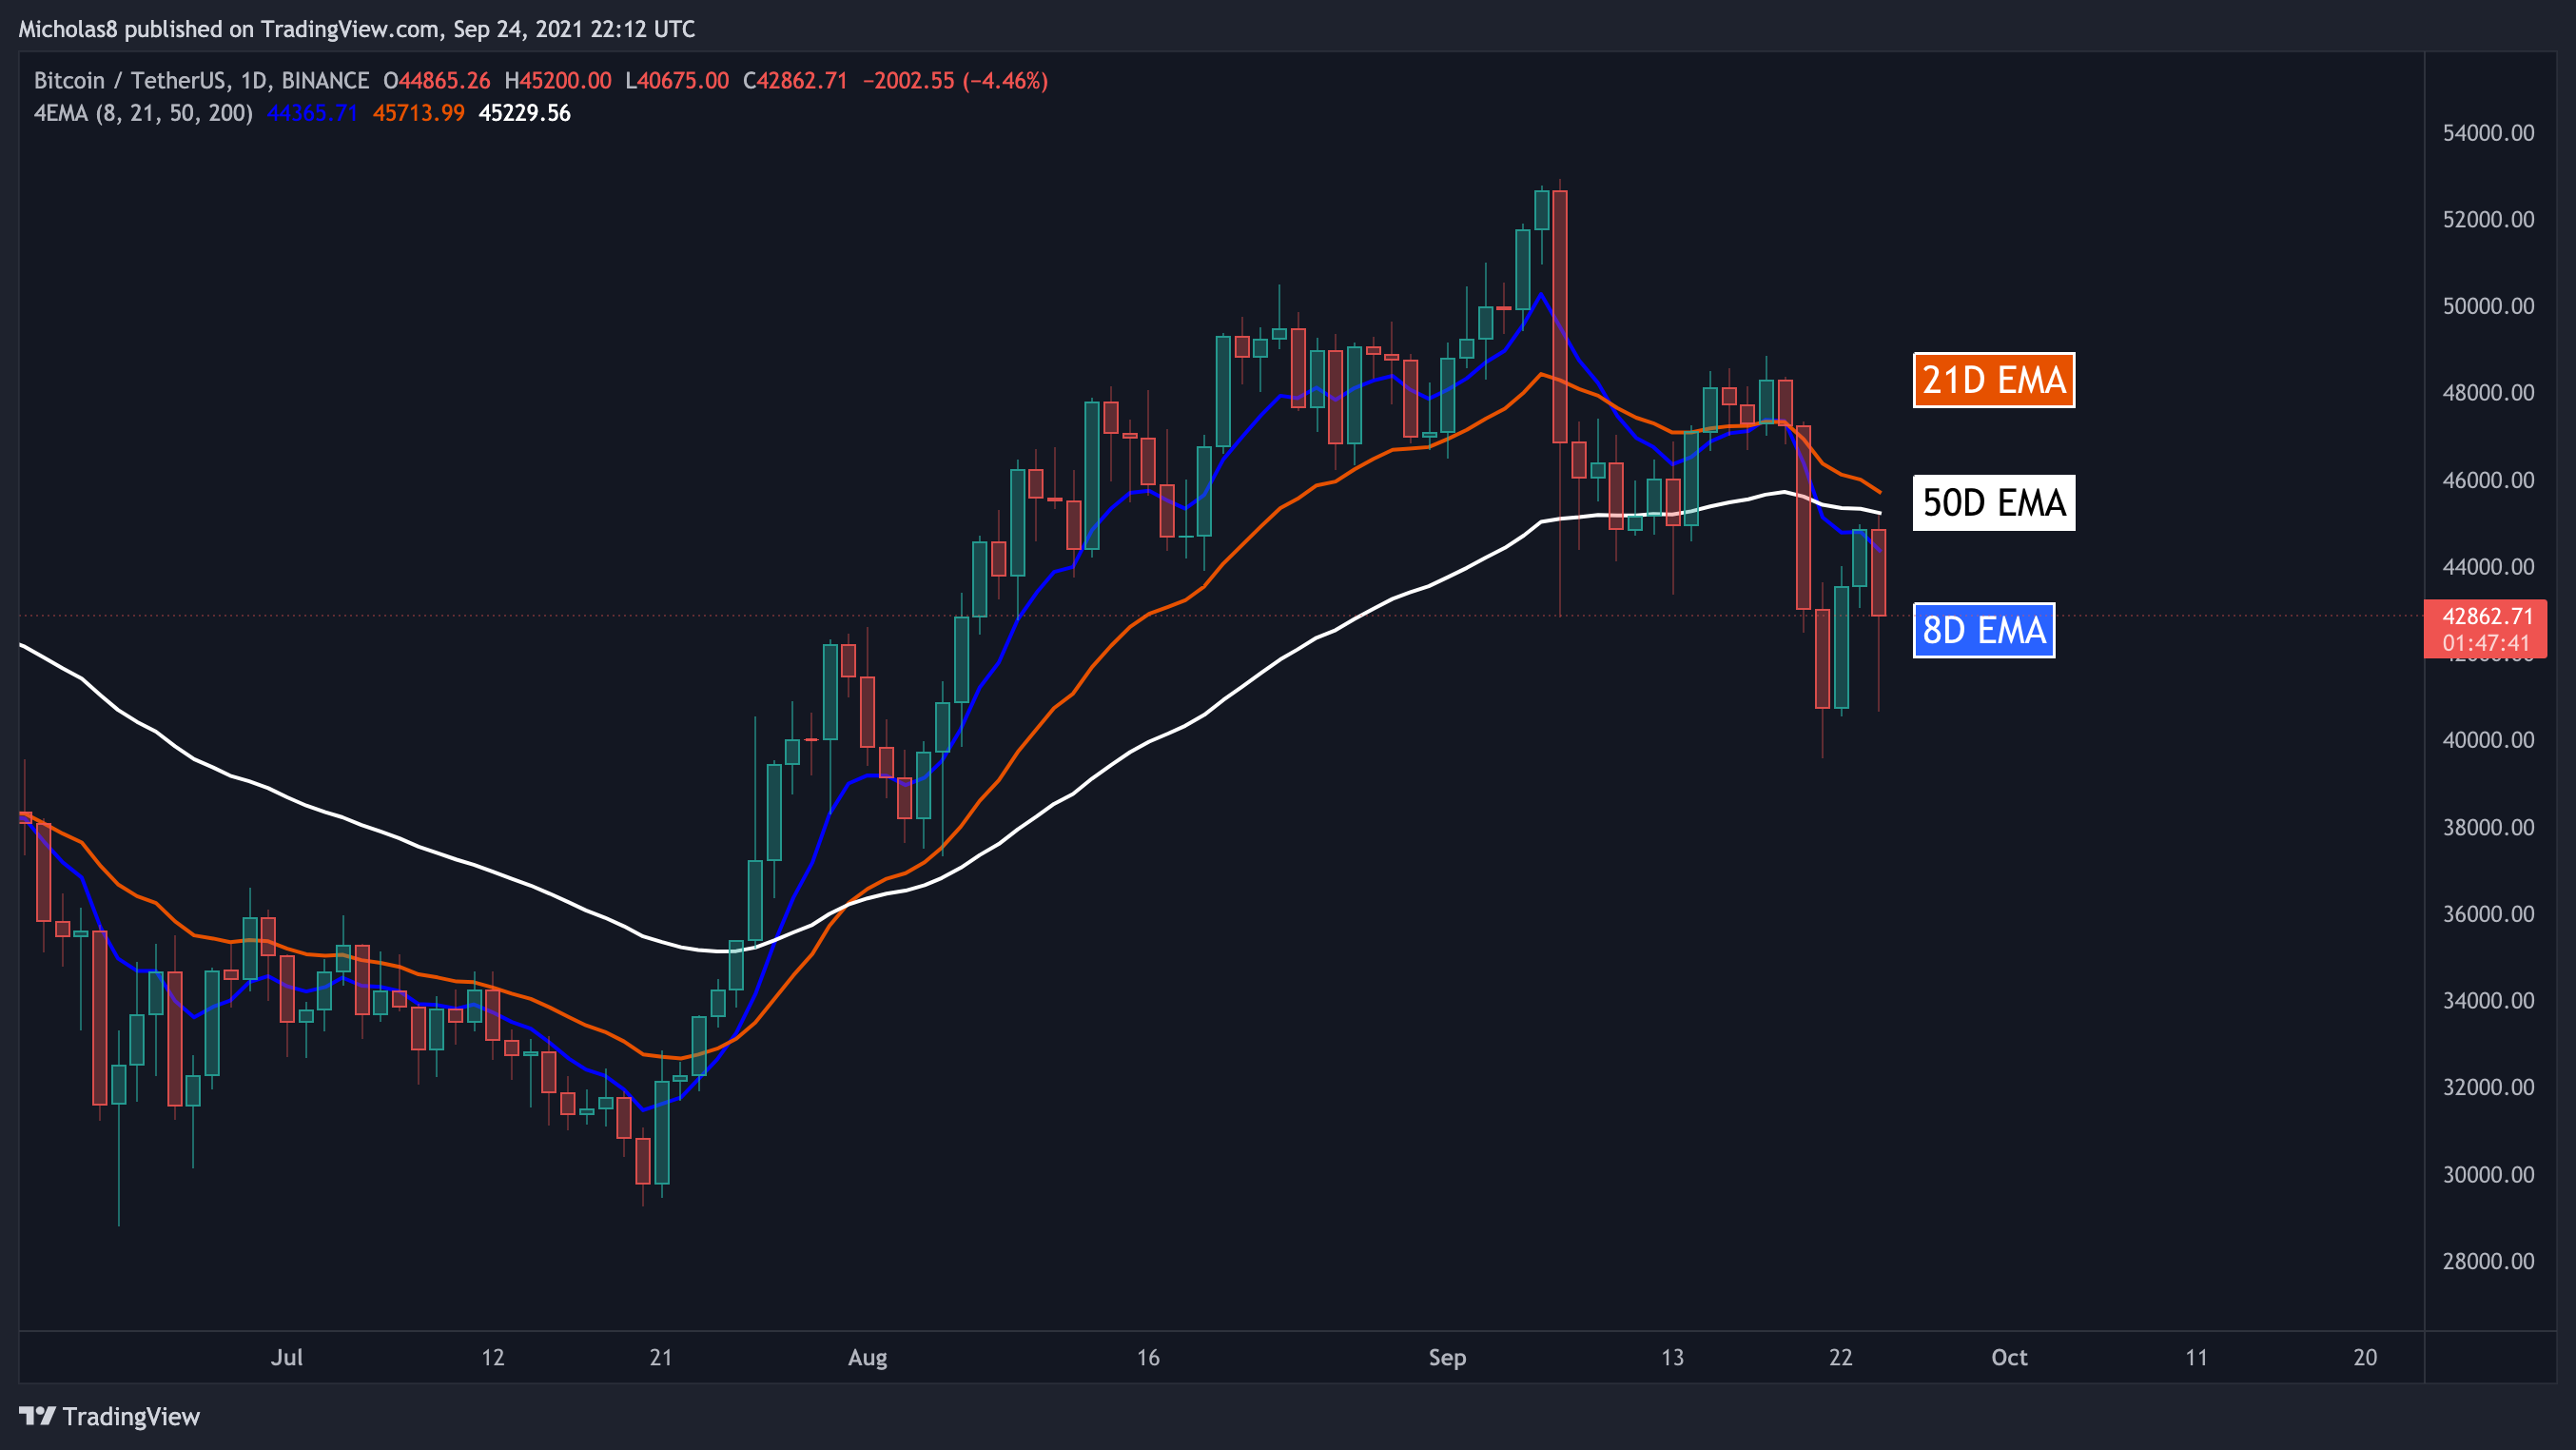
Bitcoin continues to trade below each of these EMAs as the 8-day seems to be now.
Implication: They may serve as a level of resistance.
EMA Ribbon
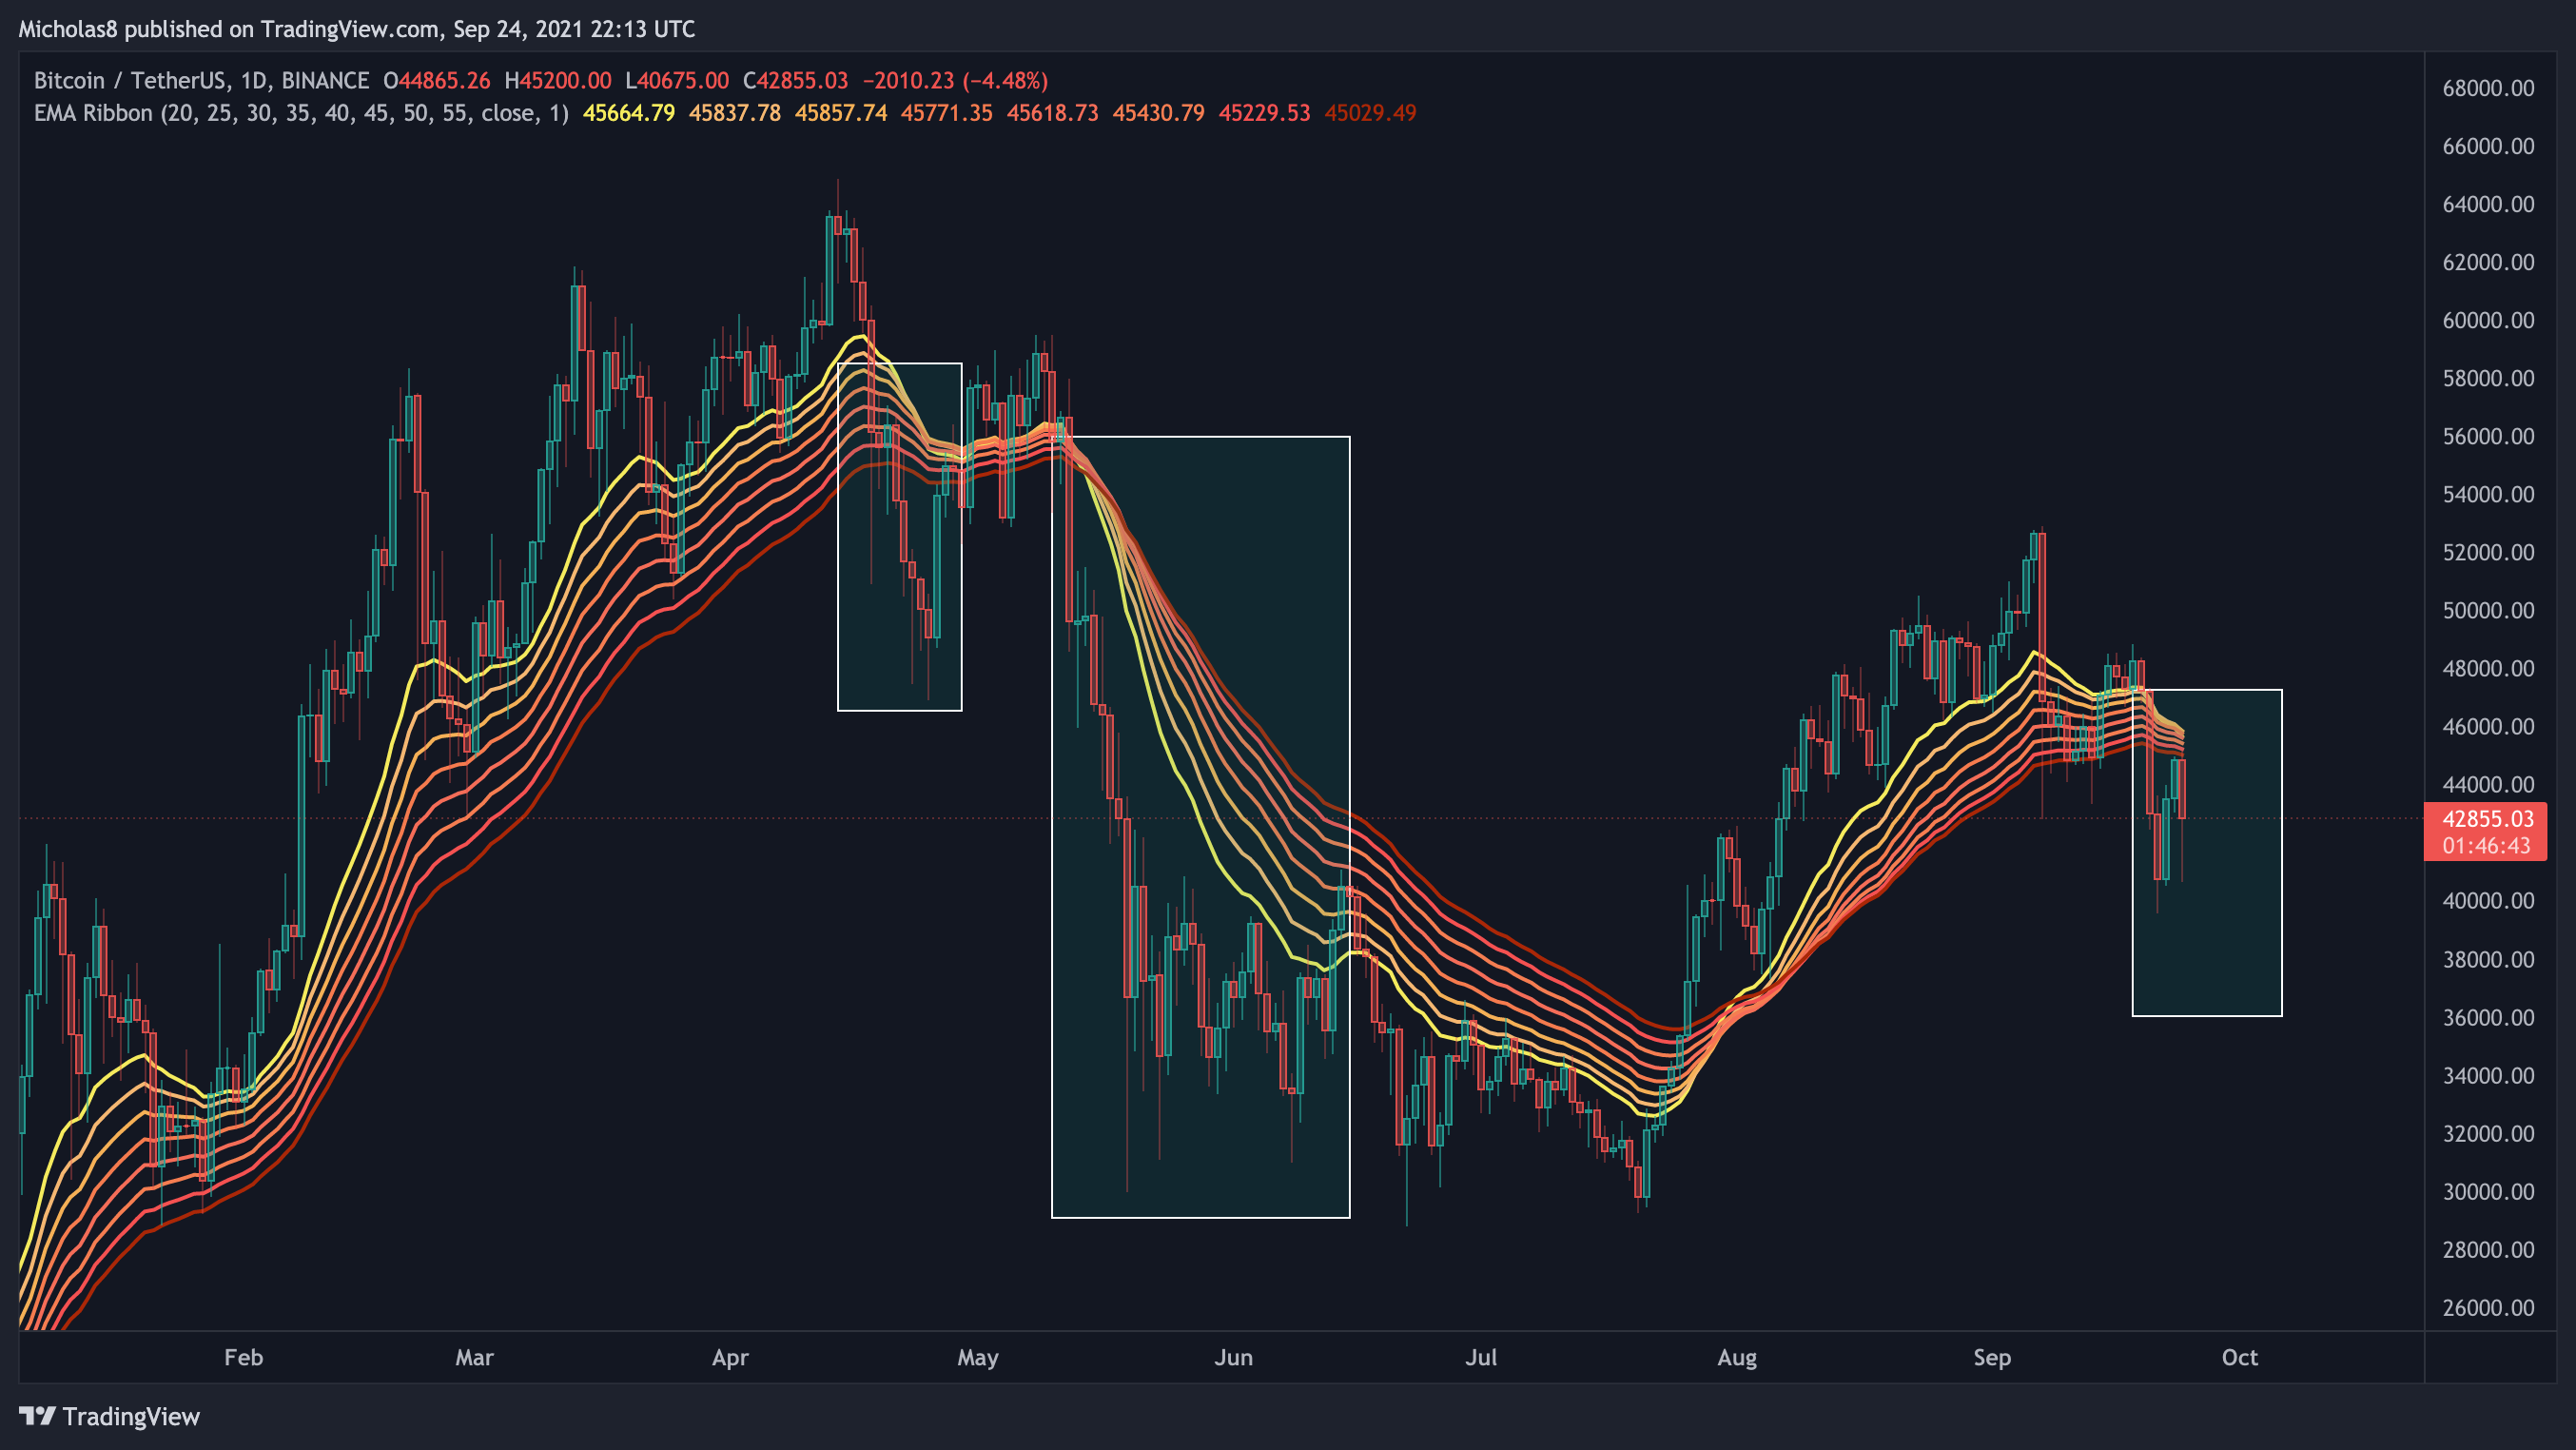
Bitcoin will see another candle close below the EMA ribbon tonight. The last two times we saw that this year, outlined by the rectangles, were followed by continued downside PA. We may see it happen again.
Implications: The momentum is now with the bears.
Simple Moving Averages (SMA): 20, 50 and 200
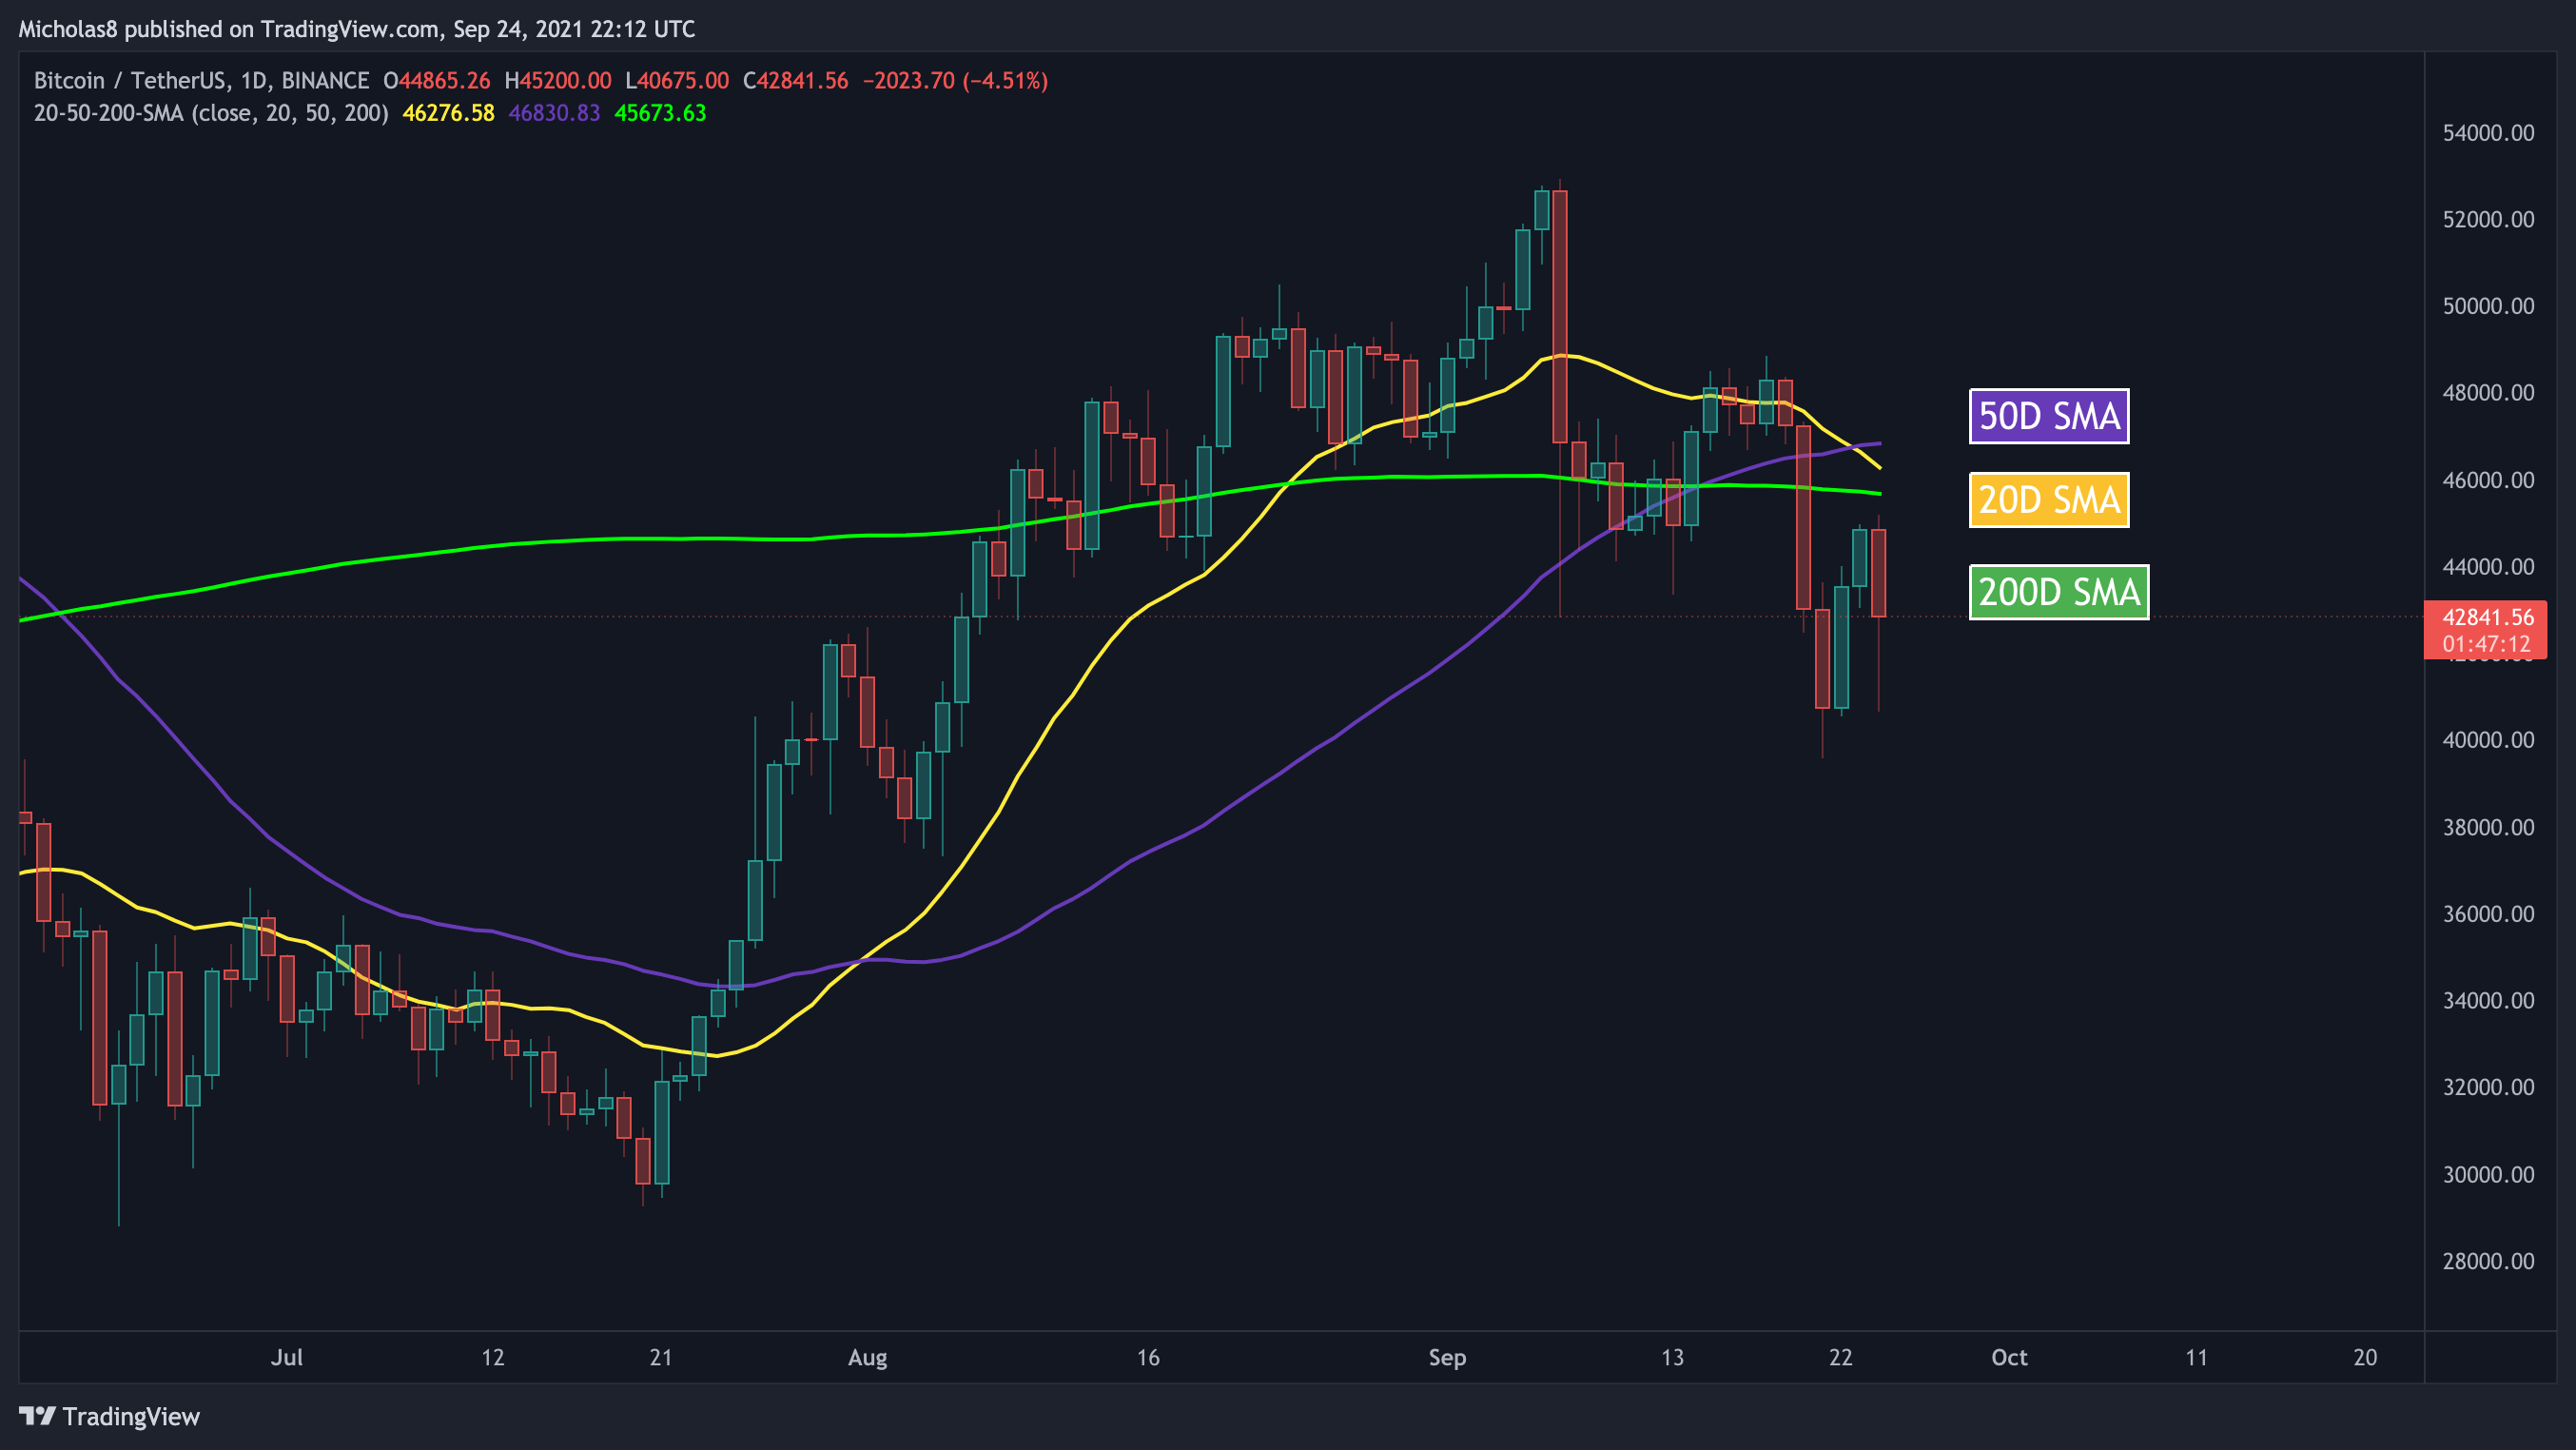
Bitcoin has fallen below all three of these SMAs.
Additionally, we did see a Death Cross between the 20-day and 50-day SMAs. This is when the 20-day SMA crosses below the 50-day SMA. The last time we saw this was April 28th, where a bullish rise followed.
Implications: These SMAs will now likely serve as resistance when we next test them.
Divergences
Bearish Divergence (red)
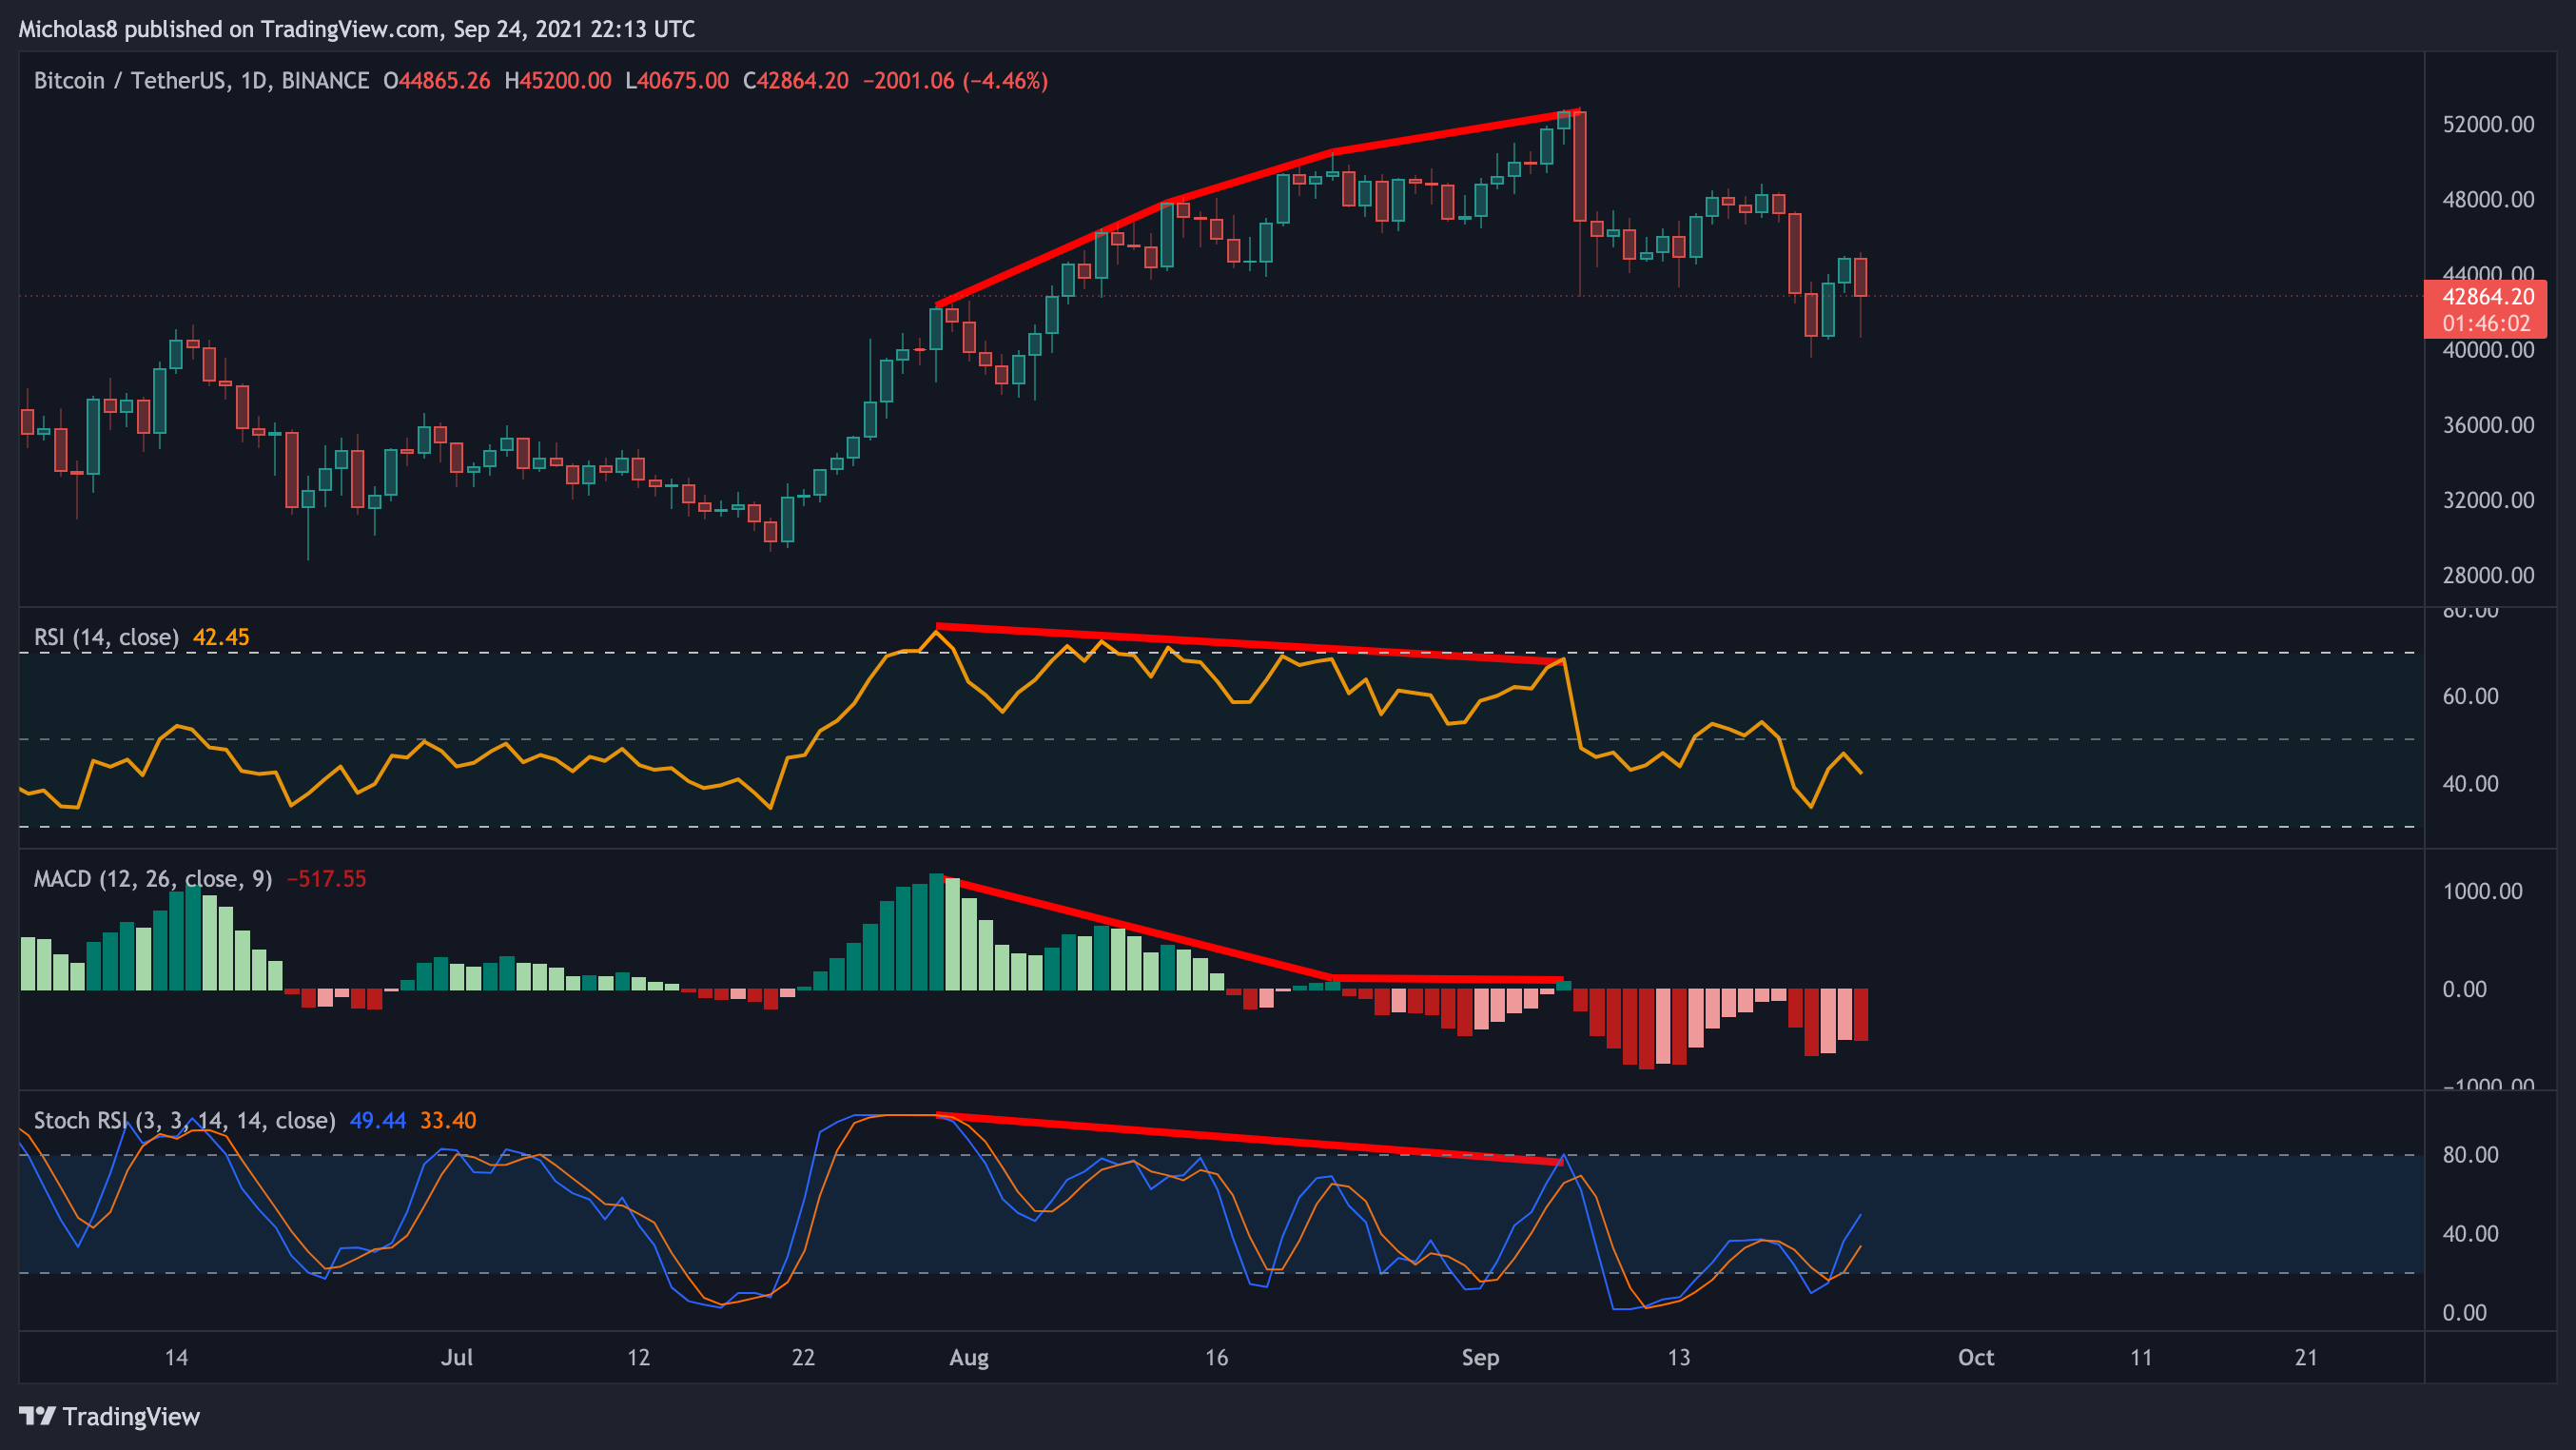
We have higher highs in price, with lower highs in the RSI/MACD/Stoch RSI. This is a bearish divergence, which signals a possible trend reversal. In this case, that means down.
Note: I'm keeping this here because the divergence spans over a total of 40 days, and we're seeing continued downside PA.
Invalidation: Higher highs in price, with higher highs in the oscillators
4H Timeframe
Key Liquidity Zone (LQZ)
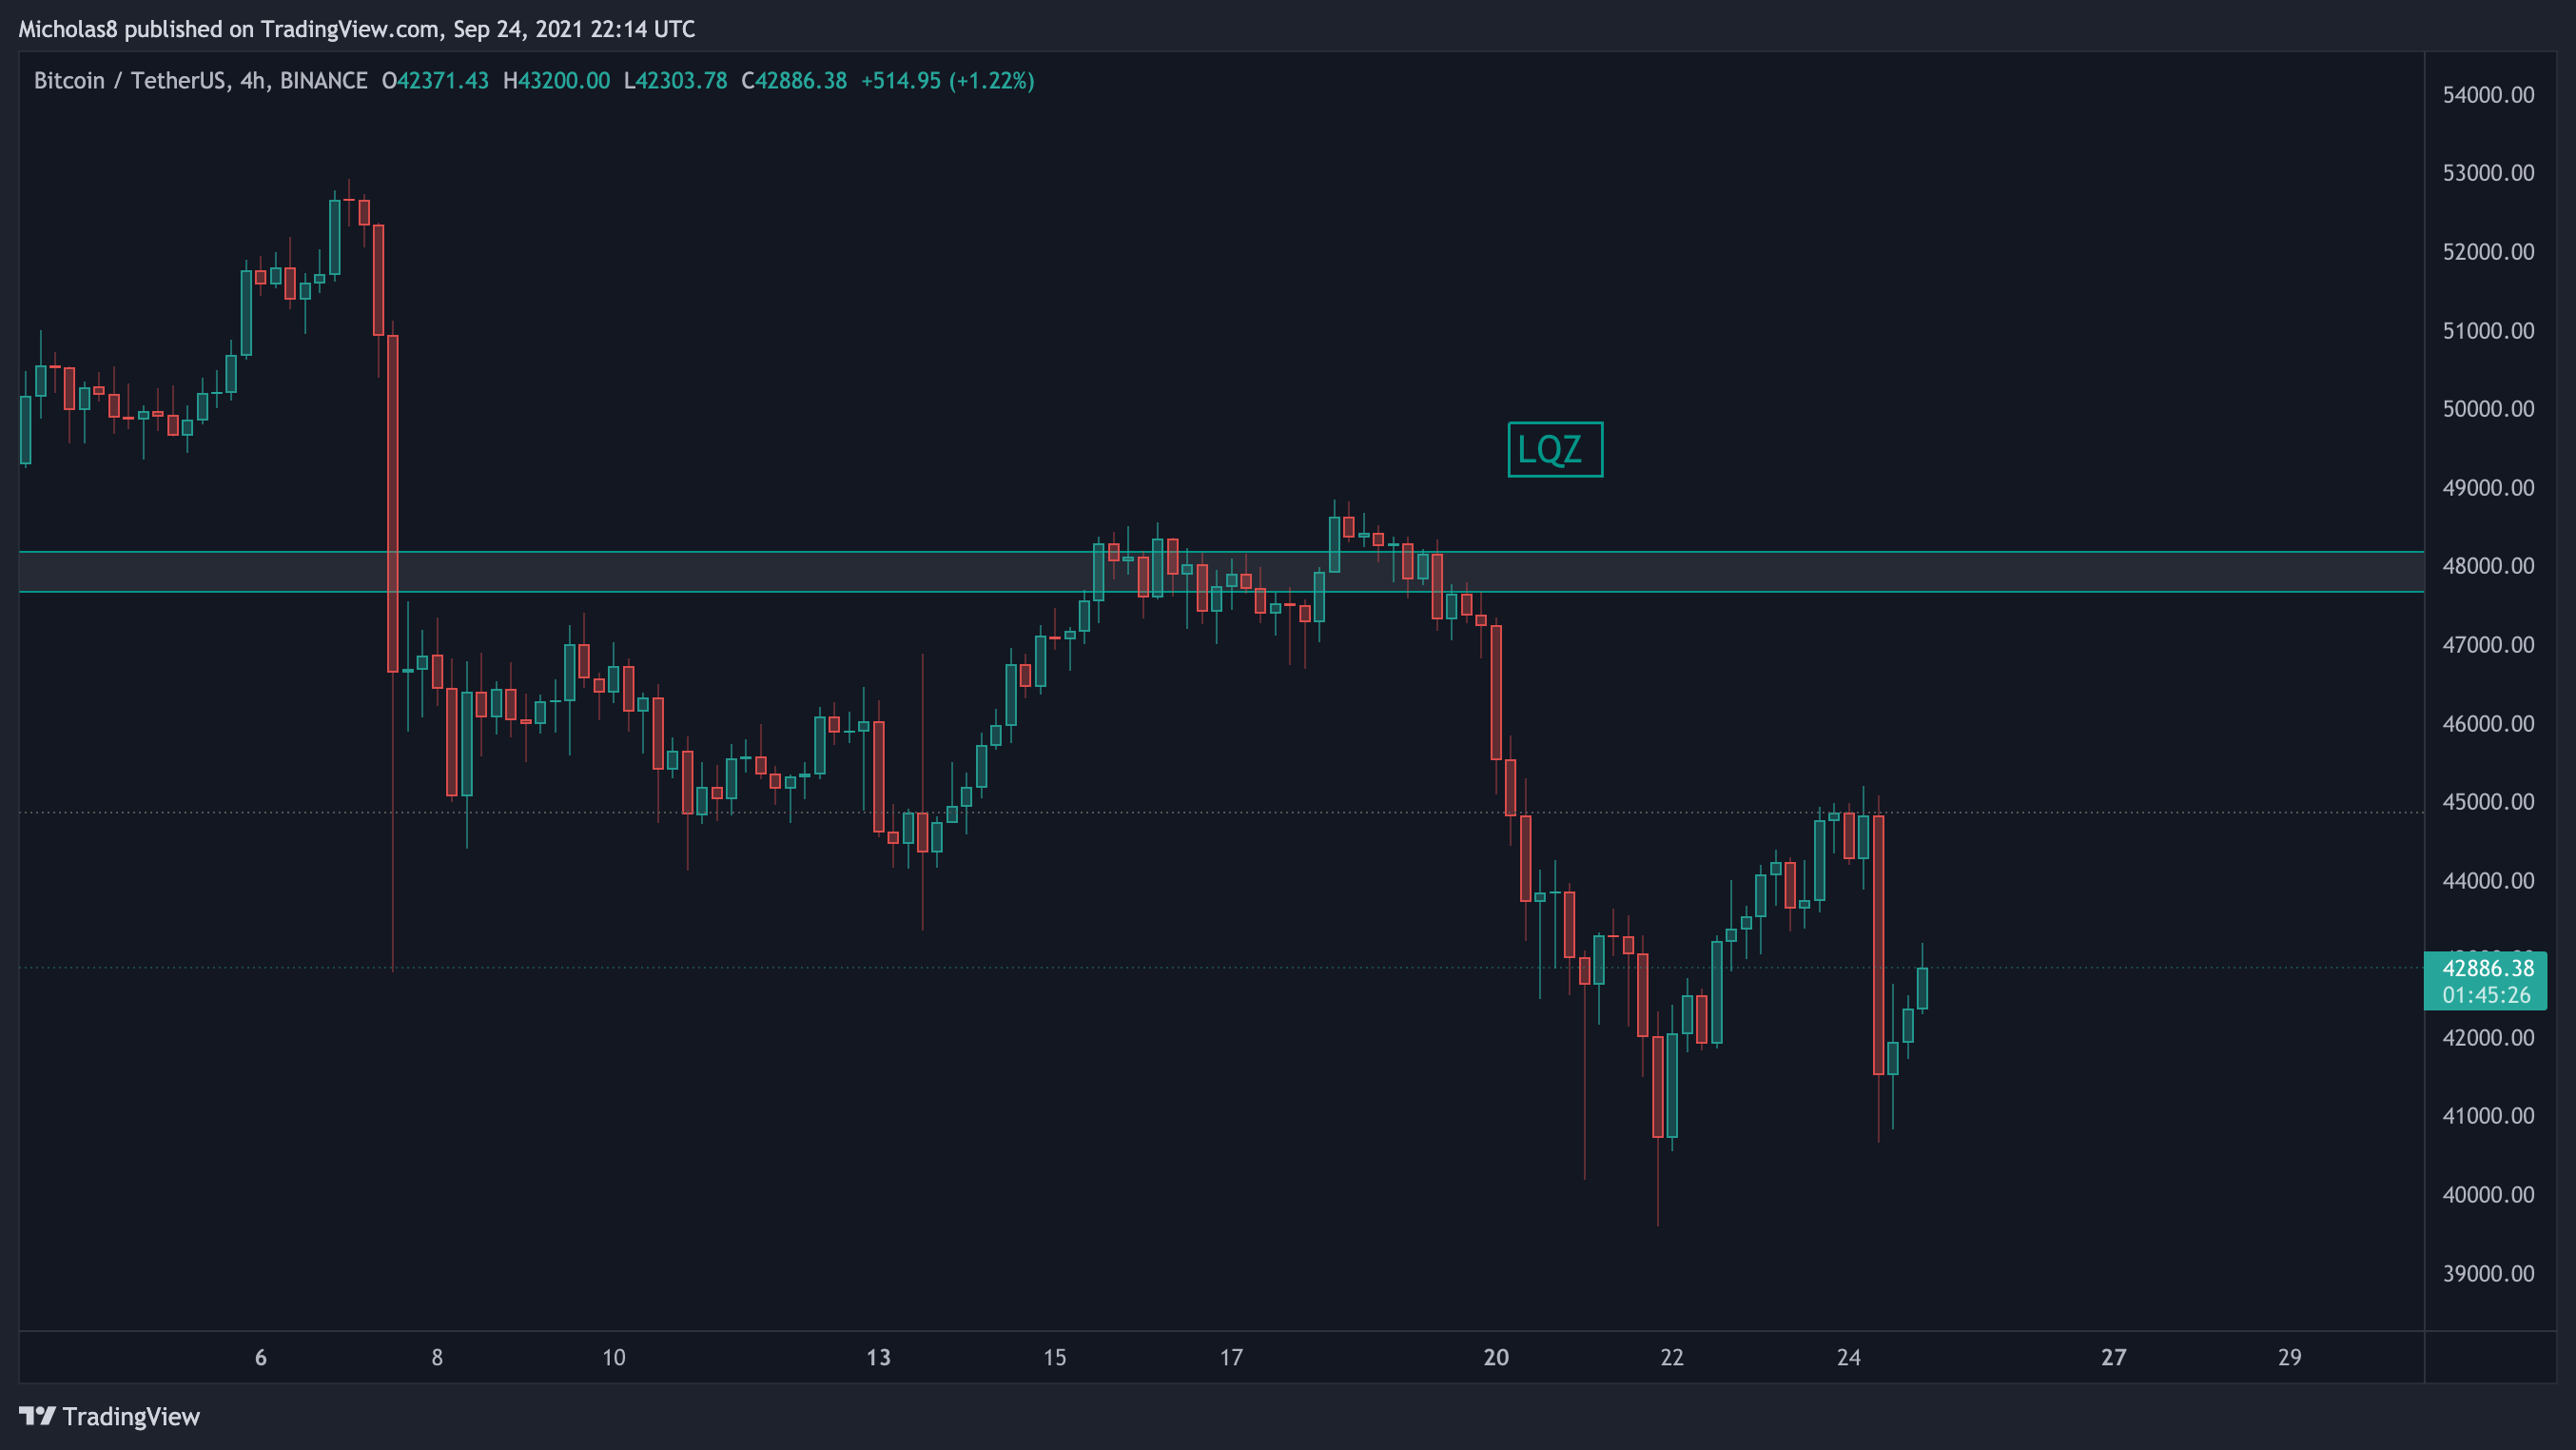
Now sitting at 47.7k - 48.2k, there is an LQZ that we've been rejected from. Moving forward, it may continue to serve as resistance.
EMA Ribbon
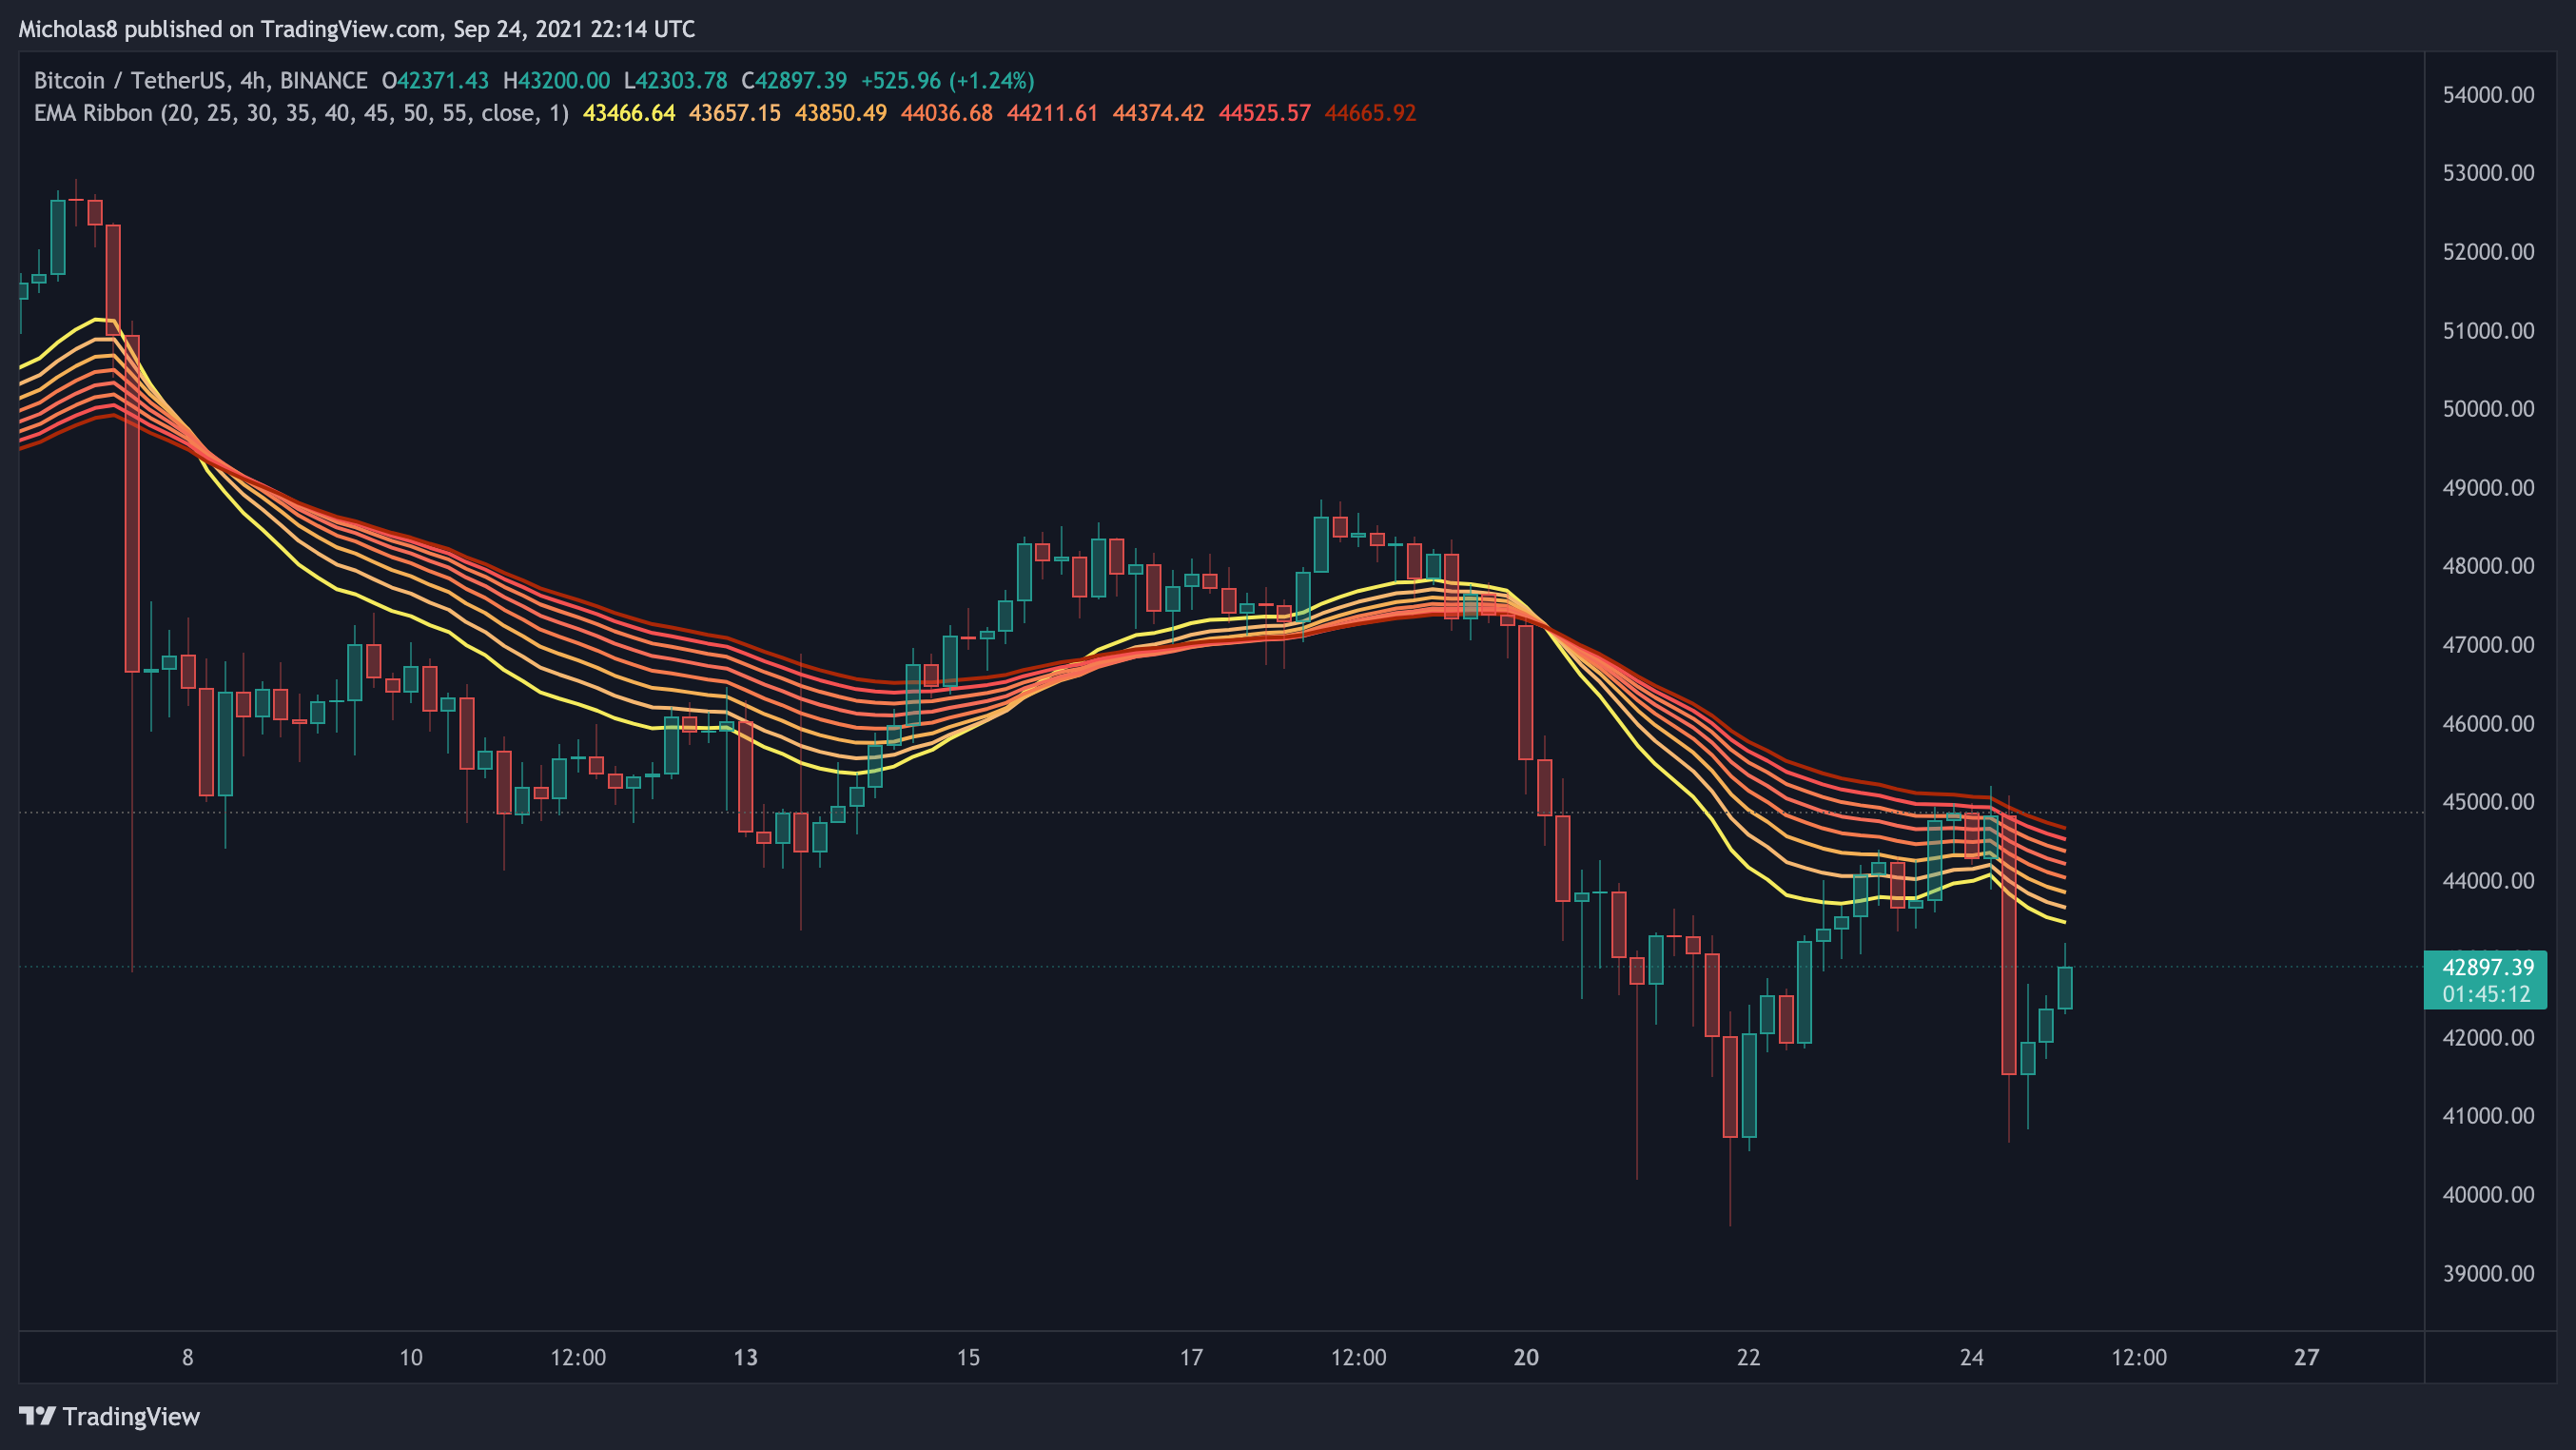
Bitcoin is trading below the EMA ribbon on this timeframe, implying momentum is currently with the bears. It's reasonable to expect the ribbon to serve as a level of resistance moving forward as it did last night.
Simple Moving Averages (SMA): 50 and 200
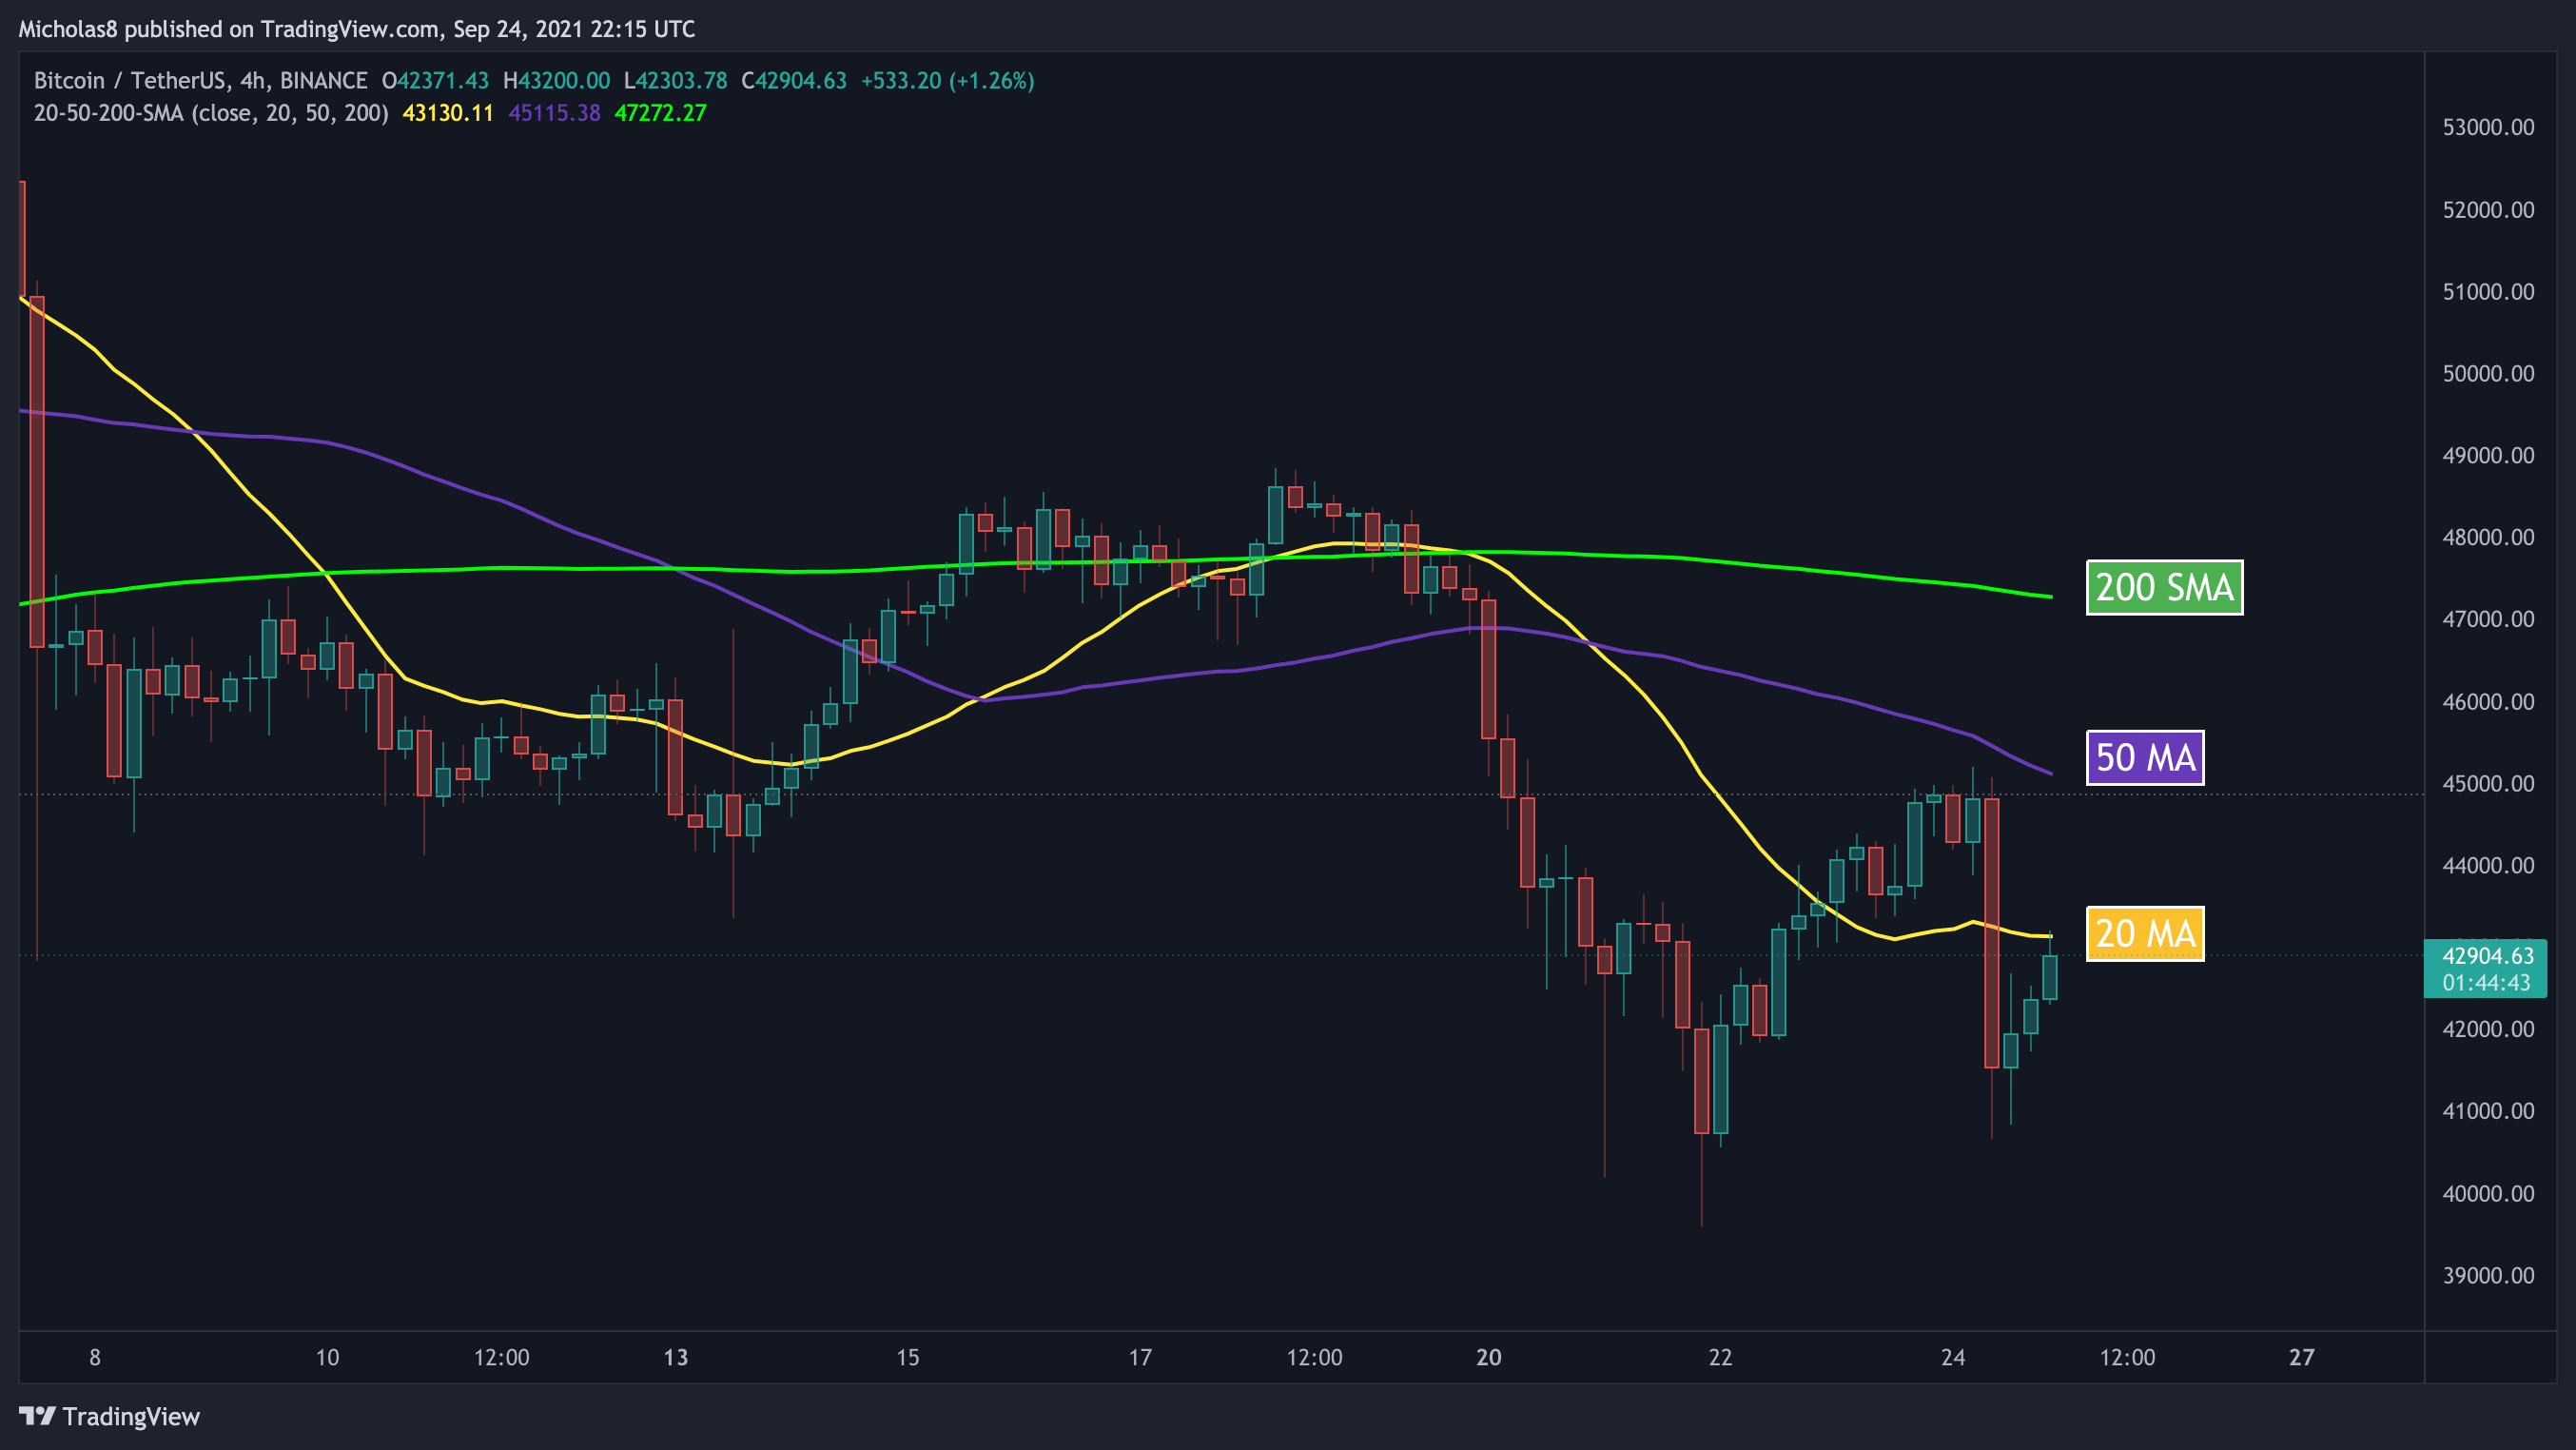
Bitcoin is now trading below all of these SMAs. It's likely to see them all serve as resistance moving forward as the 20 MA is right now.
Divergences
1H Timeframe
EMA Ribbon
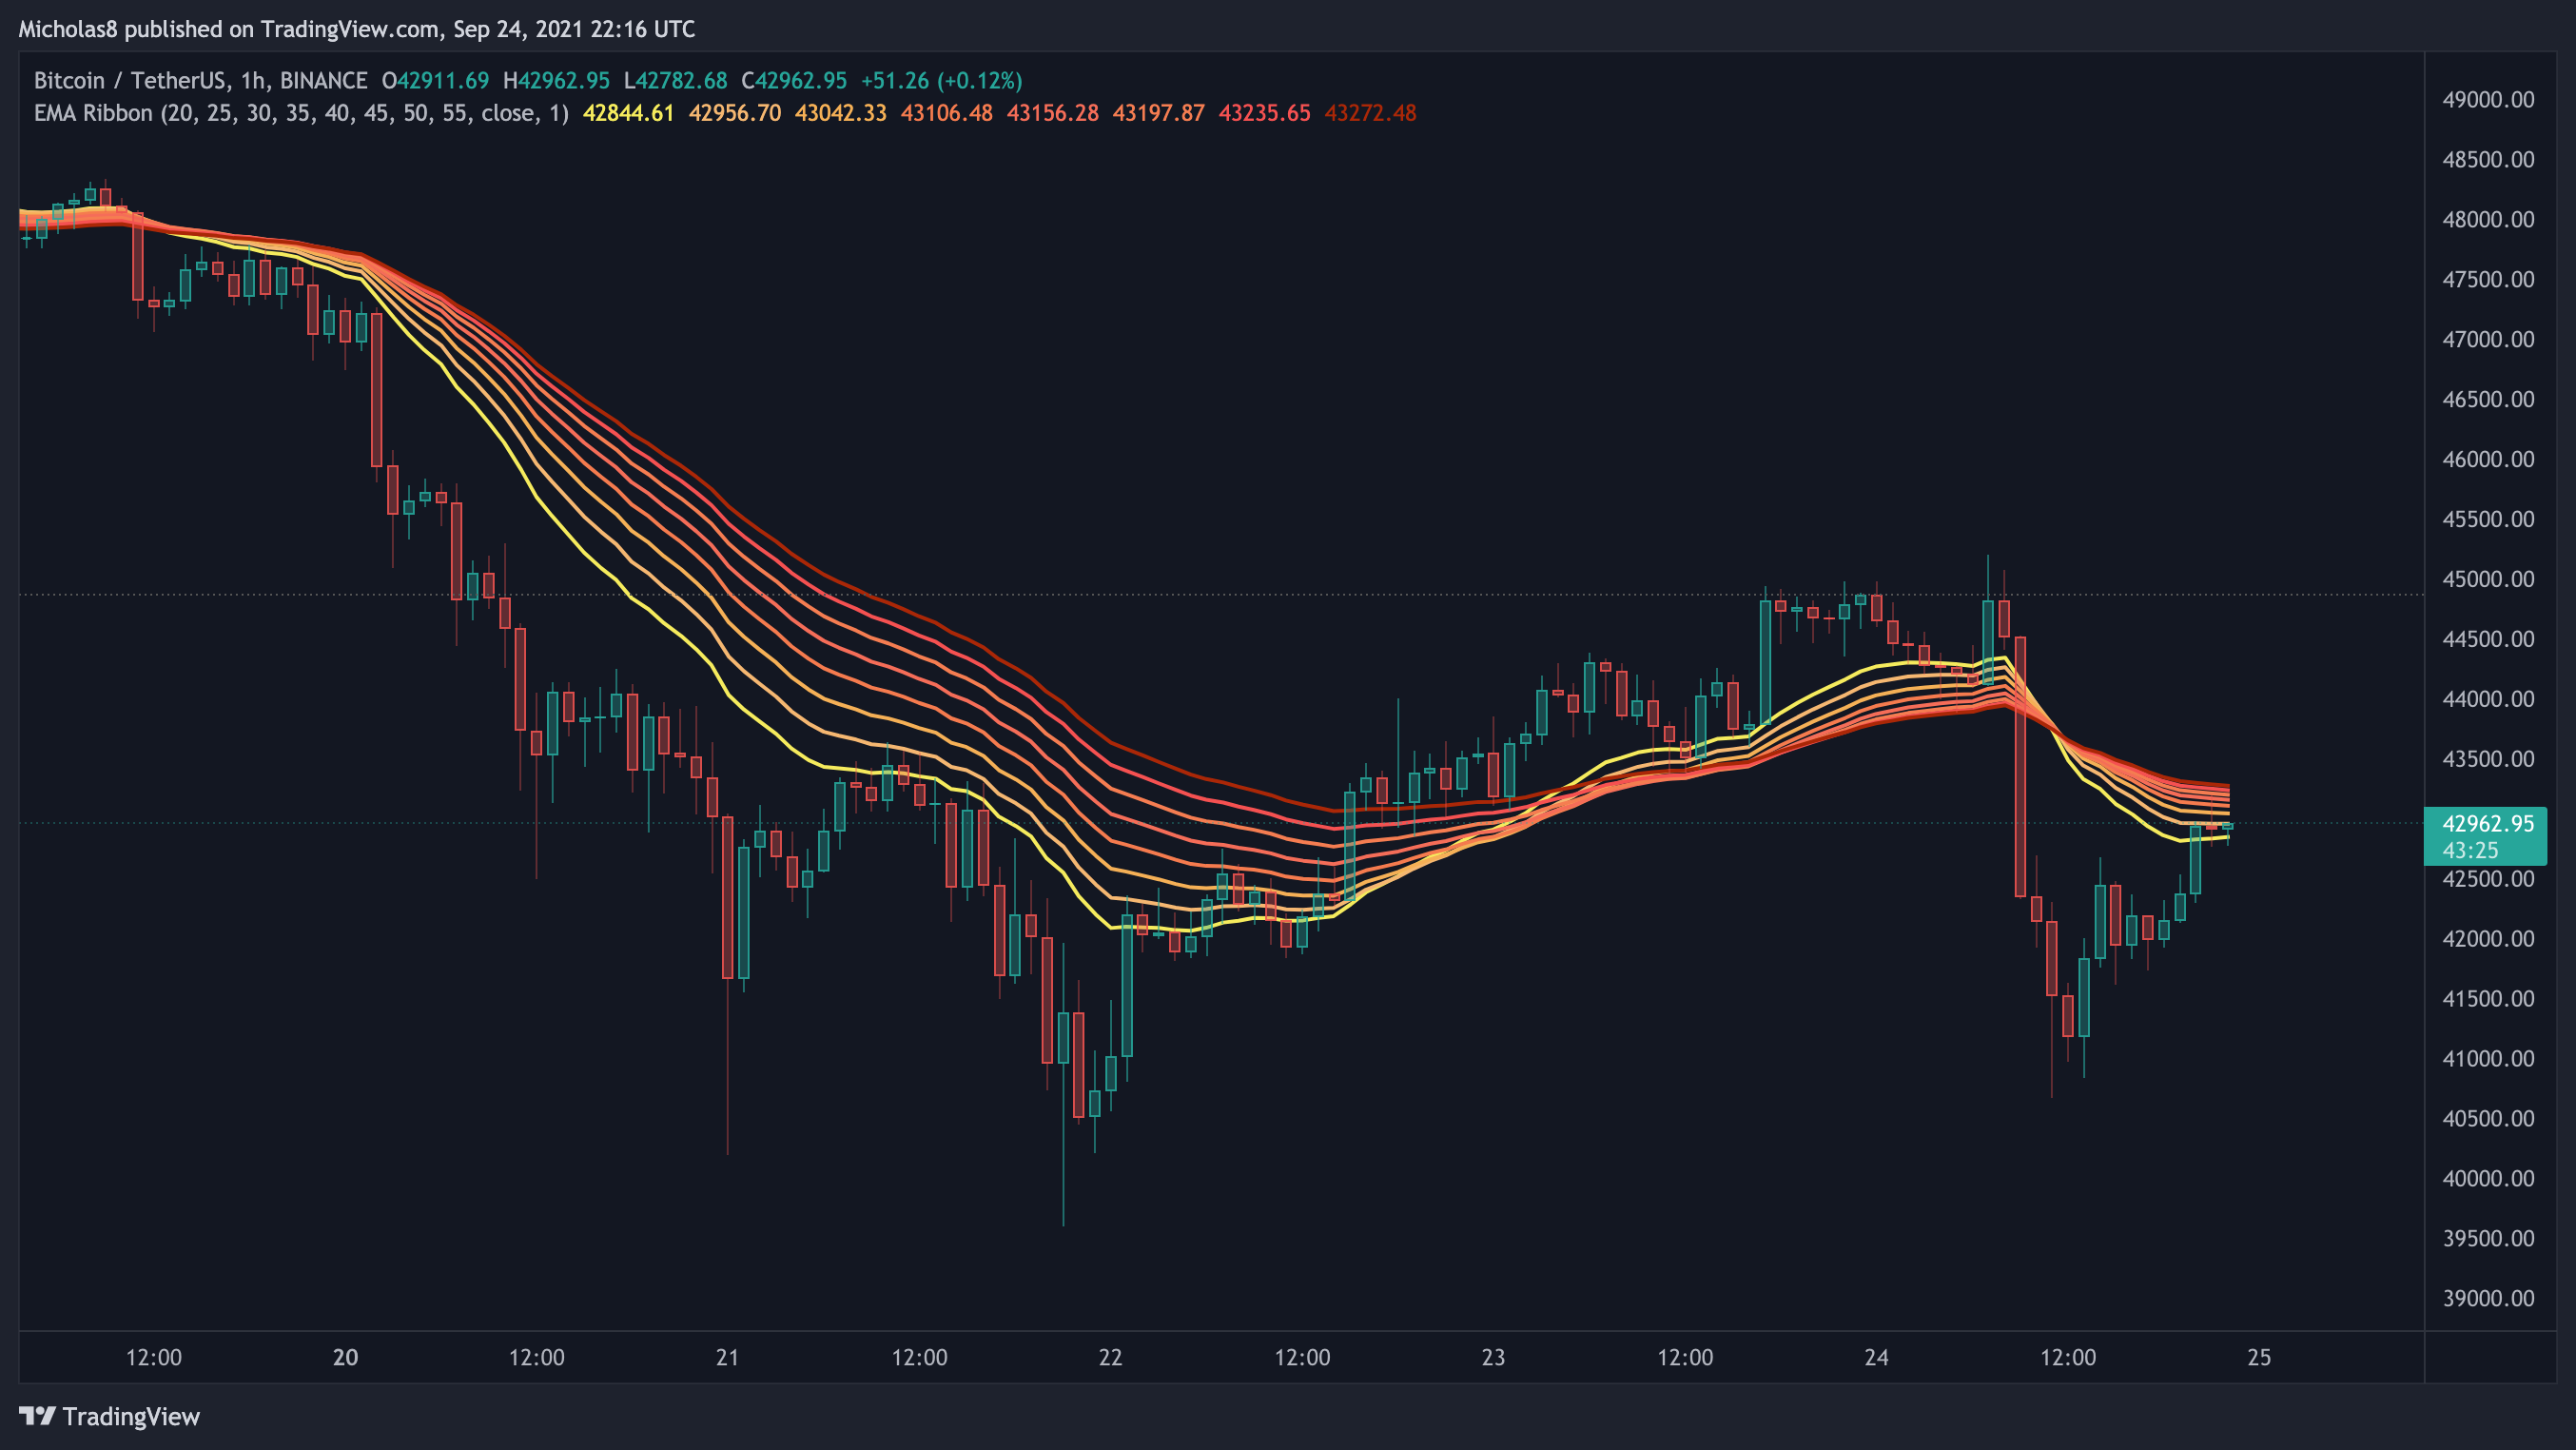
Bitcoin is currently back trading below the EMA ribbon on this timeframe.
Implication: The momentum is with the bears in the short term, and the ribbon may act as resistance.
.
.
.
CME GAPS
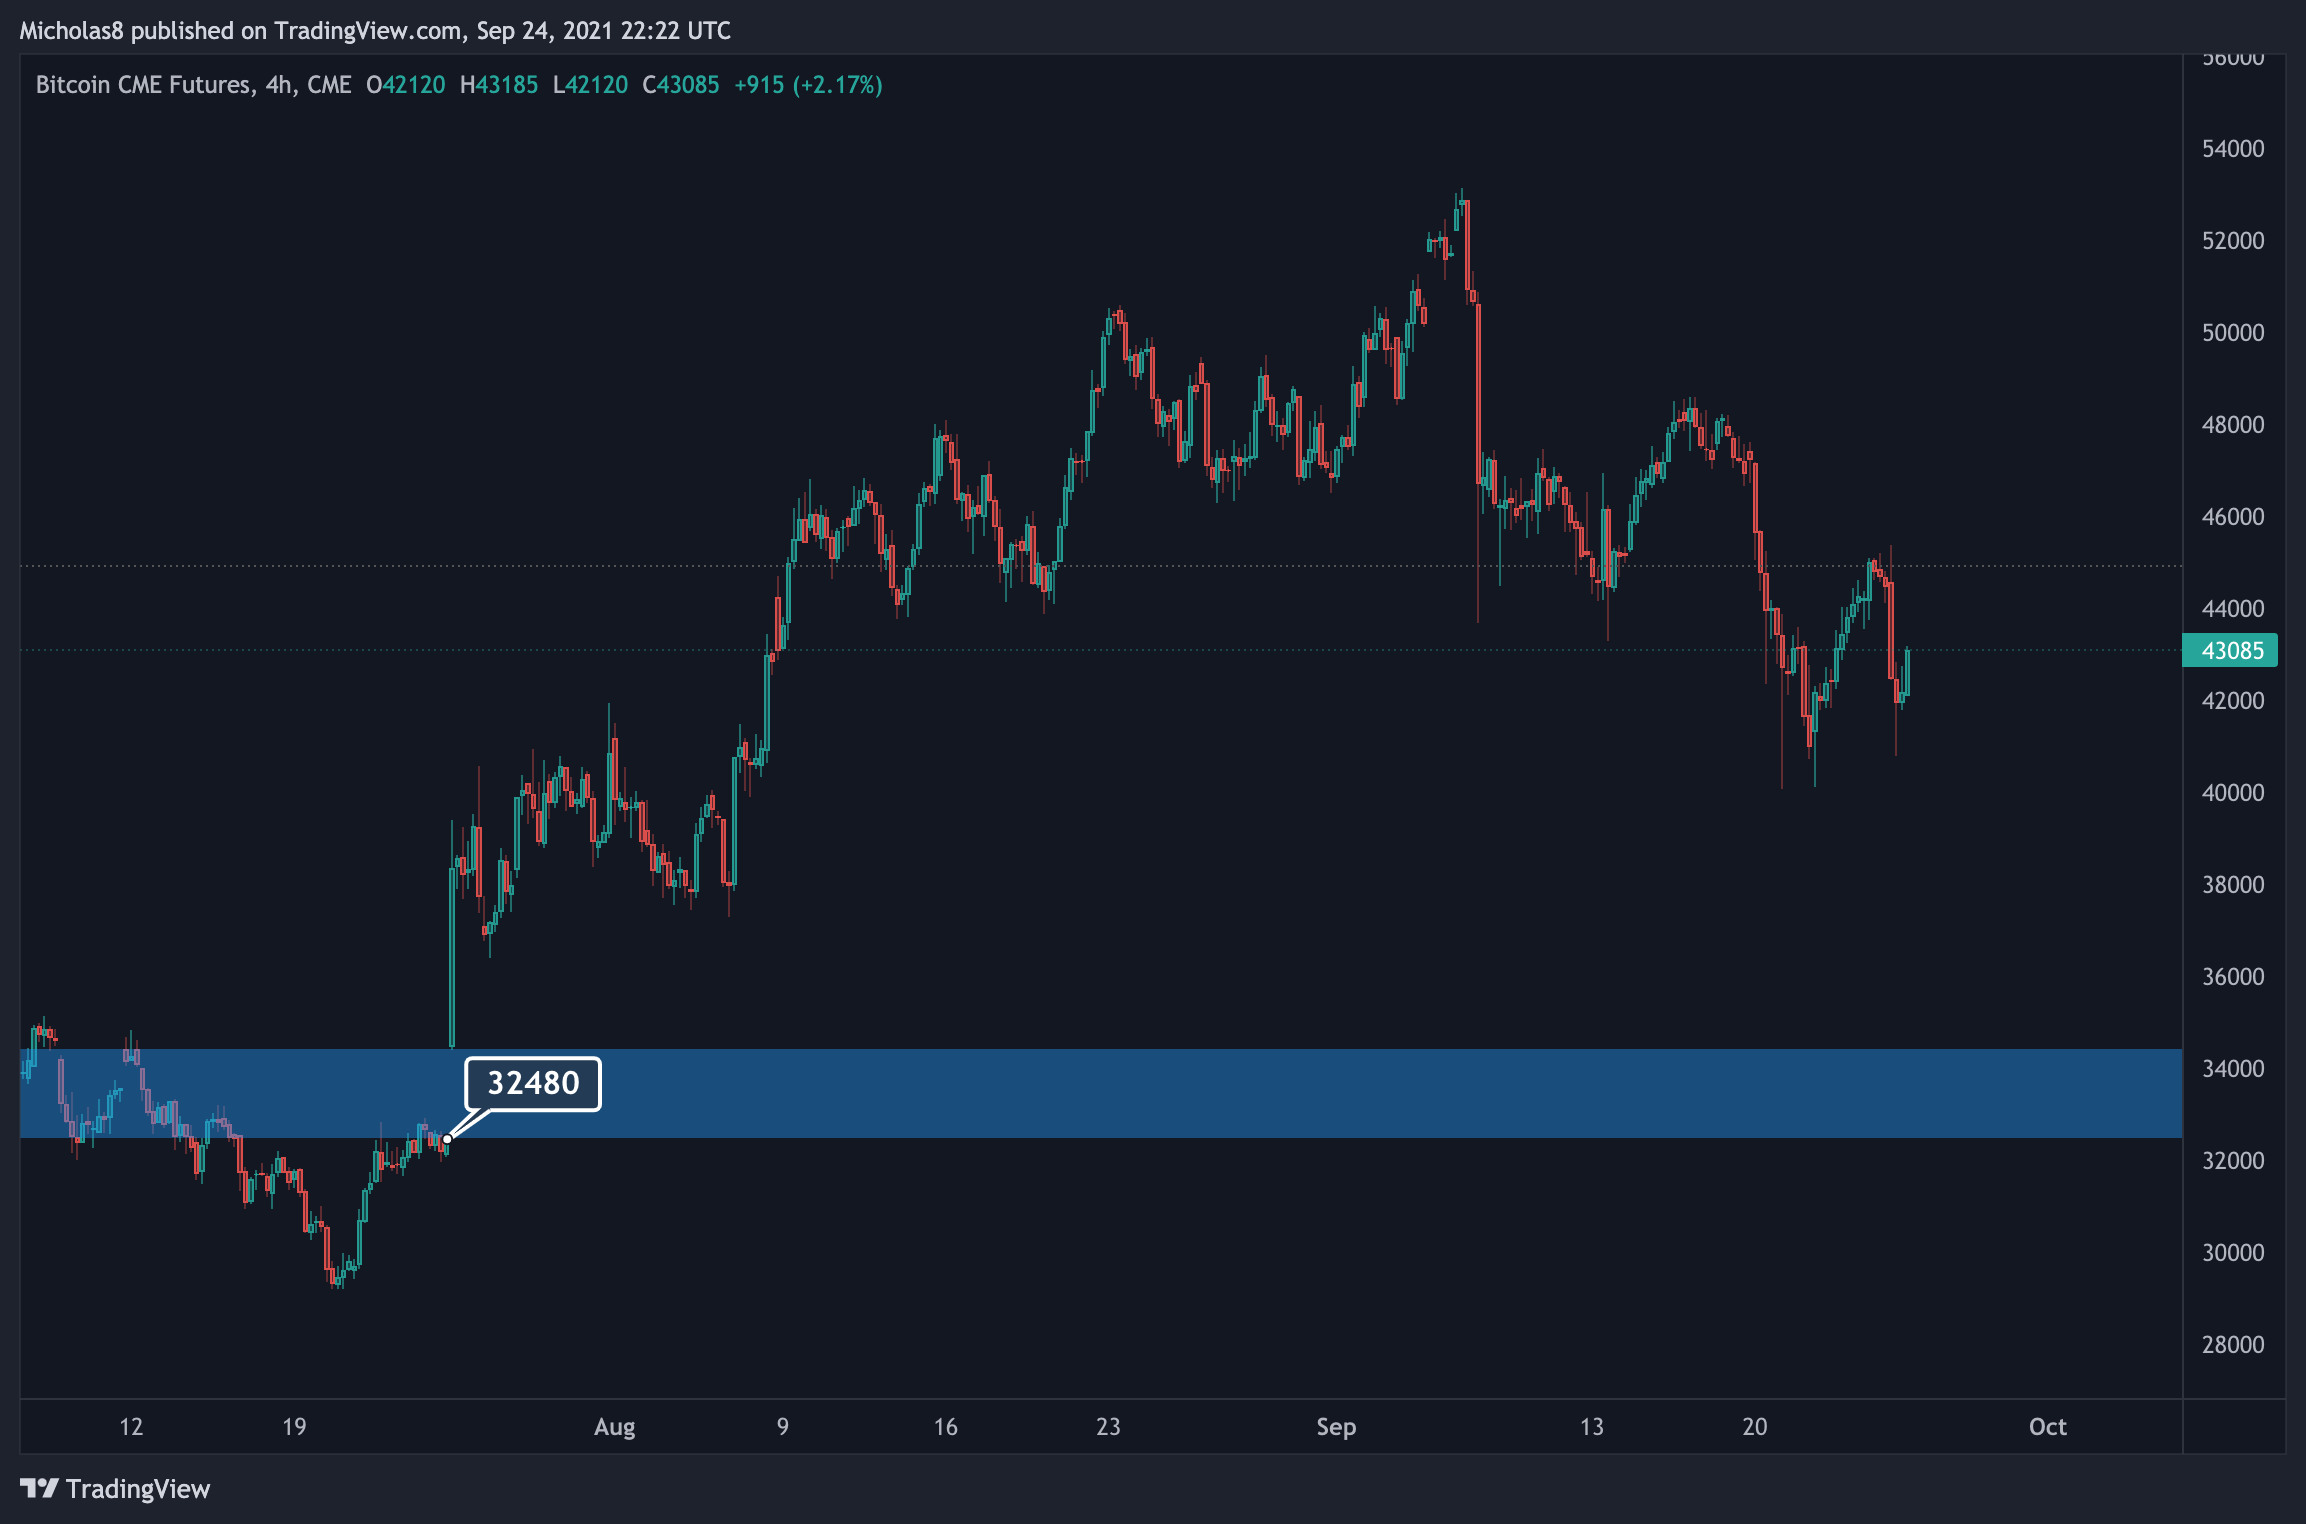
The immediate gap below us at 32480 is still open. Although not all gaps fill, they do tend to, which is why I'm still including this gap as something to be aware of.
NEW: The CME closed at 43085, meaning there will be a gap if Bitcoin isn't trading at 43k when the CME opens on Sunday evening.
.
.
.
Key Levels
Daily Timeframe
38210
39250
40525
42200
44400
45136
46025
46845
47800
48822
49245
49440
Fibonacci levels
4-hour Timeframe
38113
40500
41350
42599
42779
43920
44555
45310
46050
46745
47886
48555
Fibonacci levels
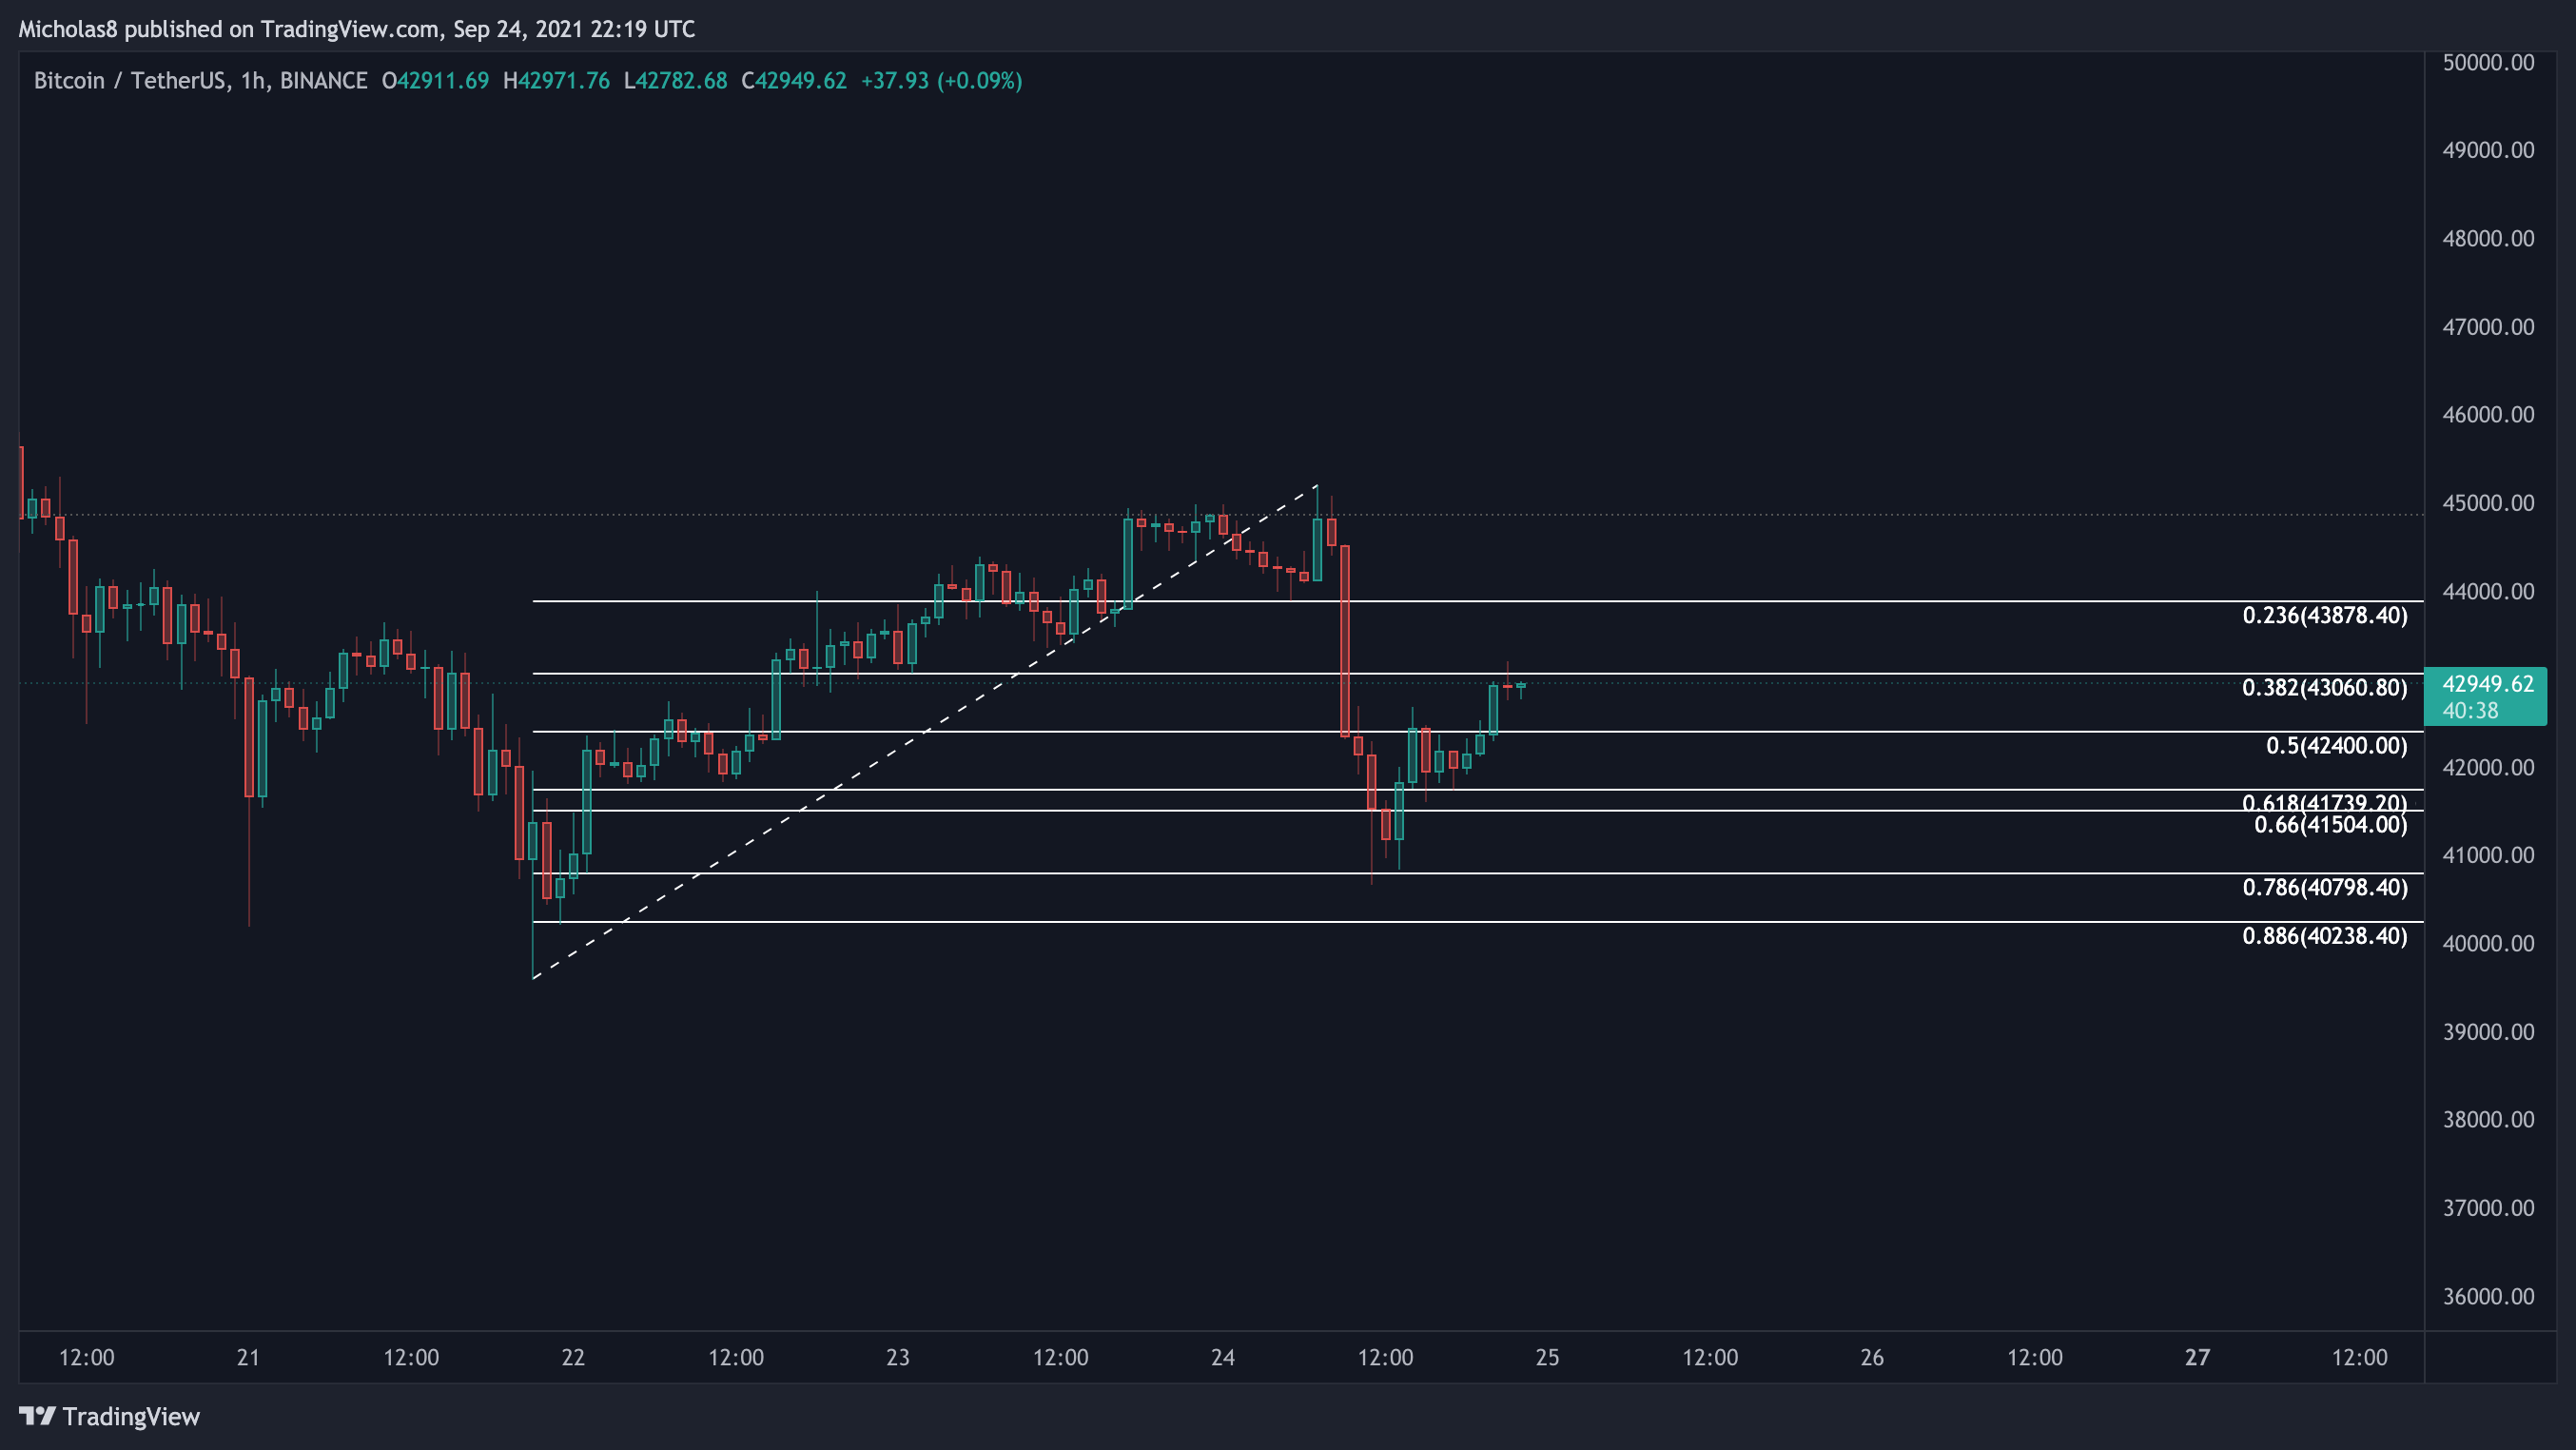
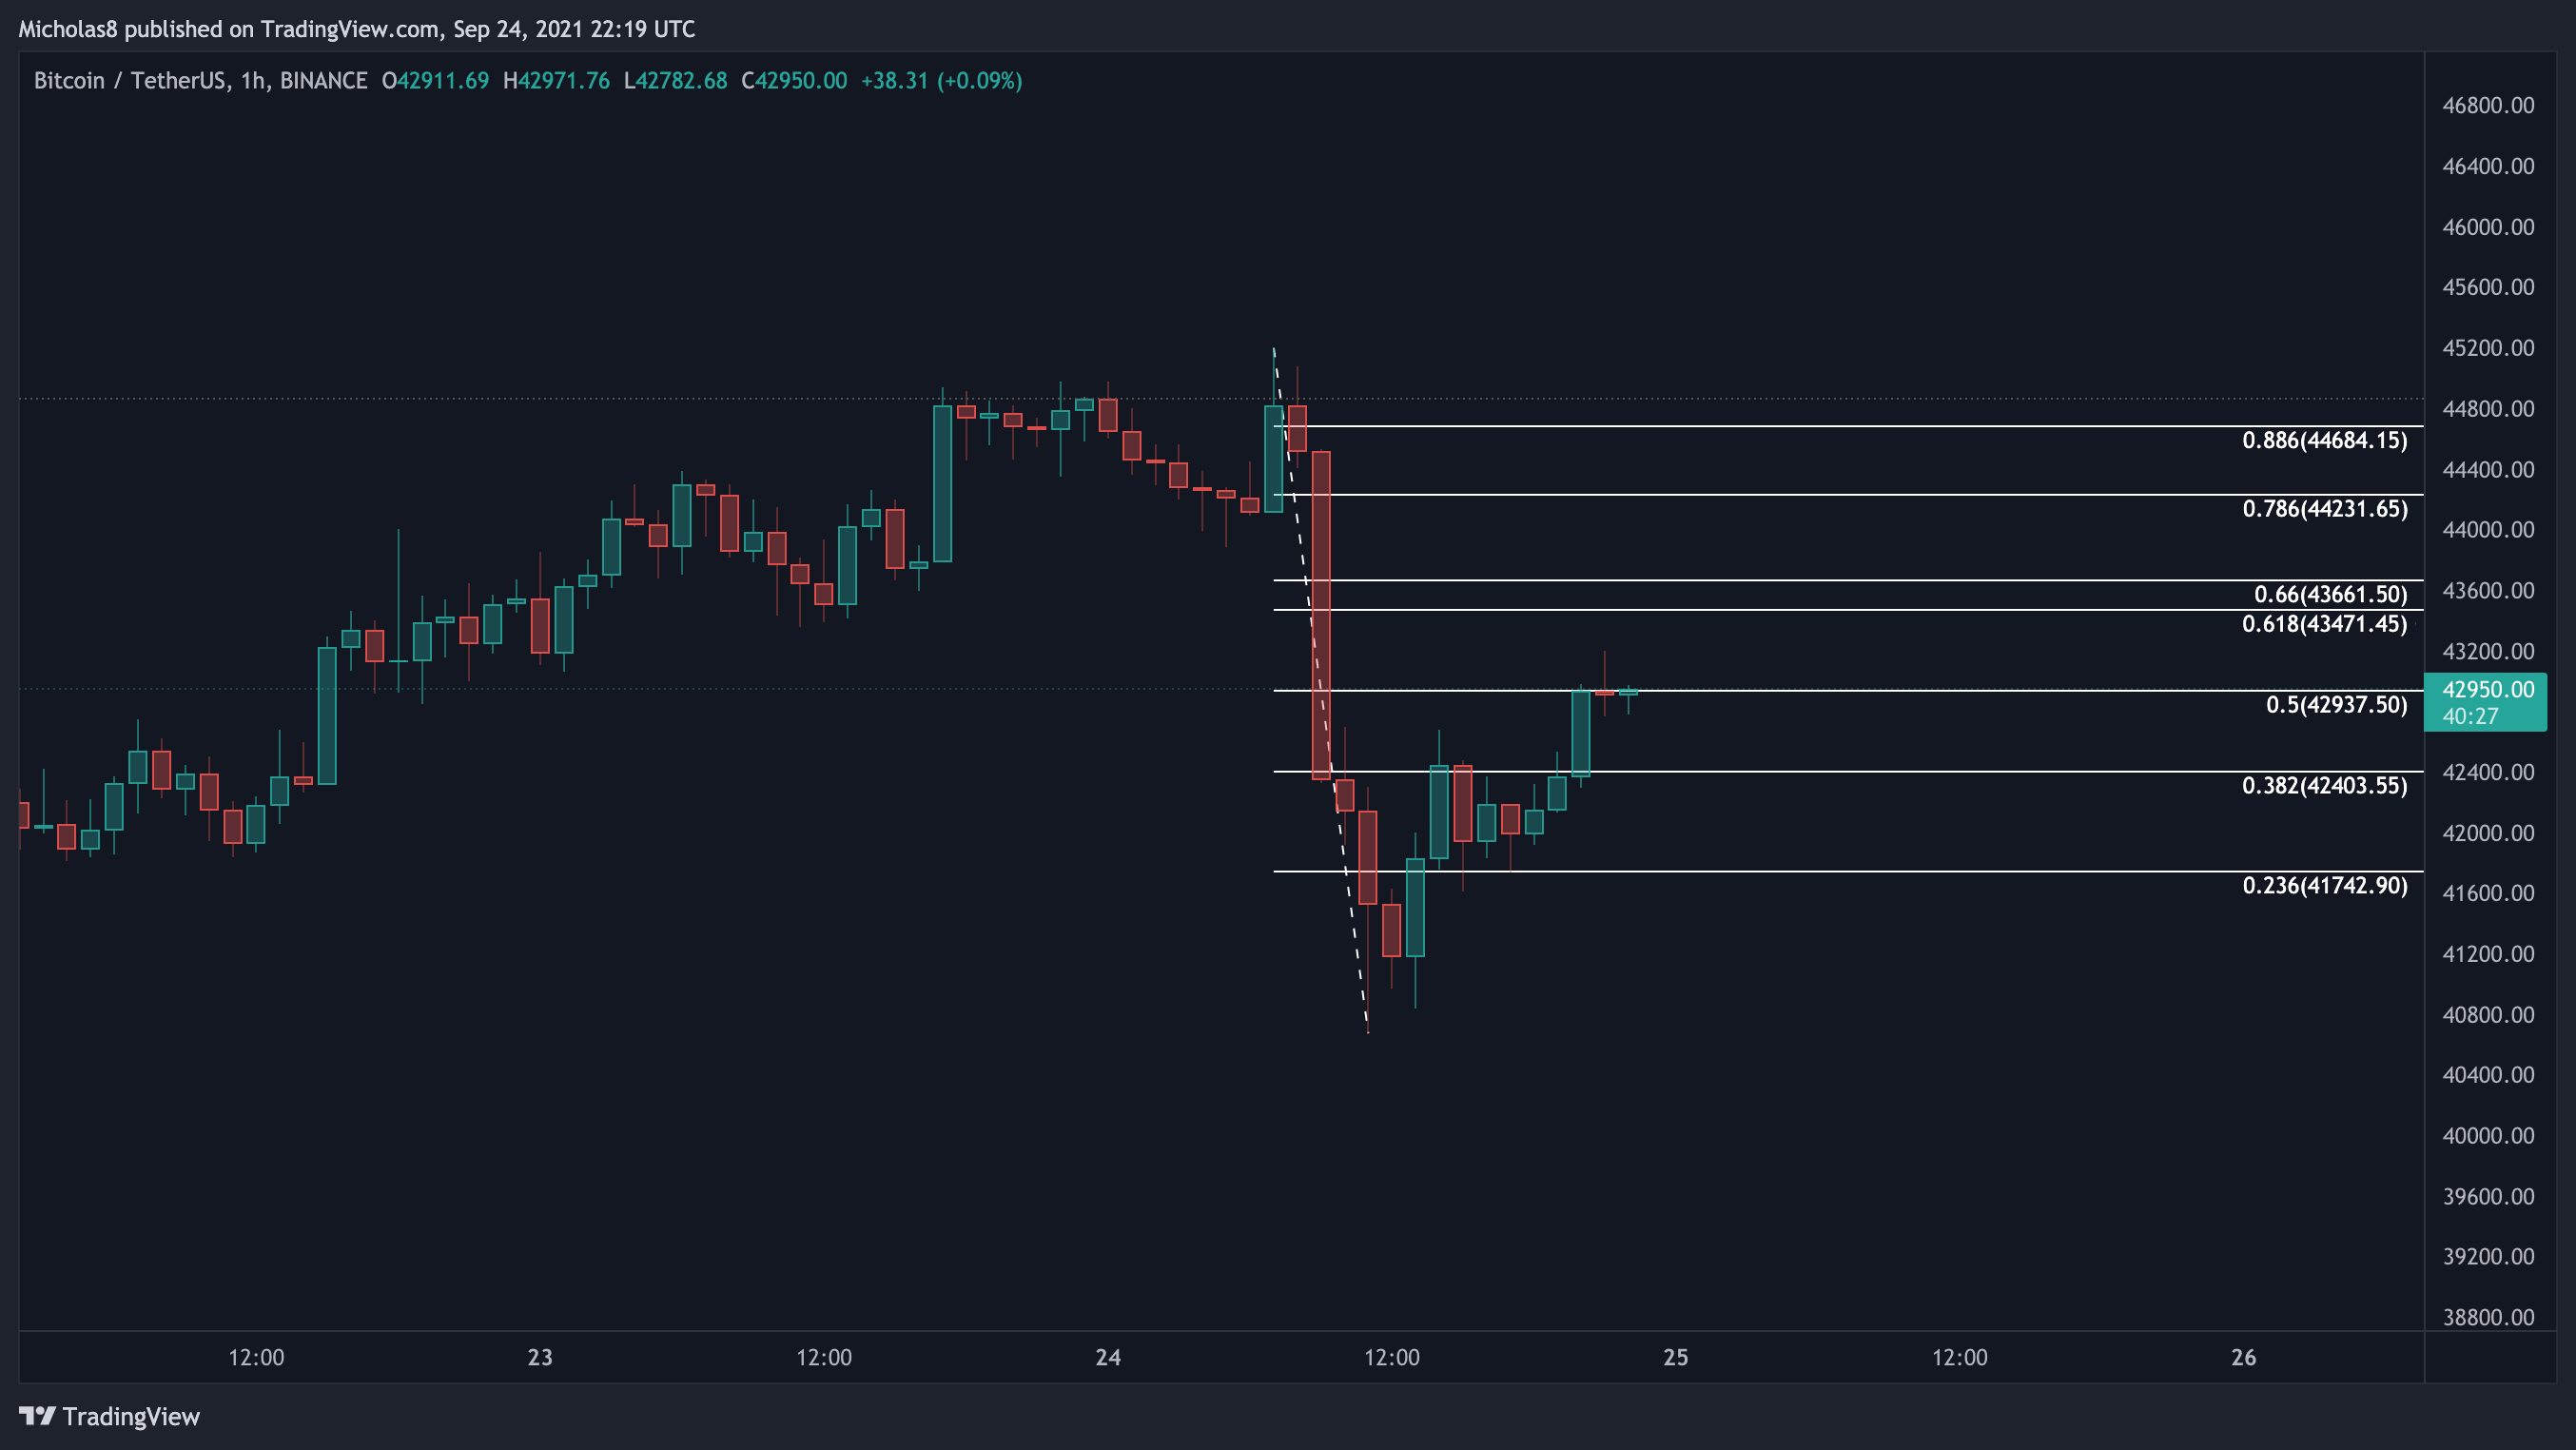
1-hour Timeframe
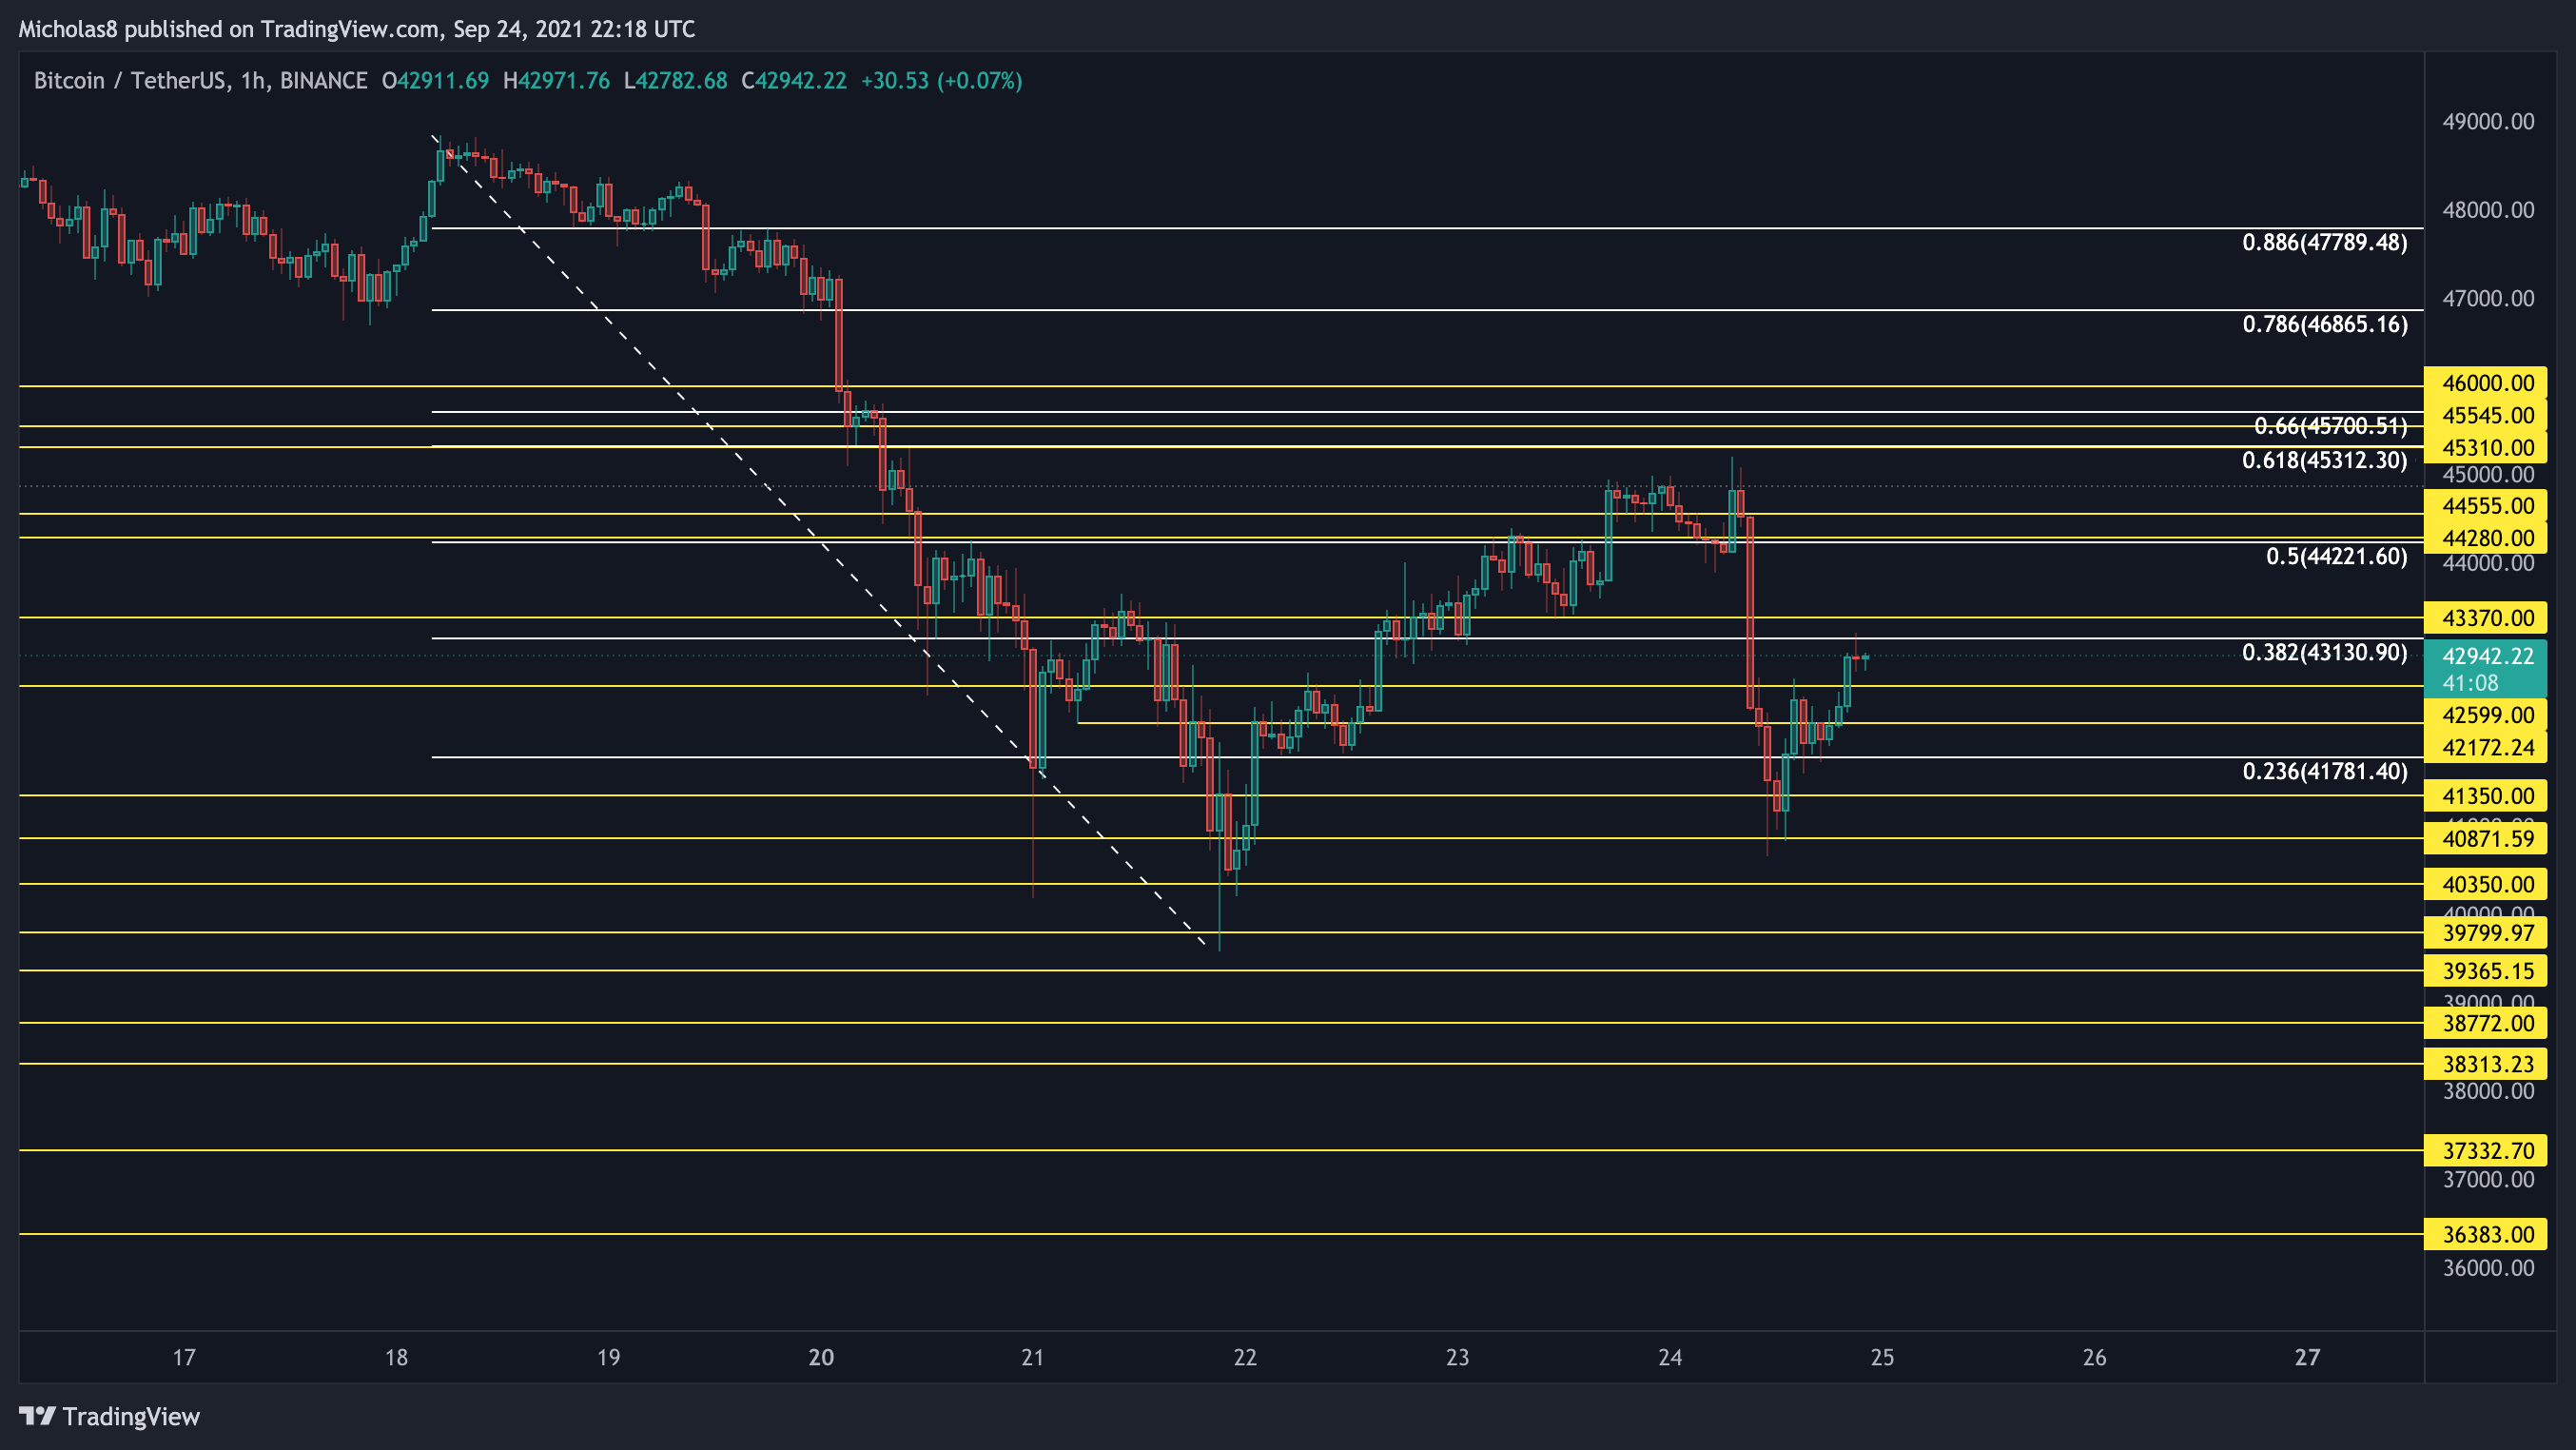
36383
37333
38772
39365
39800
40350
40871
41350
42599
43370
44280
44555
45310
45545
46000
Fibonacci levels
.
.
.
FINAL THOUGHTS
RECAP FROM THIS MORNING
Last night we saw a brutal move to the downside, and now we're seeing a bounce. Is this going to be another dead cat bounce?
The rejection.
The first Golden Pocket, 1H bearish divergence and 4H hidden bearish divergence ended up providing a brutal harsh rejection down. In fact, we weren't even able to make it up there, which further supports the argument for the bears being in control on a more macro level.
Looking at the technicals, we're bearish on almost all fronts. But there's a glimmer of hope. There is 1H hidden bullish divergence, which is when we have a higher low in price, with a lower low on the oscillators, signalling a possible trend continuation. In this case, that means up. So, yes, we do have the potential for a continued trend up. But, unfortunately, it's only the 1H timeframe. The lower the timeframe, the less significant the data. Generally speaking, the 4H timeframes and up are the most significant timeframes you want to analyze for a more 'macro' outlook.
If we continue down there's also the possibility of another 4H bullish divergence forming. Right now the RSI and MACD aren't in oversold conditions yet. Meaning, if we were to dump again today, we would almost certainly create the divergence. The only way there wouldn't be divergence is if we see a massive crash down to 35k or even lower.
Do I think we'll see that happen? Sure, it's possible. But I don't believe we'll see that today. Of course, this is Bitcoin and things can change at a moment's notice, so stay vigilant.
These are the bullish and bearish targets I'm looking out for:
All in all, at this exact moment, I am still a bit more bearish than bullish
TONIGHT
The Good
SR Flip is still in play
Daily Liquidity Zone 1 is still considered support
1D hidden bullish divergence may still have an influence
1D bullish divergence may help in the short-term
Bullish fractal comparison (LTF)
Still trading above the 100-day SMA and the 200-day EMA
Falling Wedge
_
The Bad
SPX bearish
Trading below most 1D SMAs and EMAs
Daily Liquidity Zones 2 and 3 are considered resistance
Lost the 1D EMA ribbon as support
Trading below the 4H EMA ribbons
Bearish DMI
Bearish NVT
1D bearish divergence
Bearish fractal comparison (HTF)
Logarithmic curve rejection at the median line
_
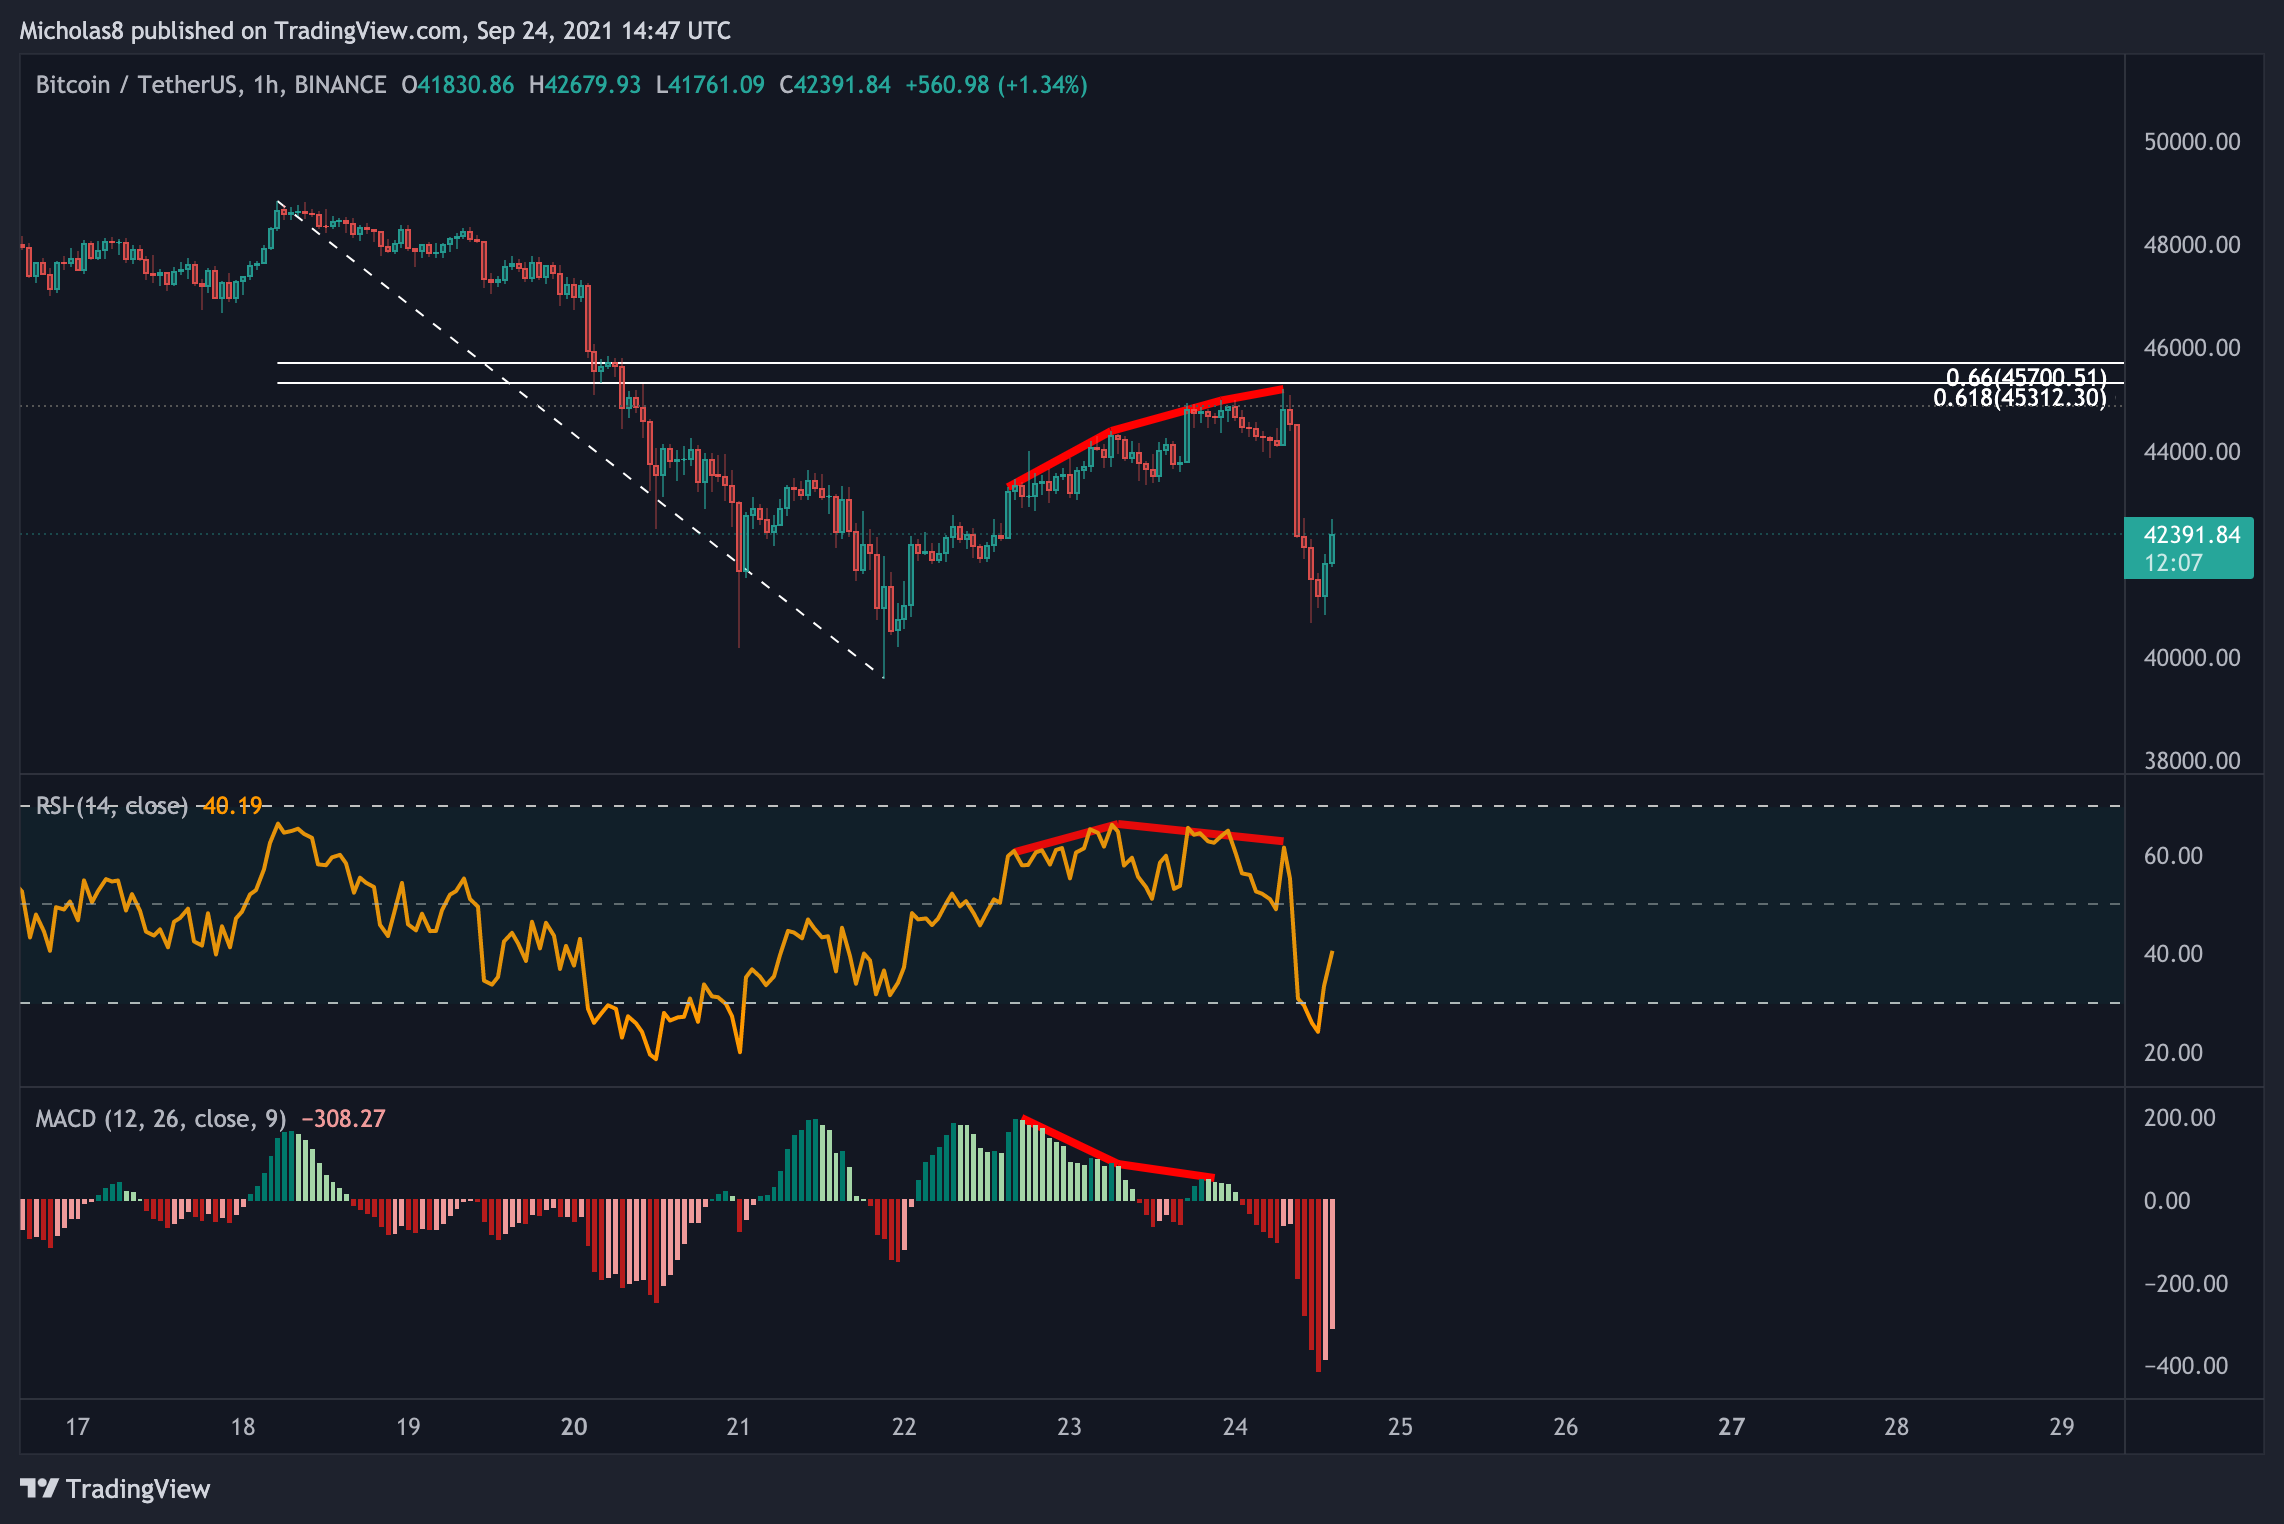
What a day it's been for the entire market. Bitcoin slicing and dicing to 40.7k, and rebounding up as high as 43k at the time of this post.
Between this morning and tonight, not much has changed. We saw a rise from the 1H hidden bullish divergence that was identified in confluence with a 0.786 Fibonacci bounce.
So on that note, let's do something we haven't done before. Let's have a look at the 15minute timeframe.
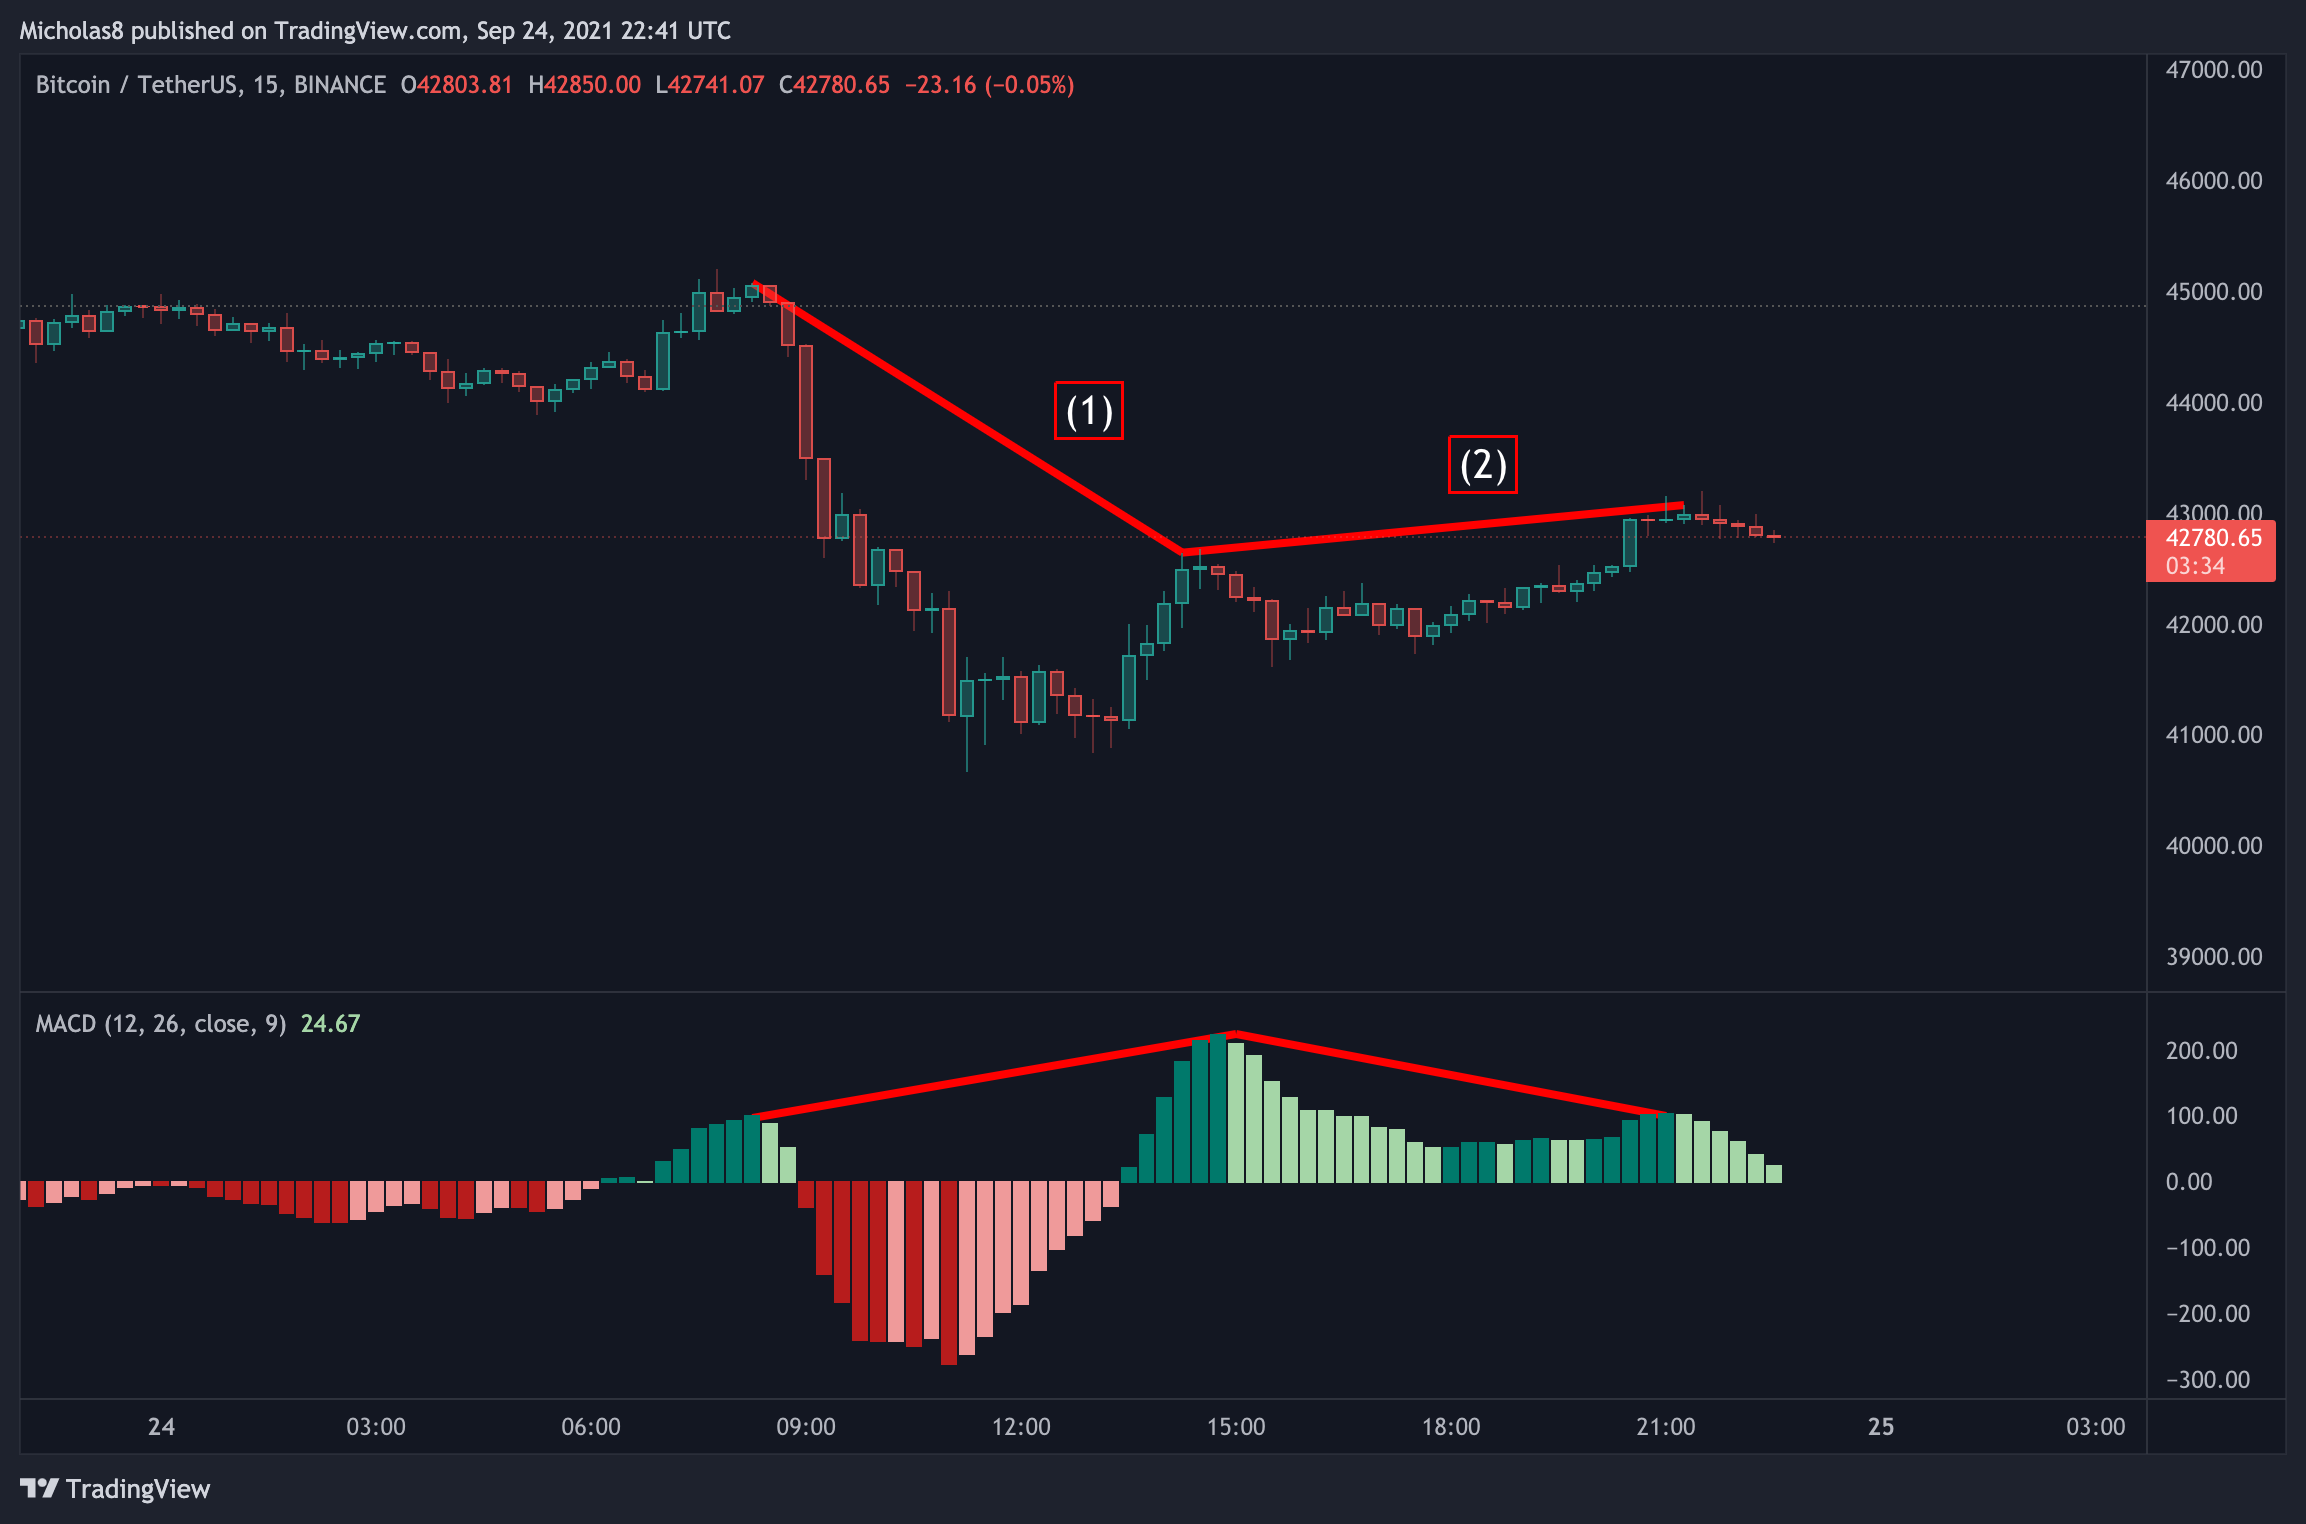
The first divergence (1) indicated by the downsloping red line on price action is a hidden bearish divergence. As we know, hidden bearish divergence signals a possible trend continuation. In that case, it meant down. We did see some downside action, but ultimately, we just went sideways.
The second divergence (2) indicated by the upsloping red line on price action is a bearish divergence. As we know, bearish divergence signals a possible trend reversal. In this case, it means down. Again, we are going sideways, and we may continue sideways and consolidate for the next little while.
Does this mean Bitcoin will stay at 42.8k for the entire weekend? What a sight that would be. But the answer is no, we're going to see fluctuations in price, that's inevitable.
It's likely that we do hang out between 41-44k this weekend though.
It's the weekend! What does that mean? It means there's the possibility for a CME gap to form. Although not all gaps fill, they do tend to. With that said, it's much better if we do not see a pump through the weekend. Almost every single time we pump over the weekend and form a gap, we do more often than not, fall to close the gap and continue our descent down.
All in all, Bitcoin still remains more bearish than bullish. For the bullish scenario, we ideally do not want to see a pump until at least Sunday evening when the CME opens.
For premium members: Keep an eye out over the next few hours for the Bonus Report that will cover the 200-day SMA, Bitcoin Logarithmic Curve and Death/Golden Crosses!
That's all for now! If you have any questions, post them in Discord.
I hope you have a great day/night!
Cheers!
Premium Information – Visit the link below
https://www.buymeacoffee.com/bitcoincharts
Canadian Thanksgiving is around the corner on October 11th, and starting from today until the end of day October 11th, I’ll be offering a 3-month 5% off deal for all tiers. DM me on Twitter if you'd like to learn more.
–There will also be a giveaway in the coming weeks, and more discounts in the future. So keep your eye out if you enjoy this content.
–Here are some of the Diamond members' profits from today alone!