
Premium Membership
For information on the different premium memberships, please visit: https://www.buymeacoffee.com/MICKrypto
To take advantage of the Canadian Thanksgiving Sale, please follow the instructions in this link: https://www.buymeacoffee.com/MICKrypto/thanksgiving-sale
*I recommend reading these summaries on the Buy Me A Coffee platform.
You will find the content below in this order:
1. Definitions
2. The Good
3. The Bad
4. Key Levels
5. Final Thoughts
.
.
.
DEFINITIONS
Liquidity zones are high volume levels that offer support and resistance
Hidden bearish divergence: creating a lower high in price, with a higher high on the oscillators. This signals a possible trend continuation down.
Bearish divergence: higher high in price, lower high on the oscillators. This signals a possible trend reversal down.
Hidden bullish divergence: creating a higher low in price, with a lower low on the oscillators. This signals a possible trend continuation up.
Bullish divergence: creating a lower low in price, with a higher low on the oscillators. This signals a possible trend reversal up.
SR flip: turning old resistance into support, and vice-versa.
Fractal: recurring geometric pattern.
Price action (PA): the movement of an asset's price over time.
THE GOOD
Bullish Fractal
If Bitcoin continues its ascent, this is a possible fractal we may see play out.
4H Timeframe
Key Liquidity Zone
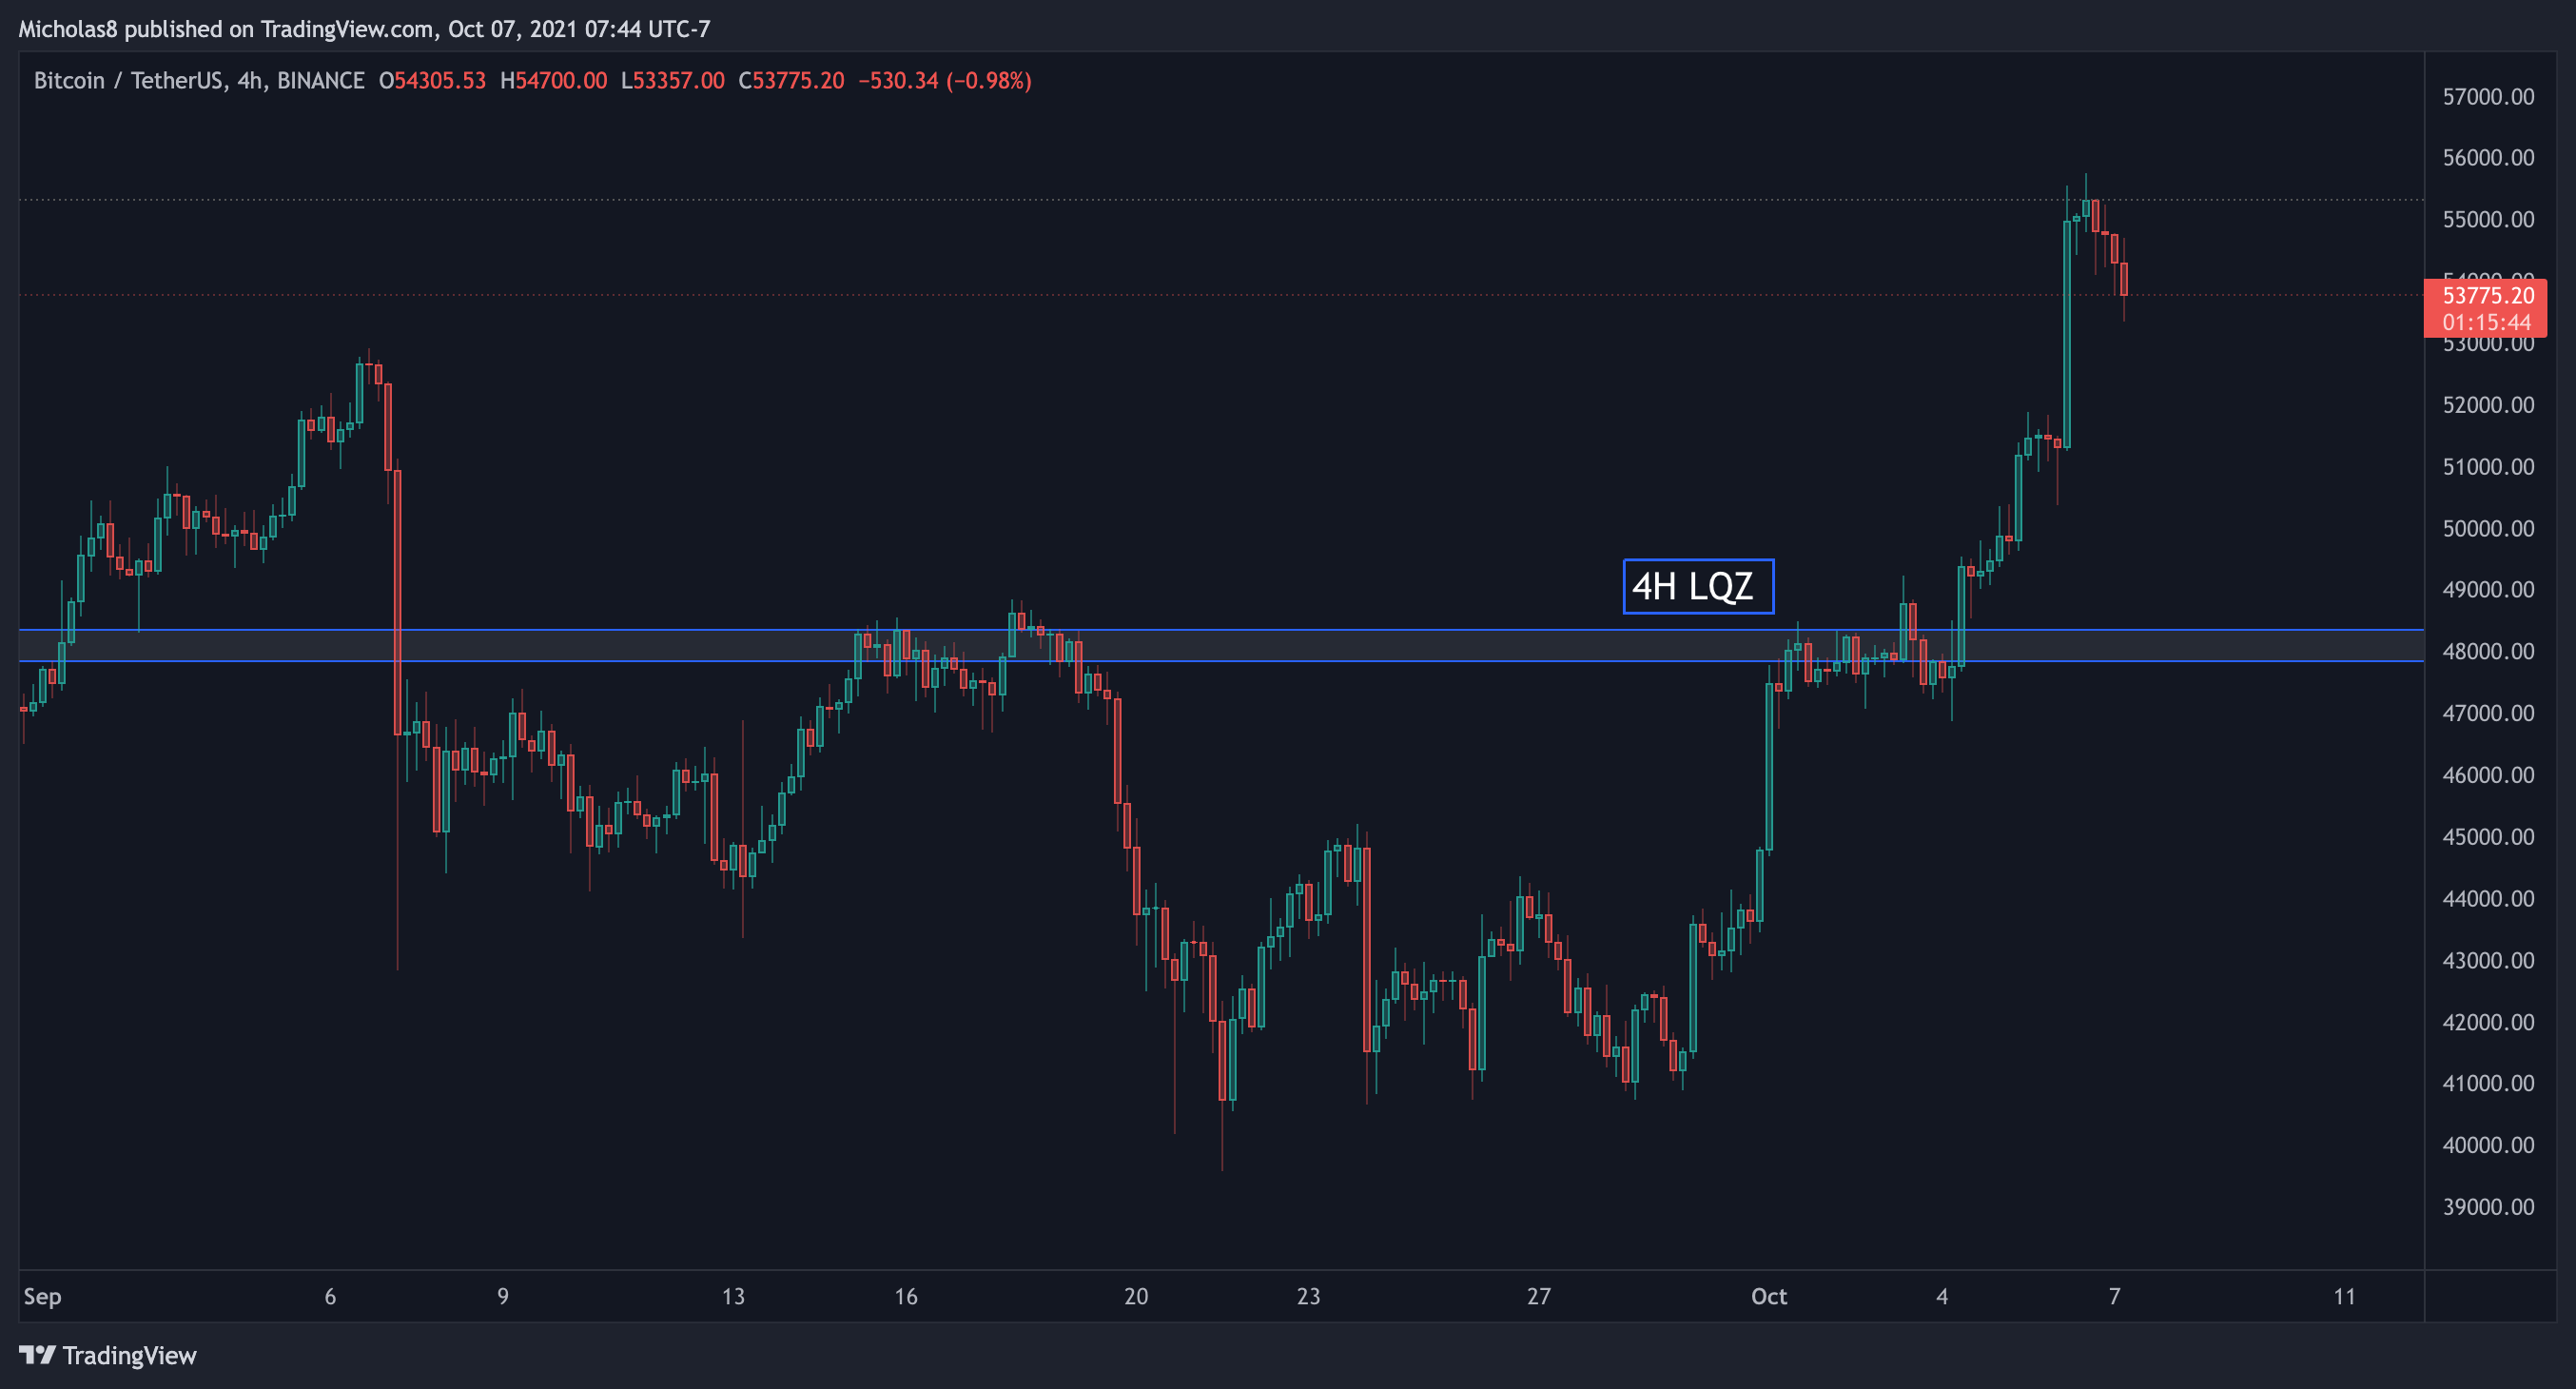
Bitcoin continues to trade above the LQZ in this timeframe, which now sits at 47.9k - 48.4k. The longer we trade above it, the higher the LQZ will be.
Implications: The majority of the liquidity in this timeframe rests below the current price of Bitcoin. Ideally, it will serve as support moving forward.
Simple Moving Averages (SMA): 20, 50 and 200
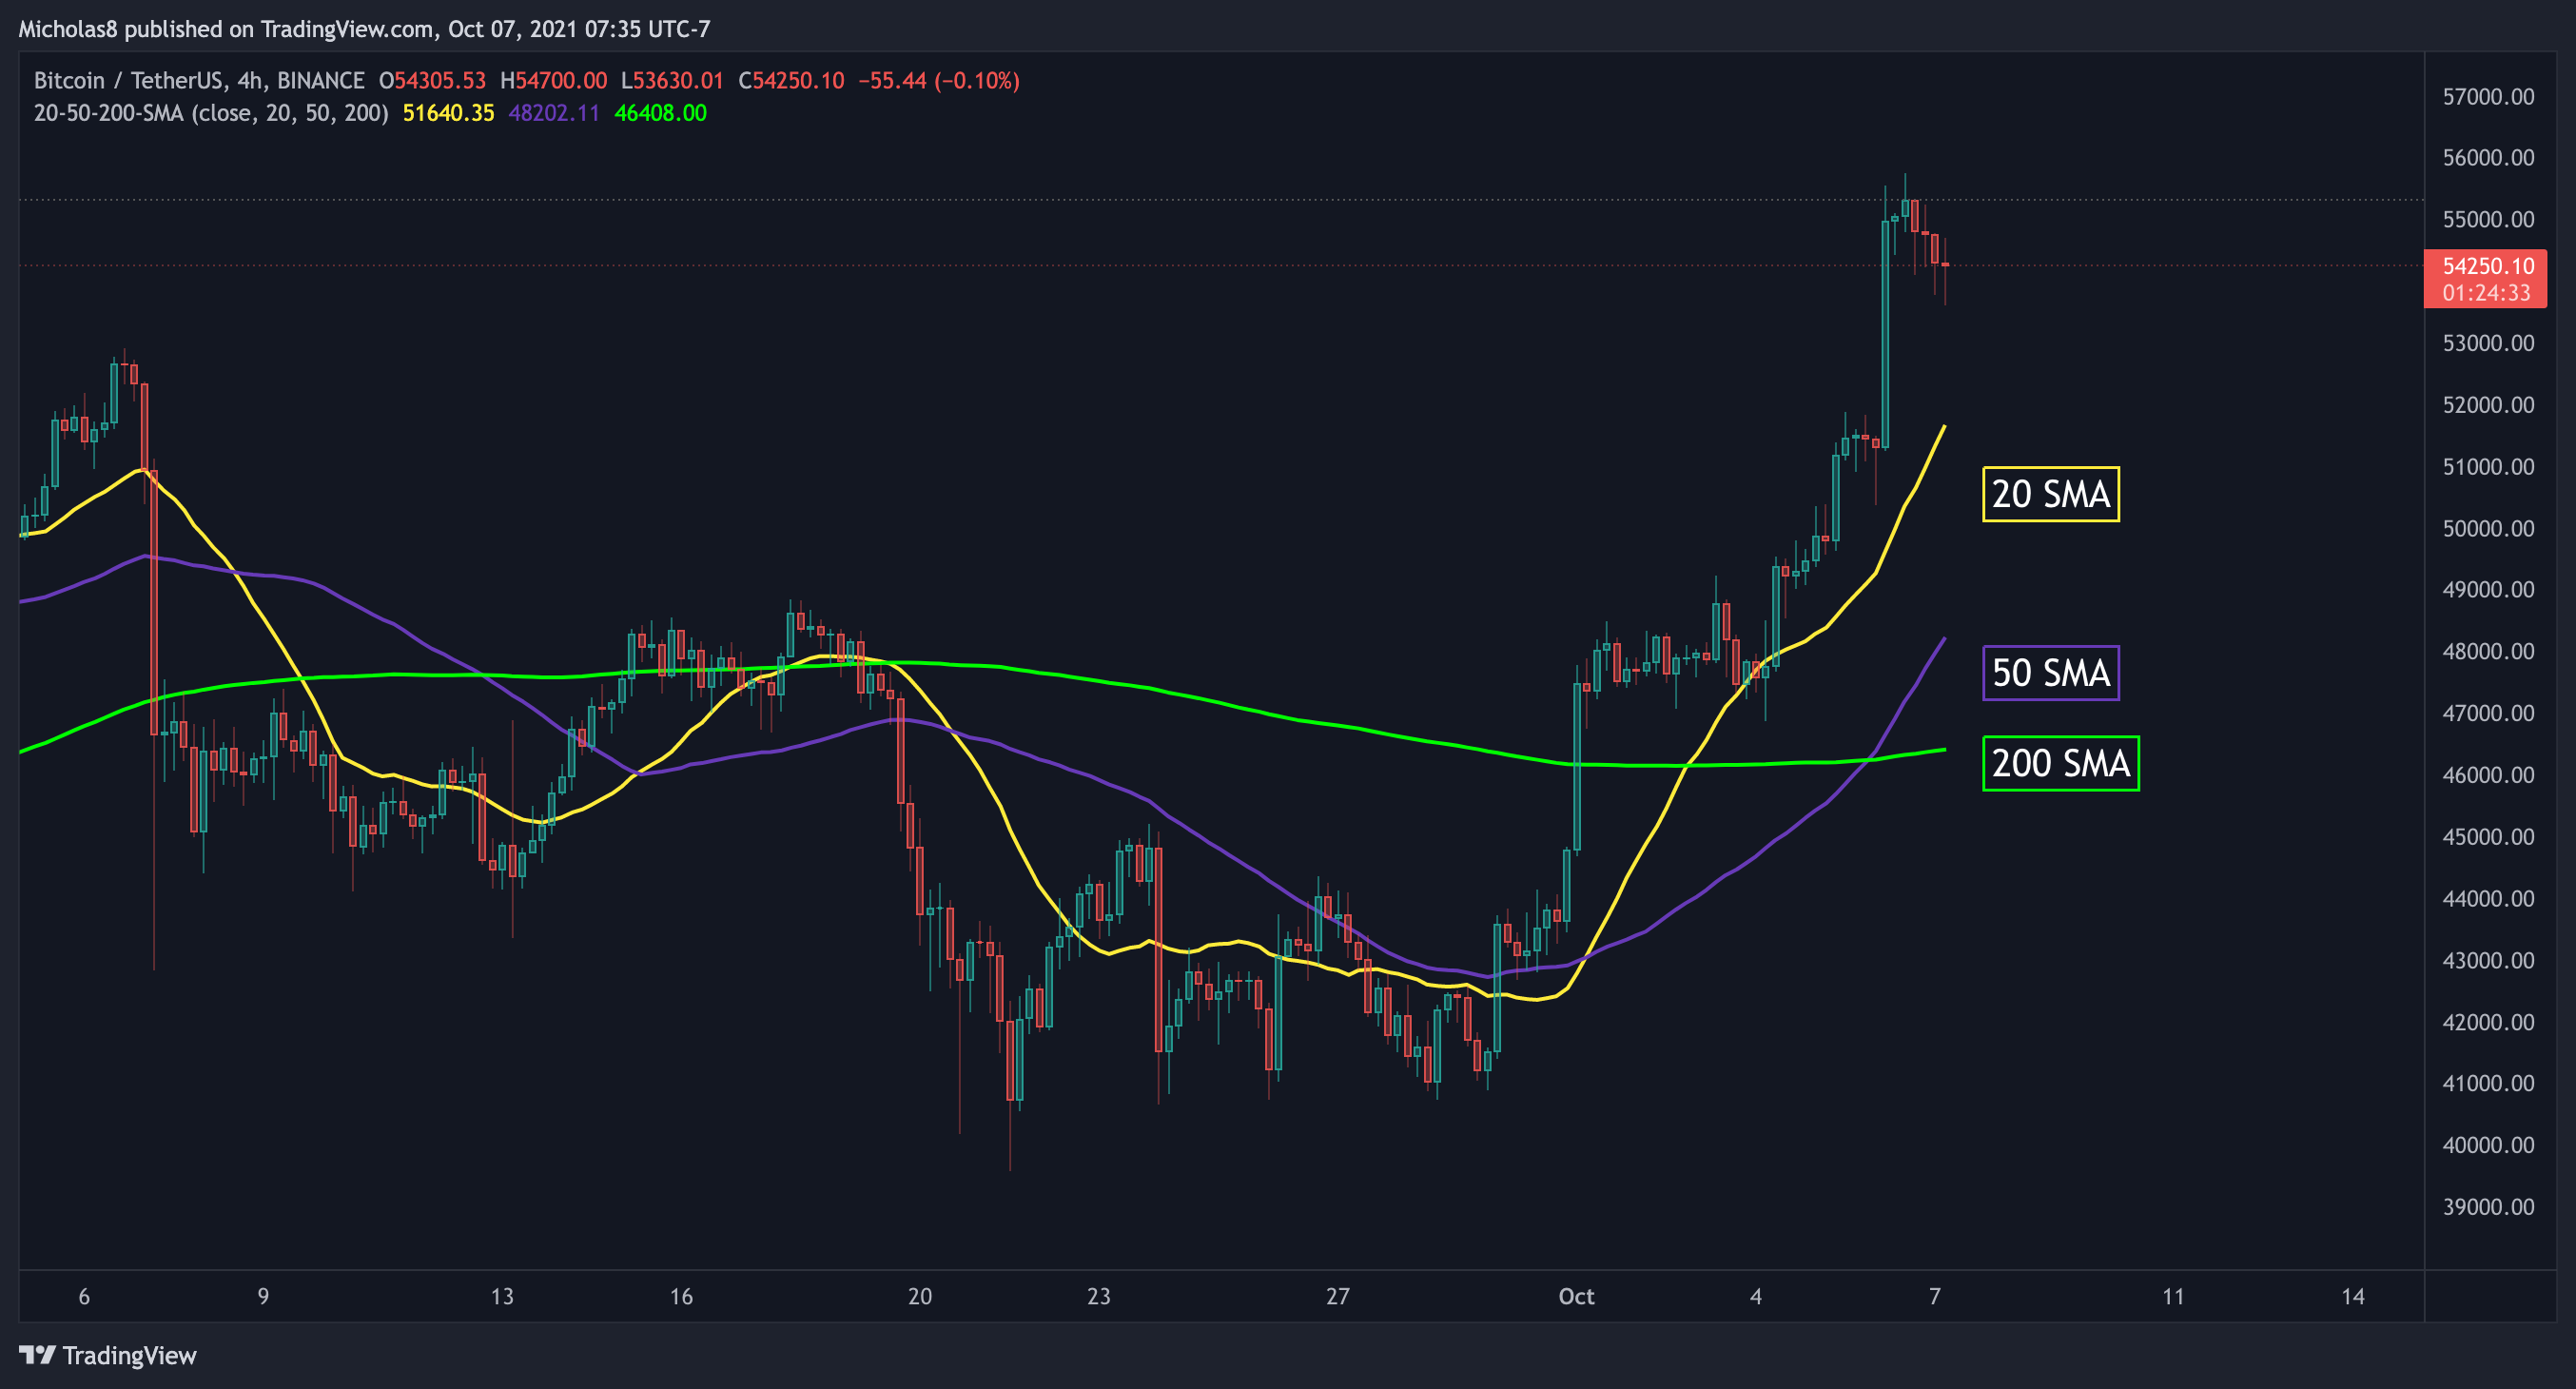
Bitcoin has reclaimed all of these SMAs, and we've seen a Golden Cross between the 50 SMA and the 200 SMA.
Implication: The bulls are showing some serious strength behind this recent move up. Ideally, they serve as support the next time we test them.
EMA Ribbon
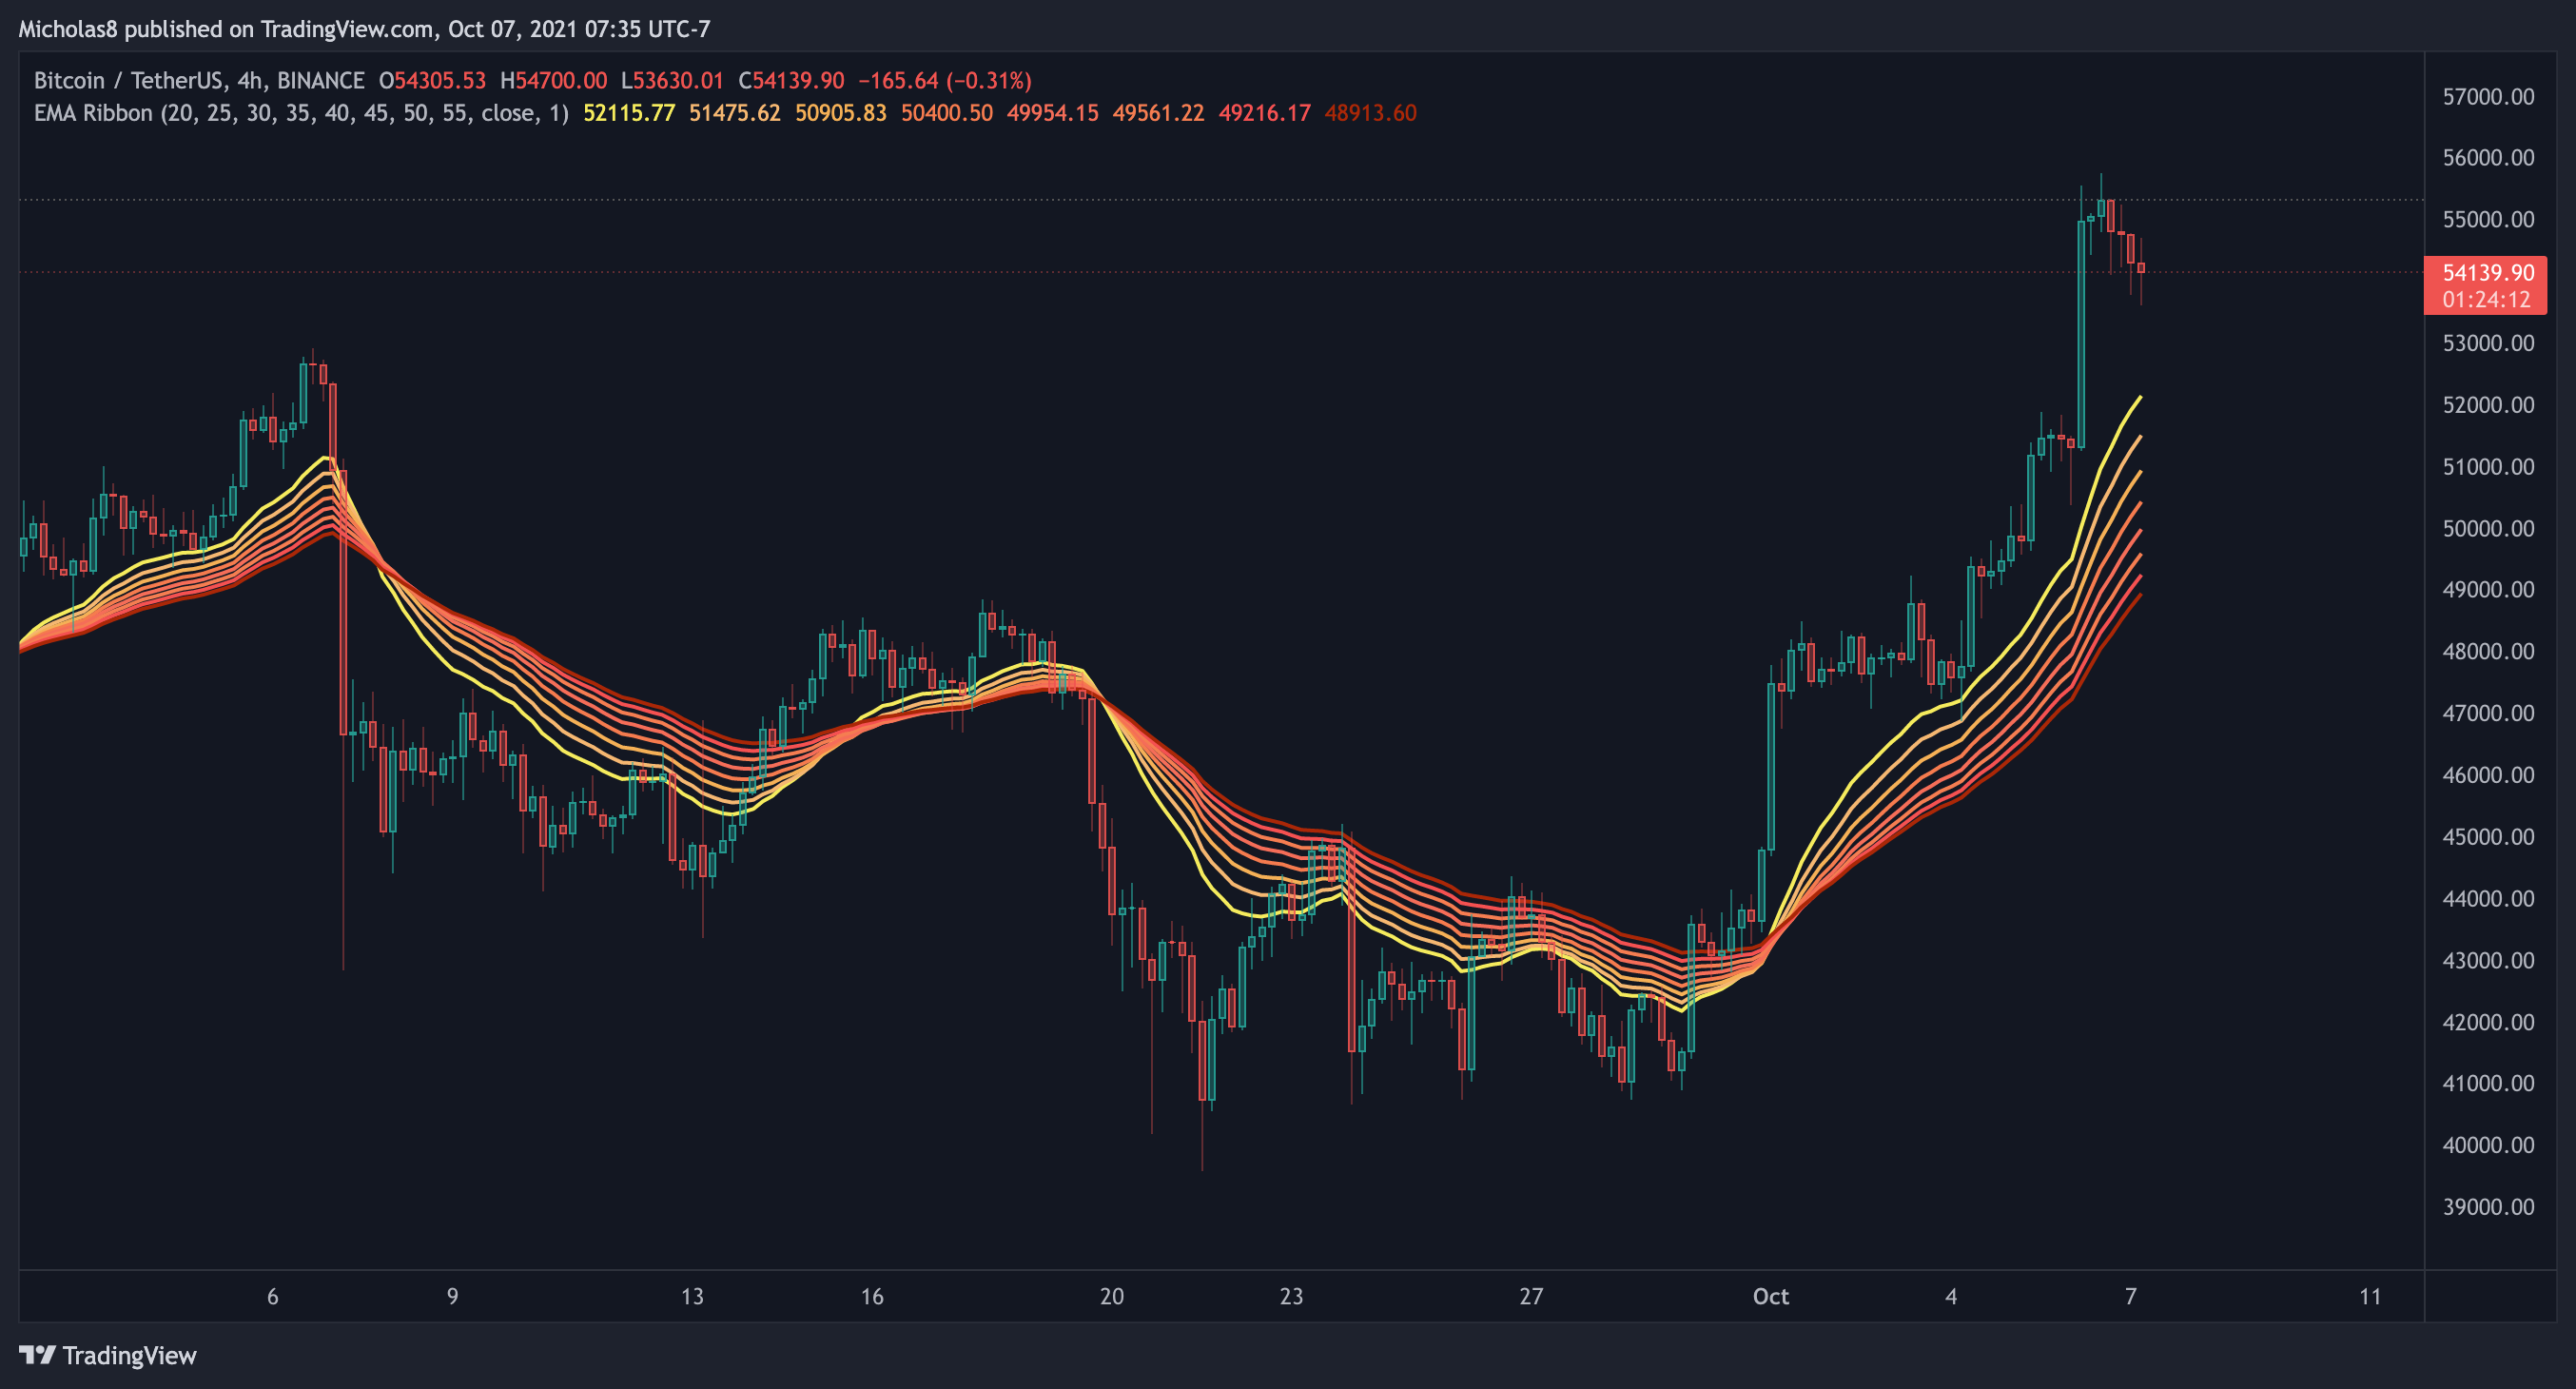
We have seen the separation needed with this most recent bullish rise.
Implication: The bulls have been in complete control of this timeframe. Ideally, this will serve as a level of support.
Divergences
Potential Hidden Bullish Divergence (green)
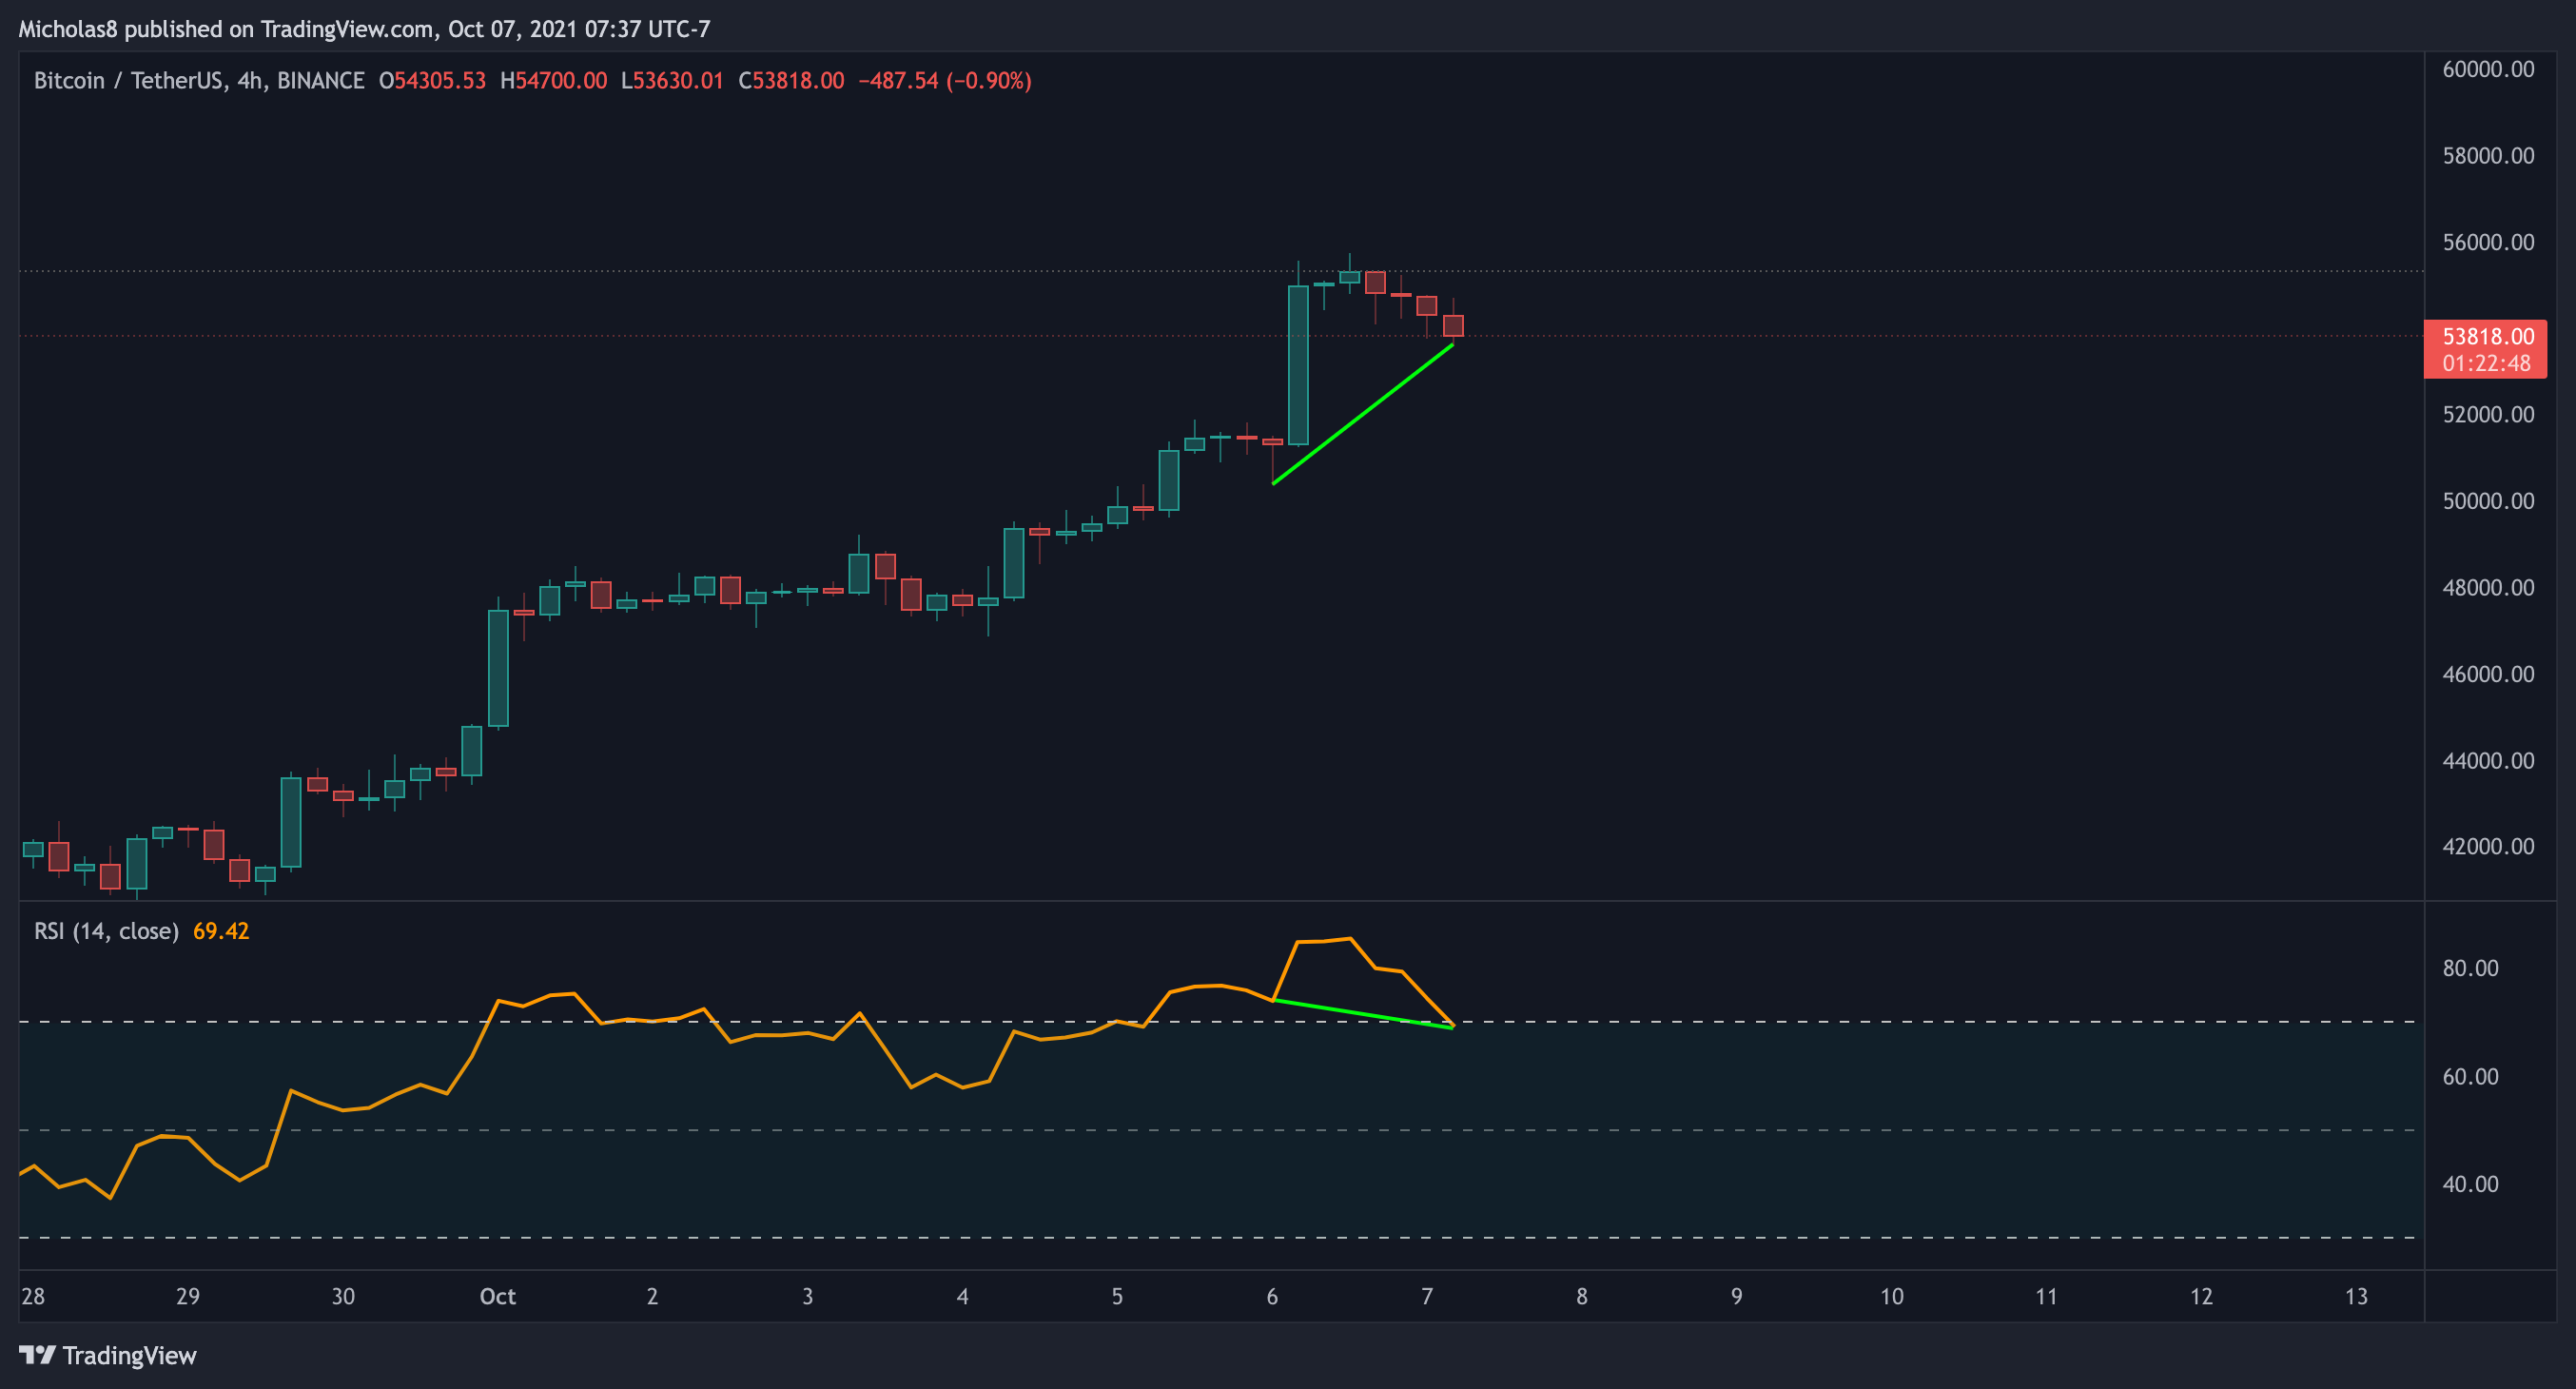
We have a higher low in price, with a lower low in the RSI. This is a hidden bullish divergence, which signals a possible trend continuation. In this case, that means up.
Invalidation: Lower low in price, with a lower low in the RSI.
1H Timeframe
EMA Ribbon
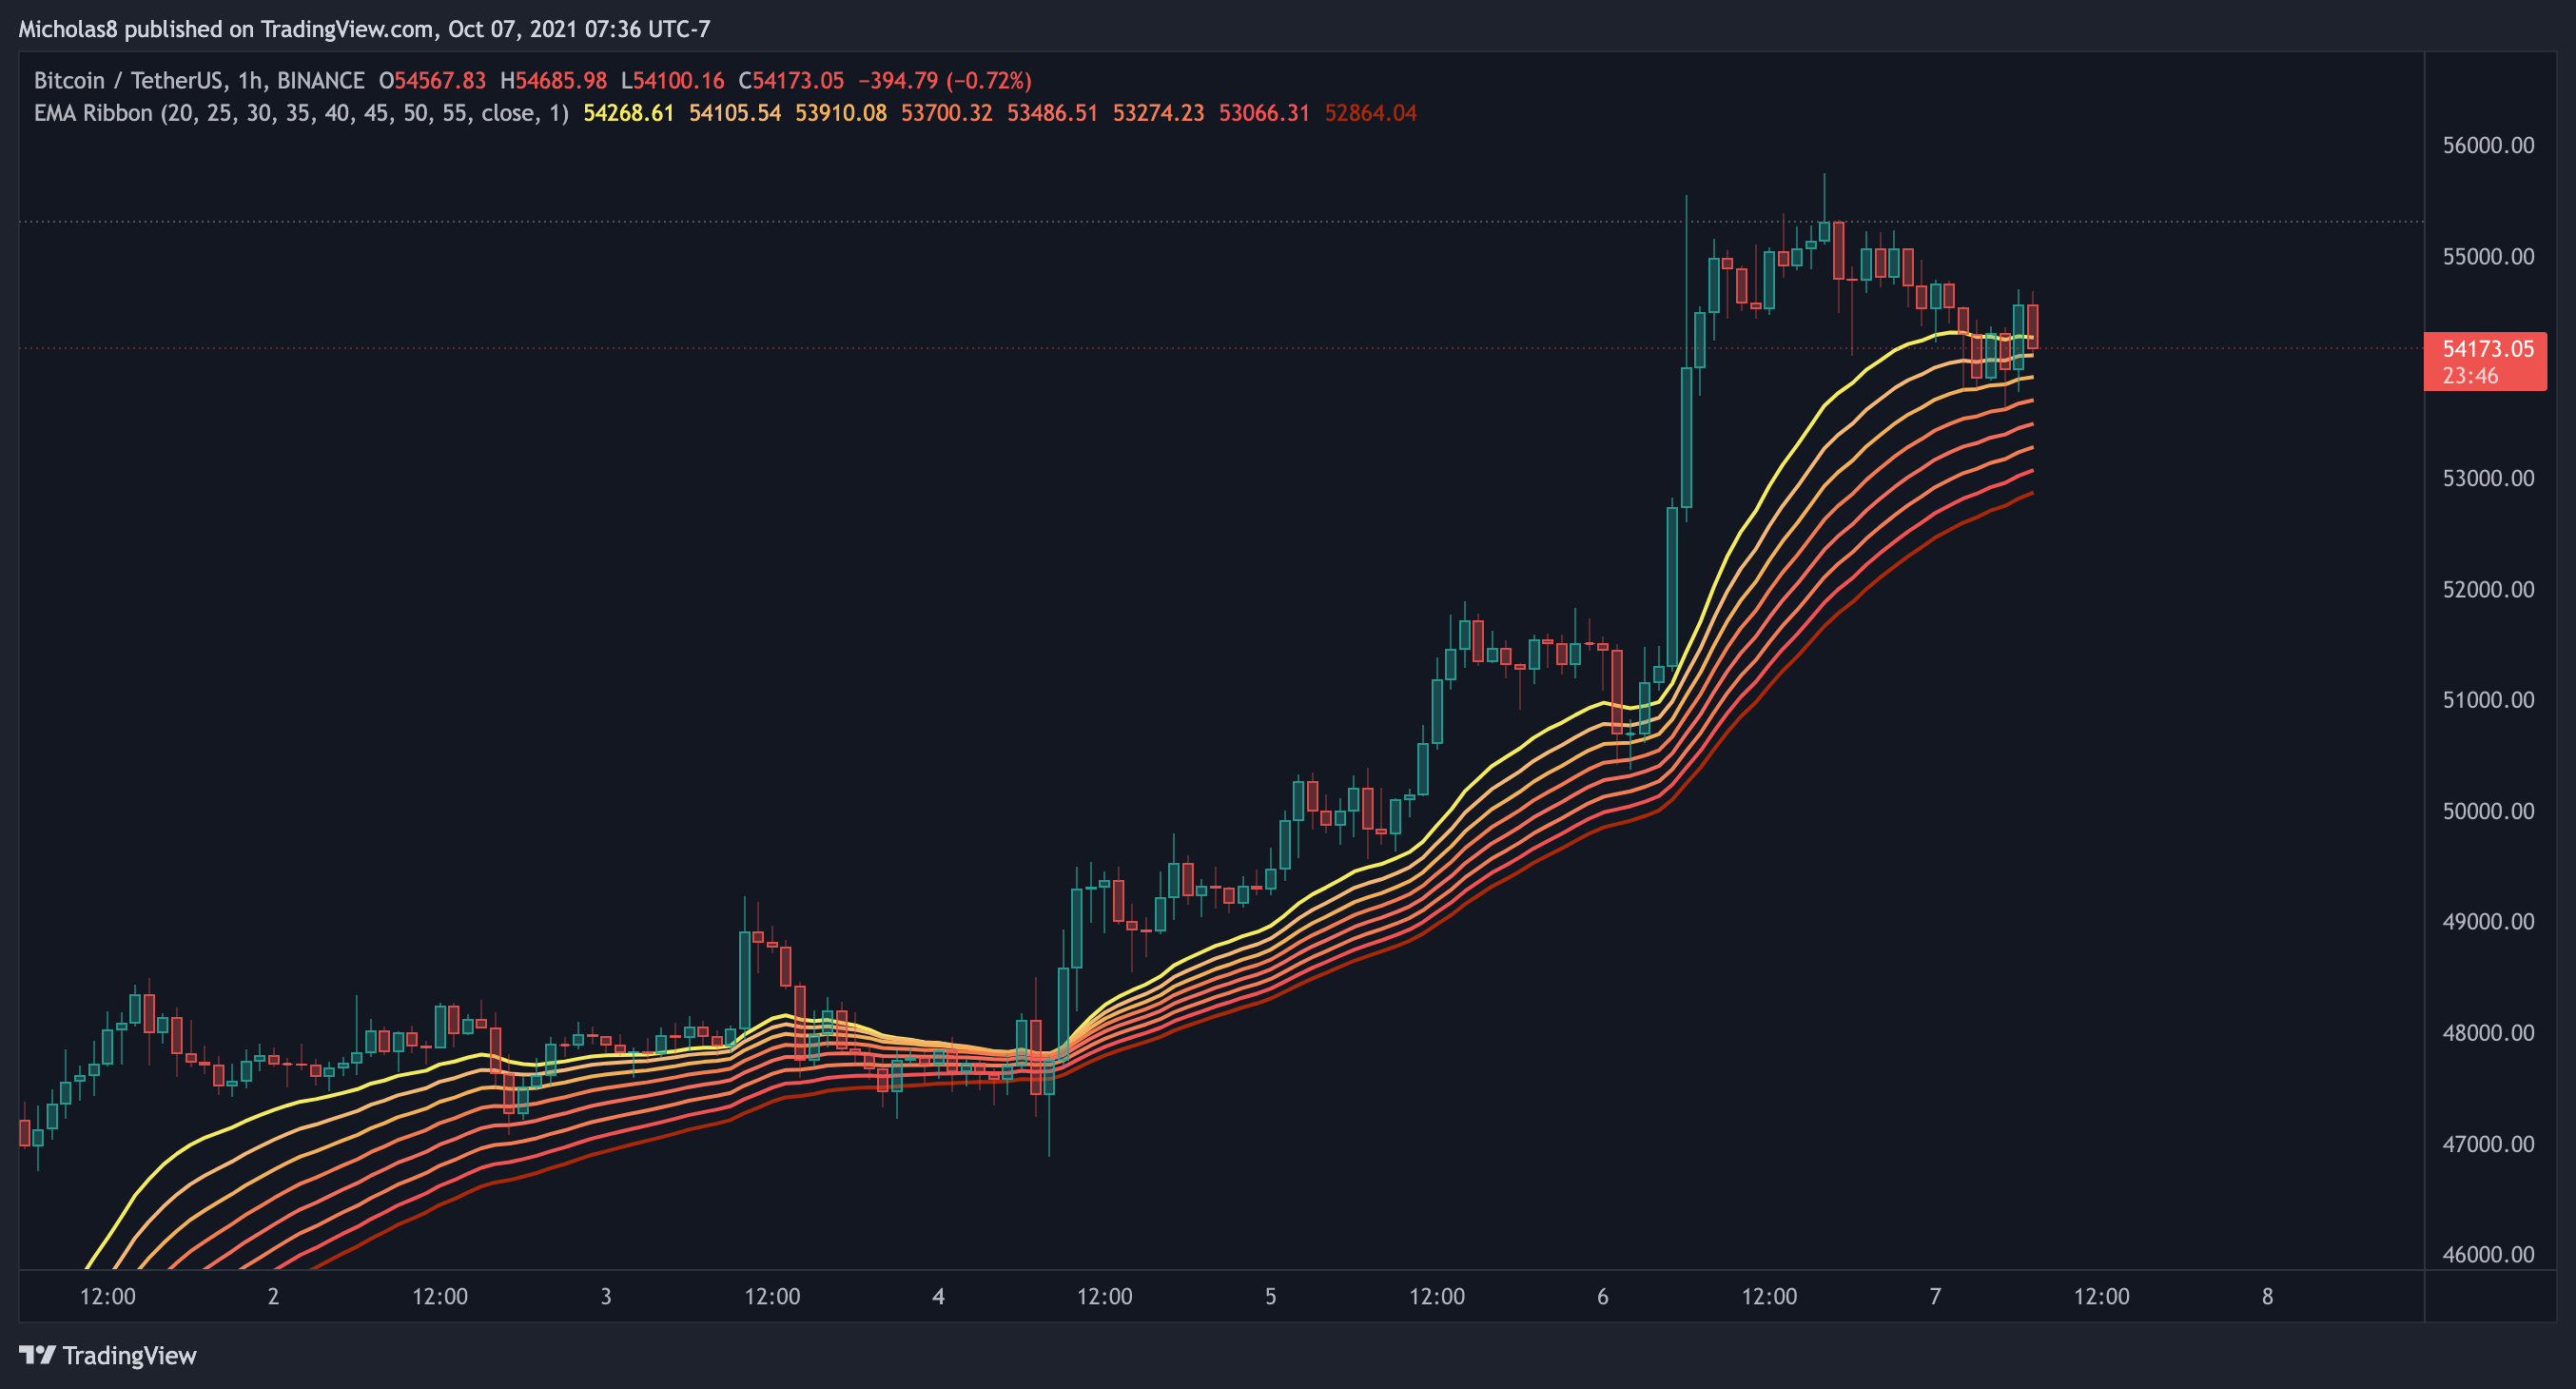
Bitcoin continues to trade above the EMA ribbon.
Implication: The momentum is with the bulls currently on this timeframe, and ideally, it will serve as support as it did it seems to be now.
Divergences
Potential Hidden Bullish Divergence (green)
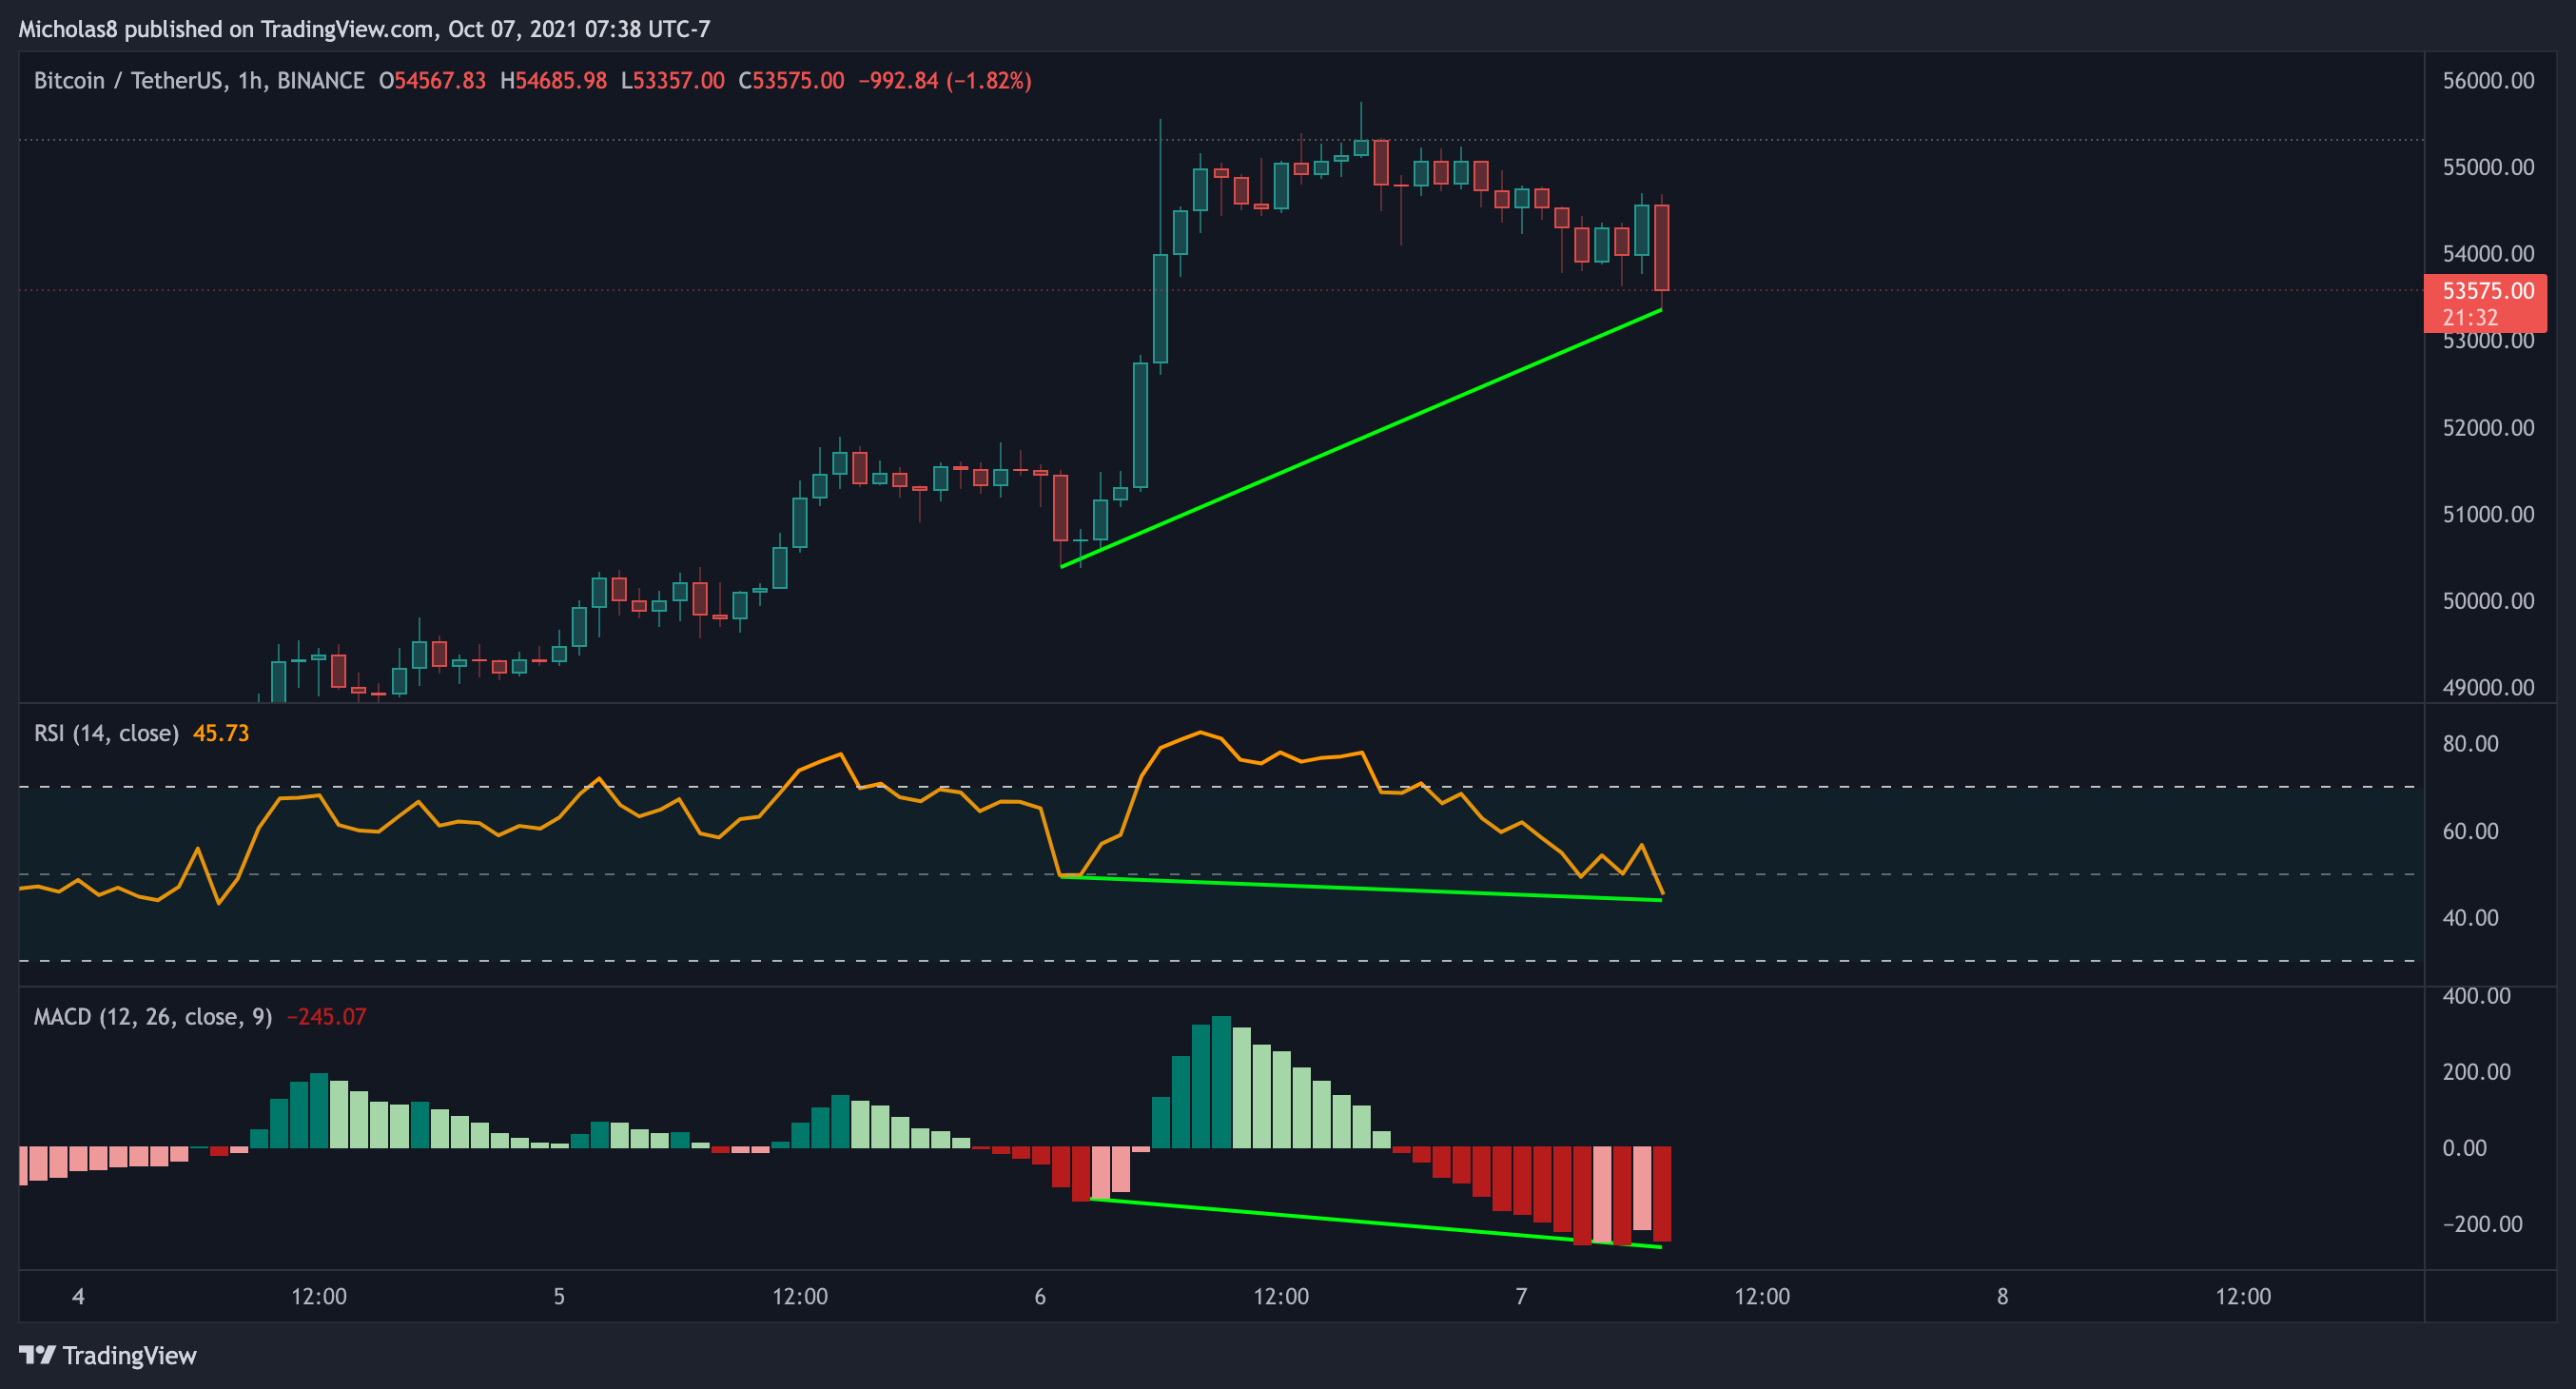
We have a higher low in price, with a lower low in the RSI/MACD. This is a hidden bullish divergence, which signals a possible trend continuation. In this case, that means up.
Invalidation: Lower low in price, with a lower low in the RSI/MACD.
THE BAD
3H Timeframe
Divergences
Bearish Divergence (red)
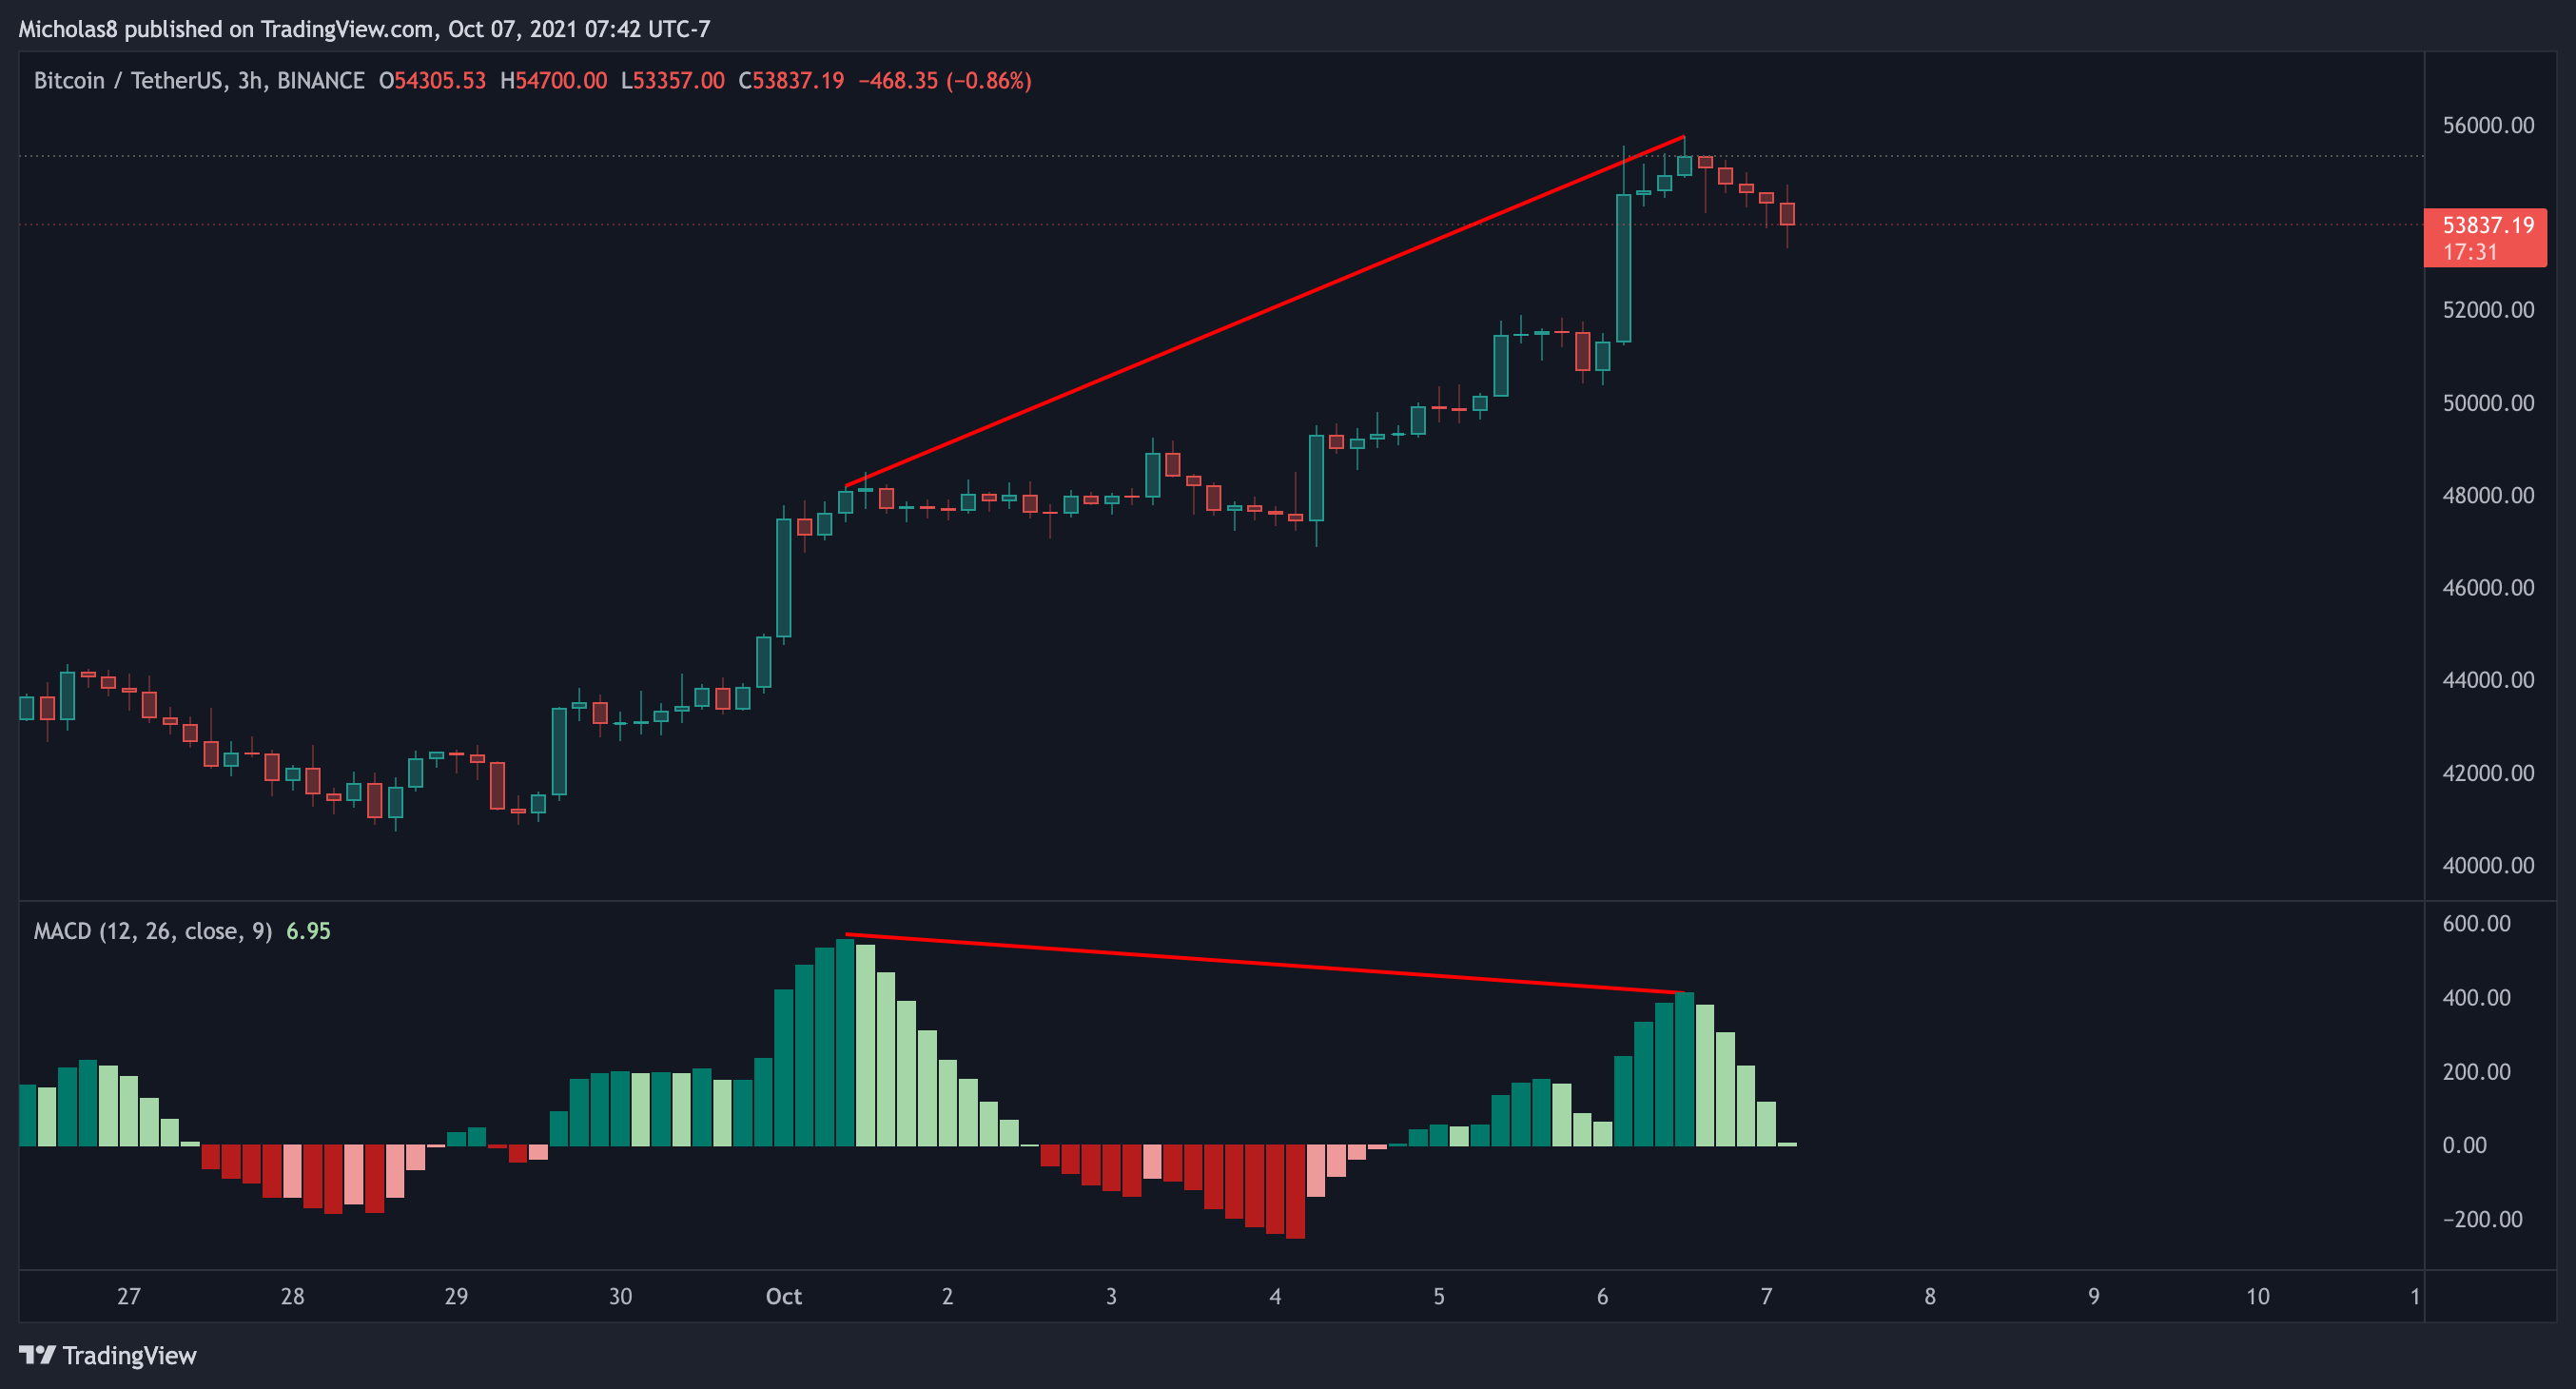
We have a higher high in price, with a lower high on the MACD. This is a bearish divergence, which signals a possible trend reversal. In this case, that means down.
Invalidation: Higher high in price with a higher high in the MACD.
KEY LEVELS
4-hour Timeframe
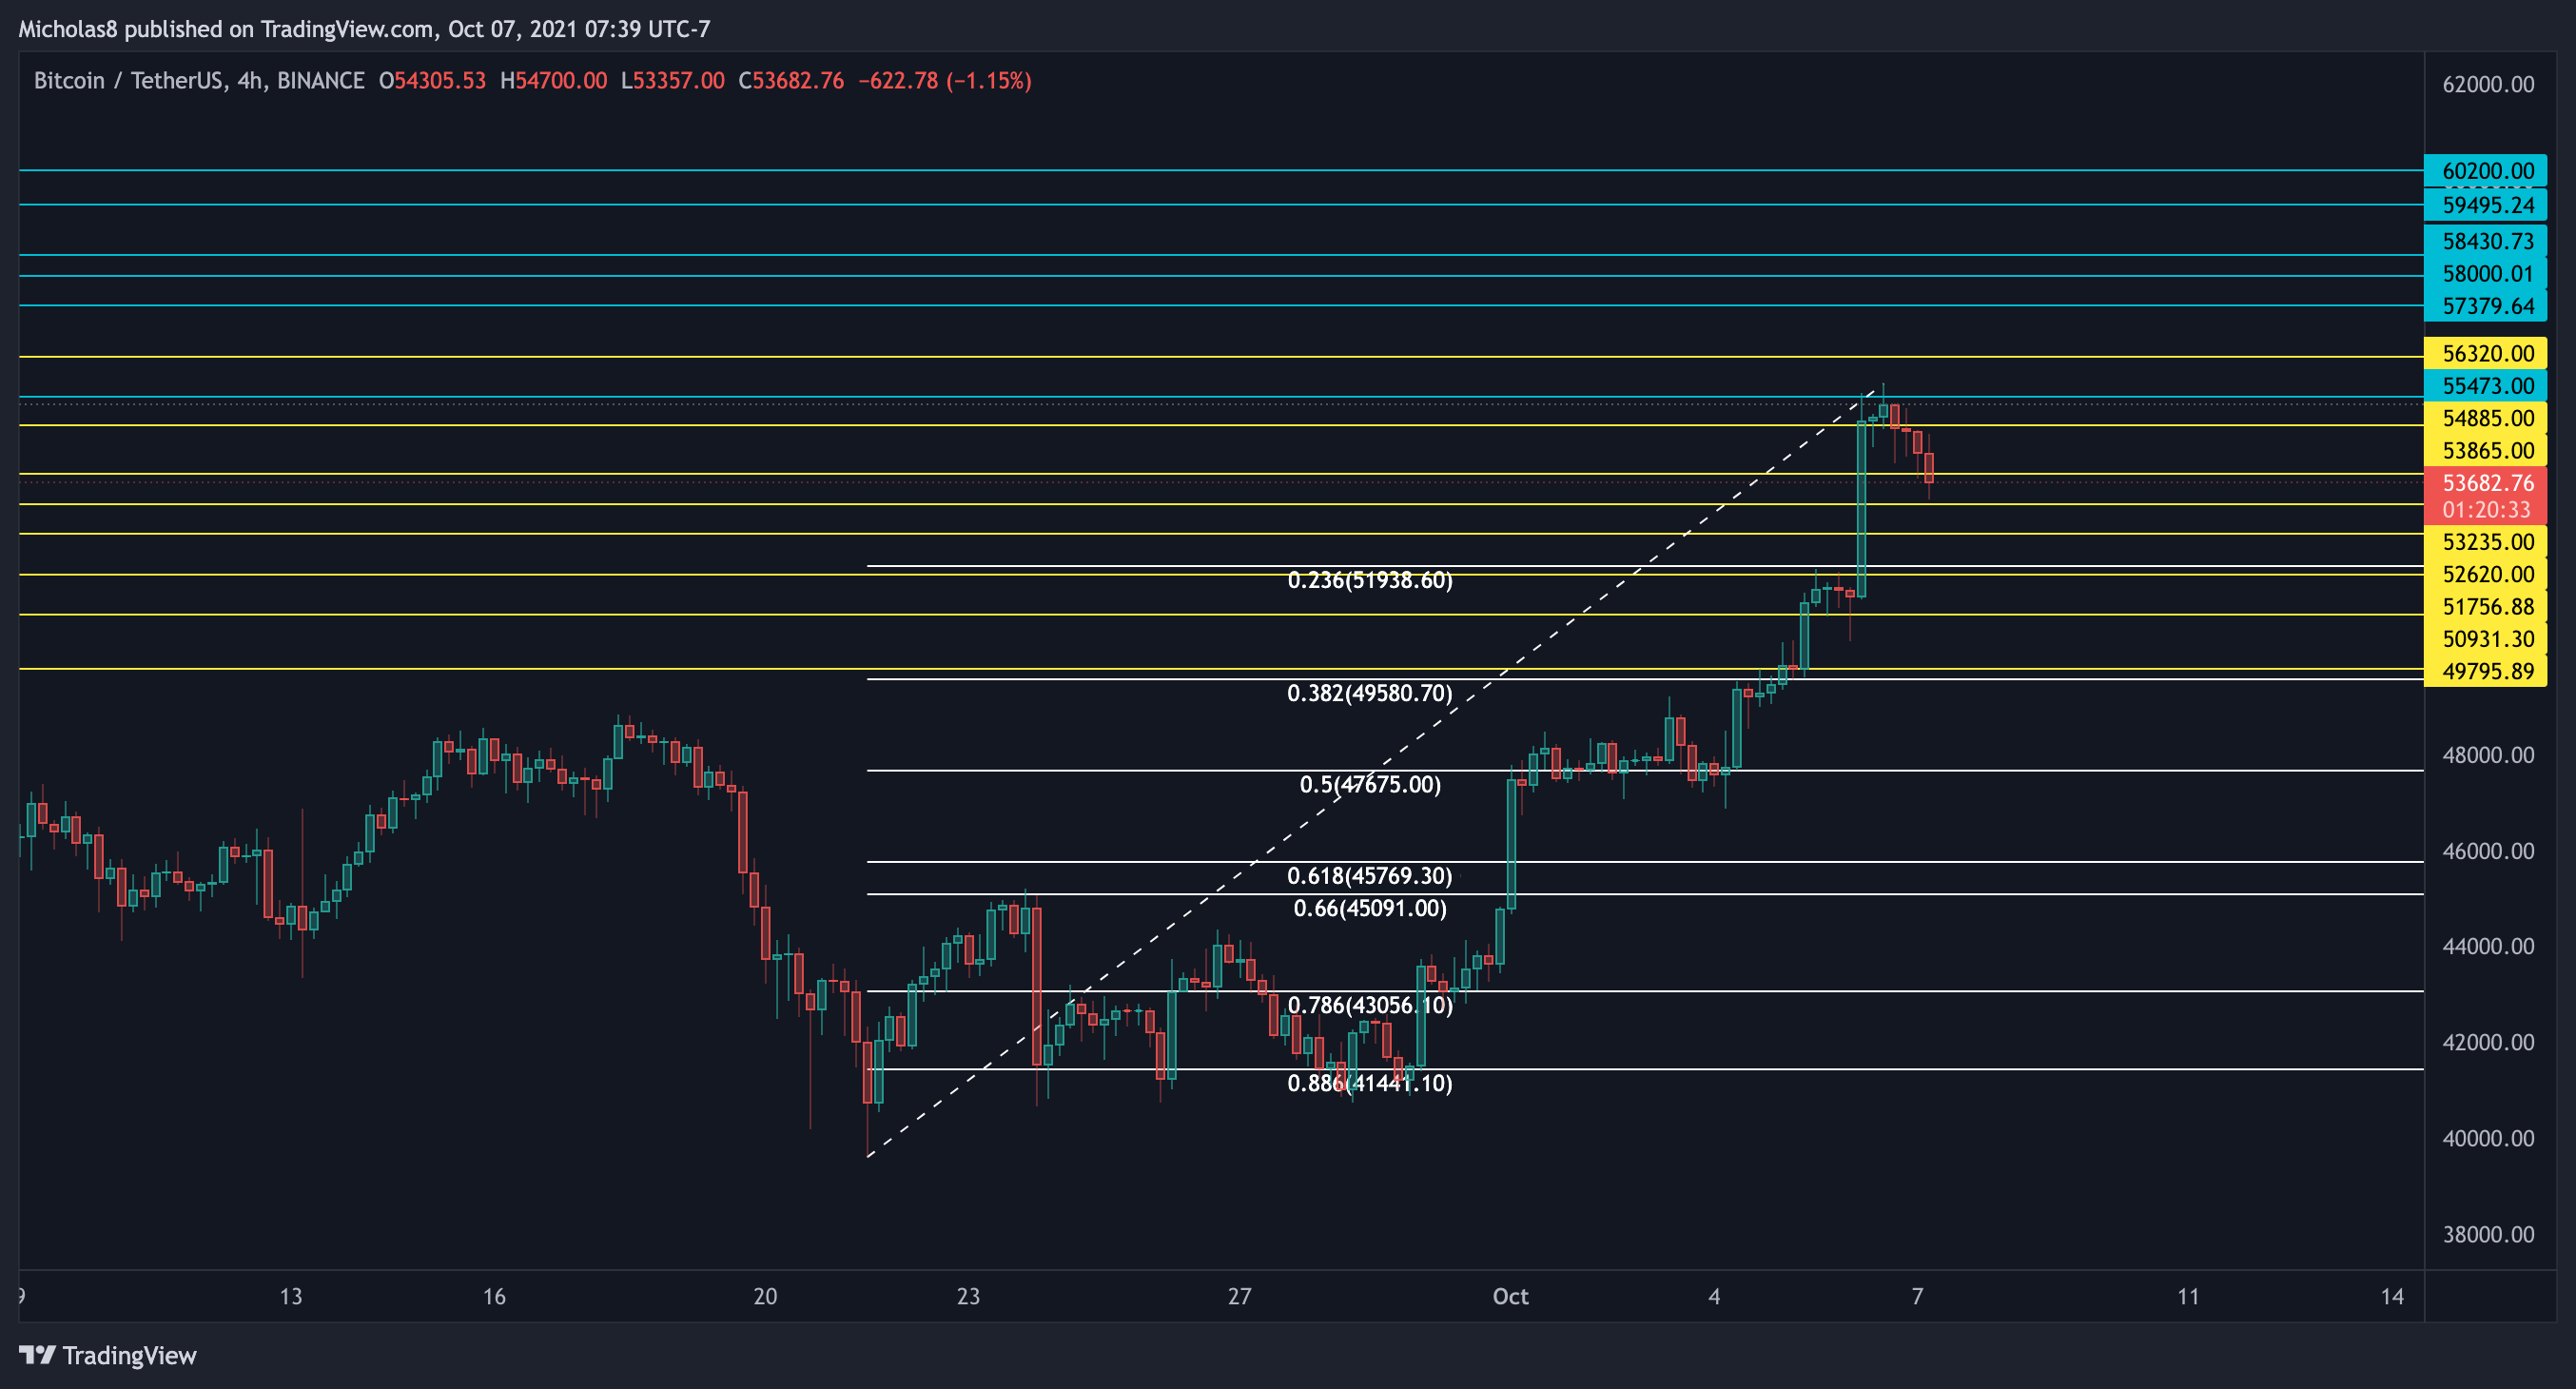
49795
50930
51755
52620
53235
53865
54885
55473
56320
57380
58000
58430
59500
60000
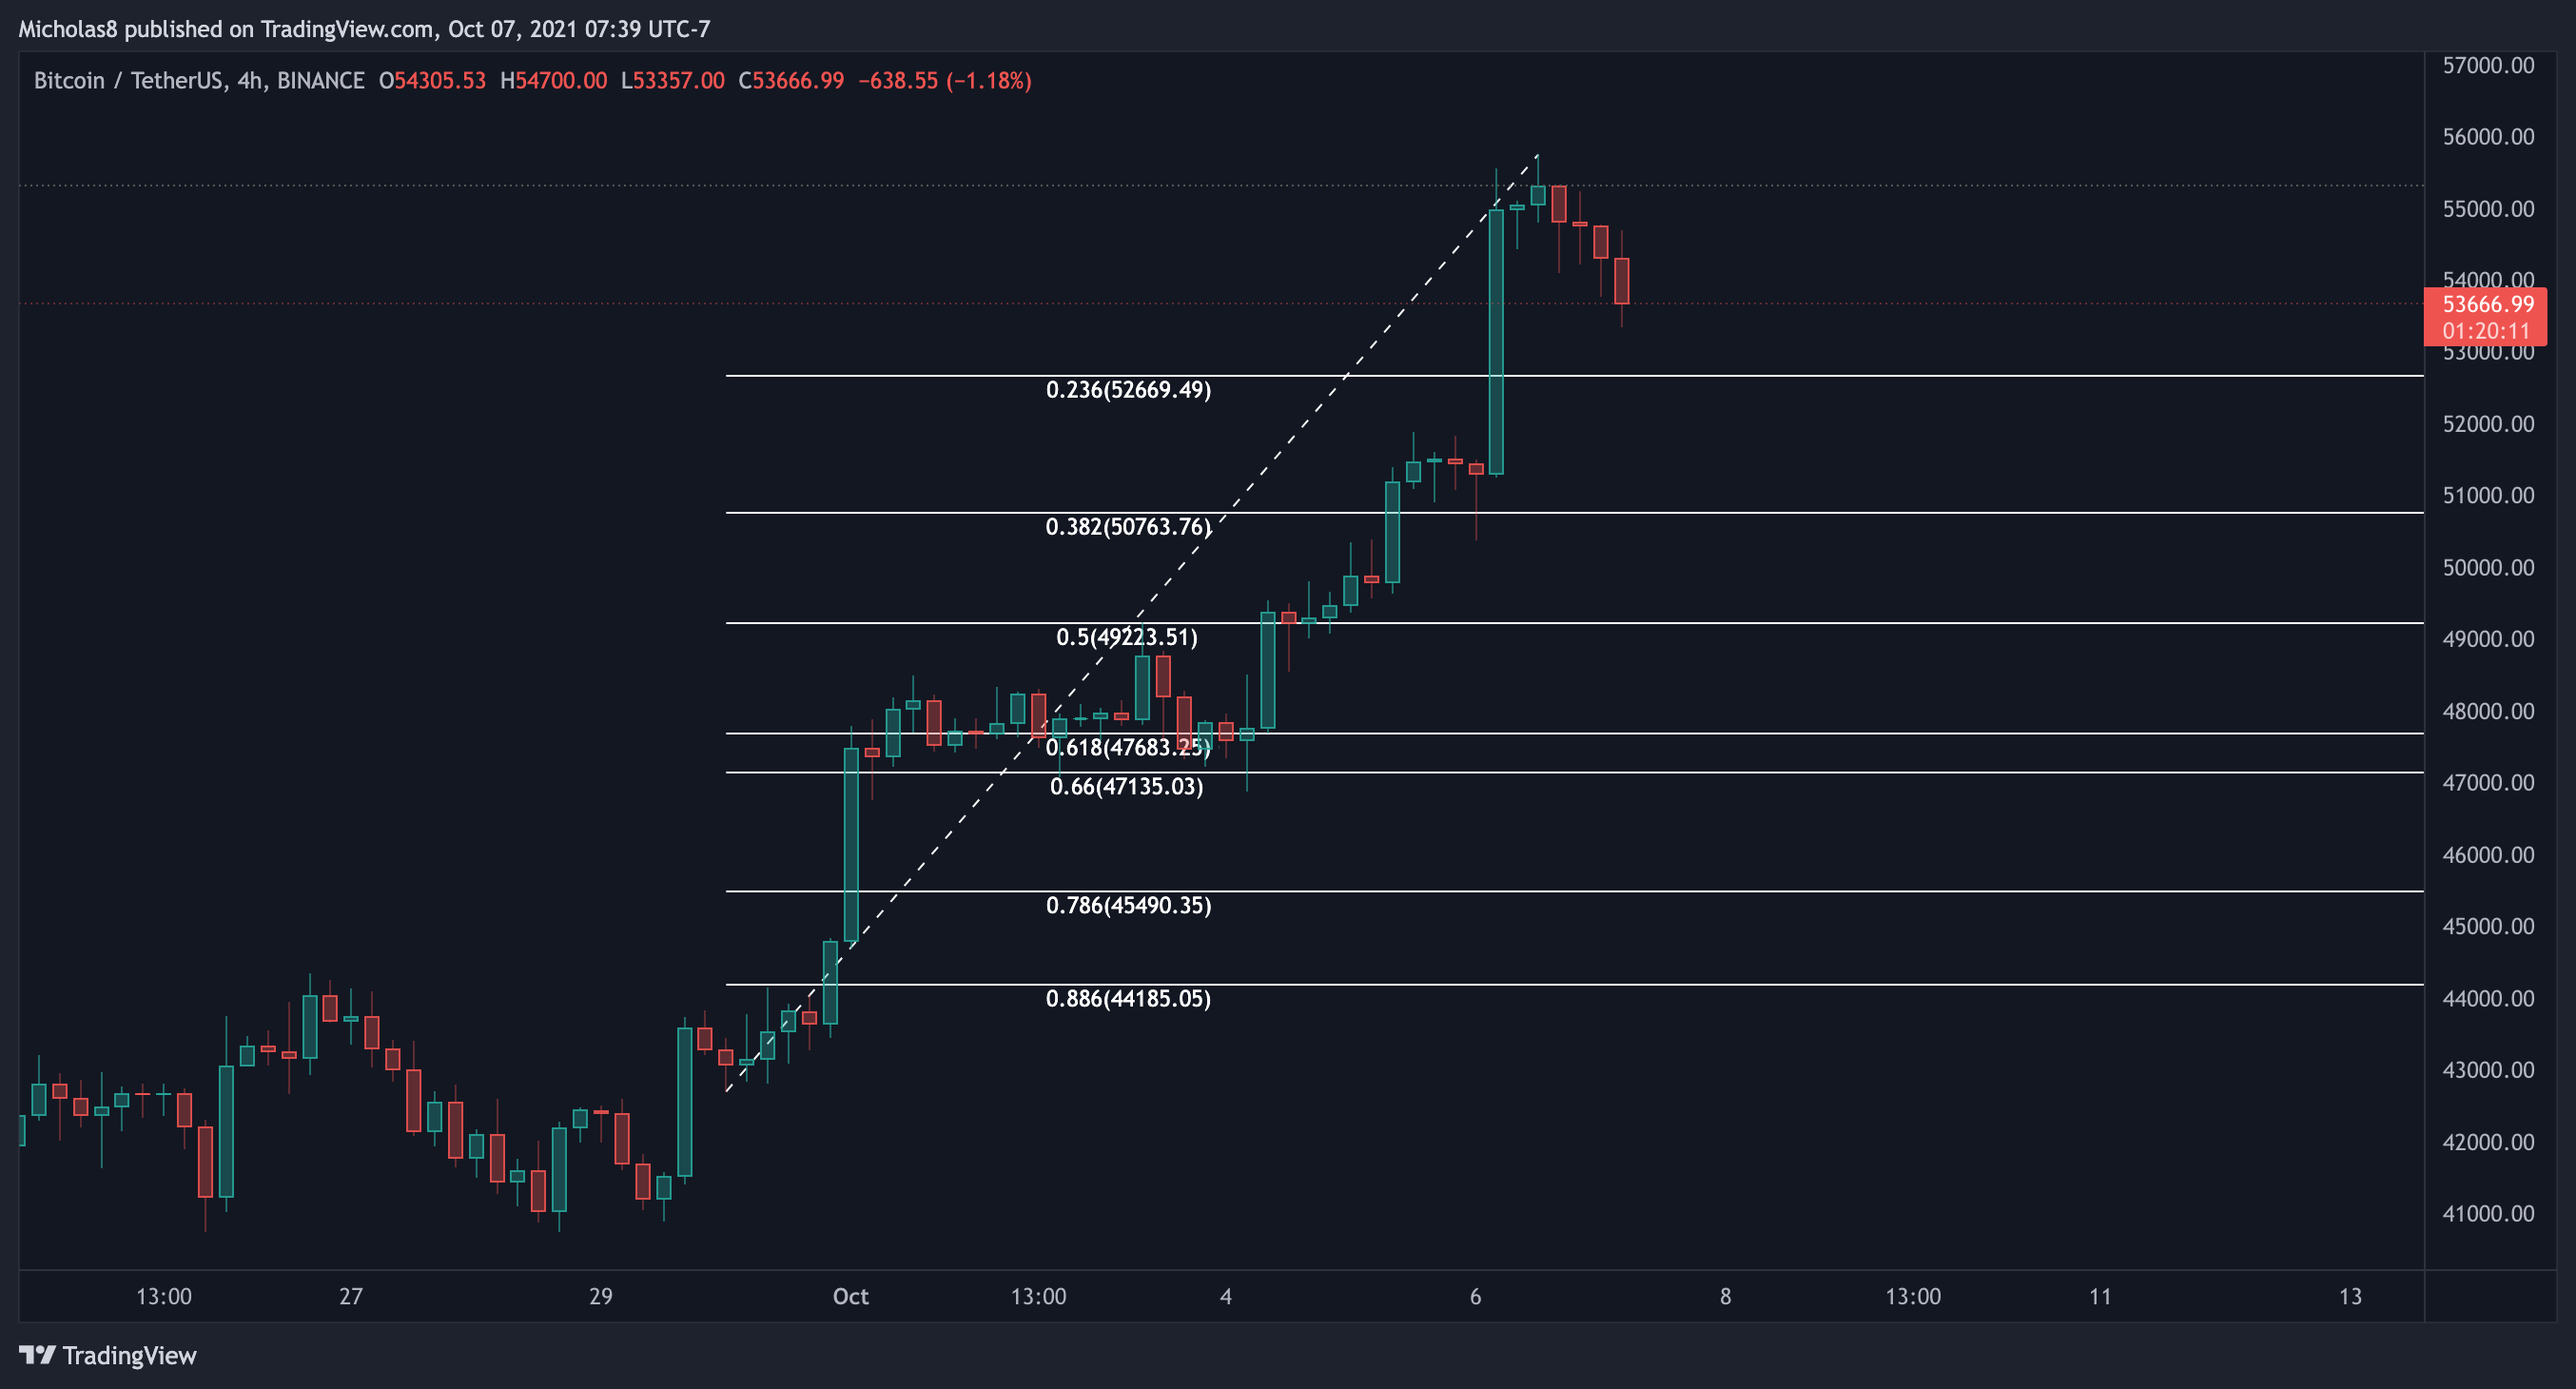
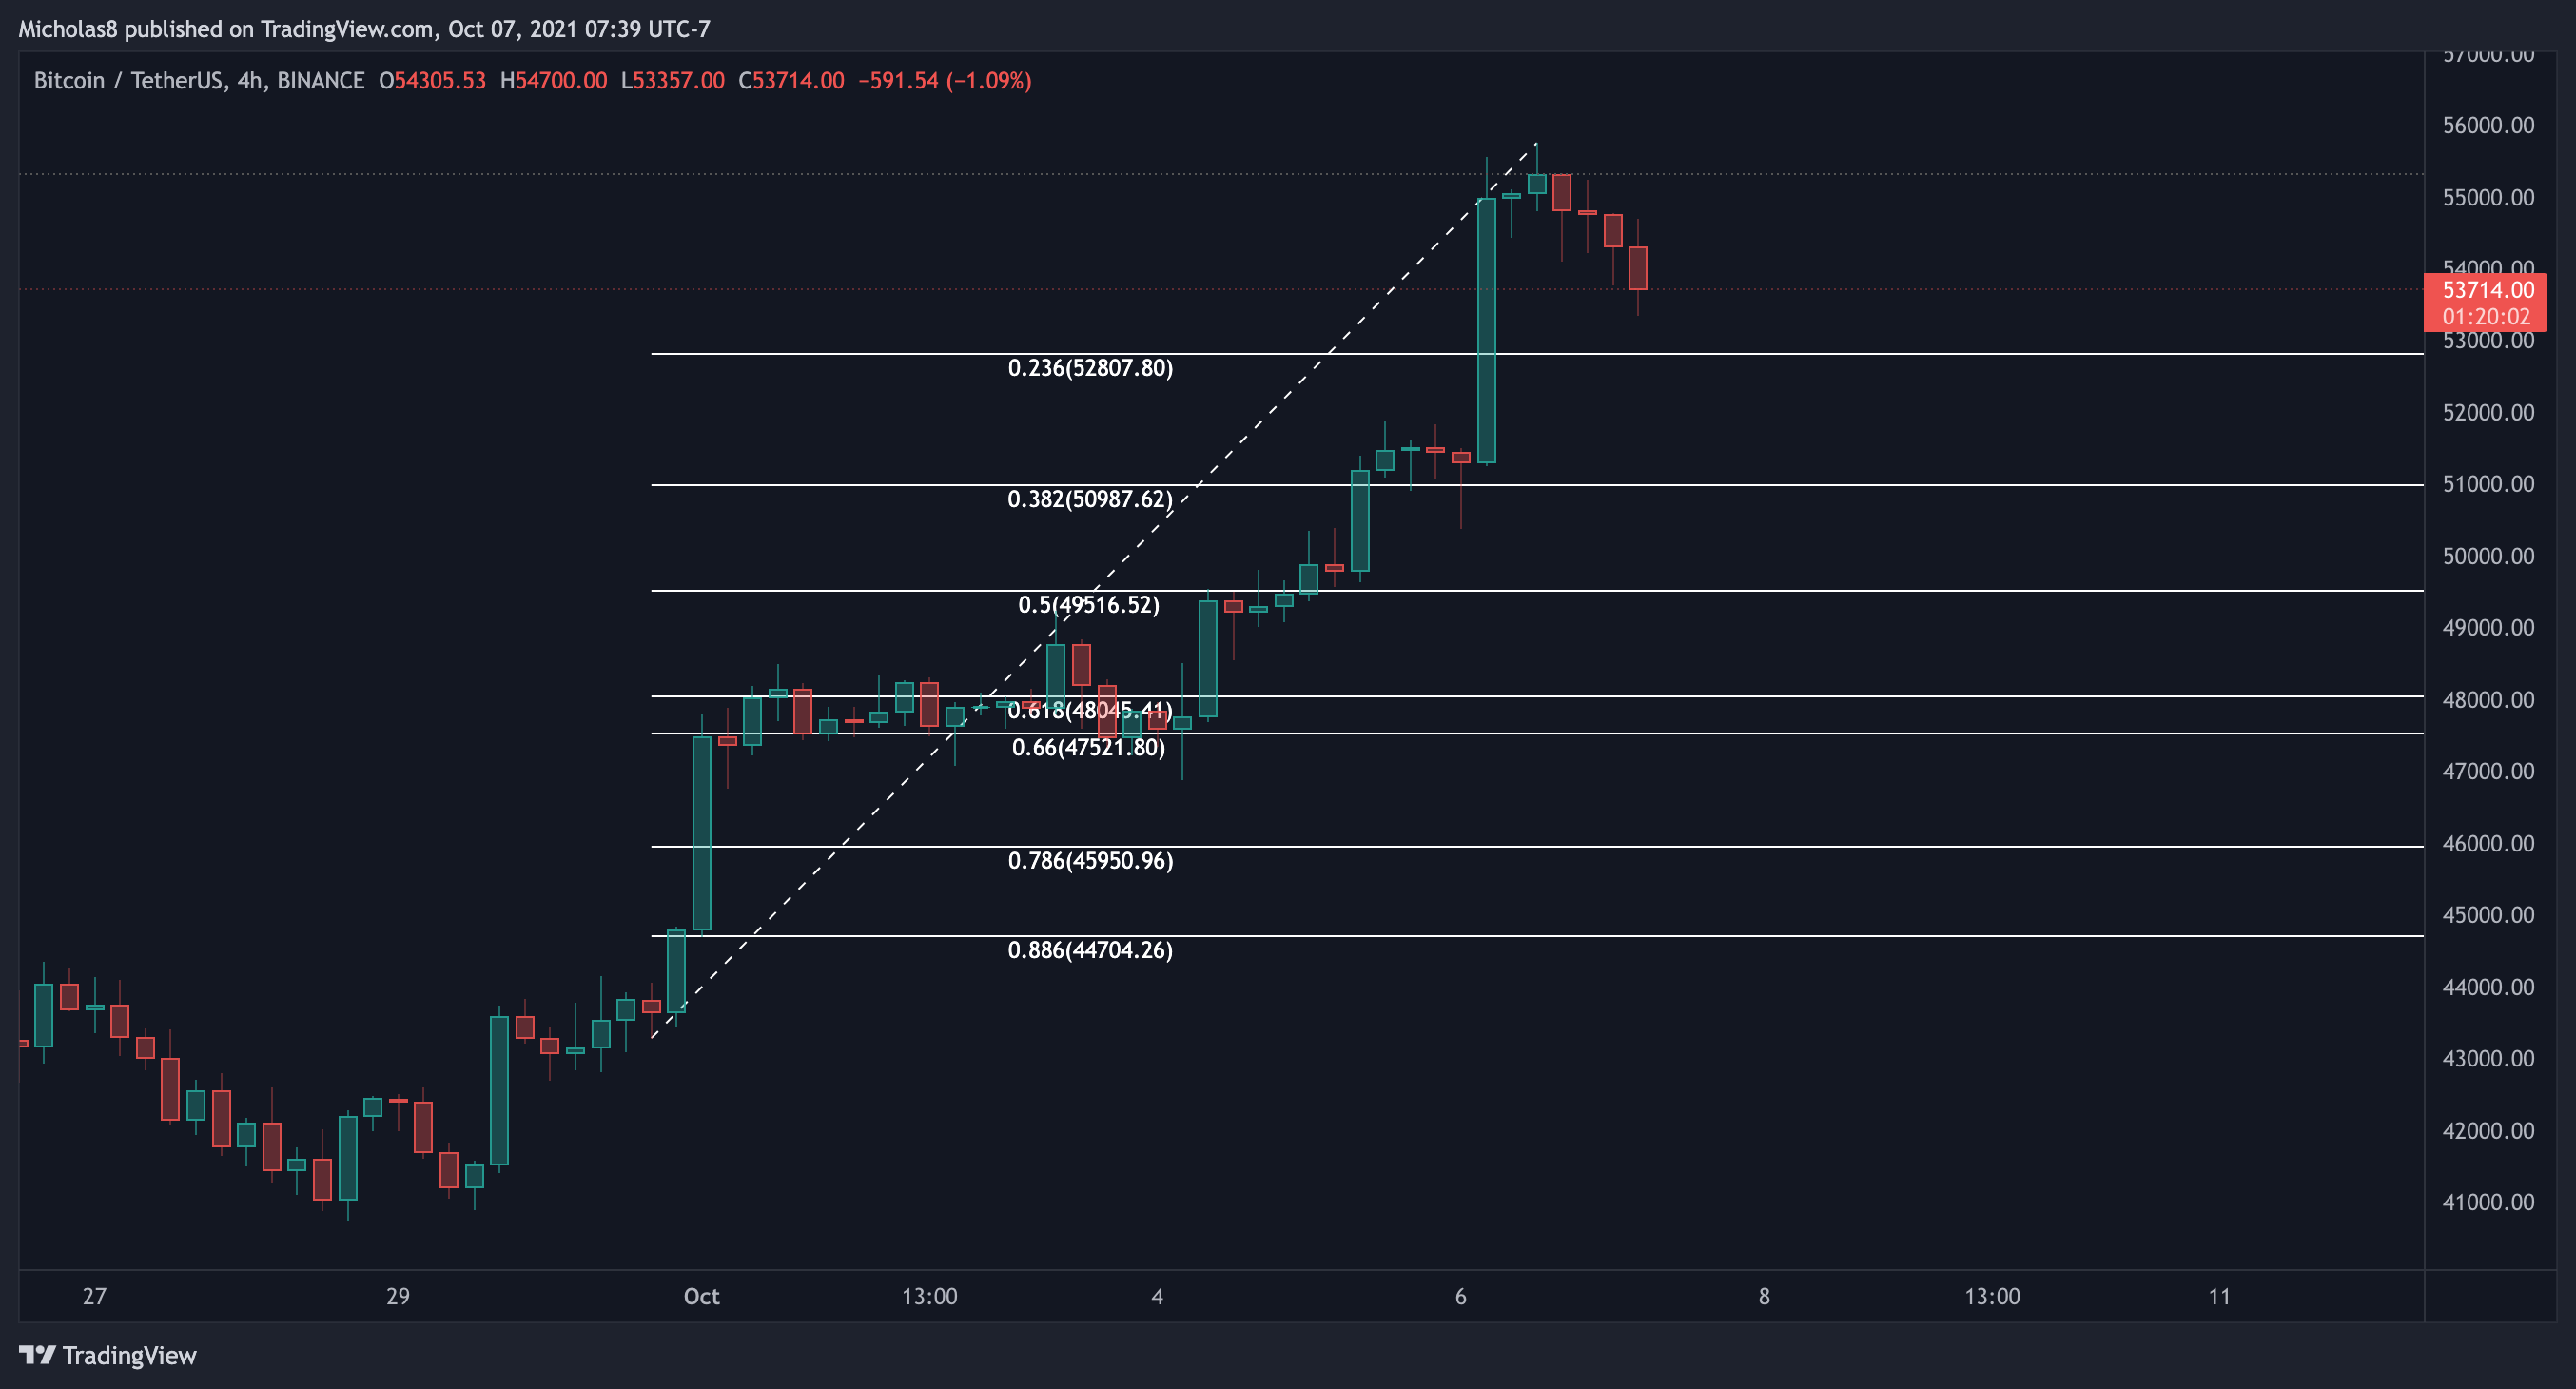
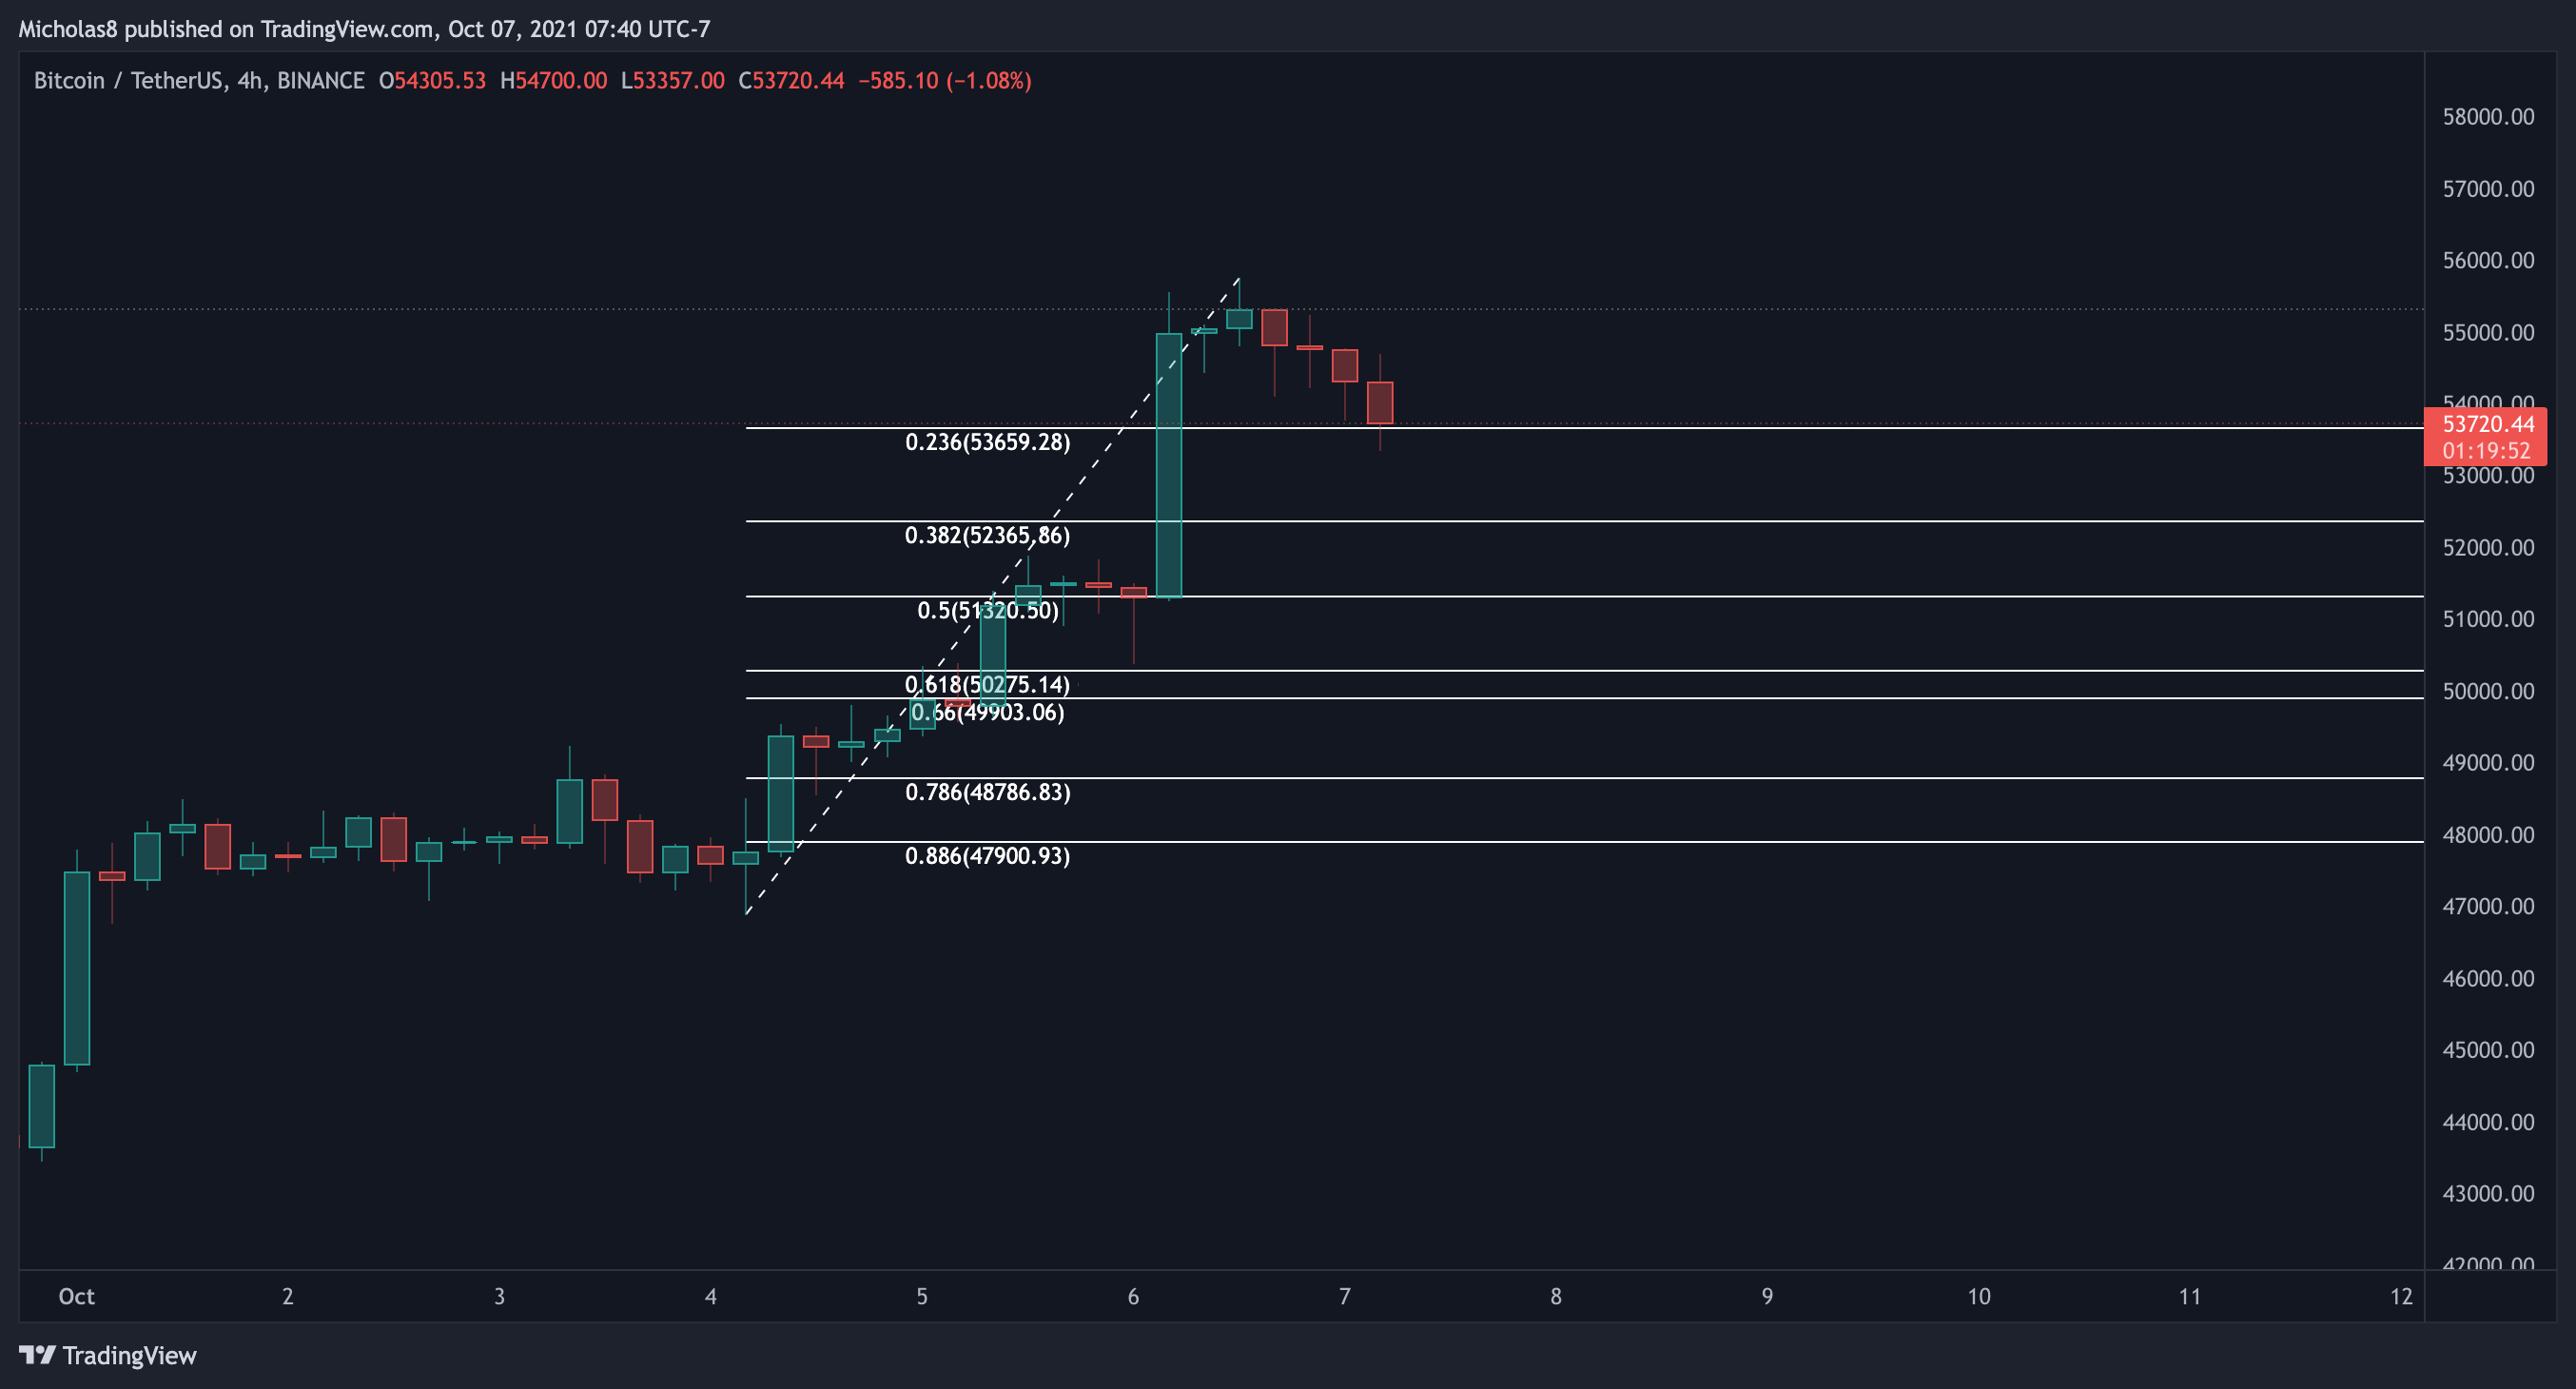
Fibonacci levels
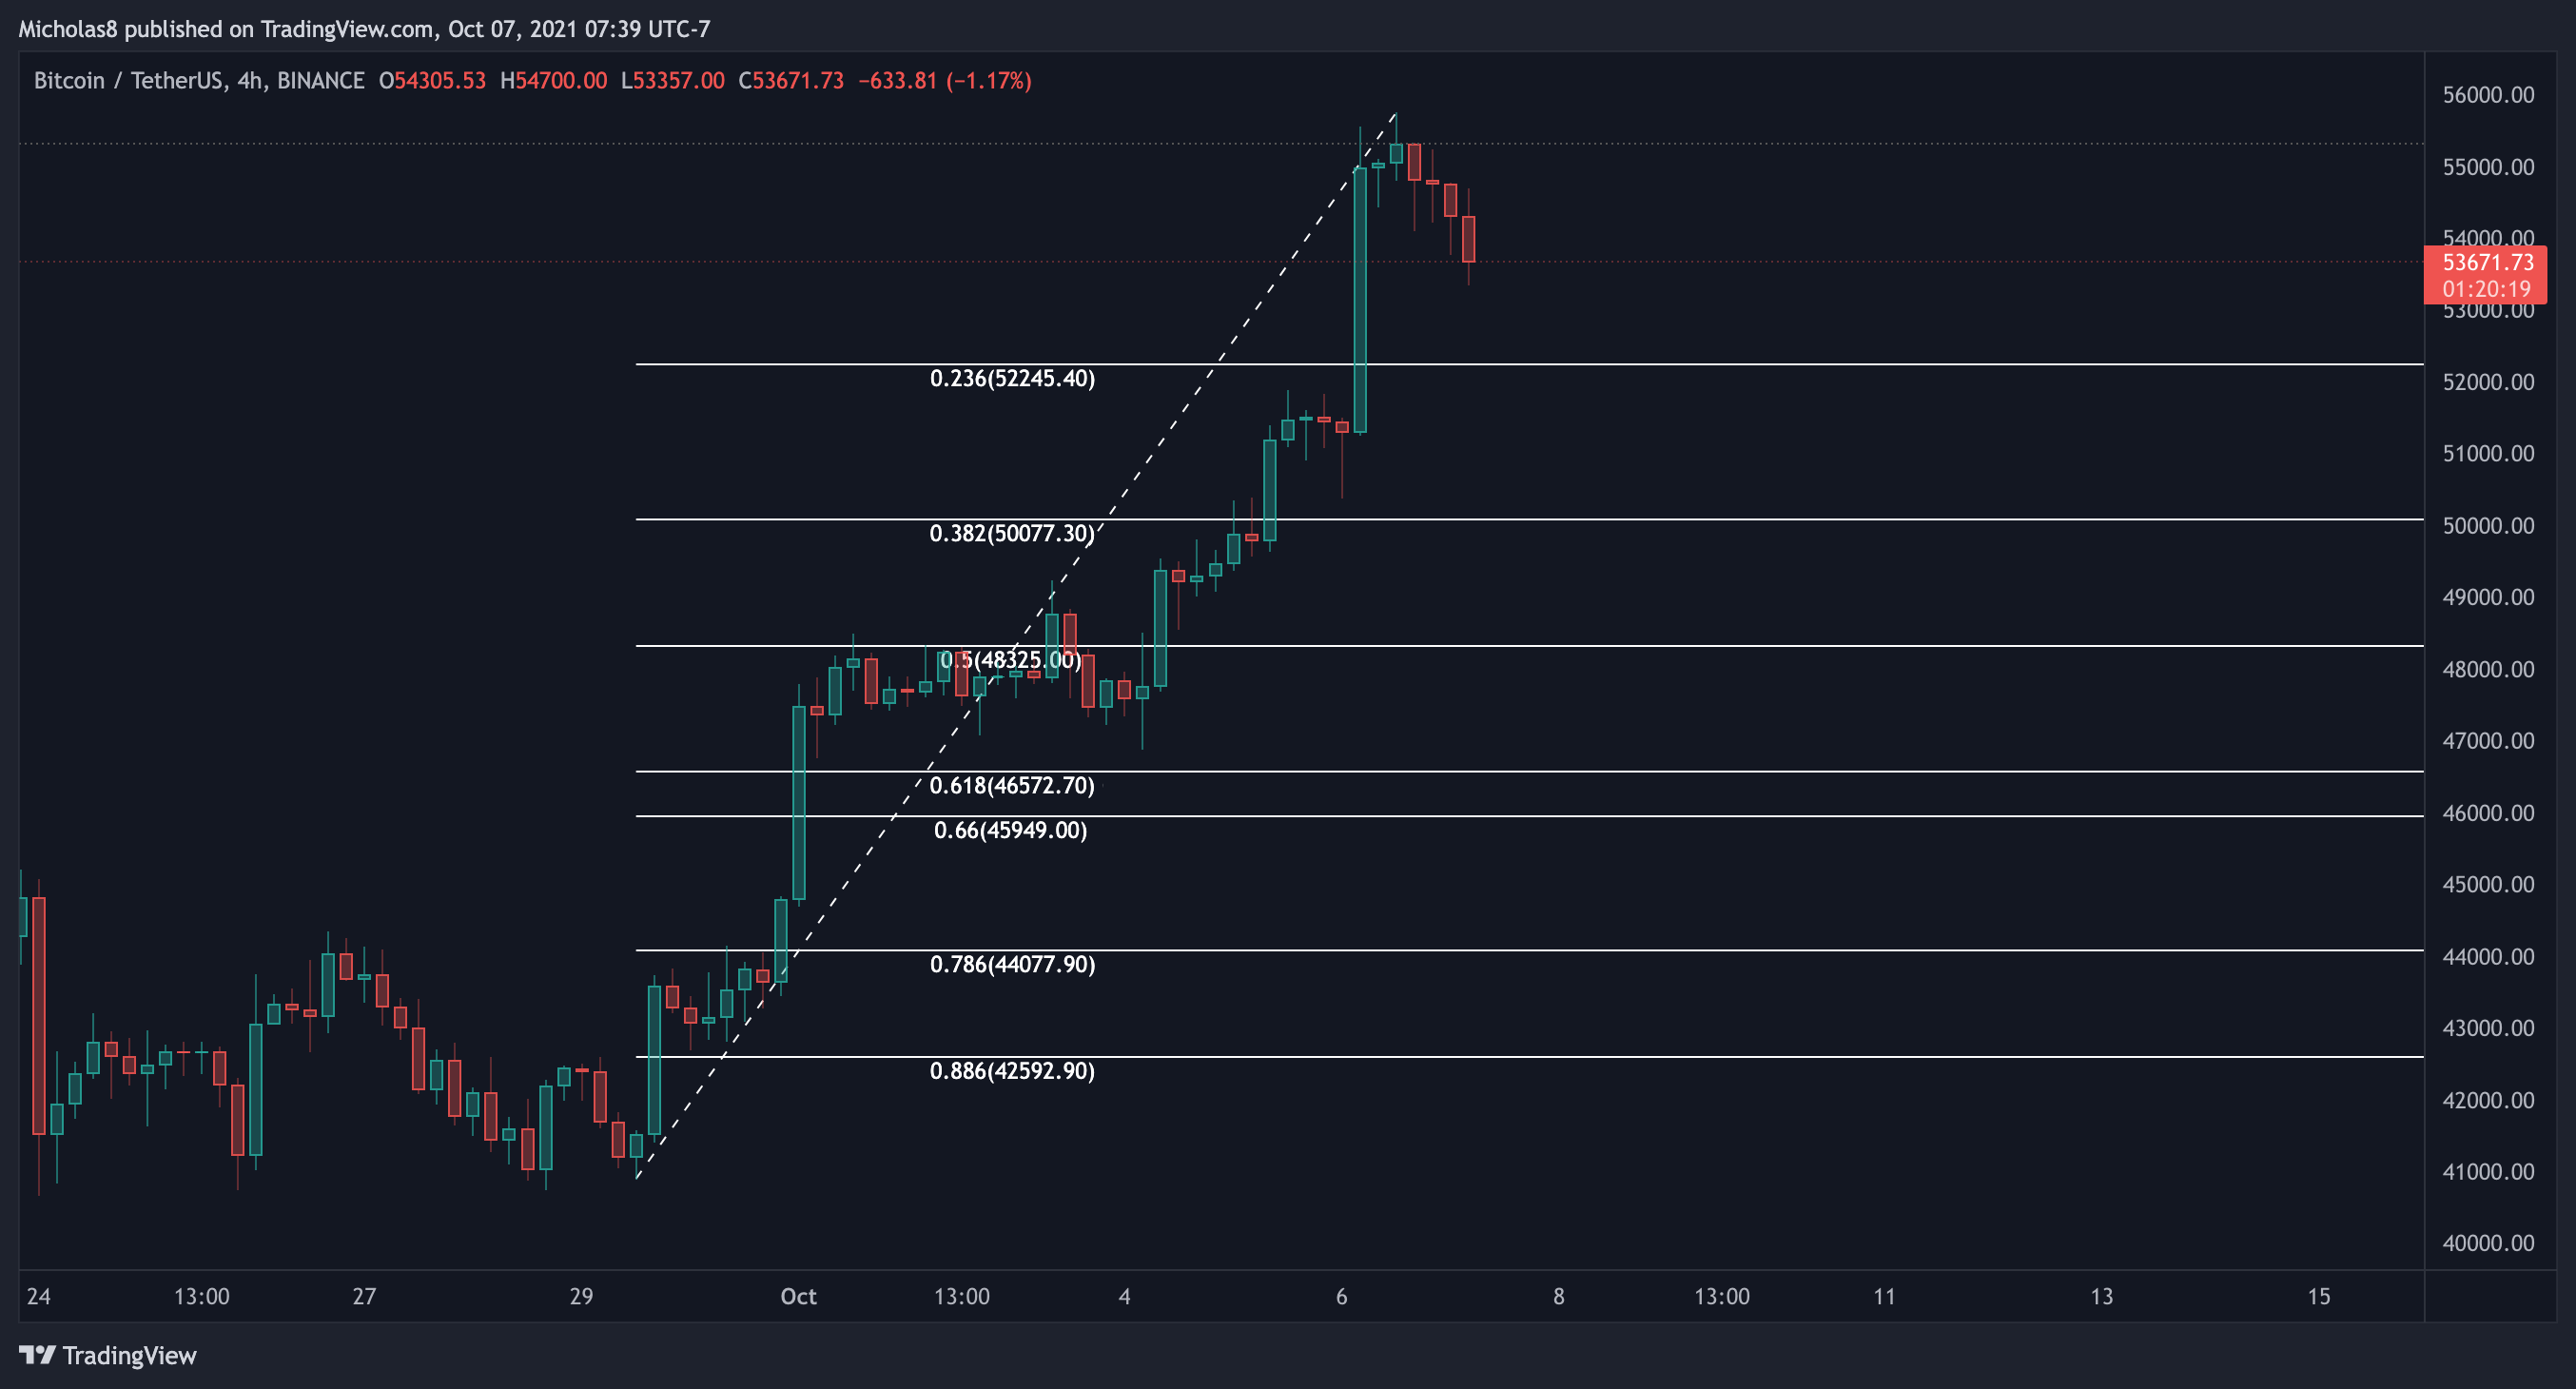
1-hour Timeframe
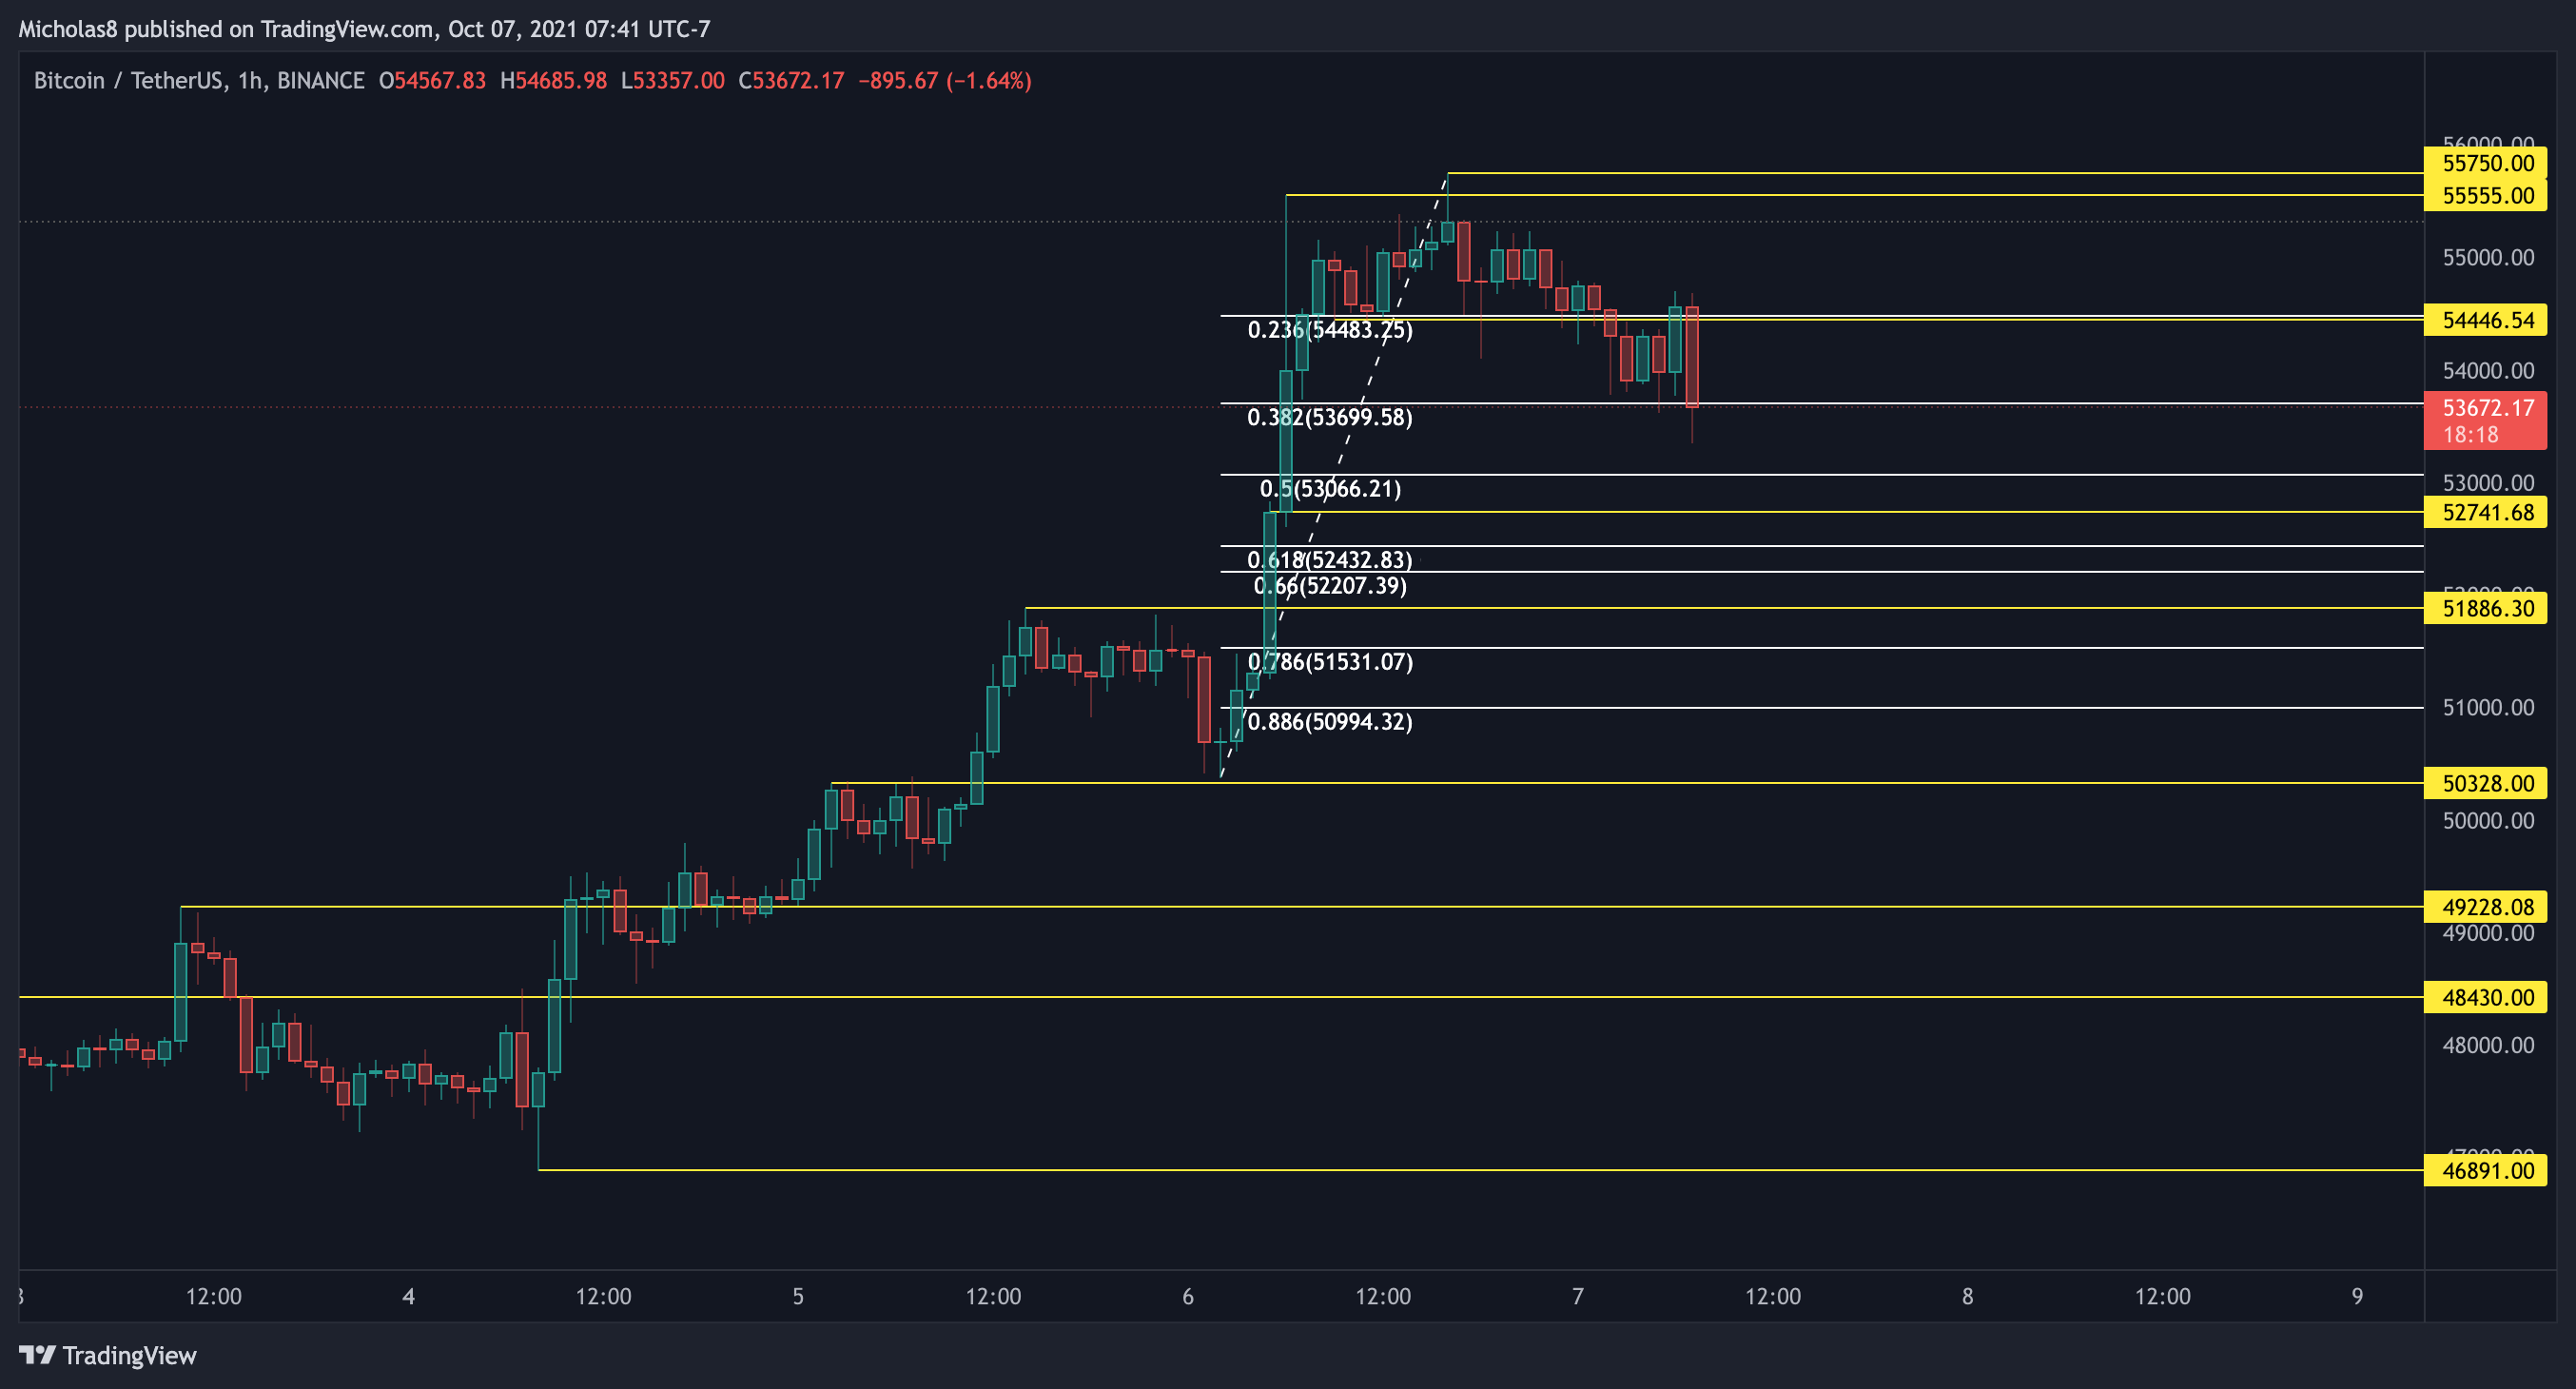
46891
48430
49228
50328
51886
52740
54445
55555
55750
Fibonacci levels
FINAL THOUGHTS
RECAP FROM LAST NIGHT
Between this morning and tonight, not much has changed other than the discovery of the 3H bearish divergence.
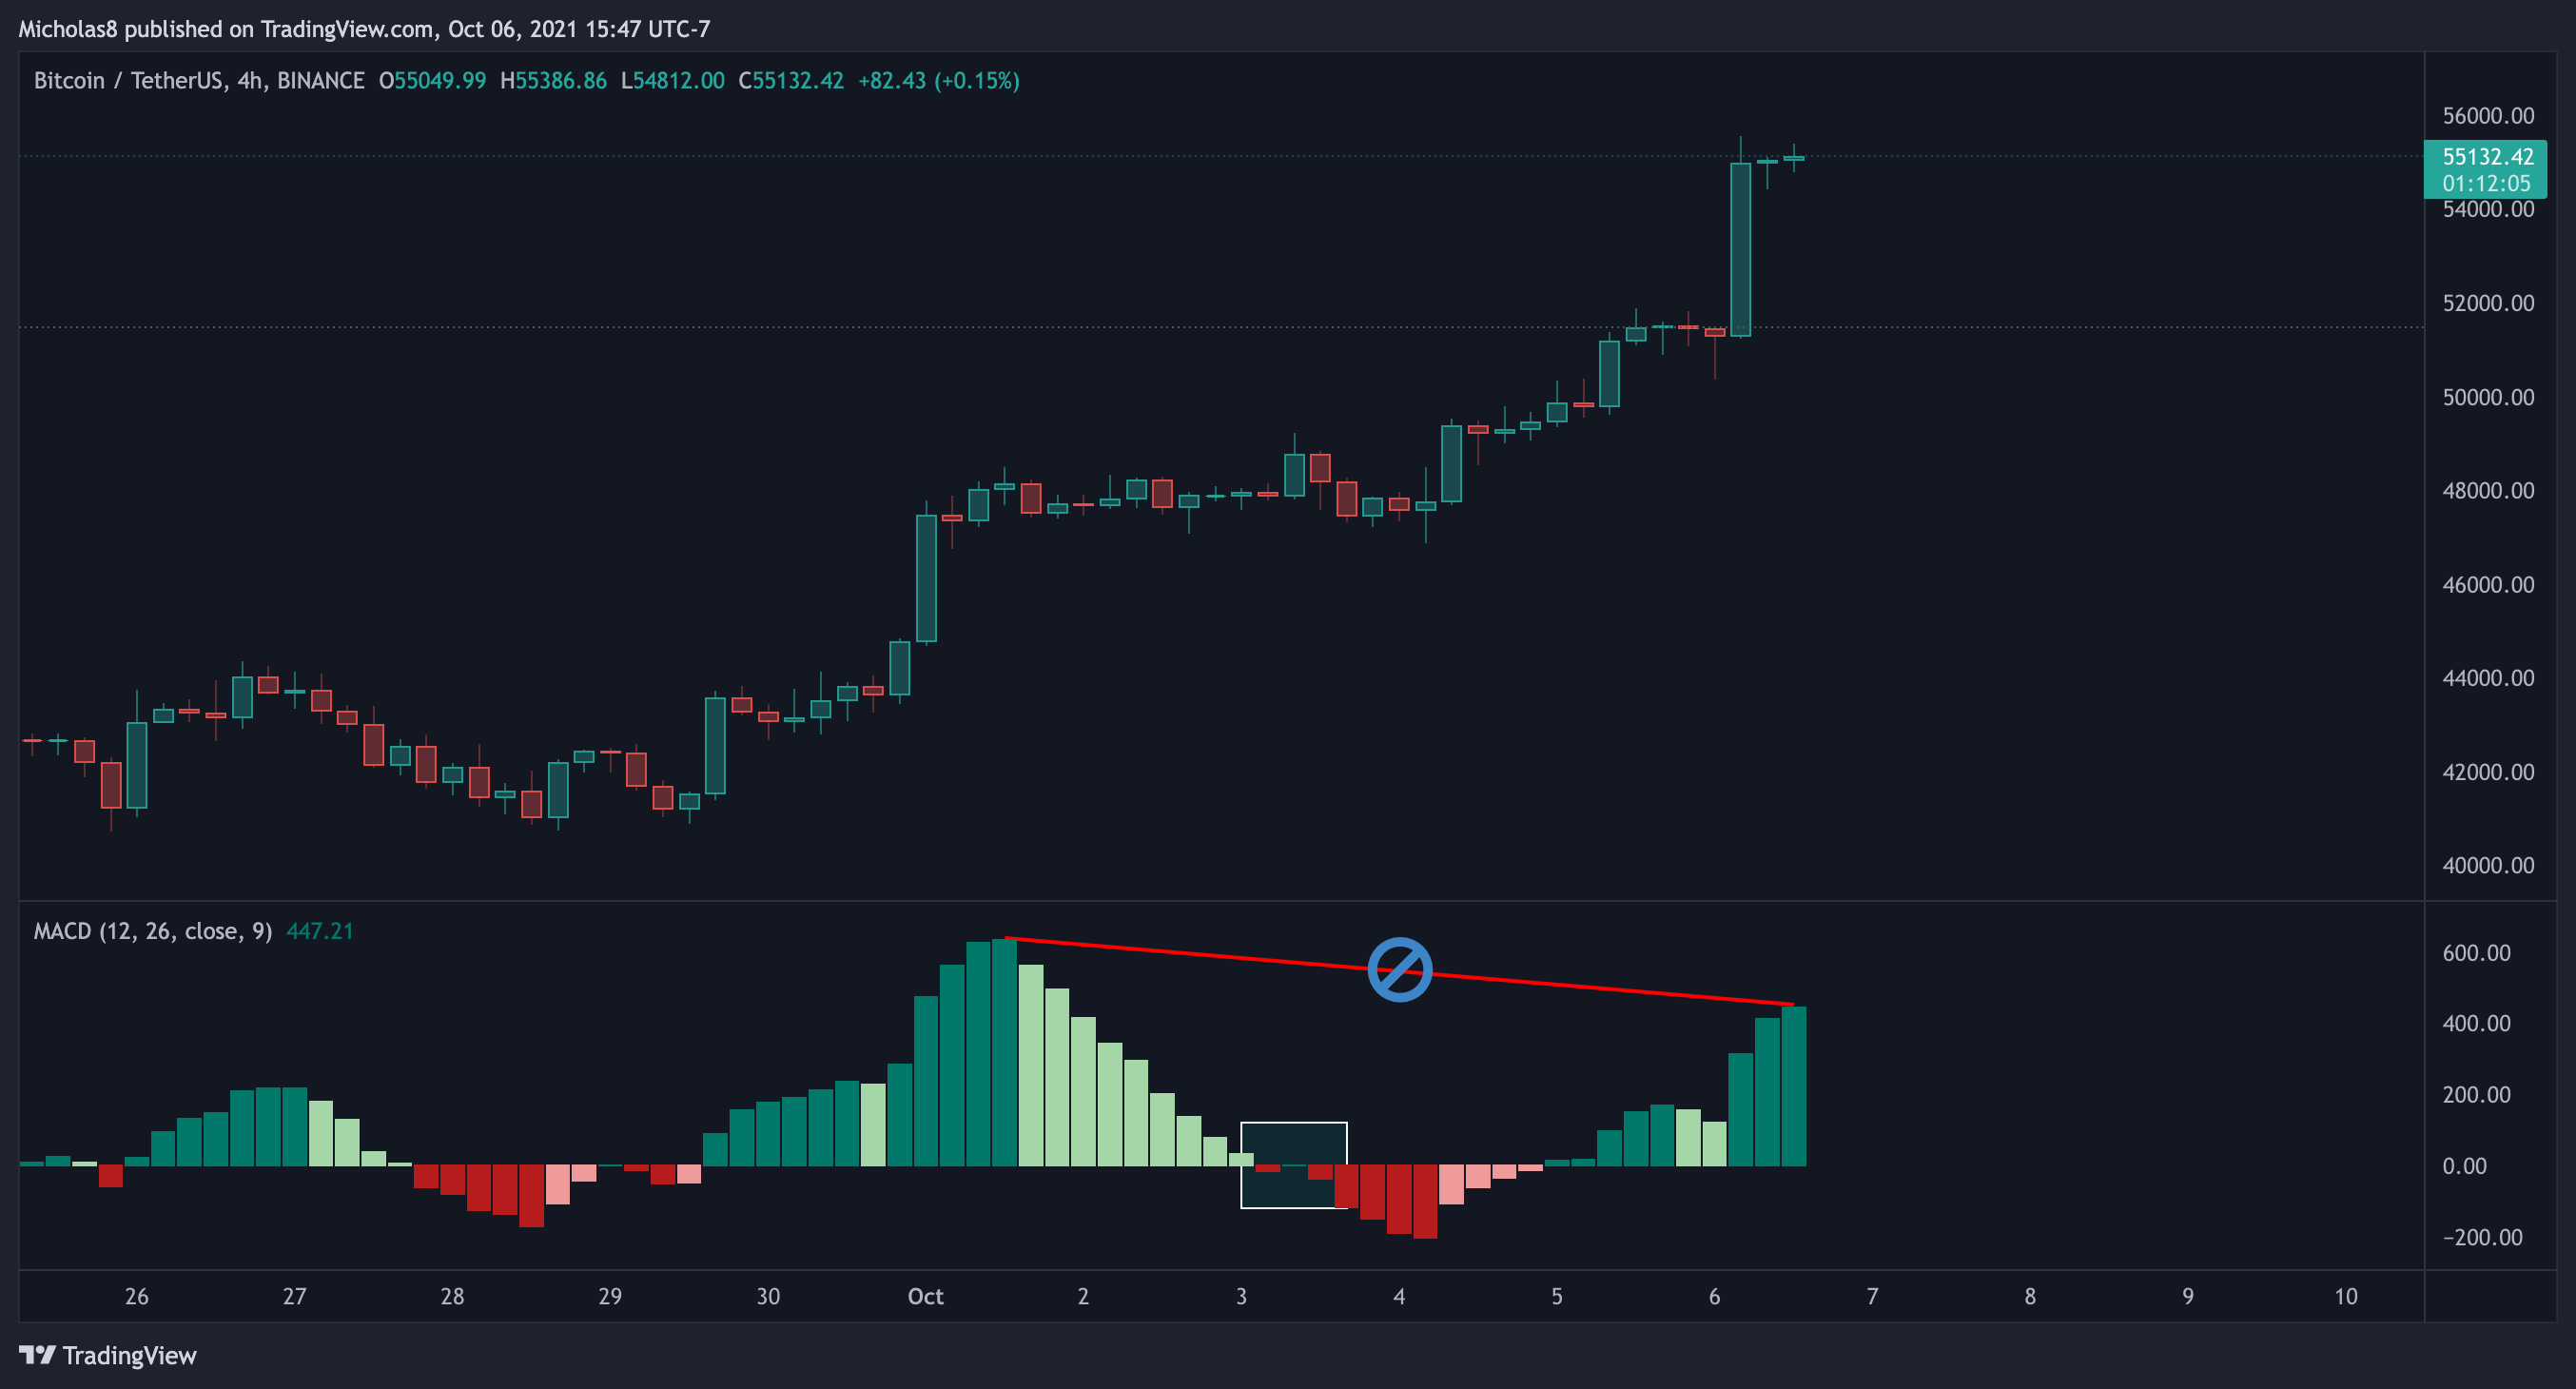
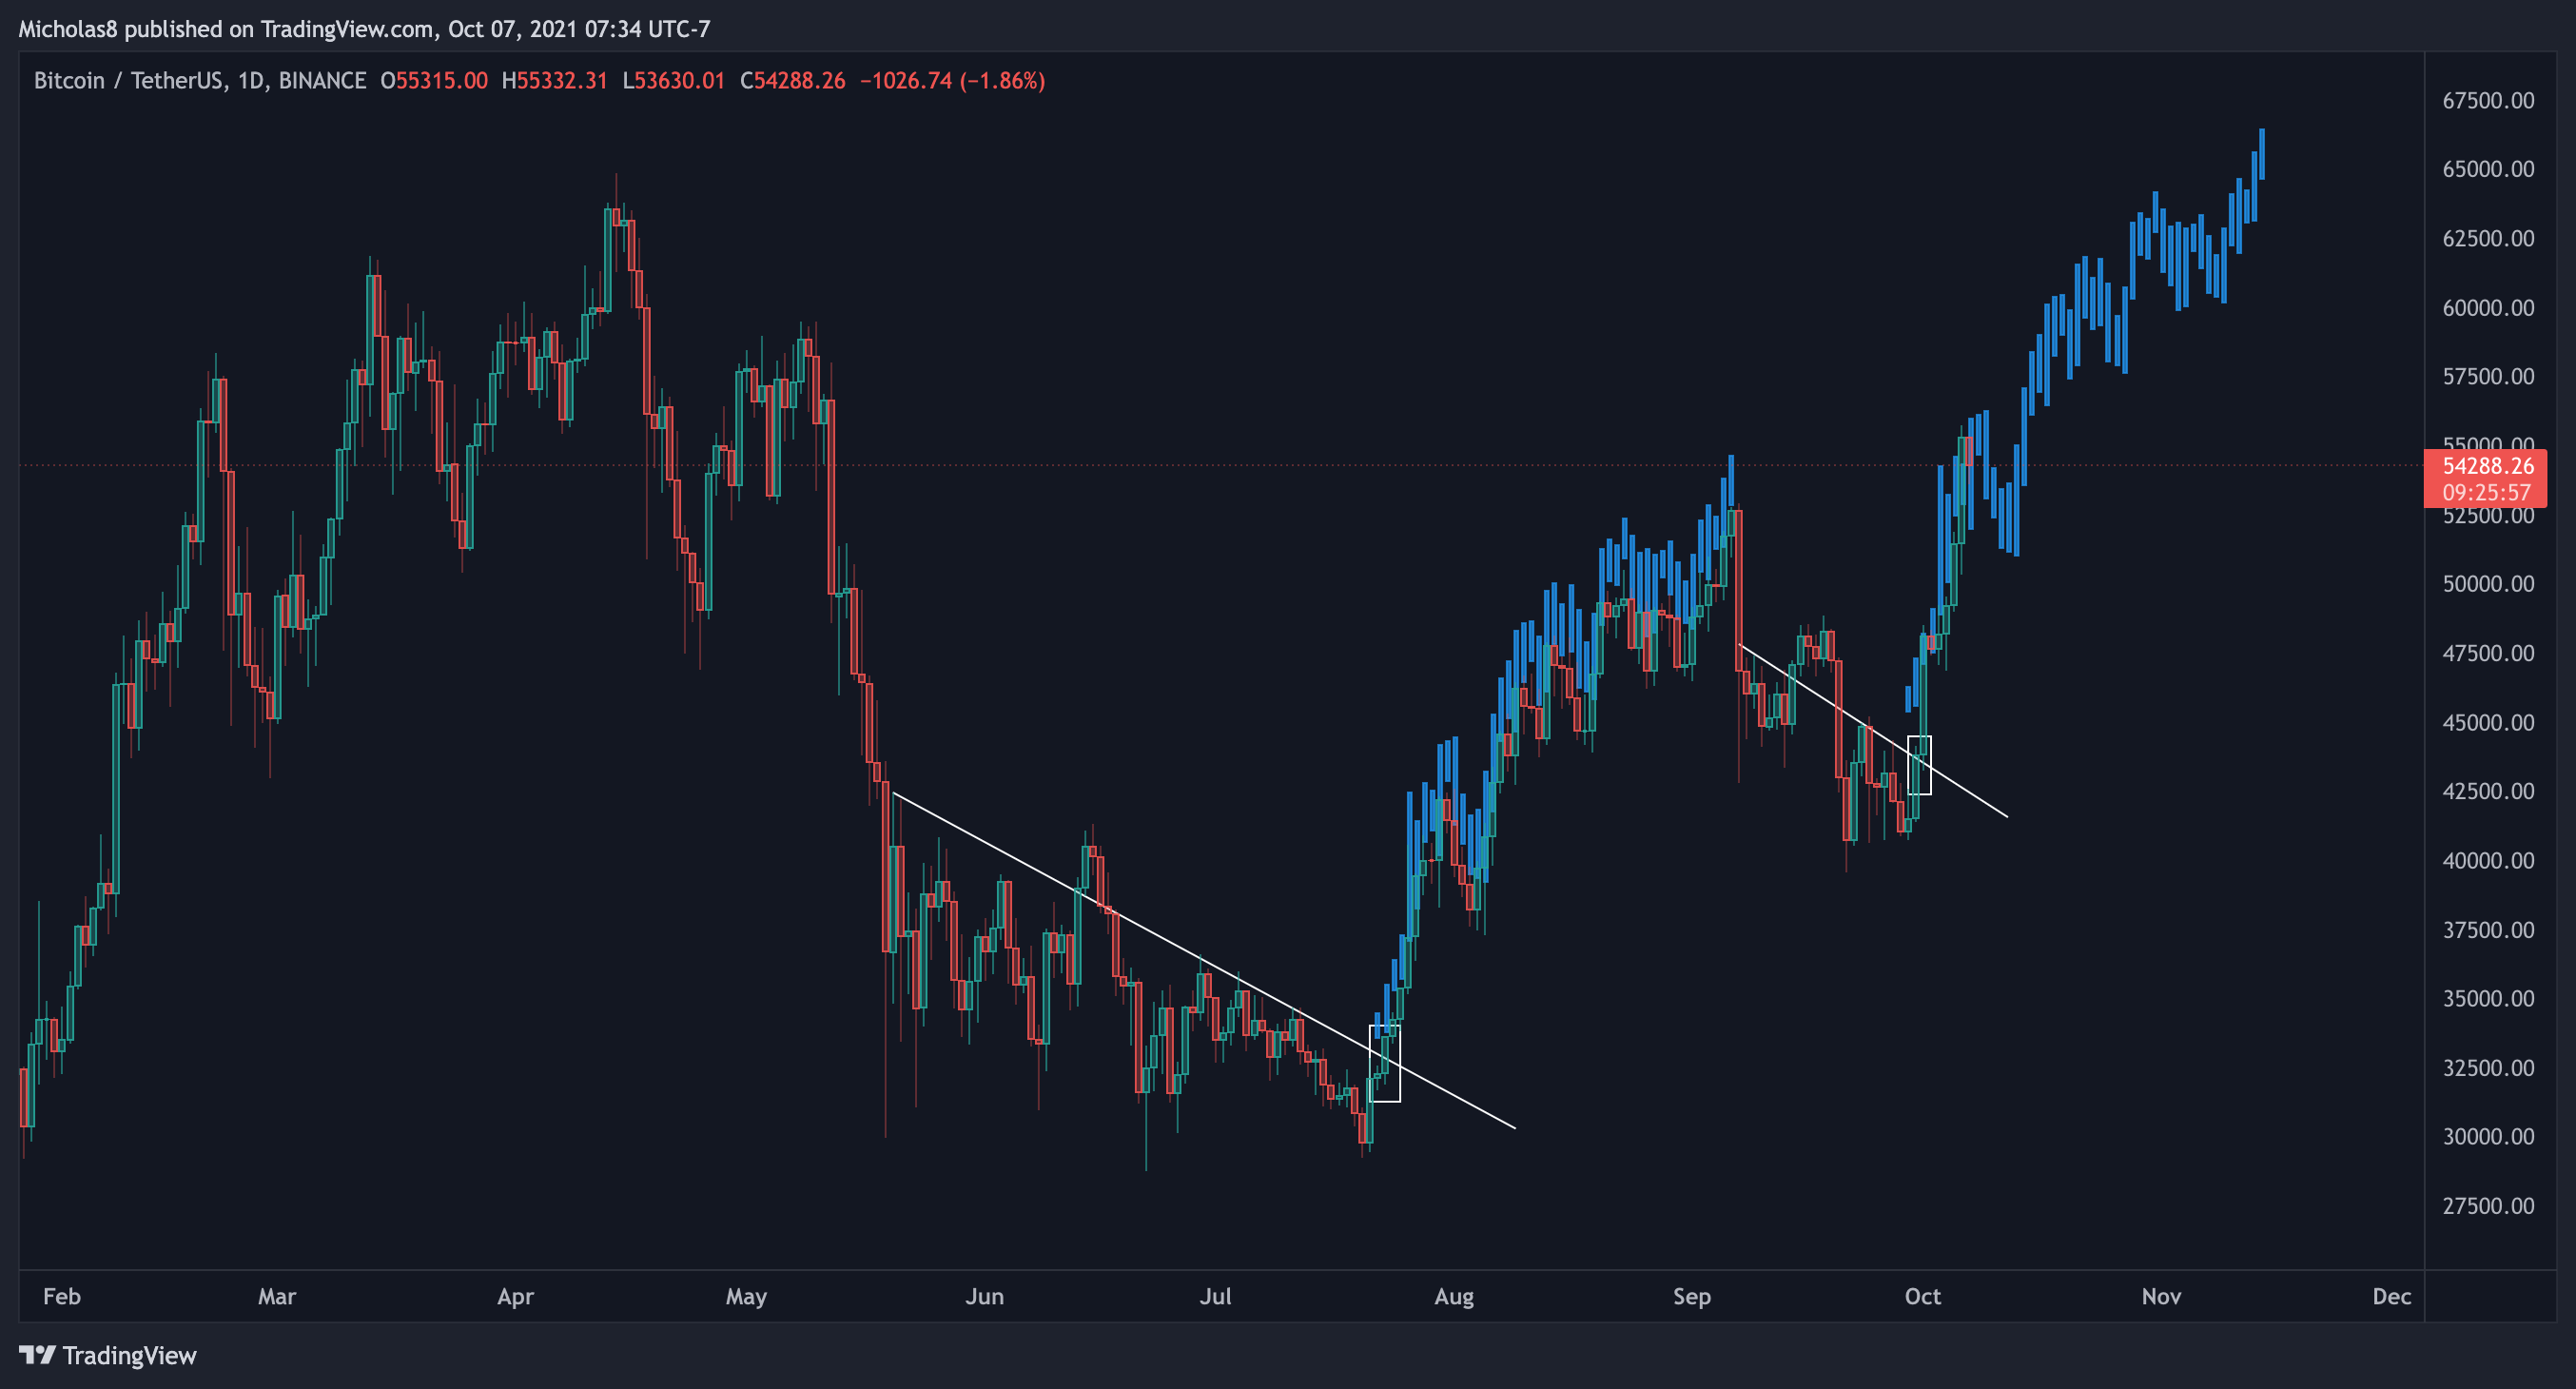
Normally, we look at the 4H timeframe for divergences, but it just isn't valid there because of the island (outlined by the rectangle) in between the two peaks.
DXY
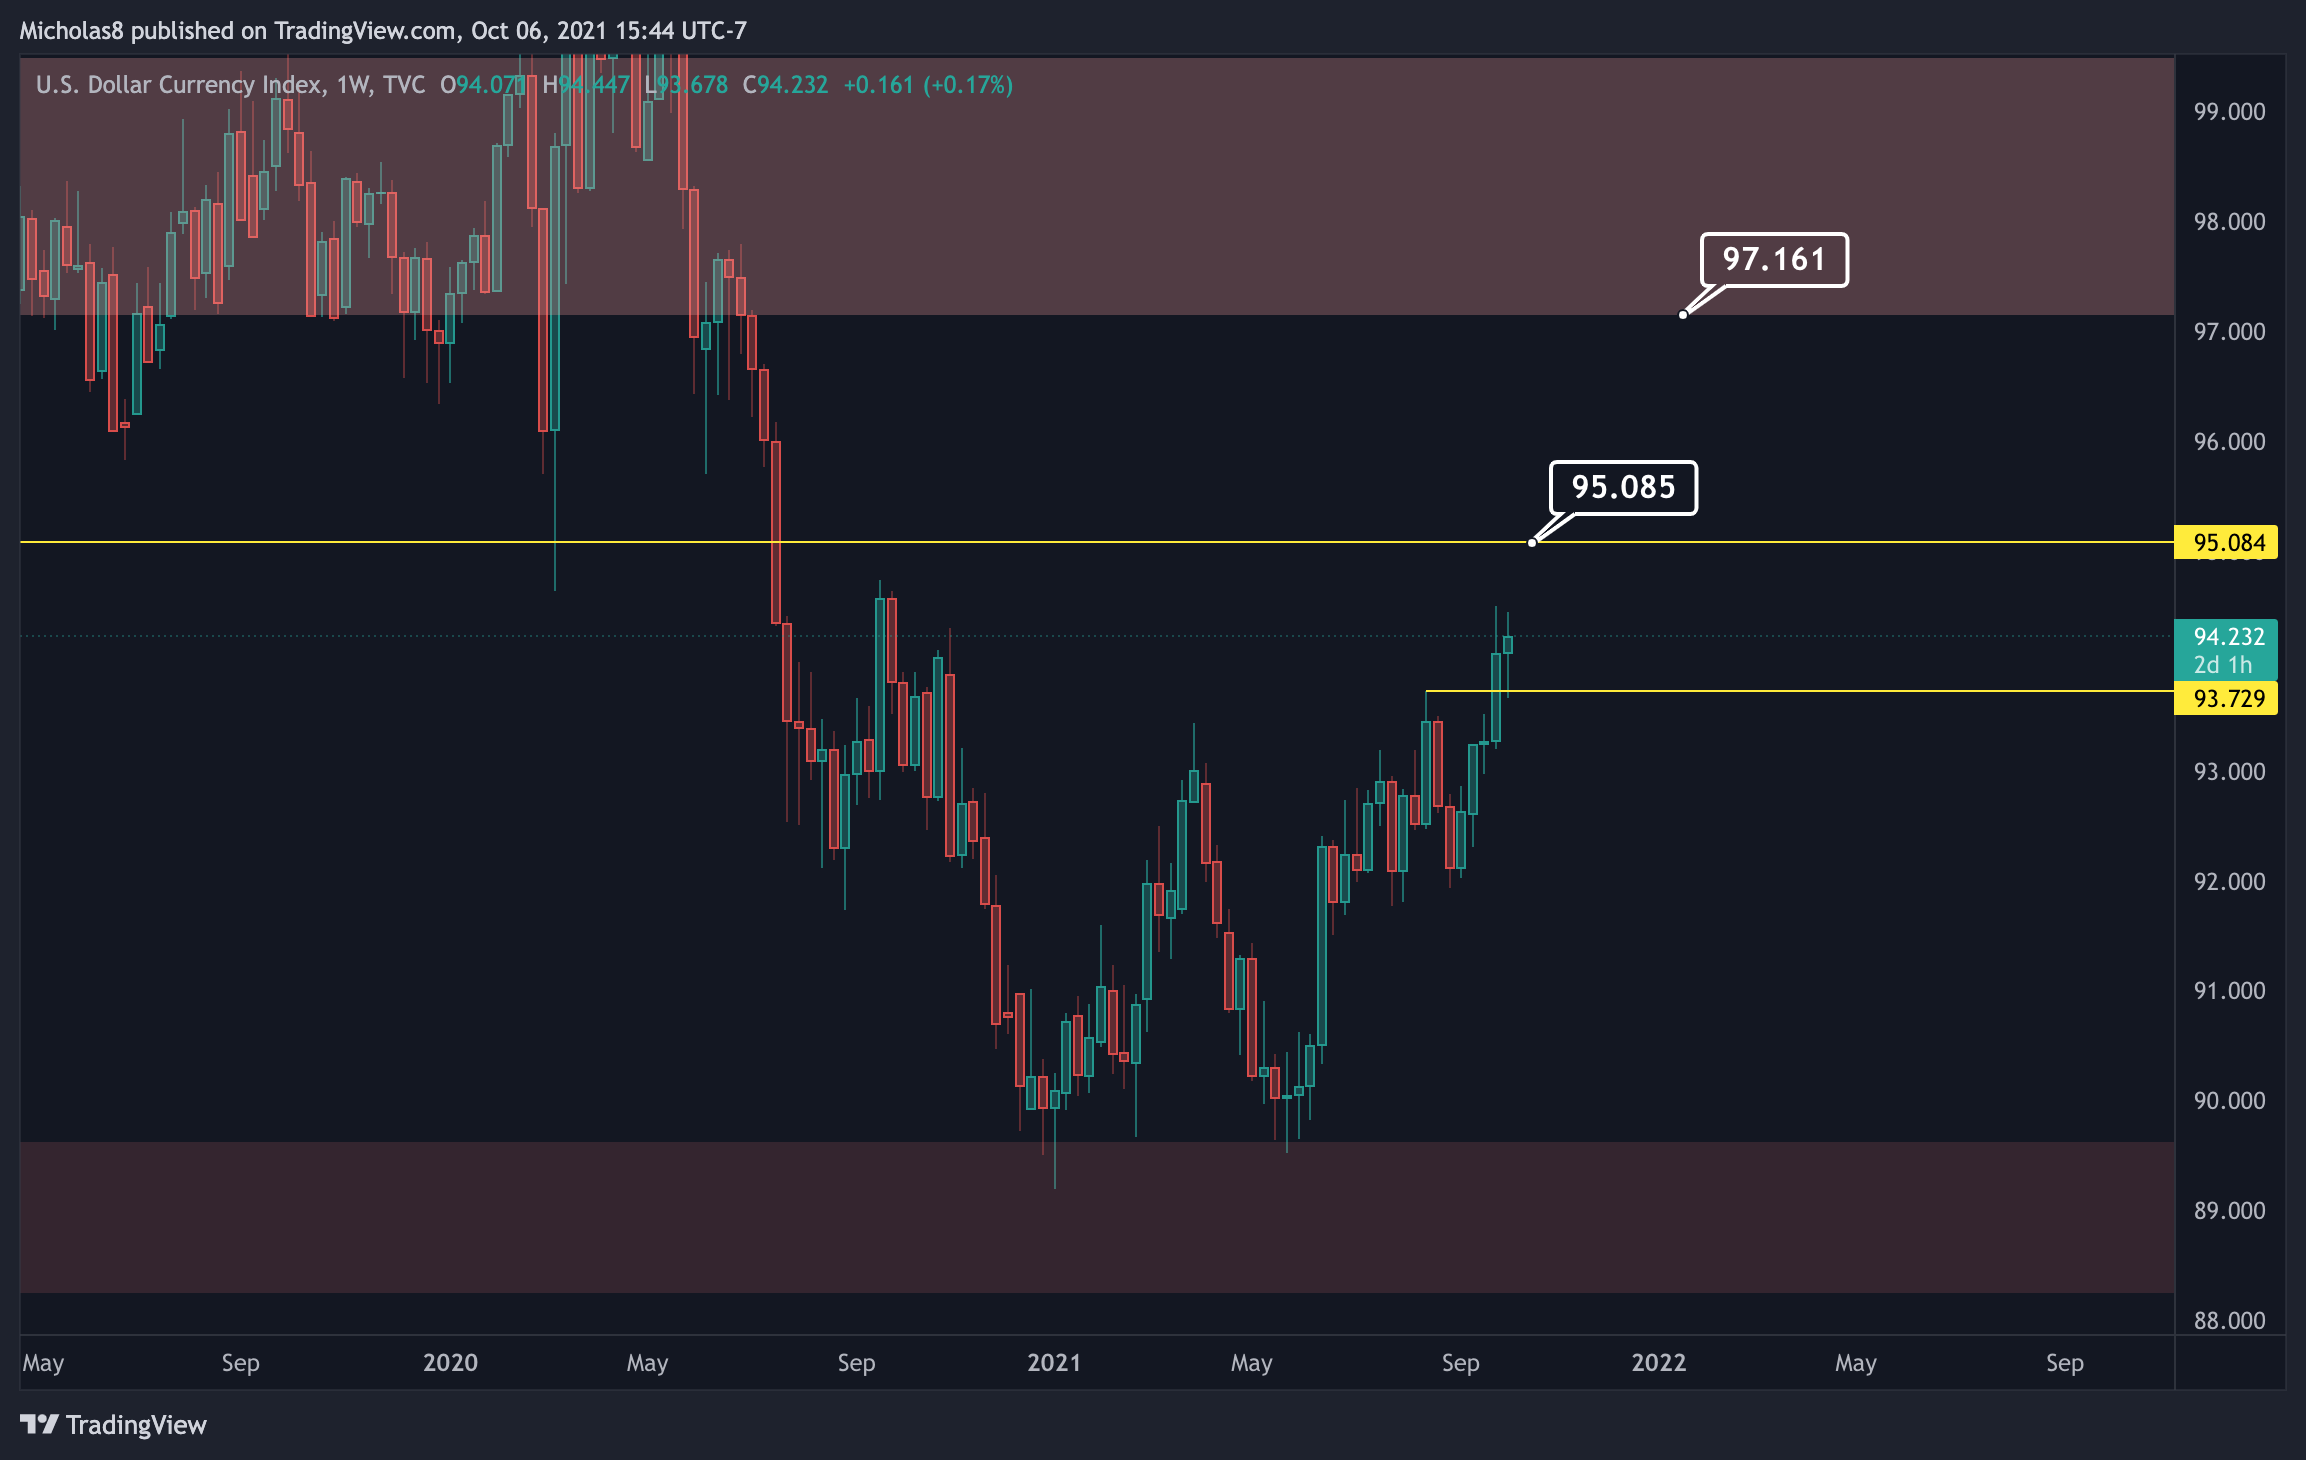
The DXY continues its rise, which is typically regarded as bearish. One thing I'd like to make clear here is the correlation between the two are on a macro level. So, yes, it's possible we are de-coupling from the traditional markets and fiat currencies, but IMO it's too early to say.
SPX
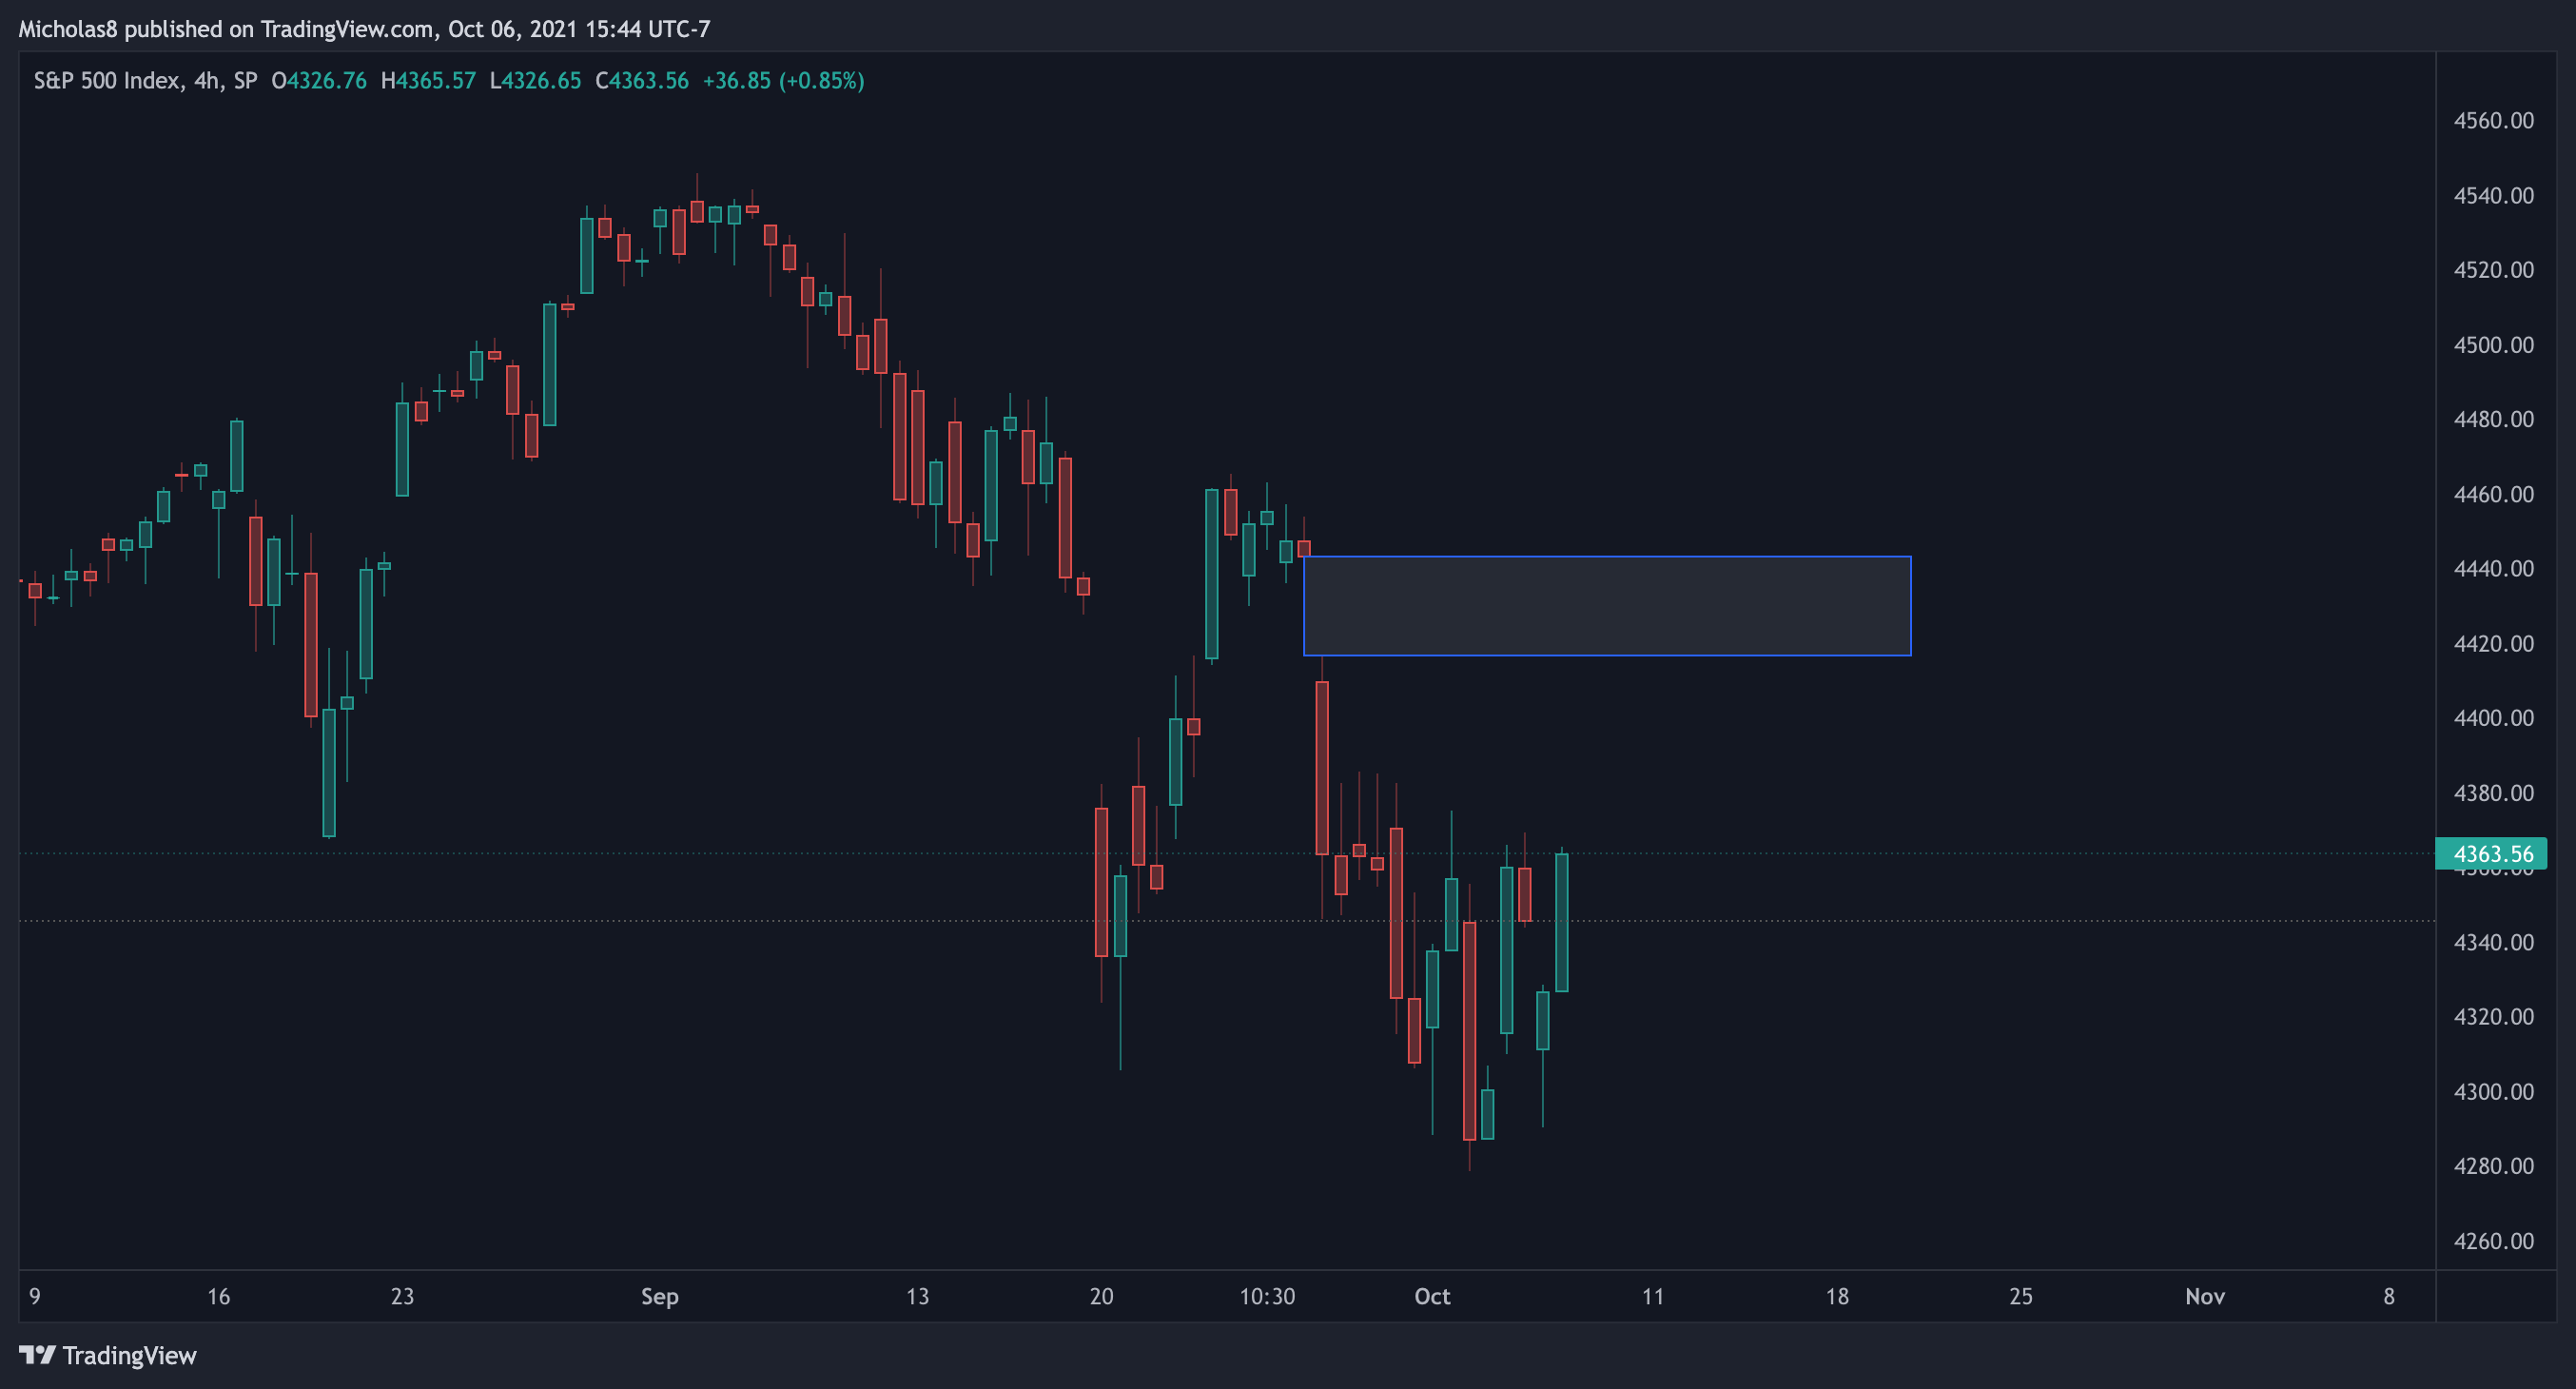
The SPX has had a terrible week. But, we do still have that gap above us to fill. If it does fill, depending on what the SPX does next, IMO, will be pivotal for Bitcoin and crypto as a whole. Again, there's a lot of speculation about de-coupling, but I do think it's too early to say. There's not enough data to support the argument yet, and similar to the DXY, the correlation is on a macro level.
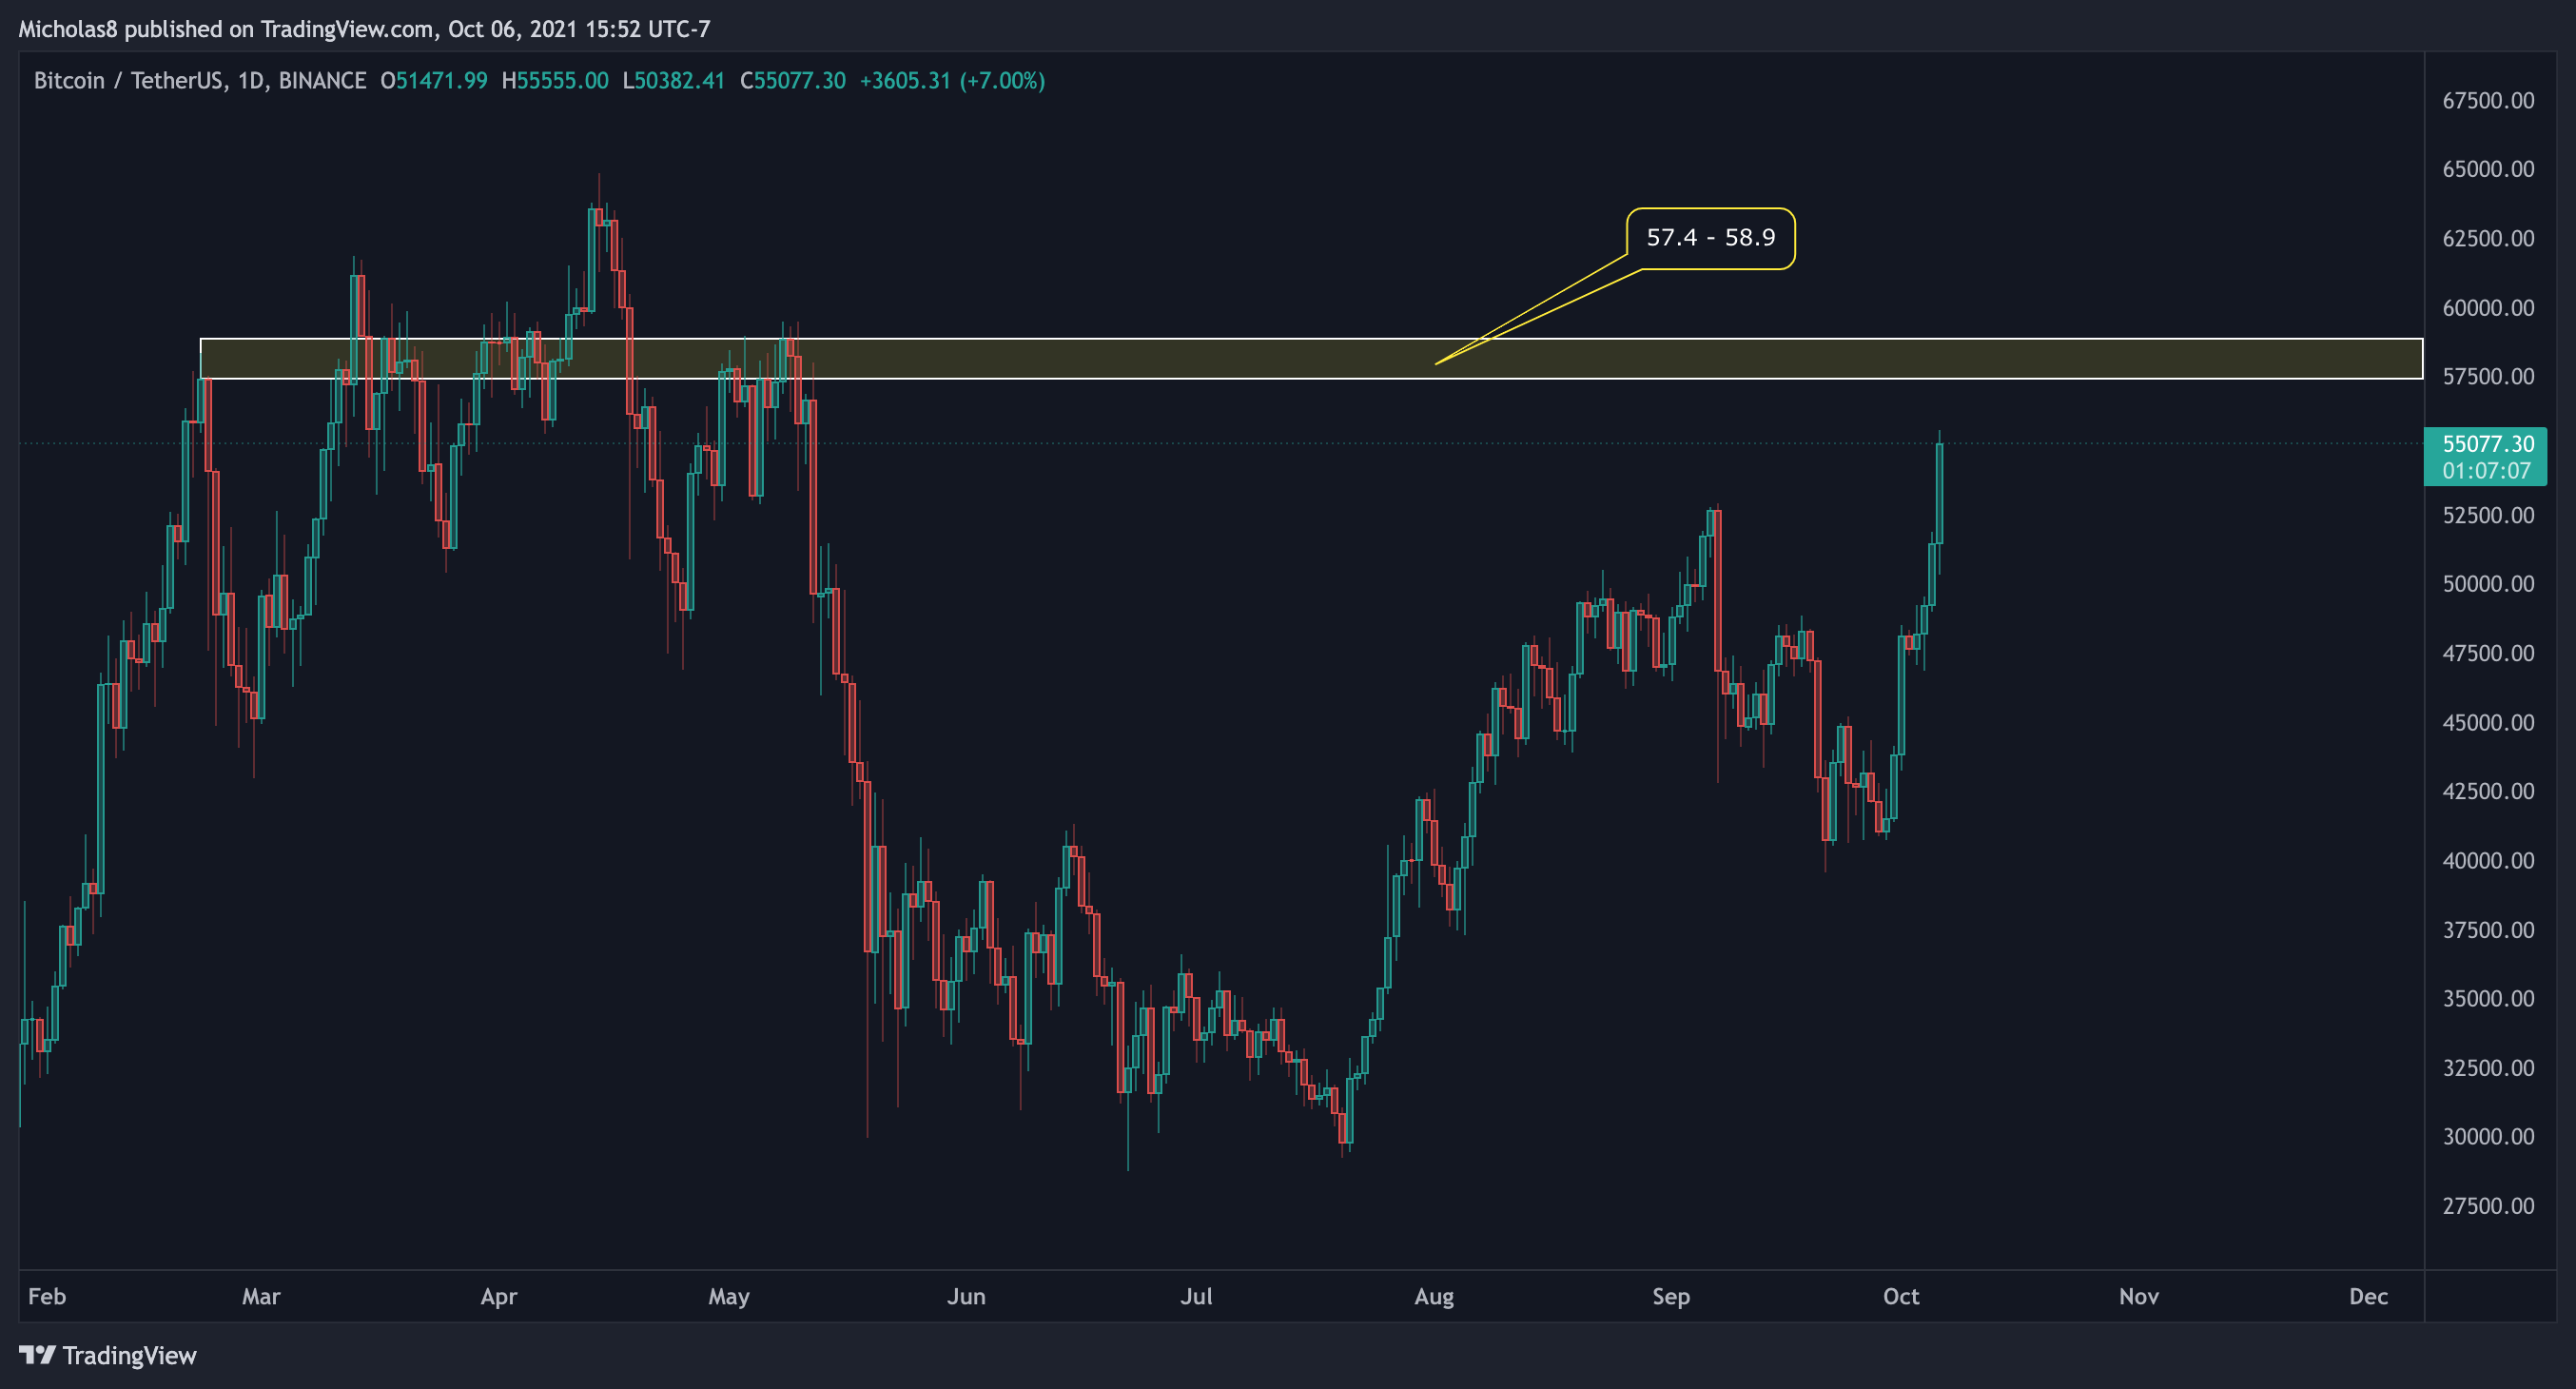
If Bitcoin continues up from 55k, this is an extremely important region to keep an eye on. We have two Key Levels at 57.4k and 58.9k. I do expect us to face some resistance if/when we get there.
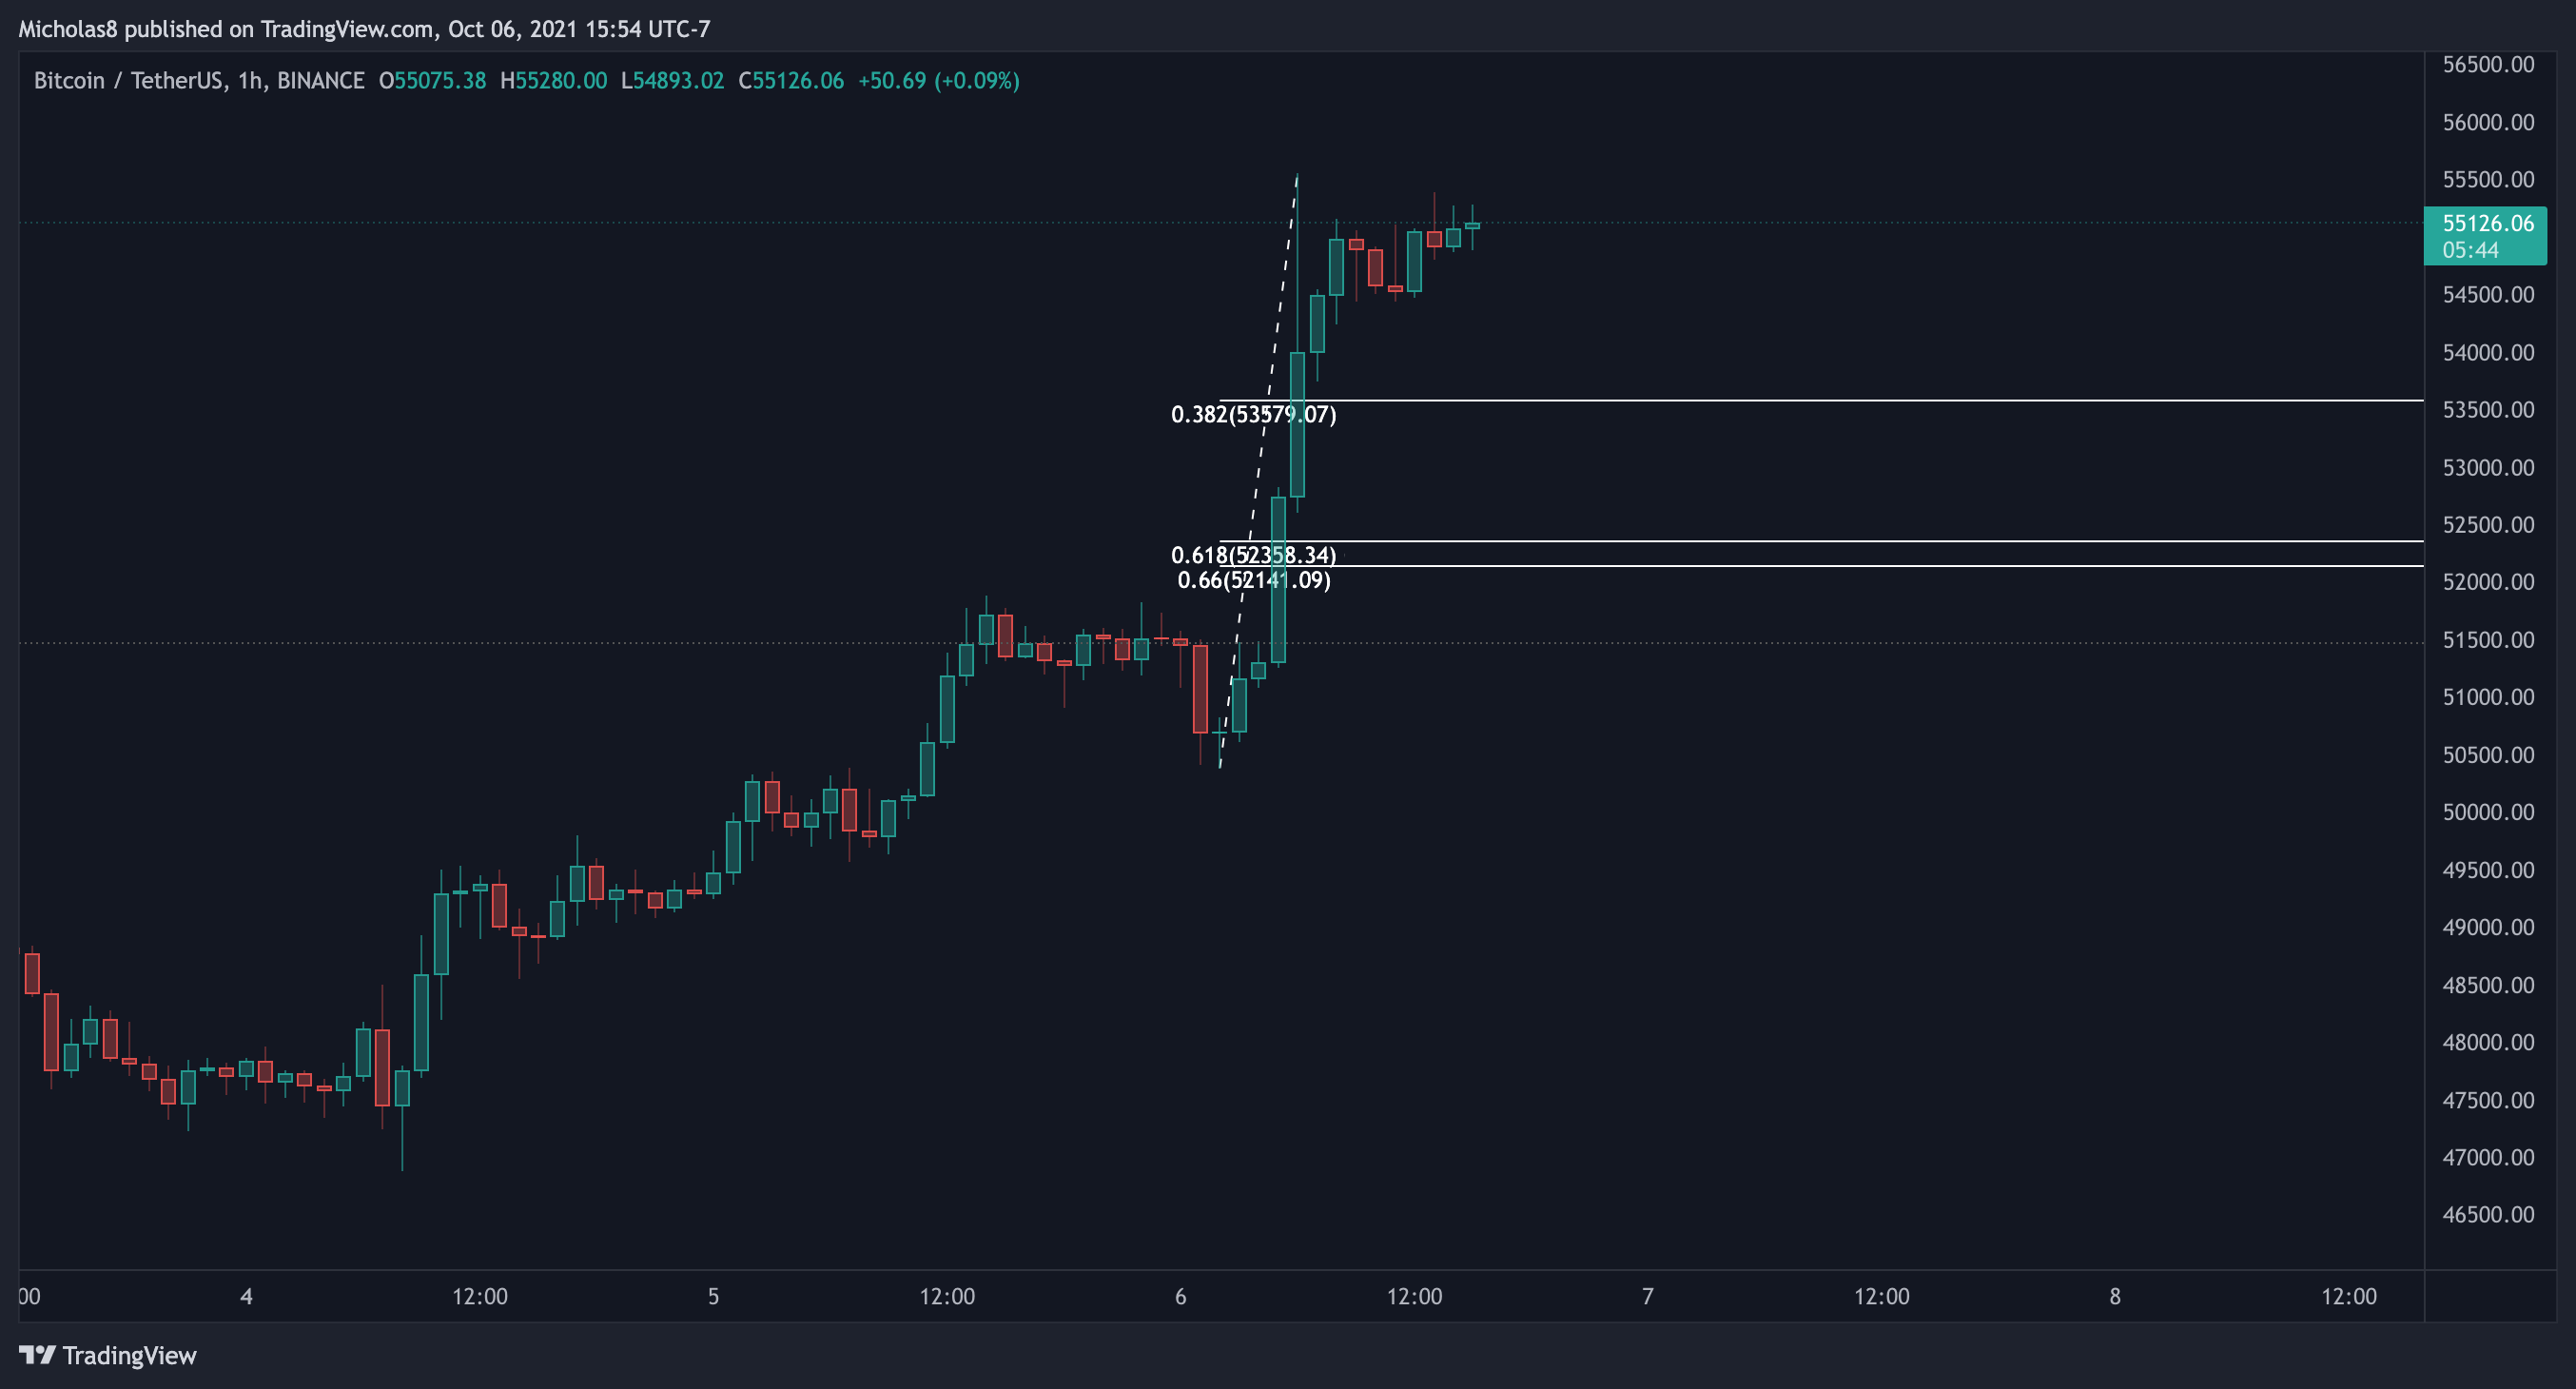
Now, if we see a move to the downside, because yes, that's a possibility with the bearish divergence, these two Fibonacci Levels are what I'm looking at for a possible bounce. Alternatively, Bitcoin may consolidate before a bullish continuation.
All in all, Bitcoin still looks bullish at this exact moment. Bu,t on a more macro-level, I'm concerned with the state of the DXY and SPX.
THIS MORNING
Last night, we identified the 3H bearish divergence which implied a possible move to the downside. Today, that played out. What's nice to see is that we are trying to create hidden bullish divergences, which signal a possible trend continuation up. This may be signalling that the bearish divergence has been fully realized.
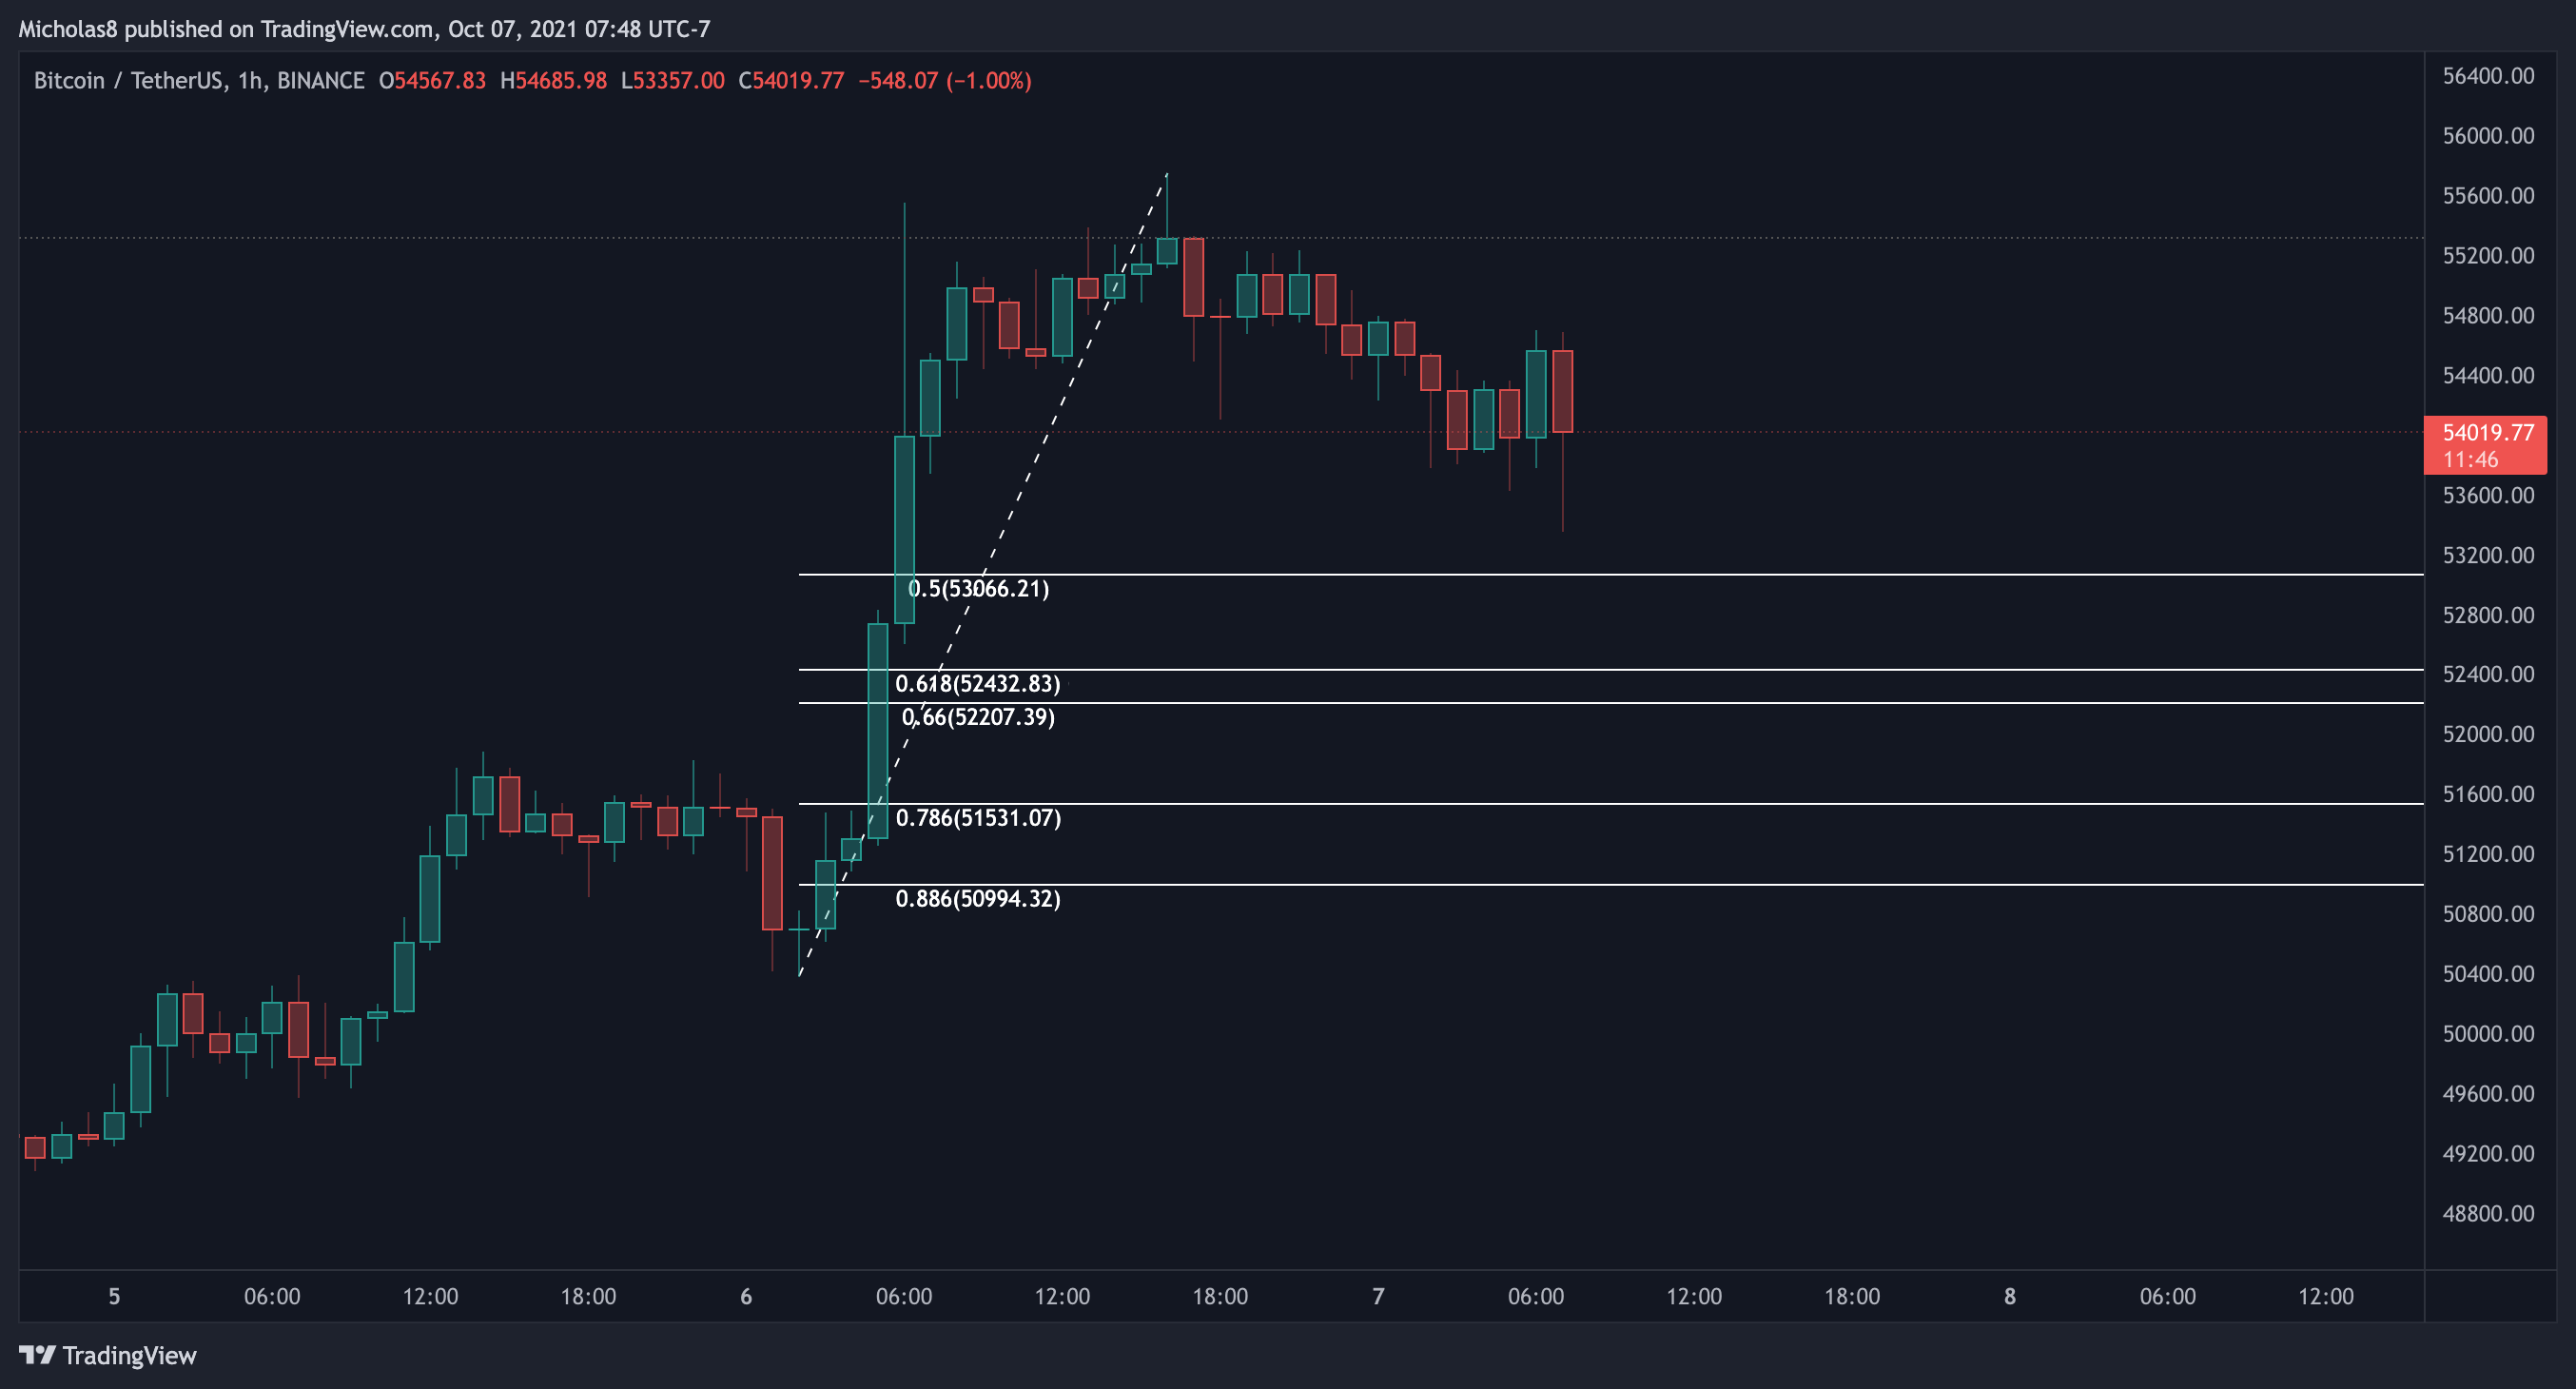
But, if there is still more room to go down, these are the Fibonacci Levels I have my eye on.
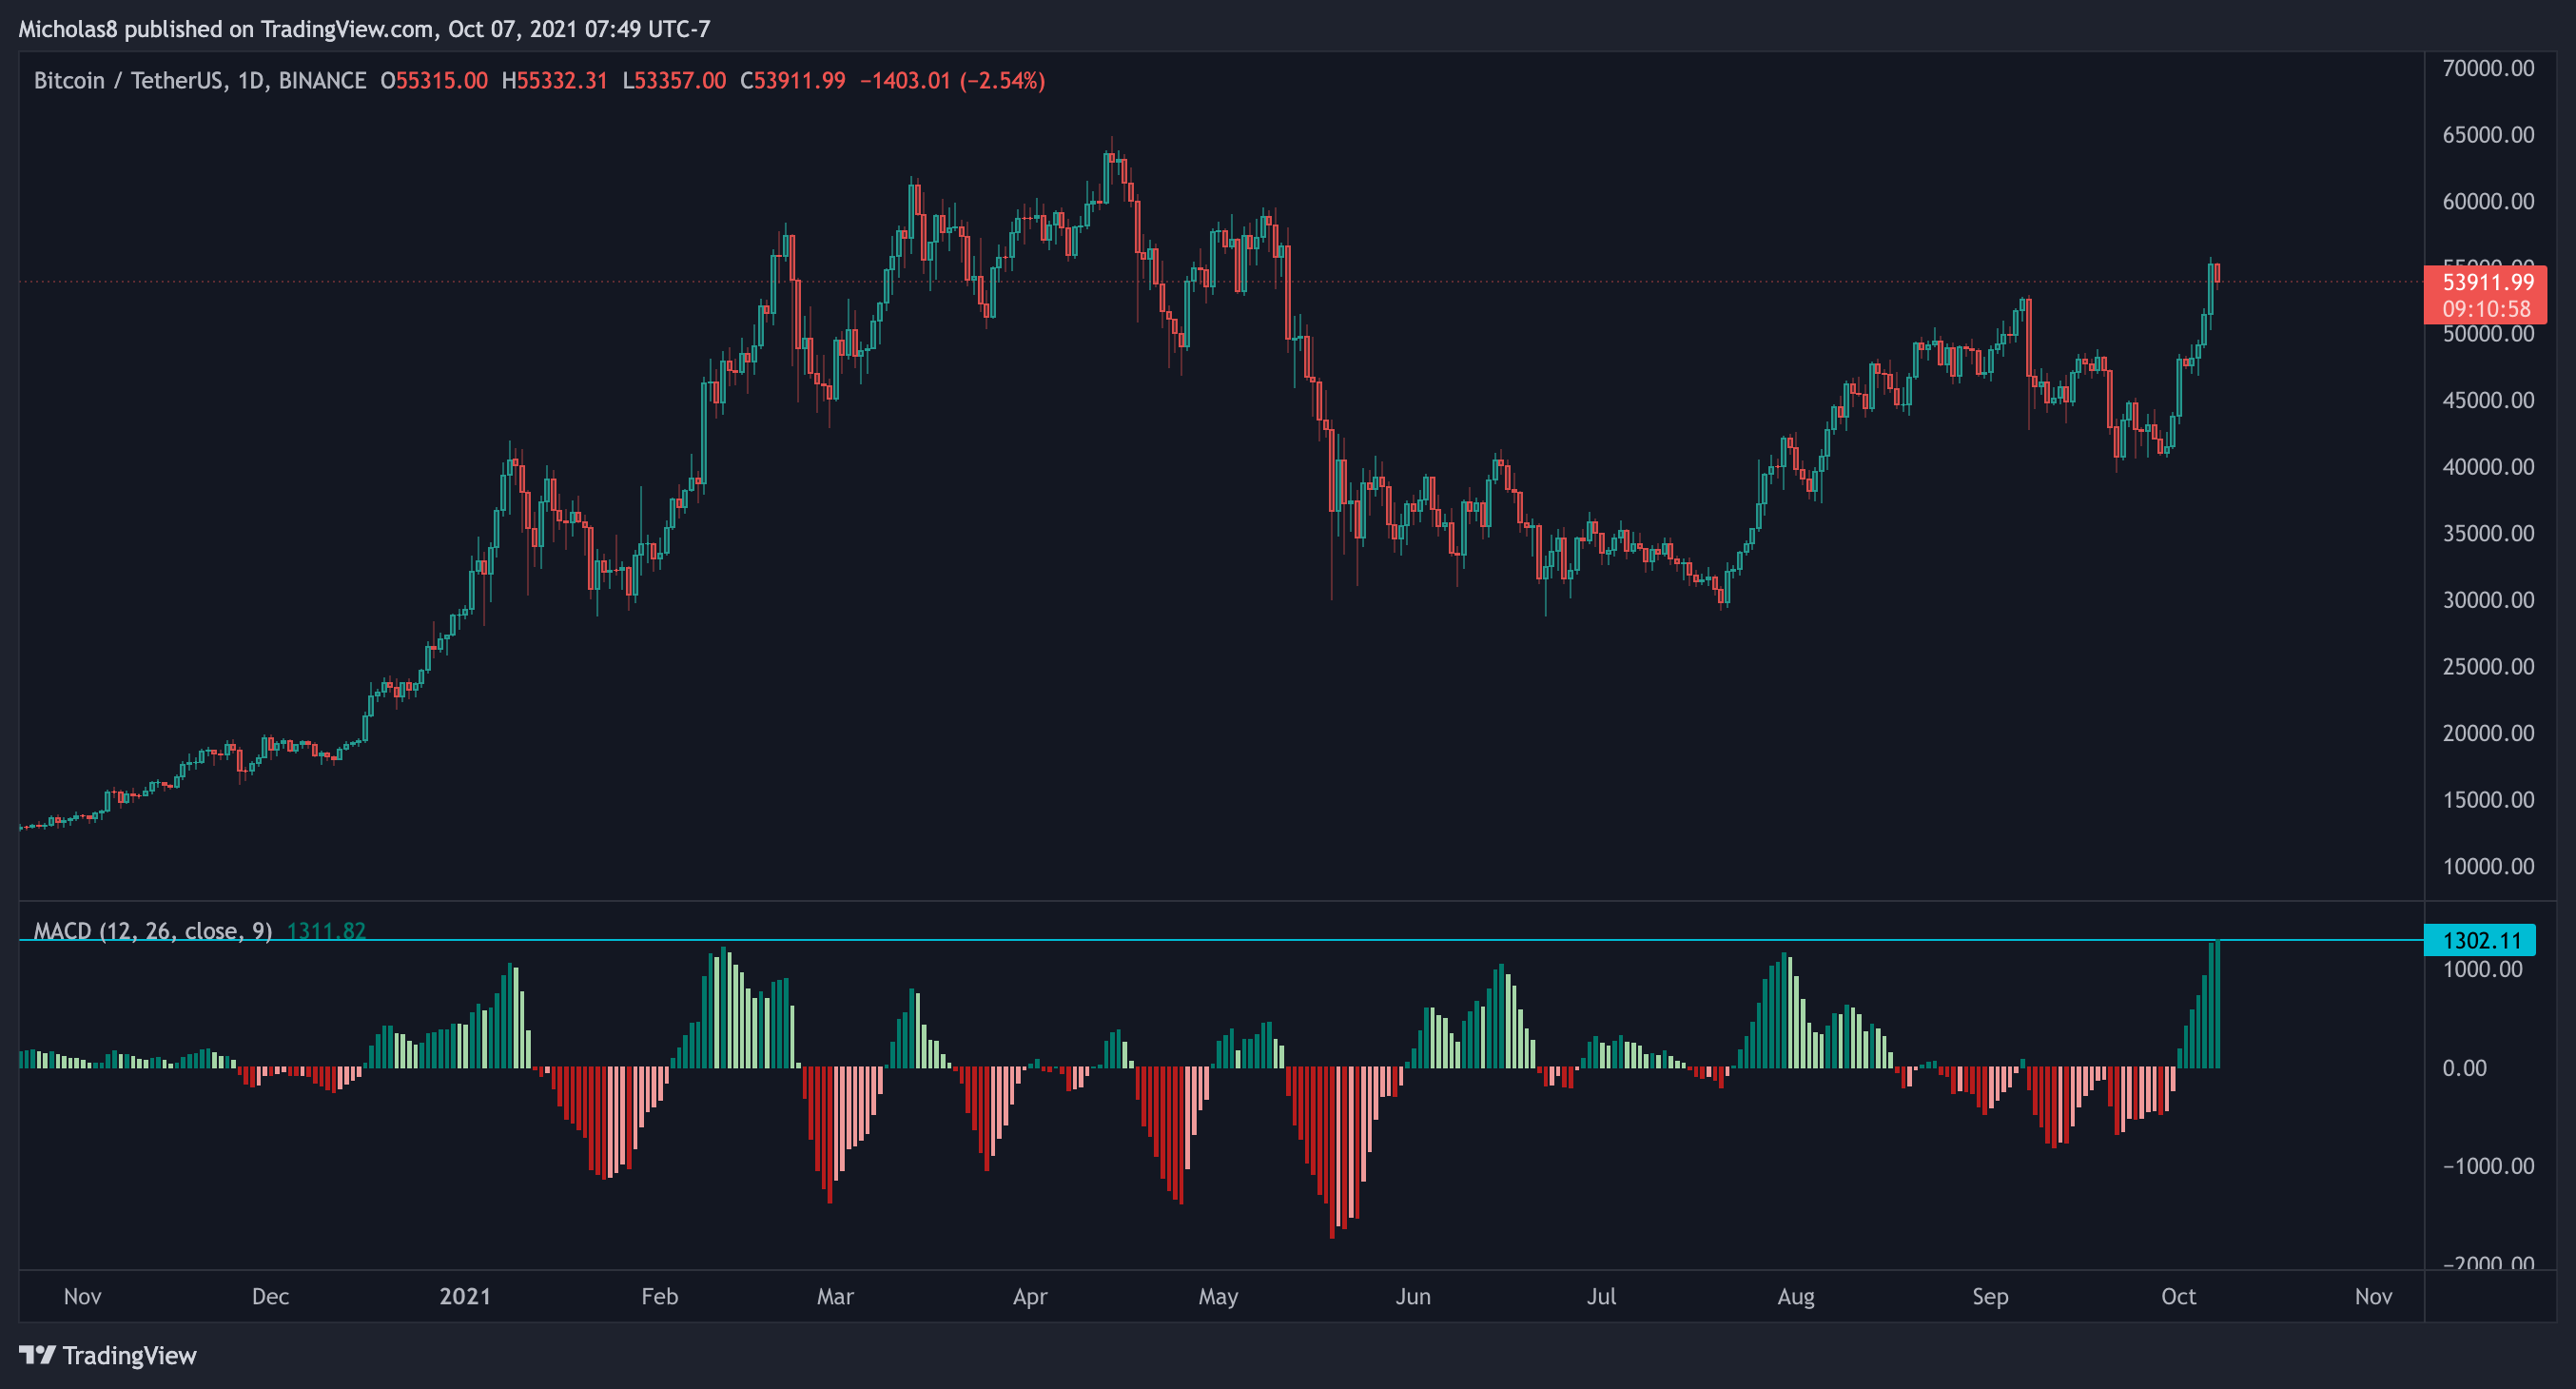
Looking at the 1D chart – the MACD histogram is the highest it's ever been. It wouldn't surprise me at all if we either saw a pullback or consolidation over the next few days.
Harmonic Patterns
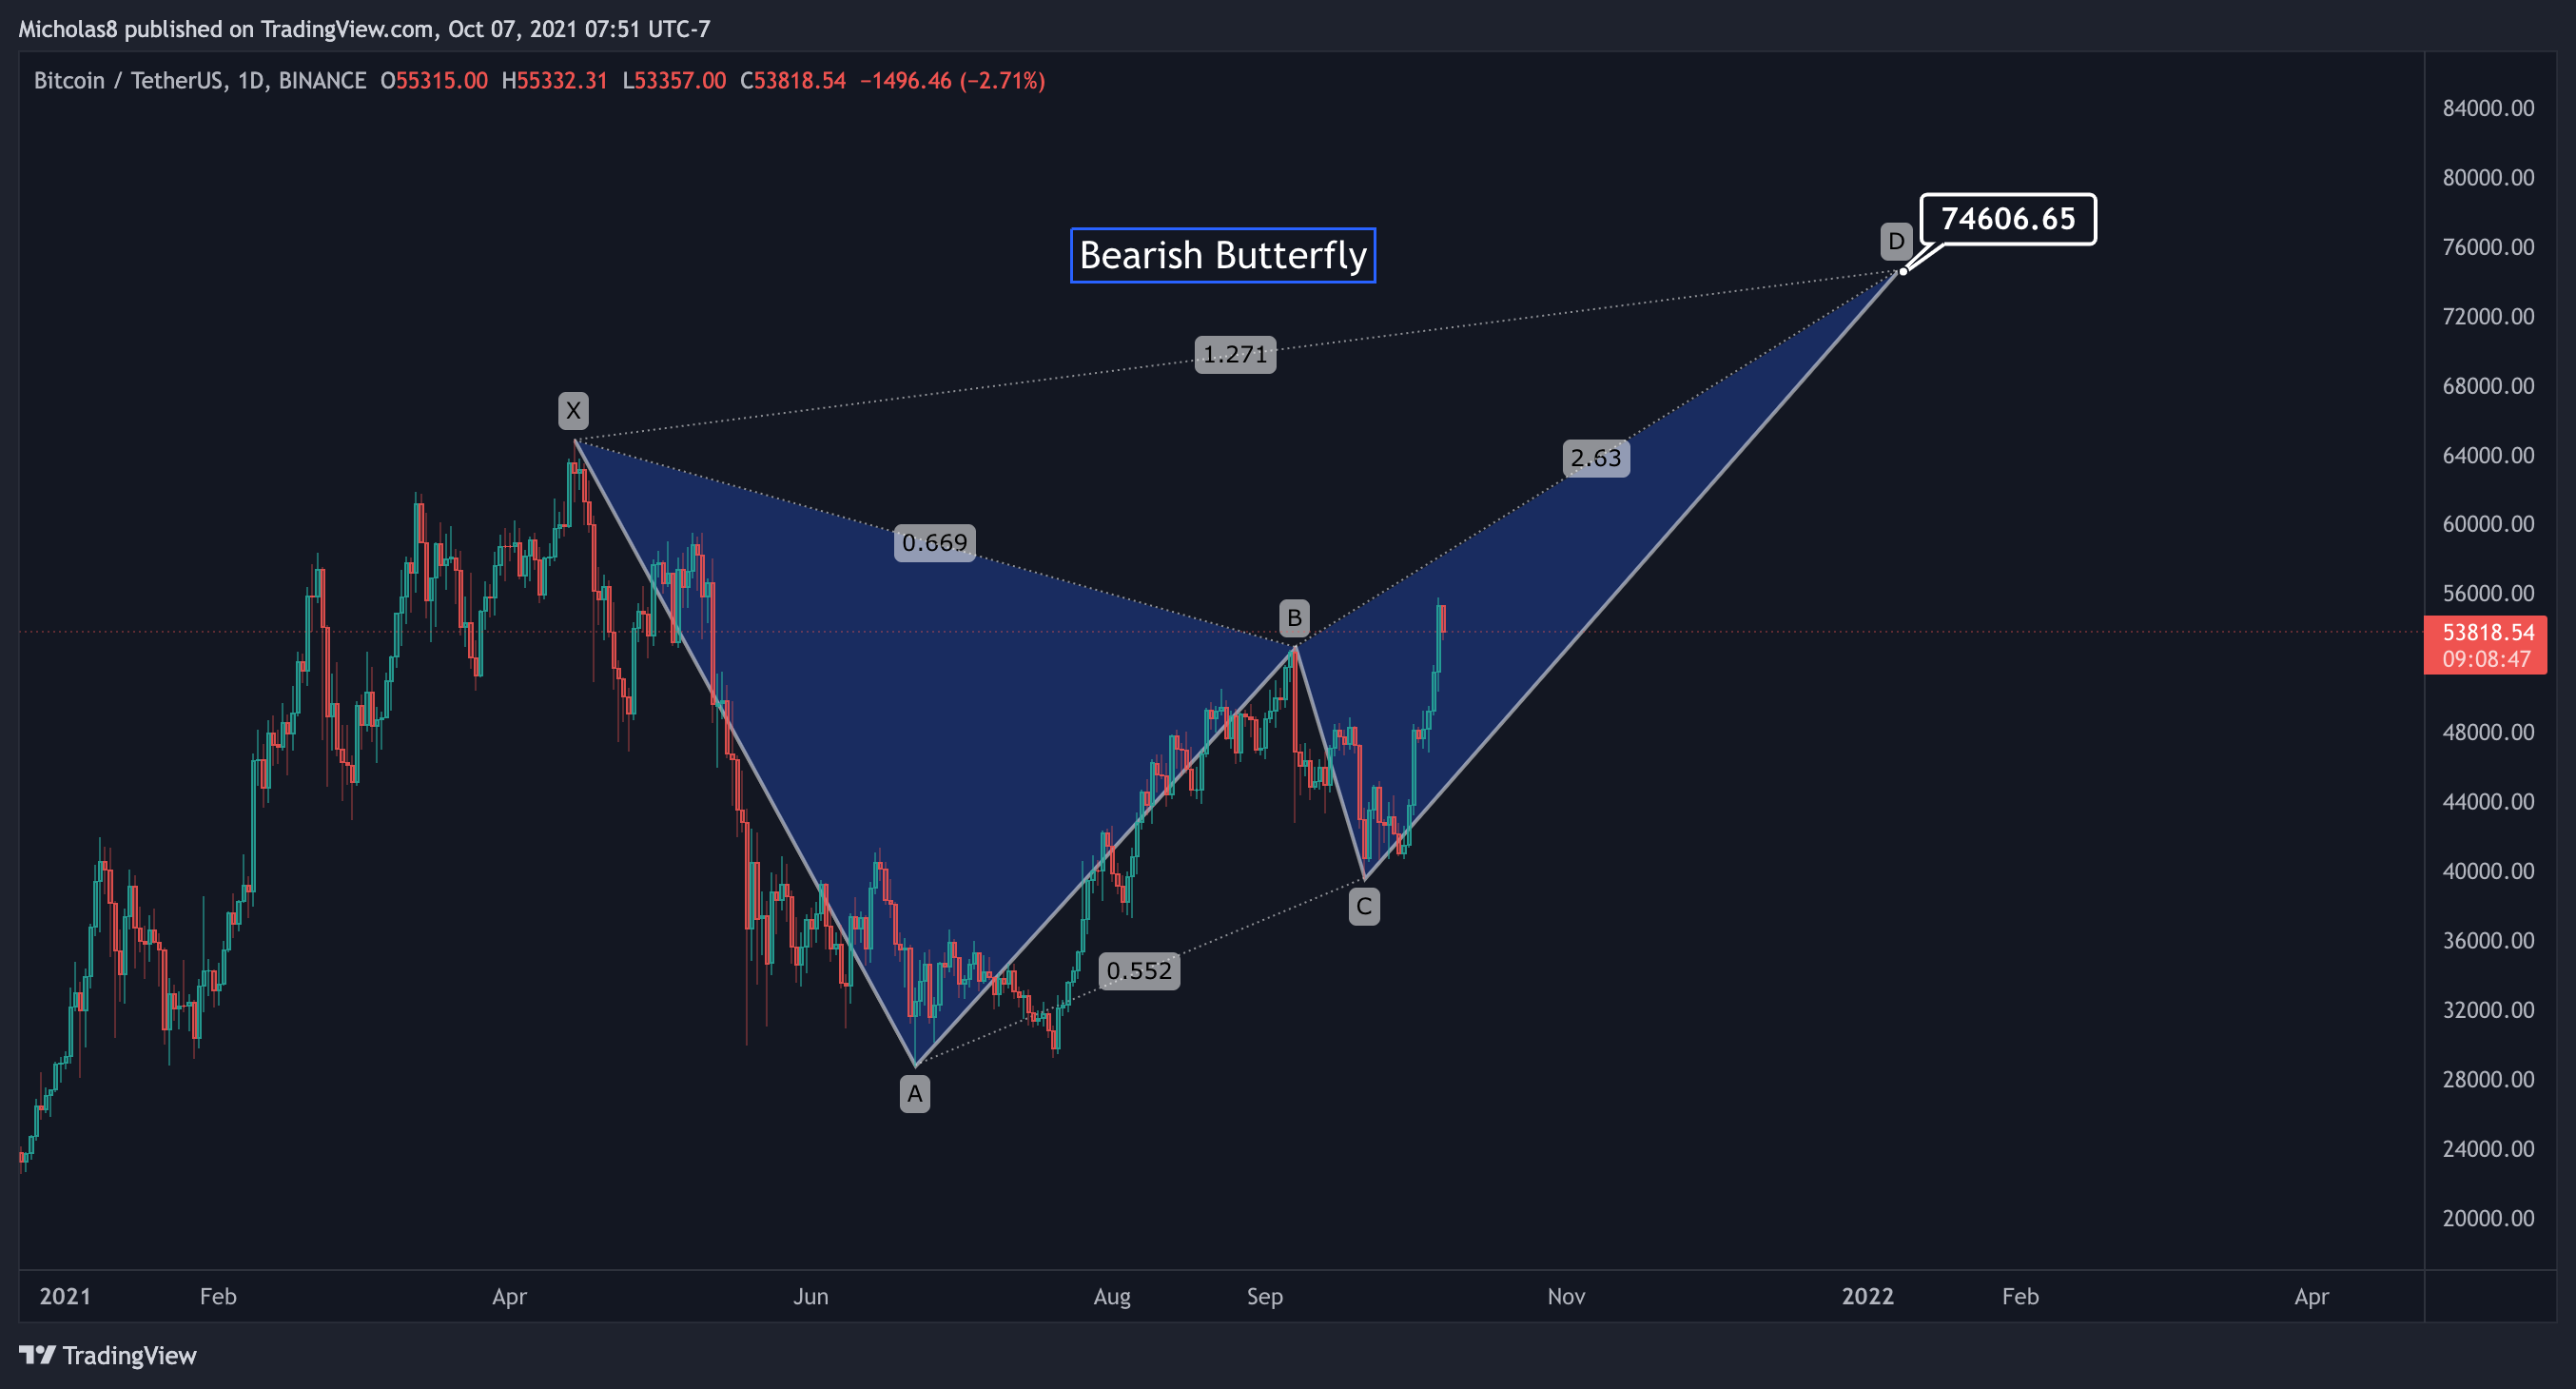
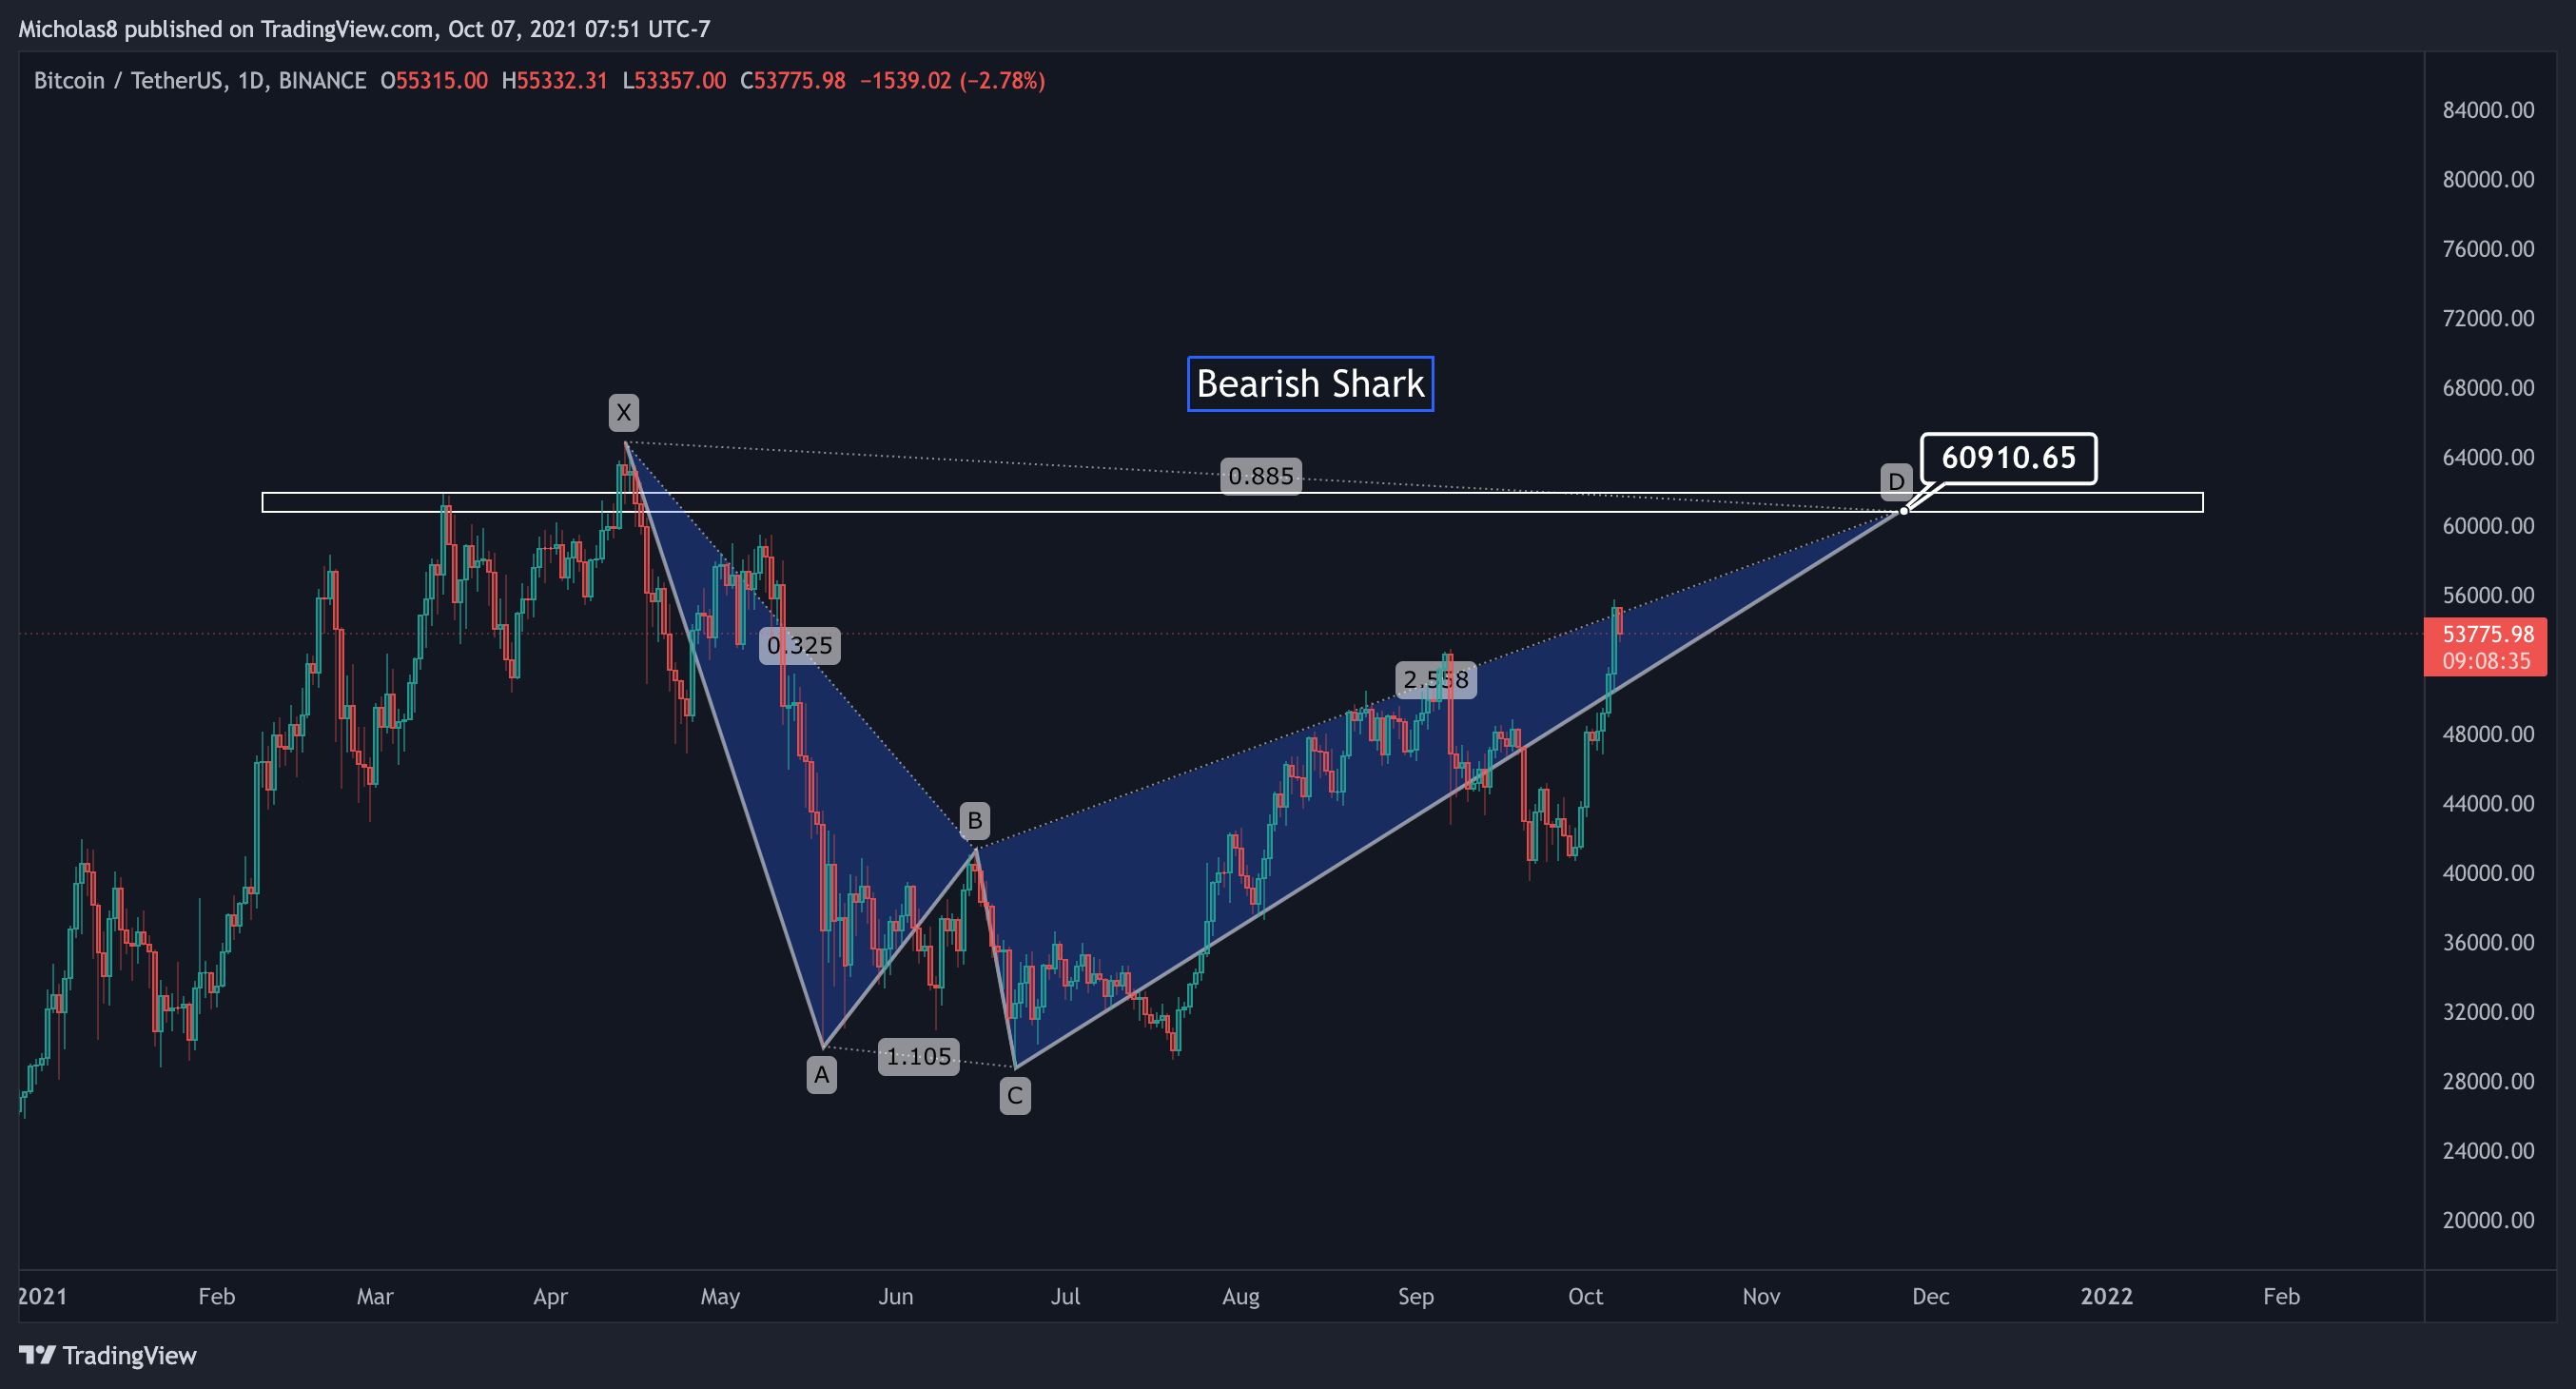
On a more macro-level, if we are to continue our ascent to the moon, these are two Harmonic Patterns targets that I have my eye on. At point 'D', we have the 'PCZ', which is the Pattern Completion Zone. Essentially, that's where there's a high possibility for a reversal or at least to find some resistance. The technical targets are points B, A, and C of the harmonic patterns.
All in all, Bitcoin is still looking good. But, I'm still concerned with DXY looking bullish and the SPX looking bearish, and the possibility that the 3H bearish divergence has not been fully realized.
That's all for now! I hope you found value from this morning's report! Keep an eye out for the daily report coming out in about 8 hours!
Thank you for your continued support and I hope you have a great rest of your week.
Cheers!
Premium Membership
For information on the different premium memberships, please visit: https://www.buymeacoffee.com/MICKrypto
To take advantage of the Canadian Thanksgiving Sale, please follow the instructions in this link: https://www.buymeacoffee.com/MICKrypto/thanksgiving-sale
Today's Diamond Member Profits