

I recommend reading these reports on the Buy Me A Coffee platform for optimal formatting.
You will find the content below in this order:
1. Definitions
2. The Good
3. The Bad
4. CME Gaps
5. Key Levels
6. Final Thoughts
DEFINITIONS
Liquidity zones are high volume levels that offer support and resistance
Hidden bearish divergence: creating a lower high in price, with a higher high on the oscillators. This signals a possible trend continuation down.
Bearish divergence: higher high in price, lower high on the oscillators. This signals a possible trend reversal down.
Hidden bullish divergence: creating a higher low in price, with a lower low on the oscillators. This signals a possible trend continuation up.
Bullish divergence: creating a lower low in price, with a higher low on the oscillators. This signals a possible trend reversal up.
SR flip: turning old resistance into support, and vice-versa.
Fractal: recurring geometric pattern.
THE GOOD
Daily Timeframe
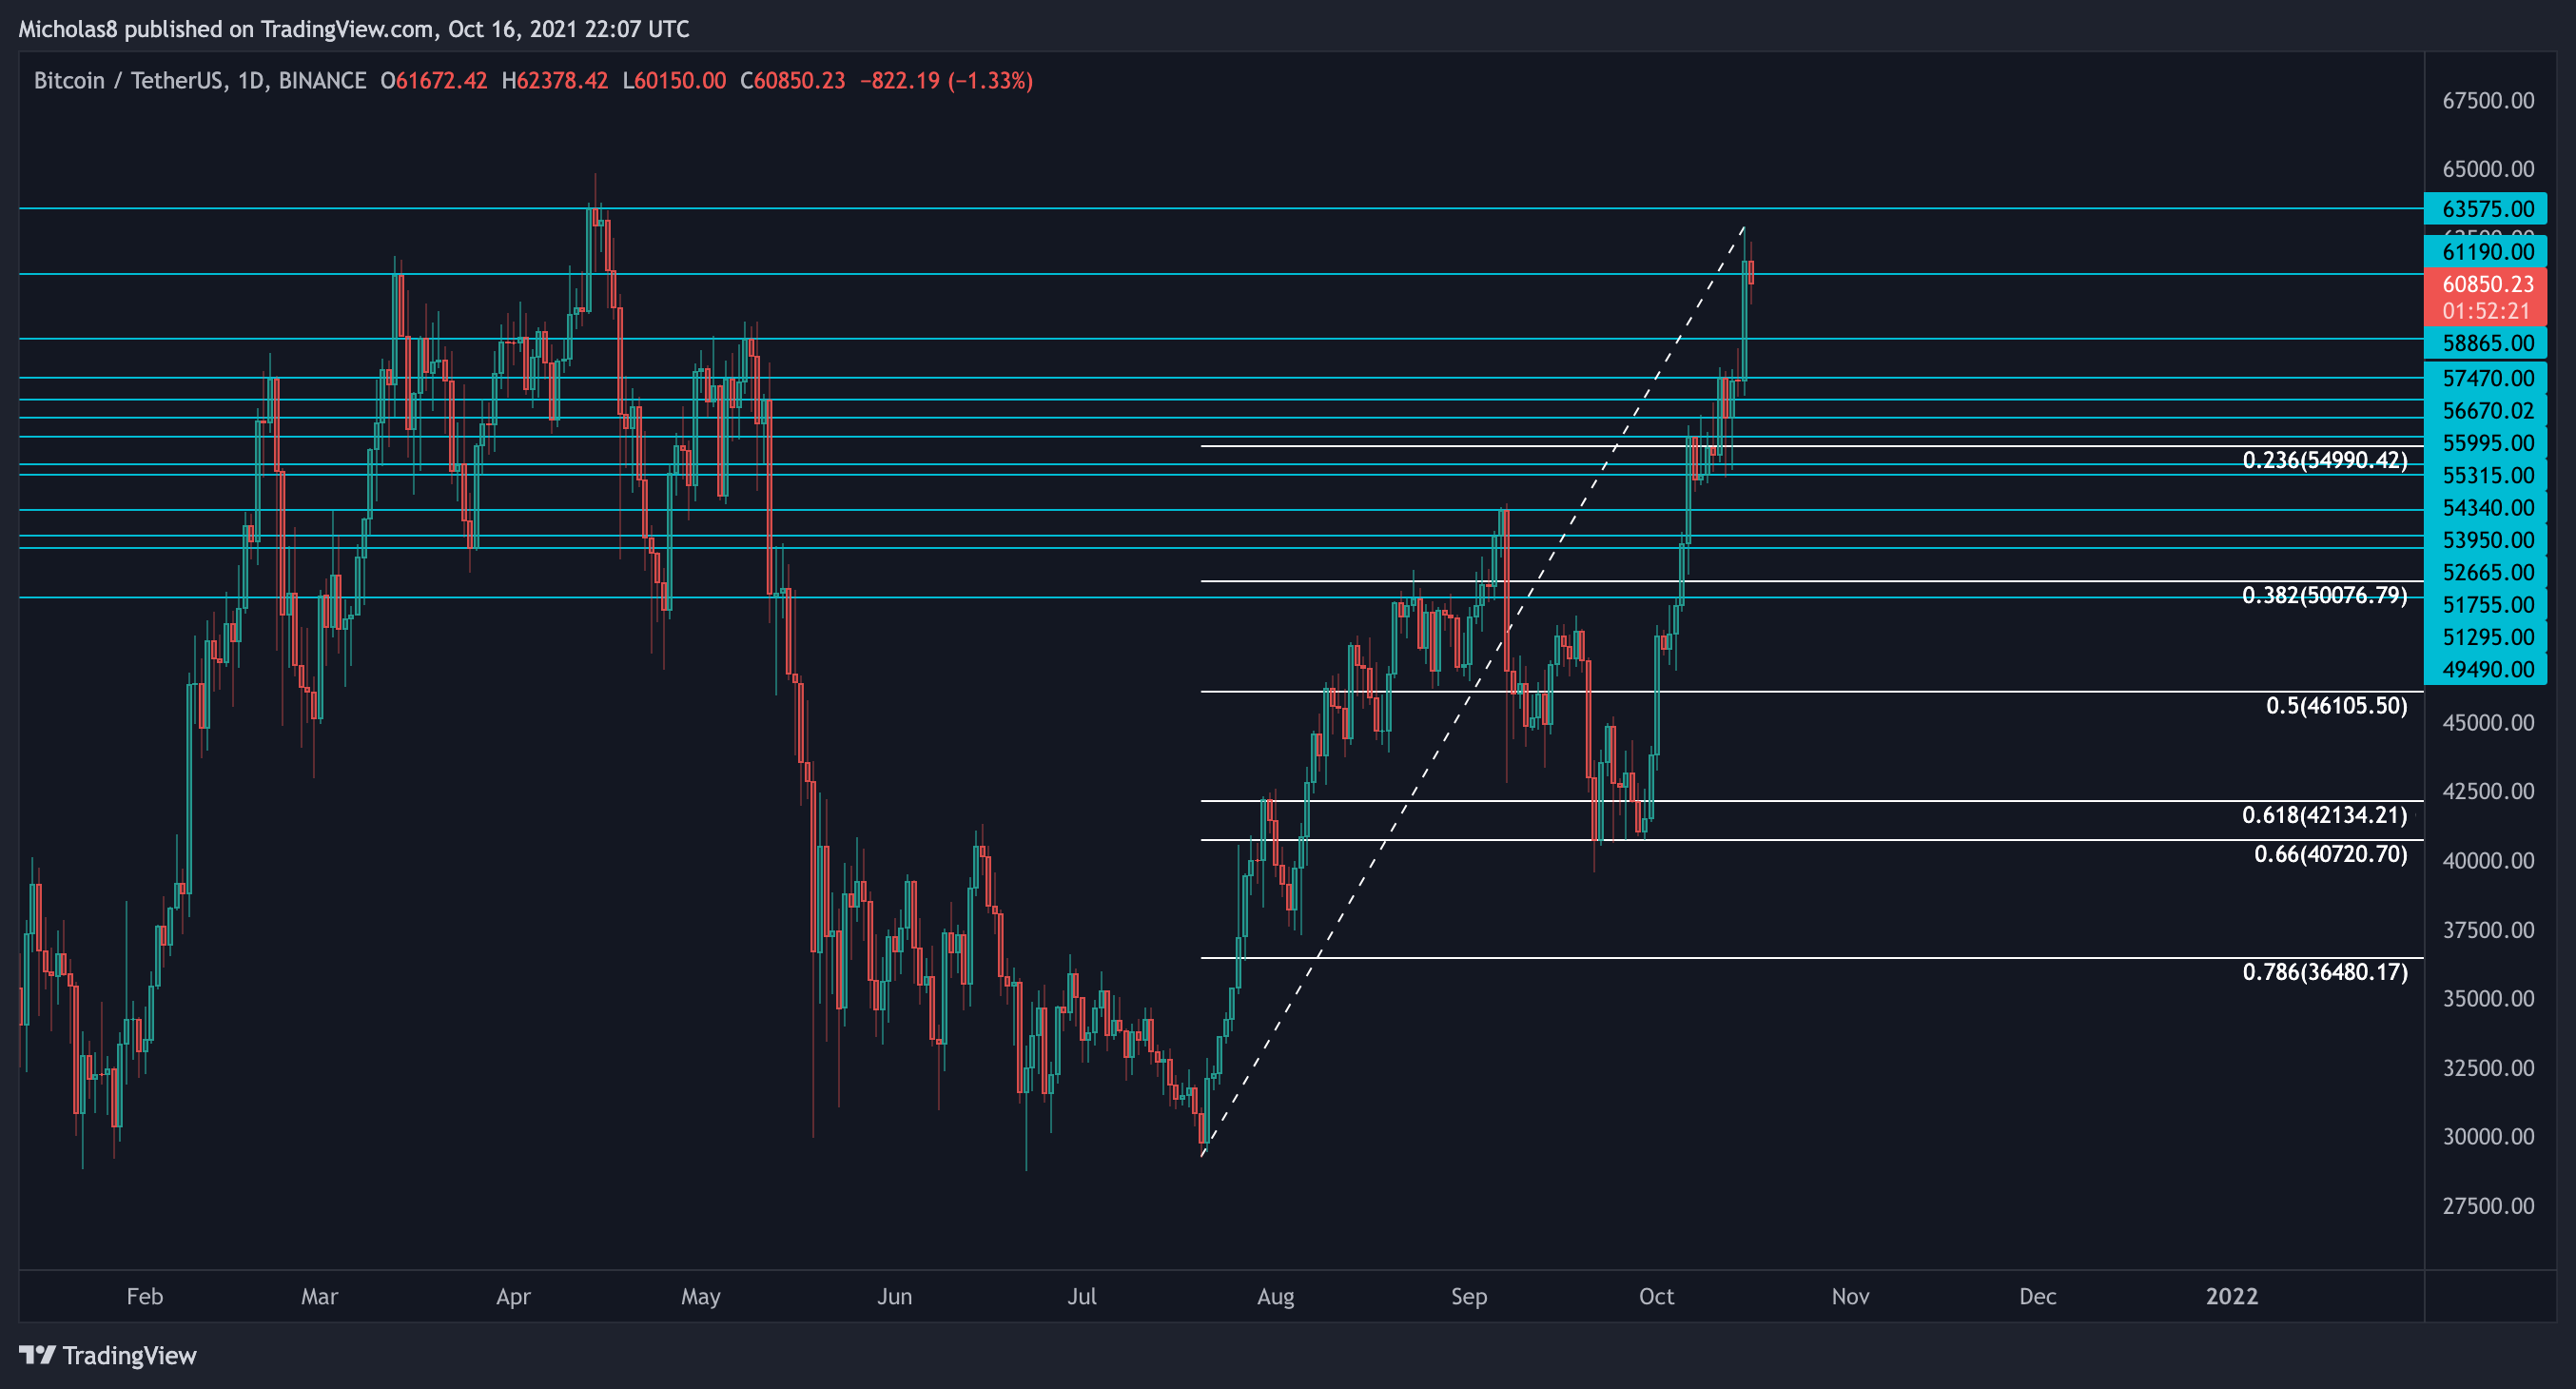
Logarithmic Curve
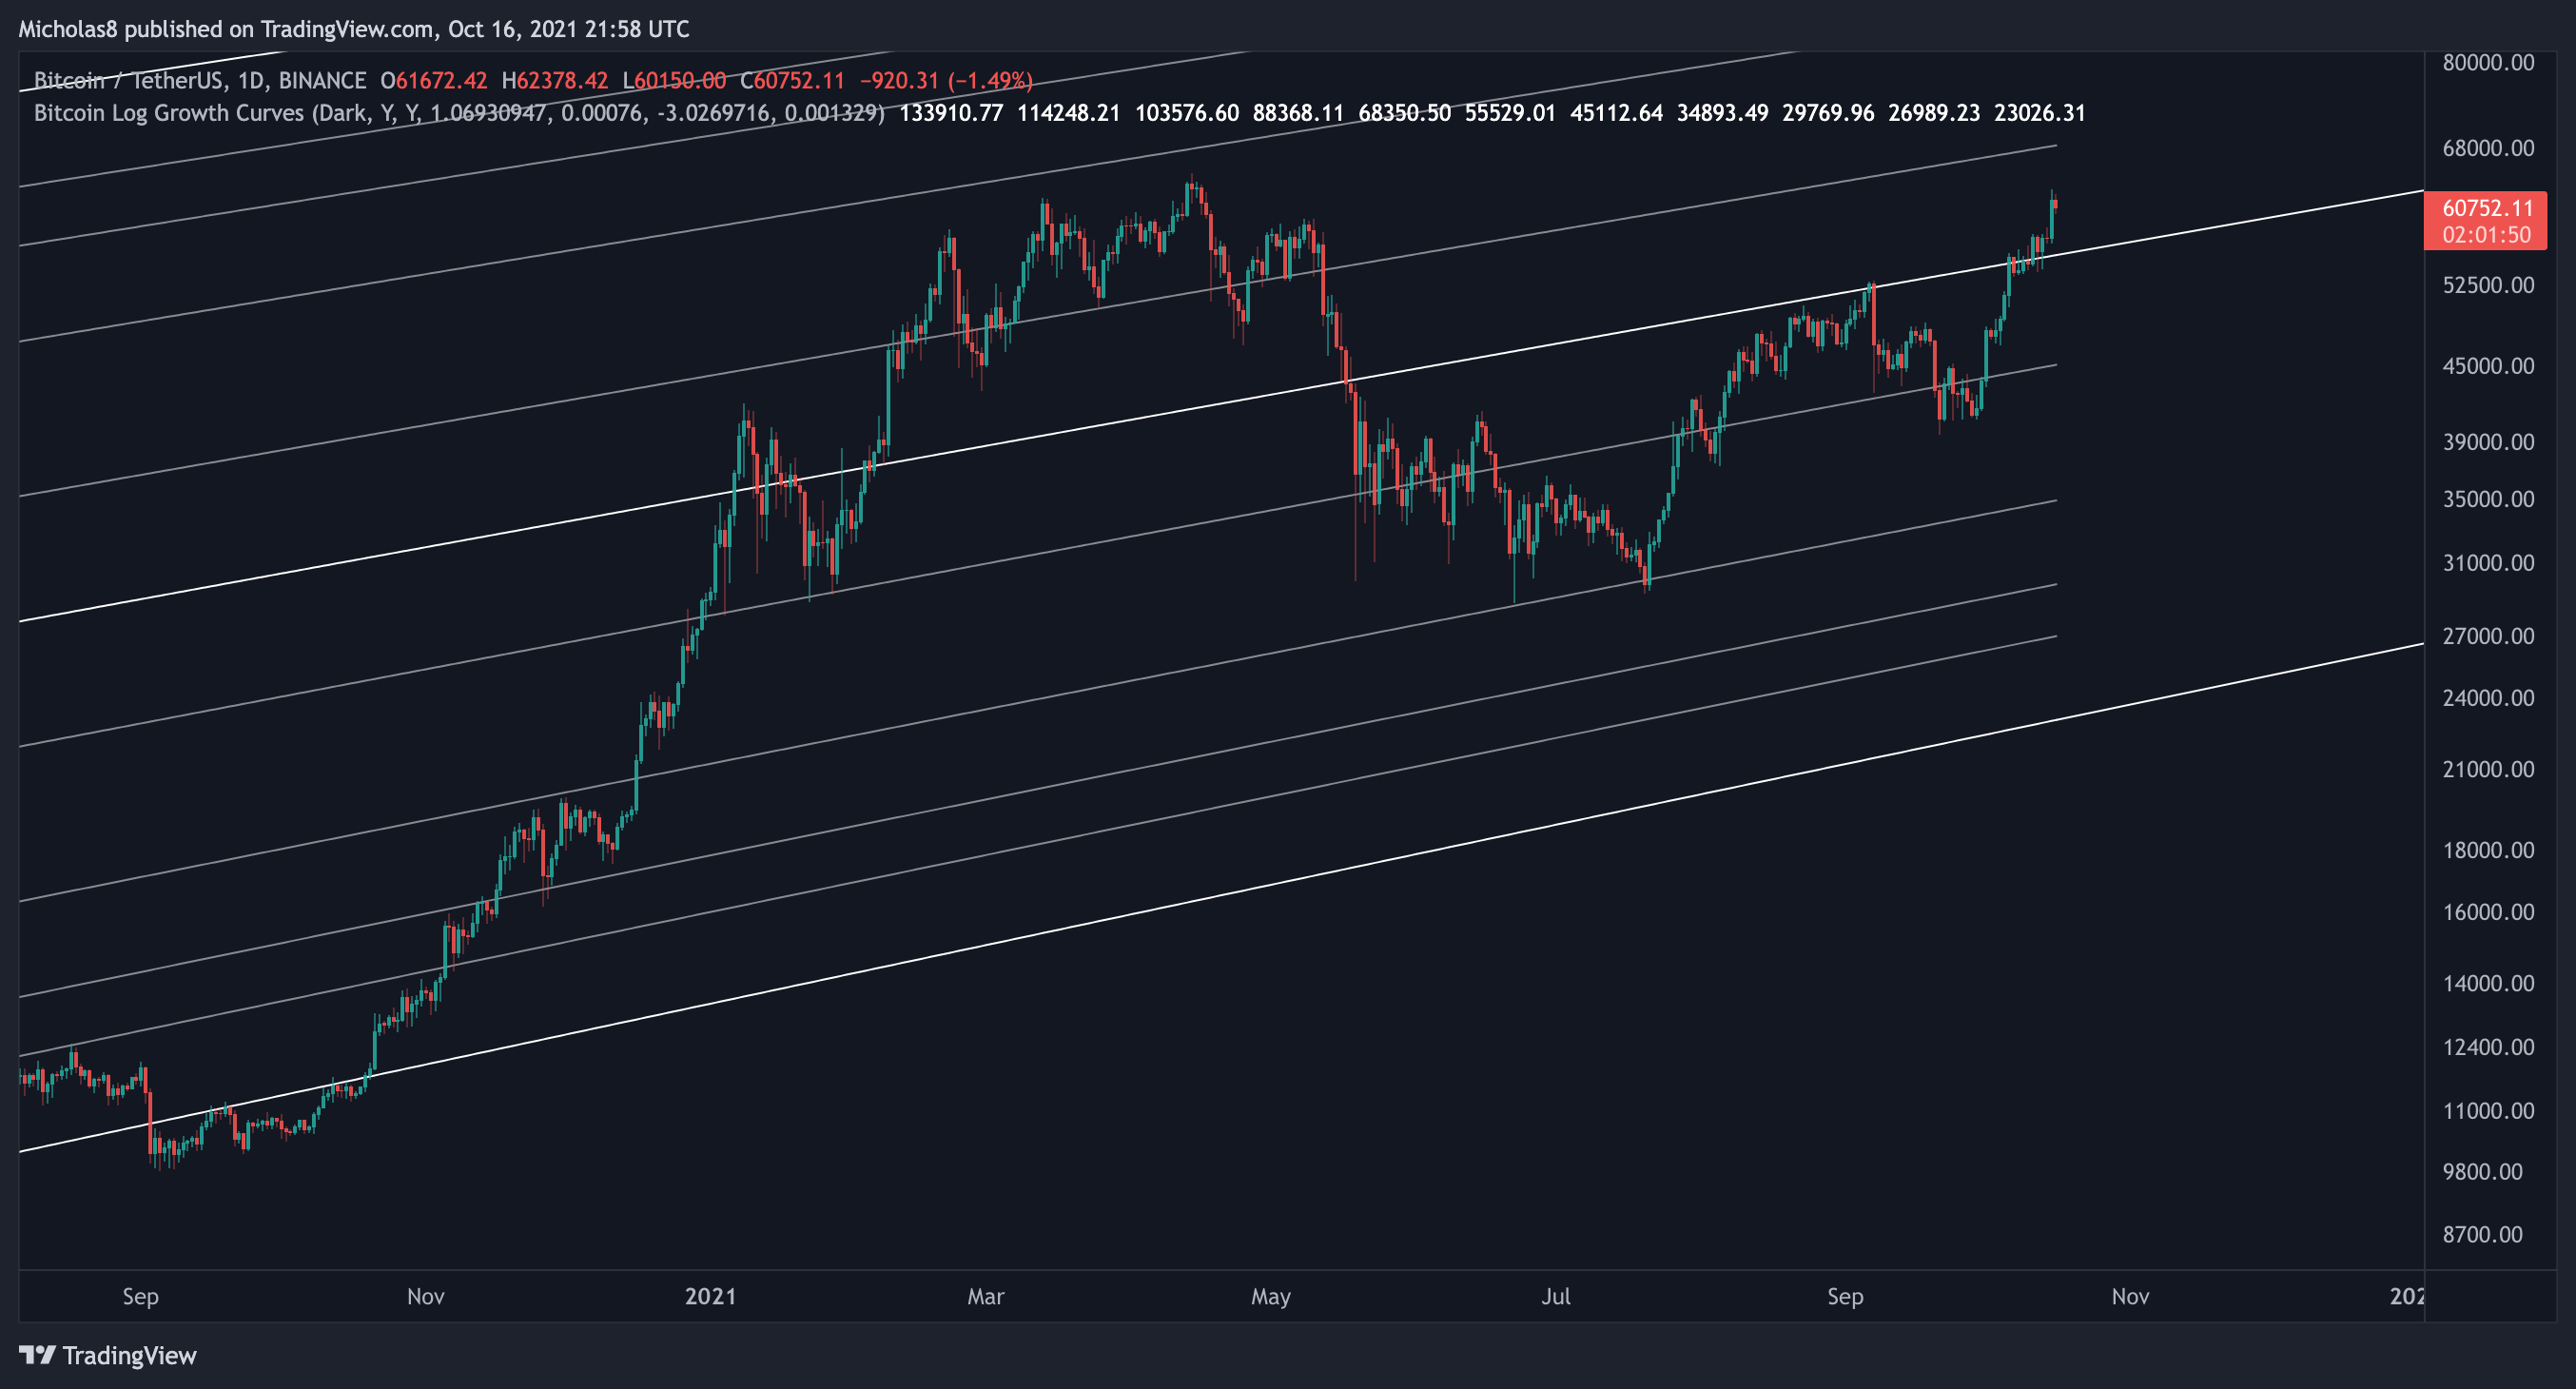
We have now seen multiple candles close above the median line. To me, this is extremely bullish. Ideally, we make our way up to the next Fibonacci level, which is the 61.8.
Bullish Structure
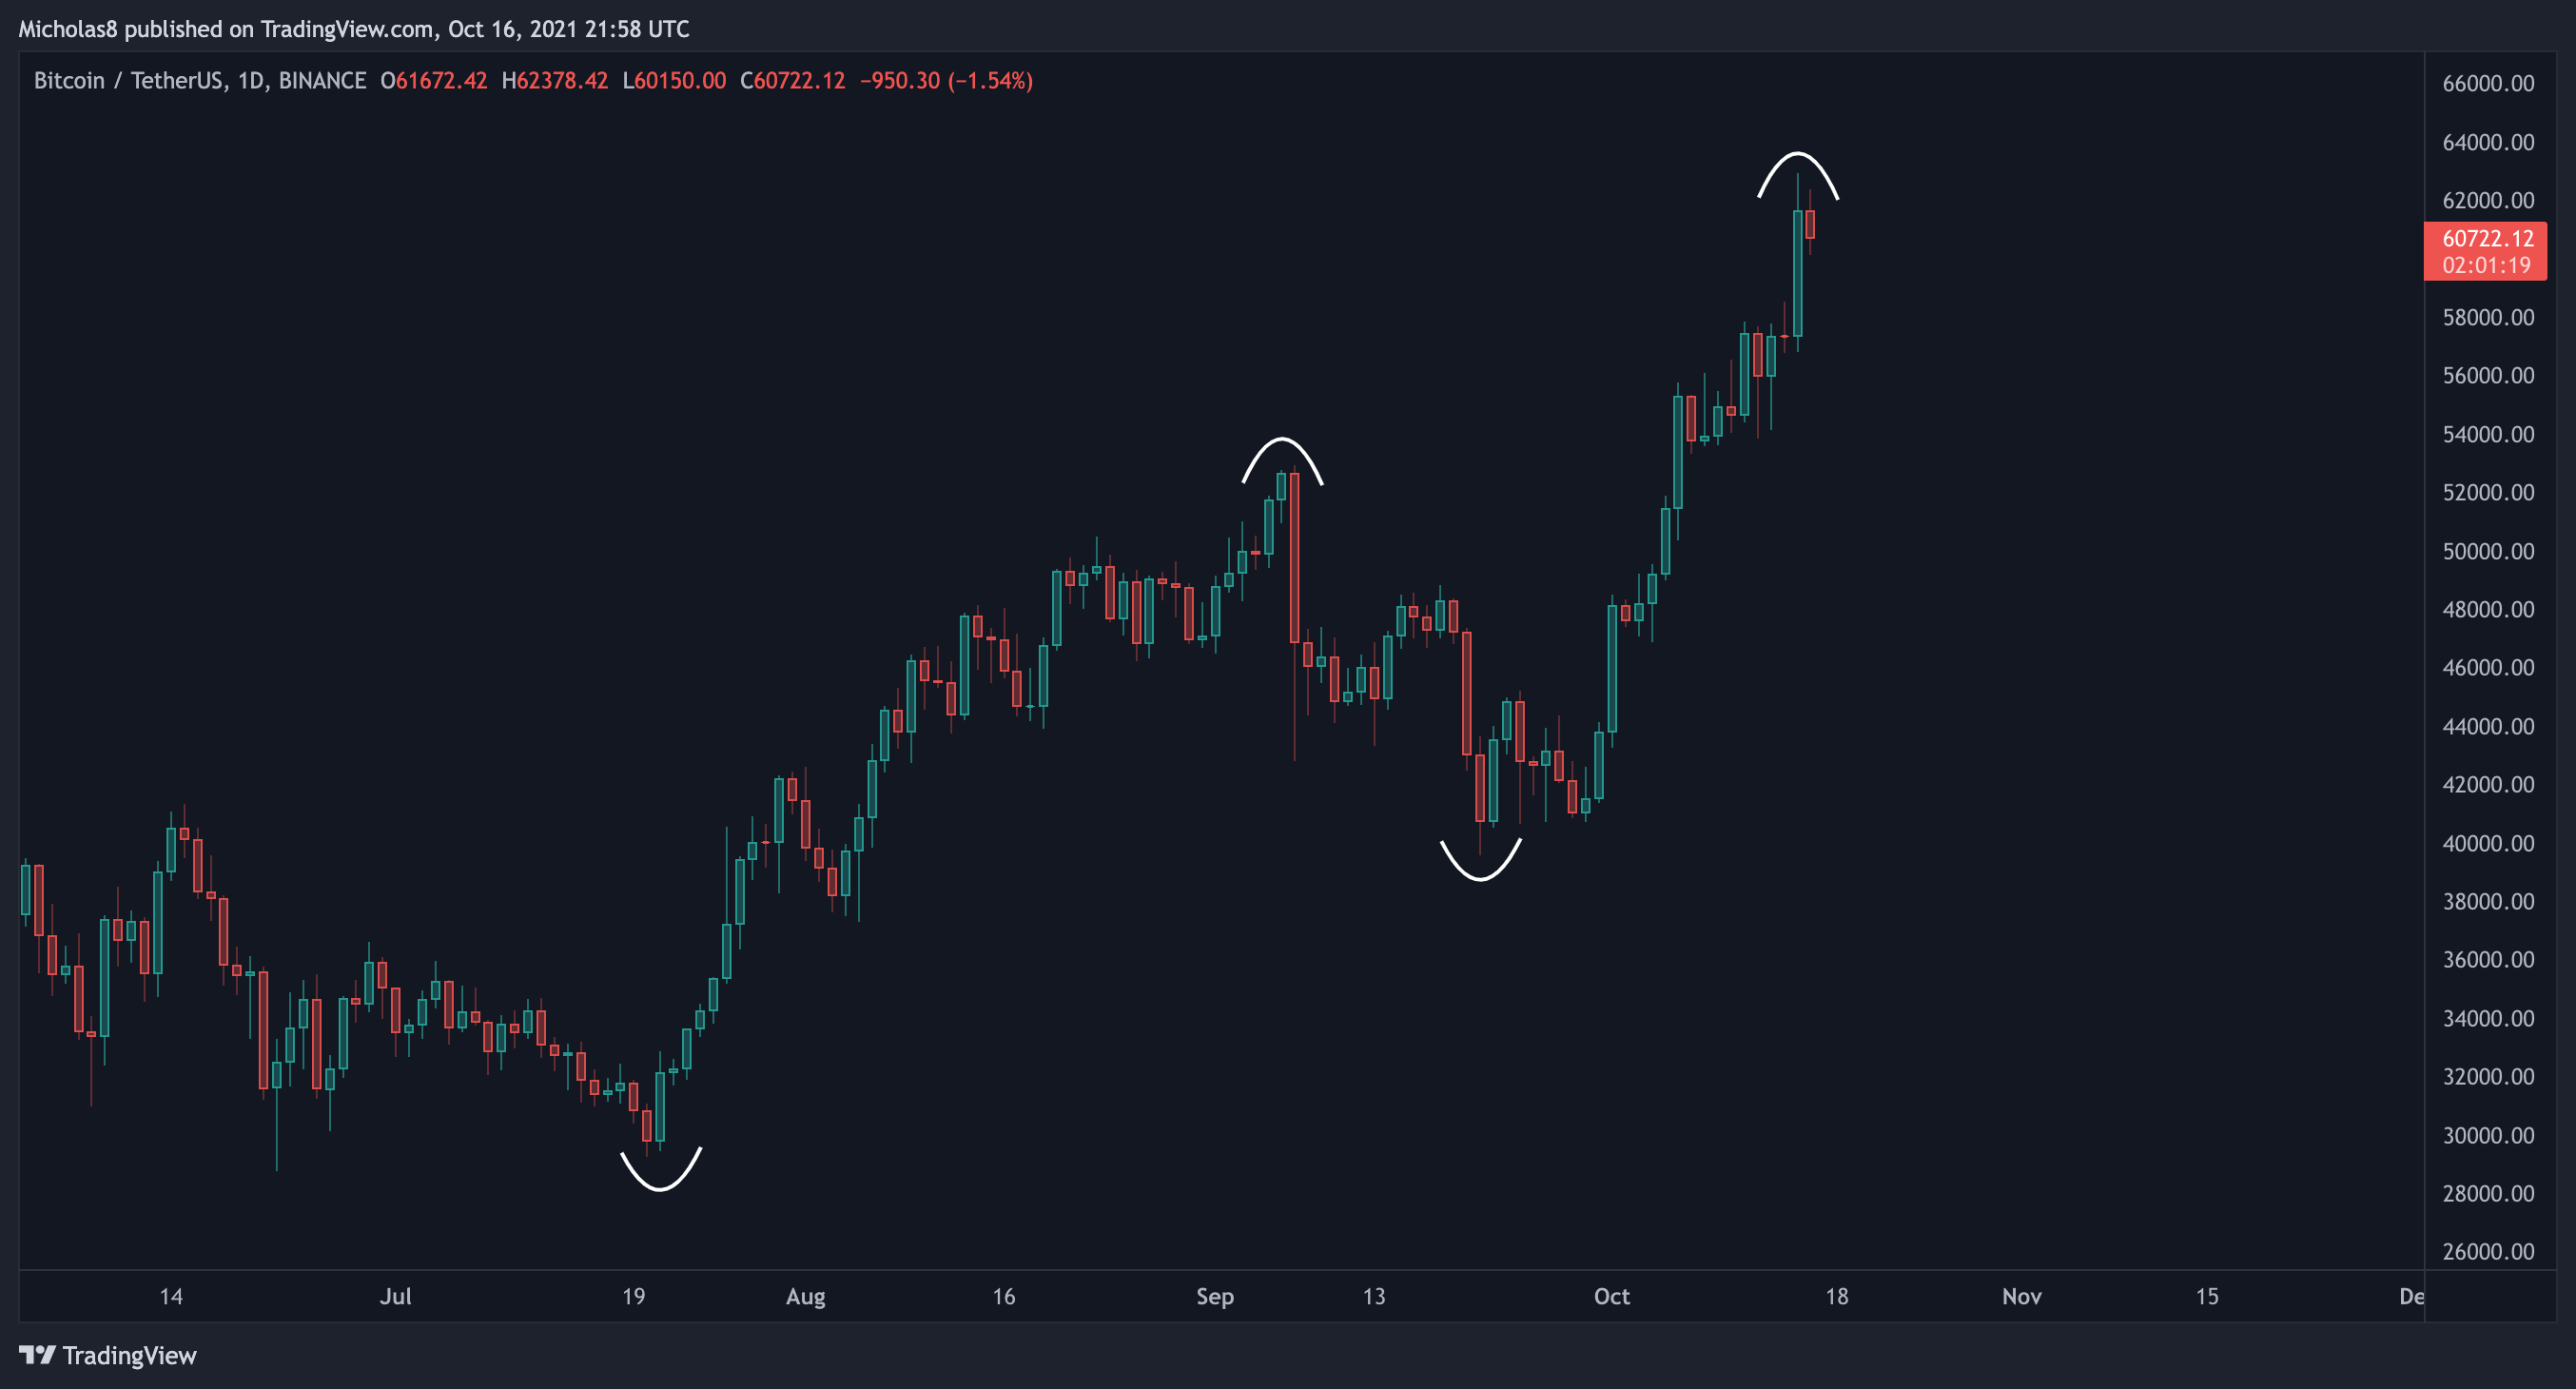
As long as Bitcoin continues to build on this higher high, and higher low structure, we can remain reasonably bullish.
Key Liquidity Zone (LQZ)
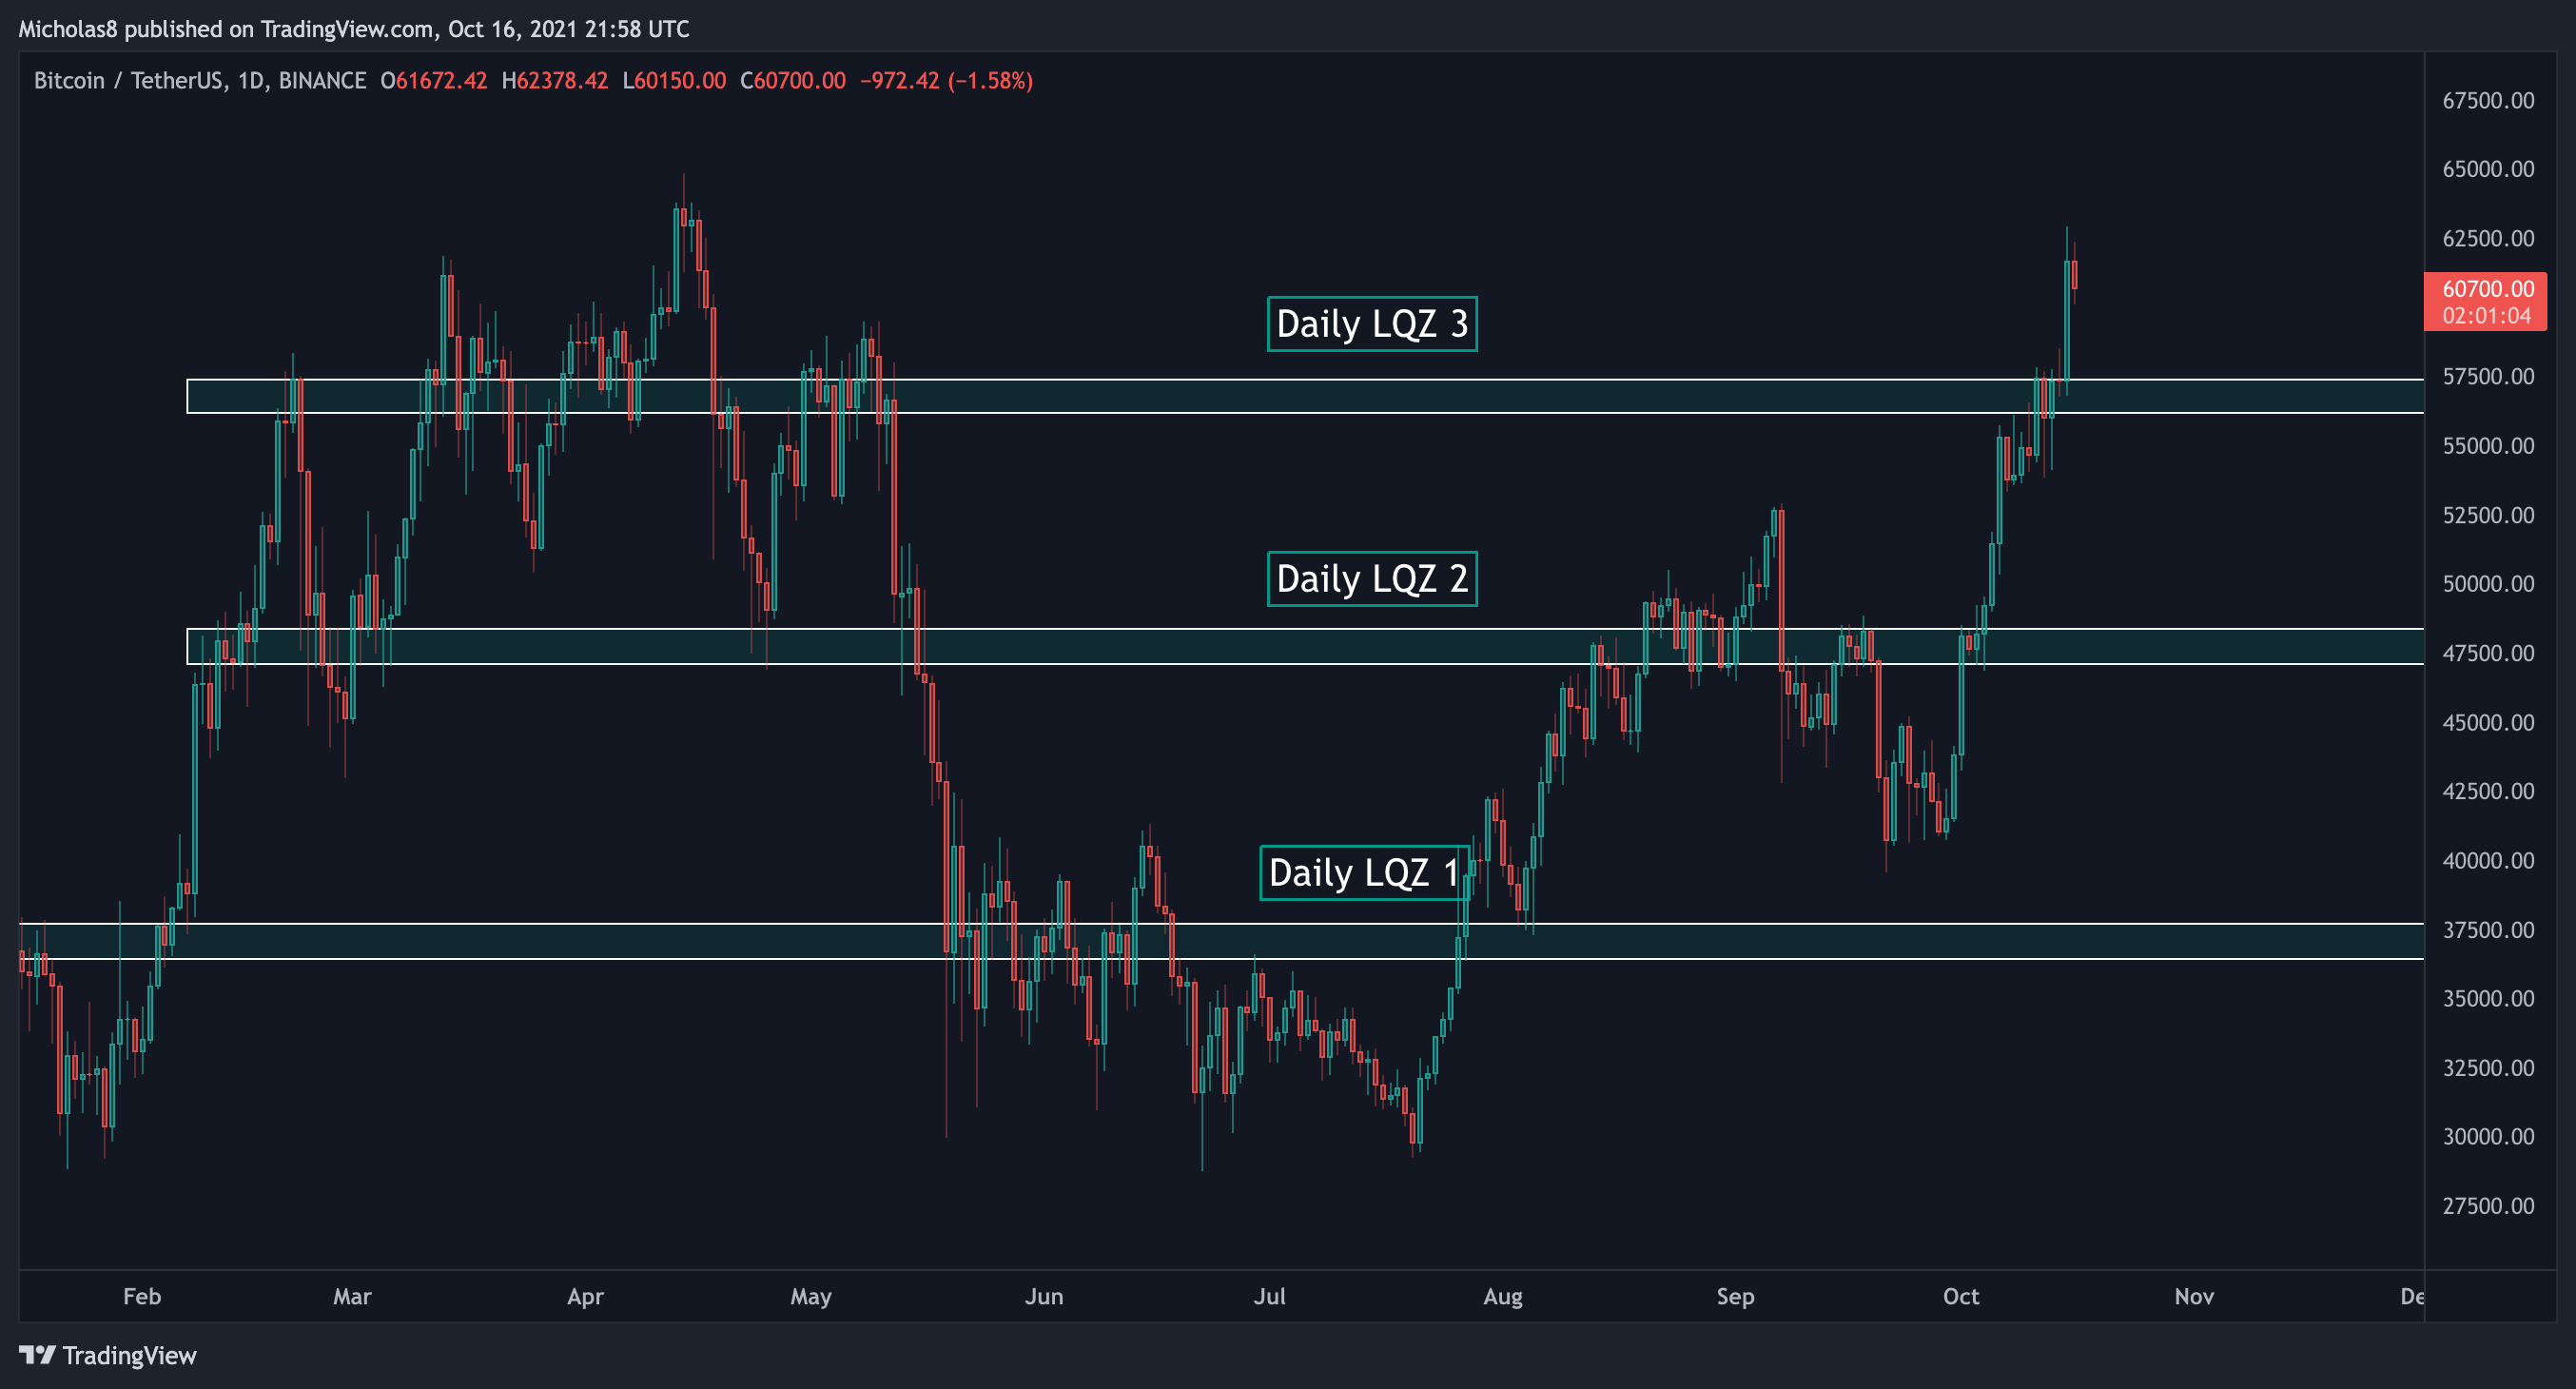
Zone 1: Sitting between 36.4k and 37.7k, Bitcoin is still trading above this Key Daily Liquidity Zone. As long Bitcoin remains above this zone, we can expect it to act as support.
Zone 2: The second LQZ sits at 47.1k - 48.4k. We have reclaimed this as support!
Zone 3: The final daily liquidity zone sits at 56.2k-57.4k. This was the last major LQZ that was holding the price of Bitcoin down. As we can see in the chart above, the moment we broke through it we saw an insane pump follow. Ideally, this serves as strong support moving forward.
Network Value to Transaction (NVT)
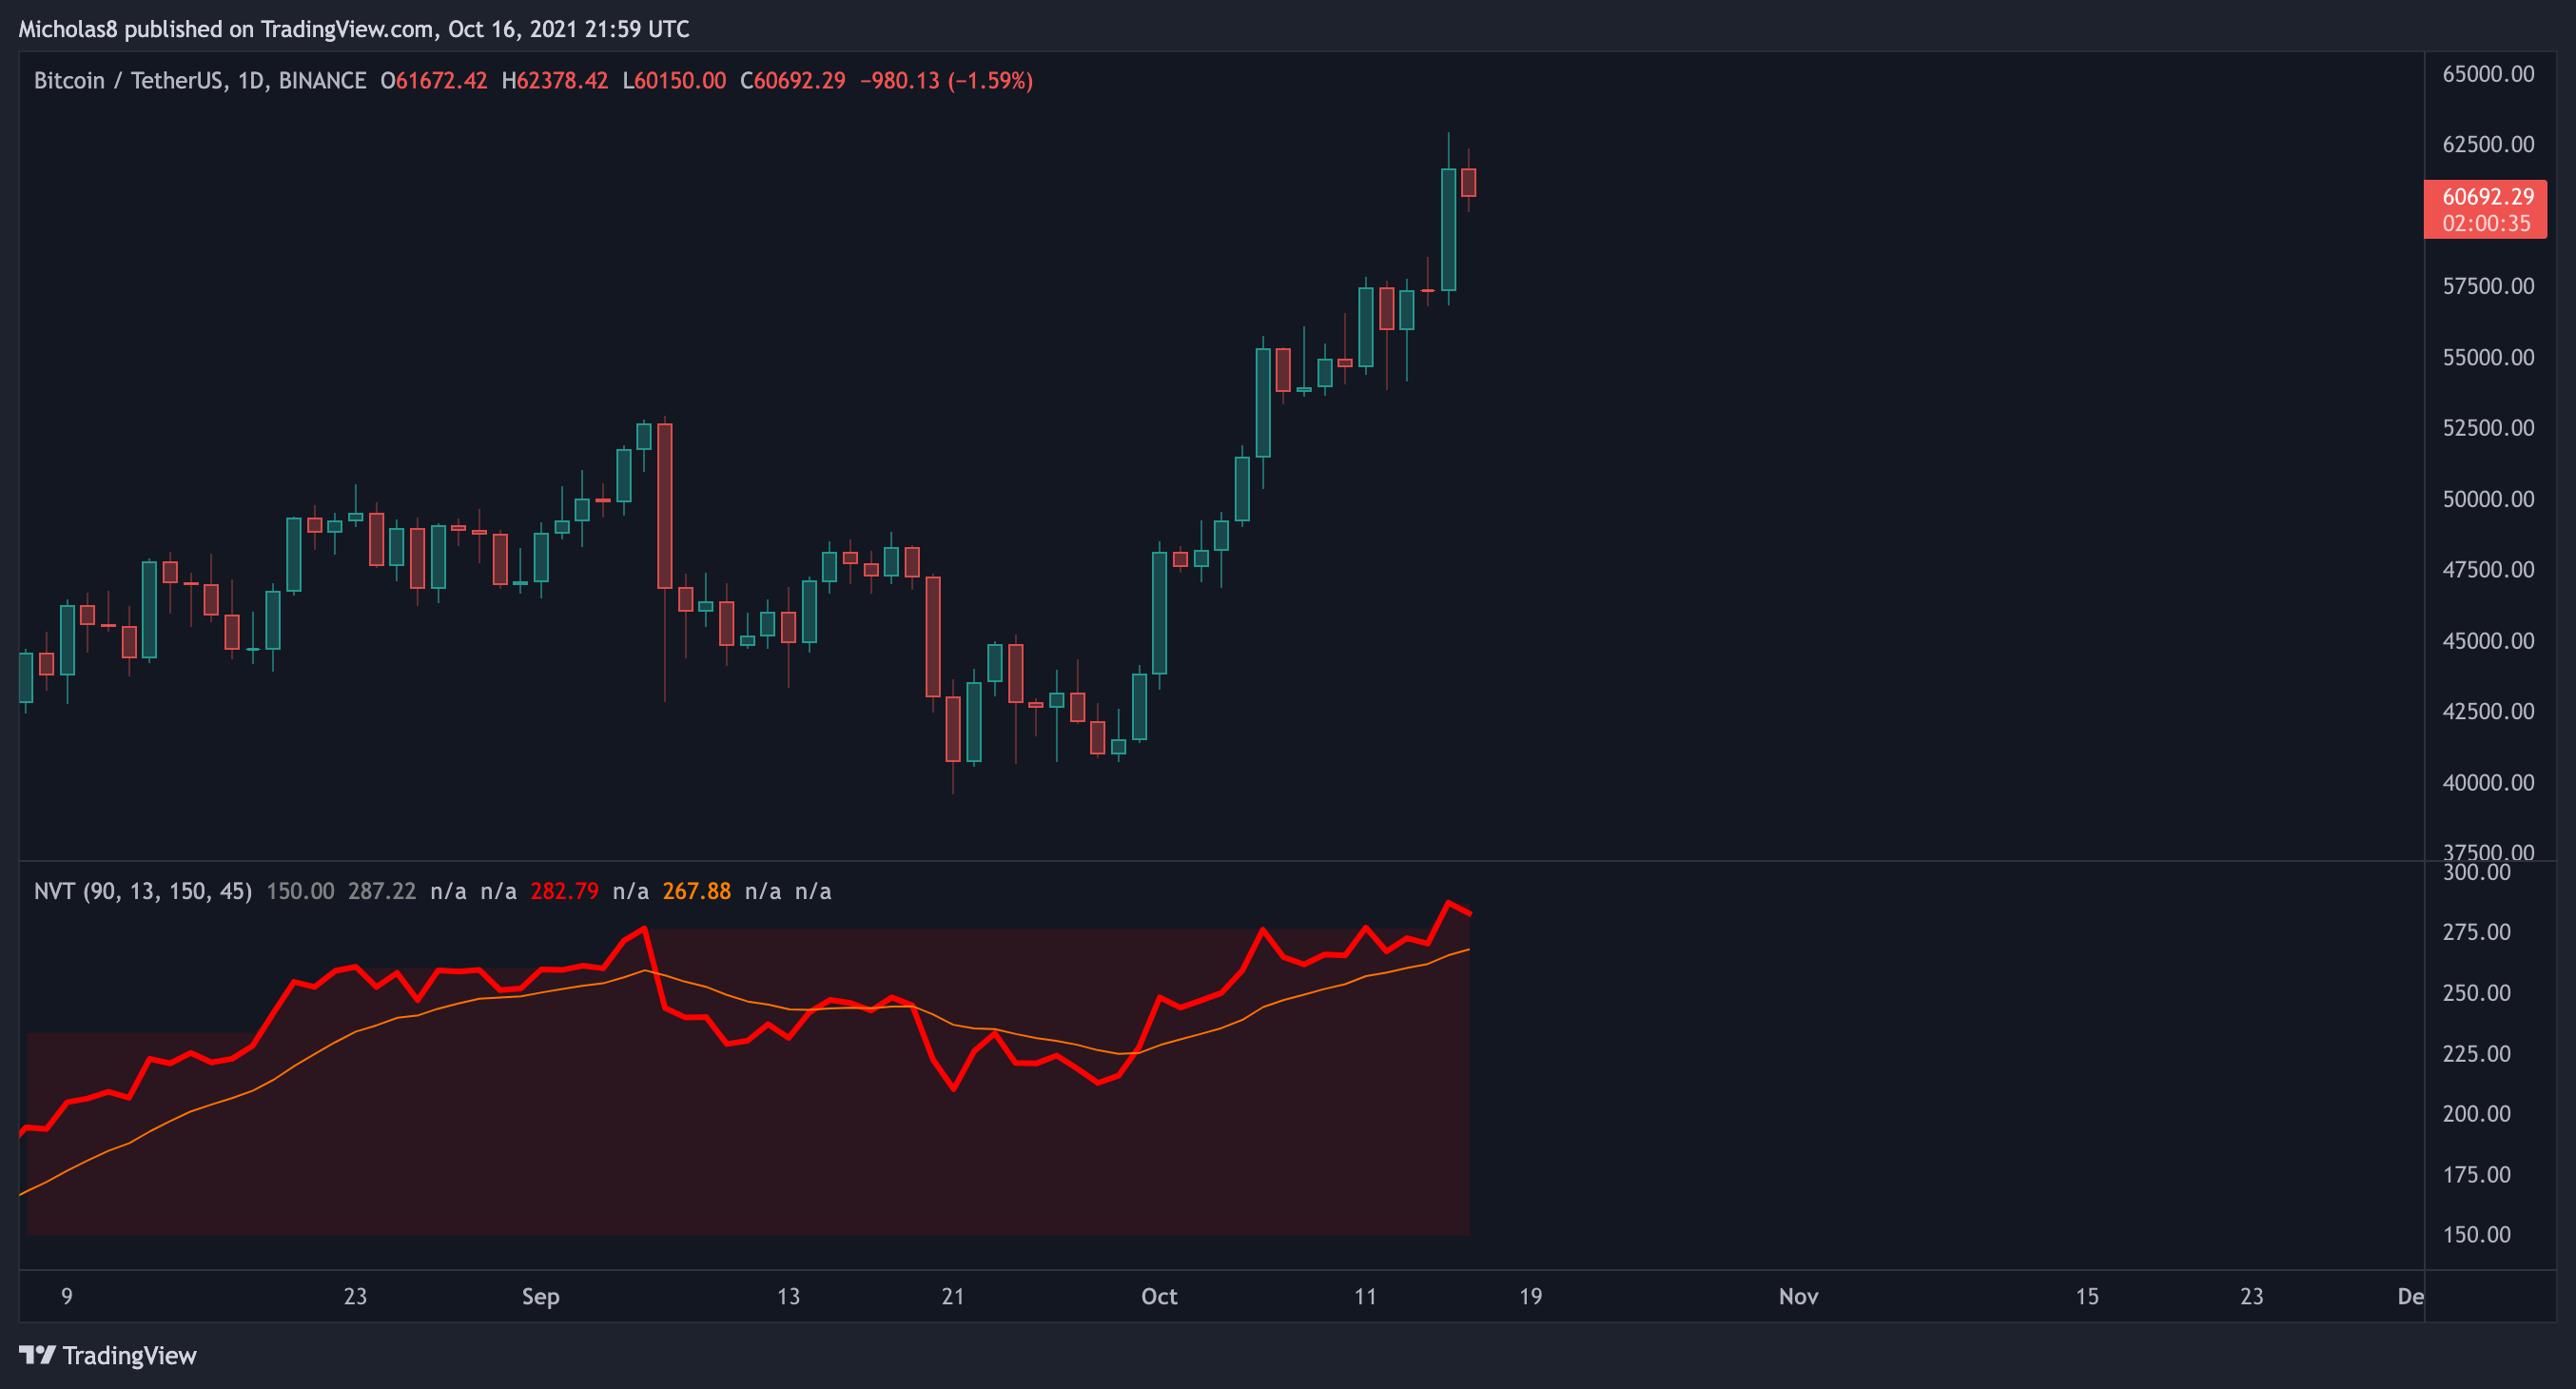
*This indicator describes the relationship between market cap and transfer volumes.
Bitcoin has risen above the NVT Signal line, initiating a mega pump. If the signal line can be held as support, it becomes more likely we see continuation.
Directional Movement Index (DMI)
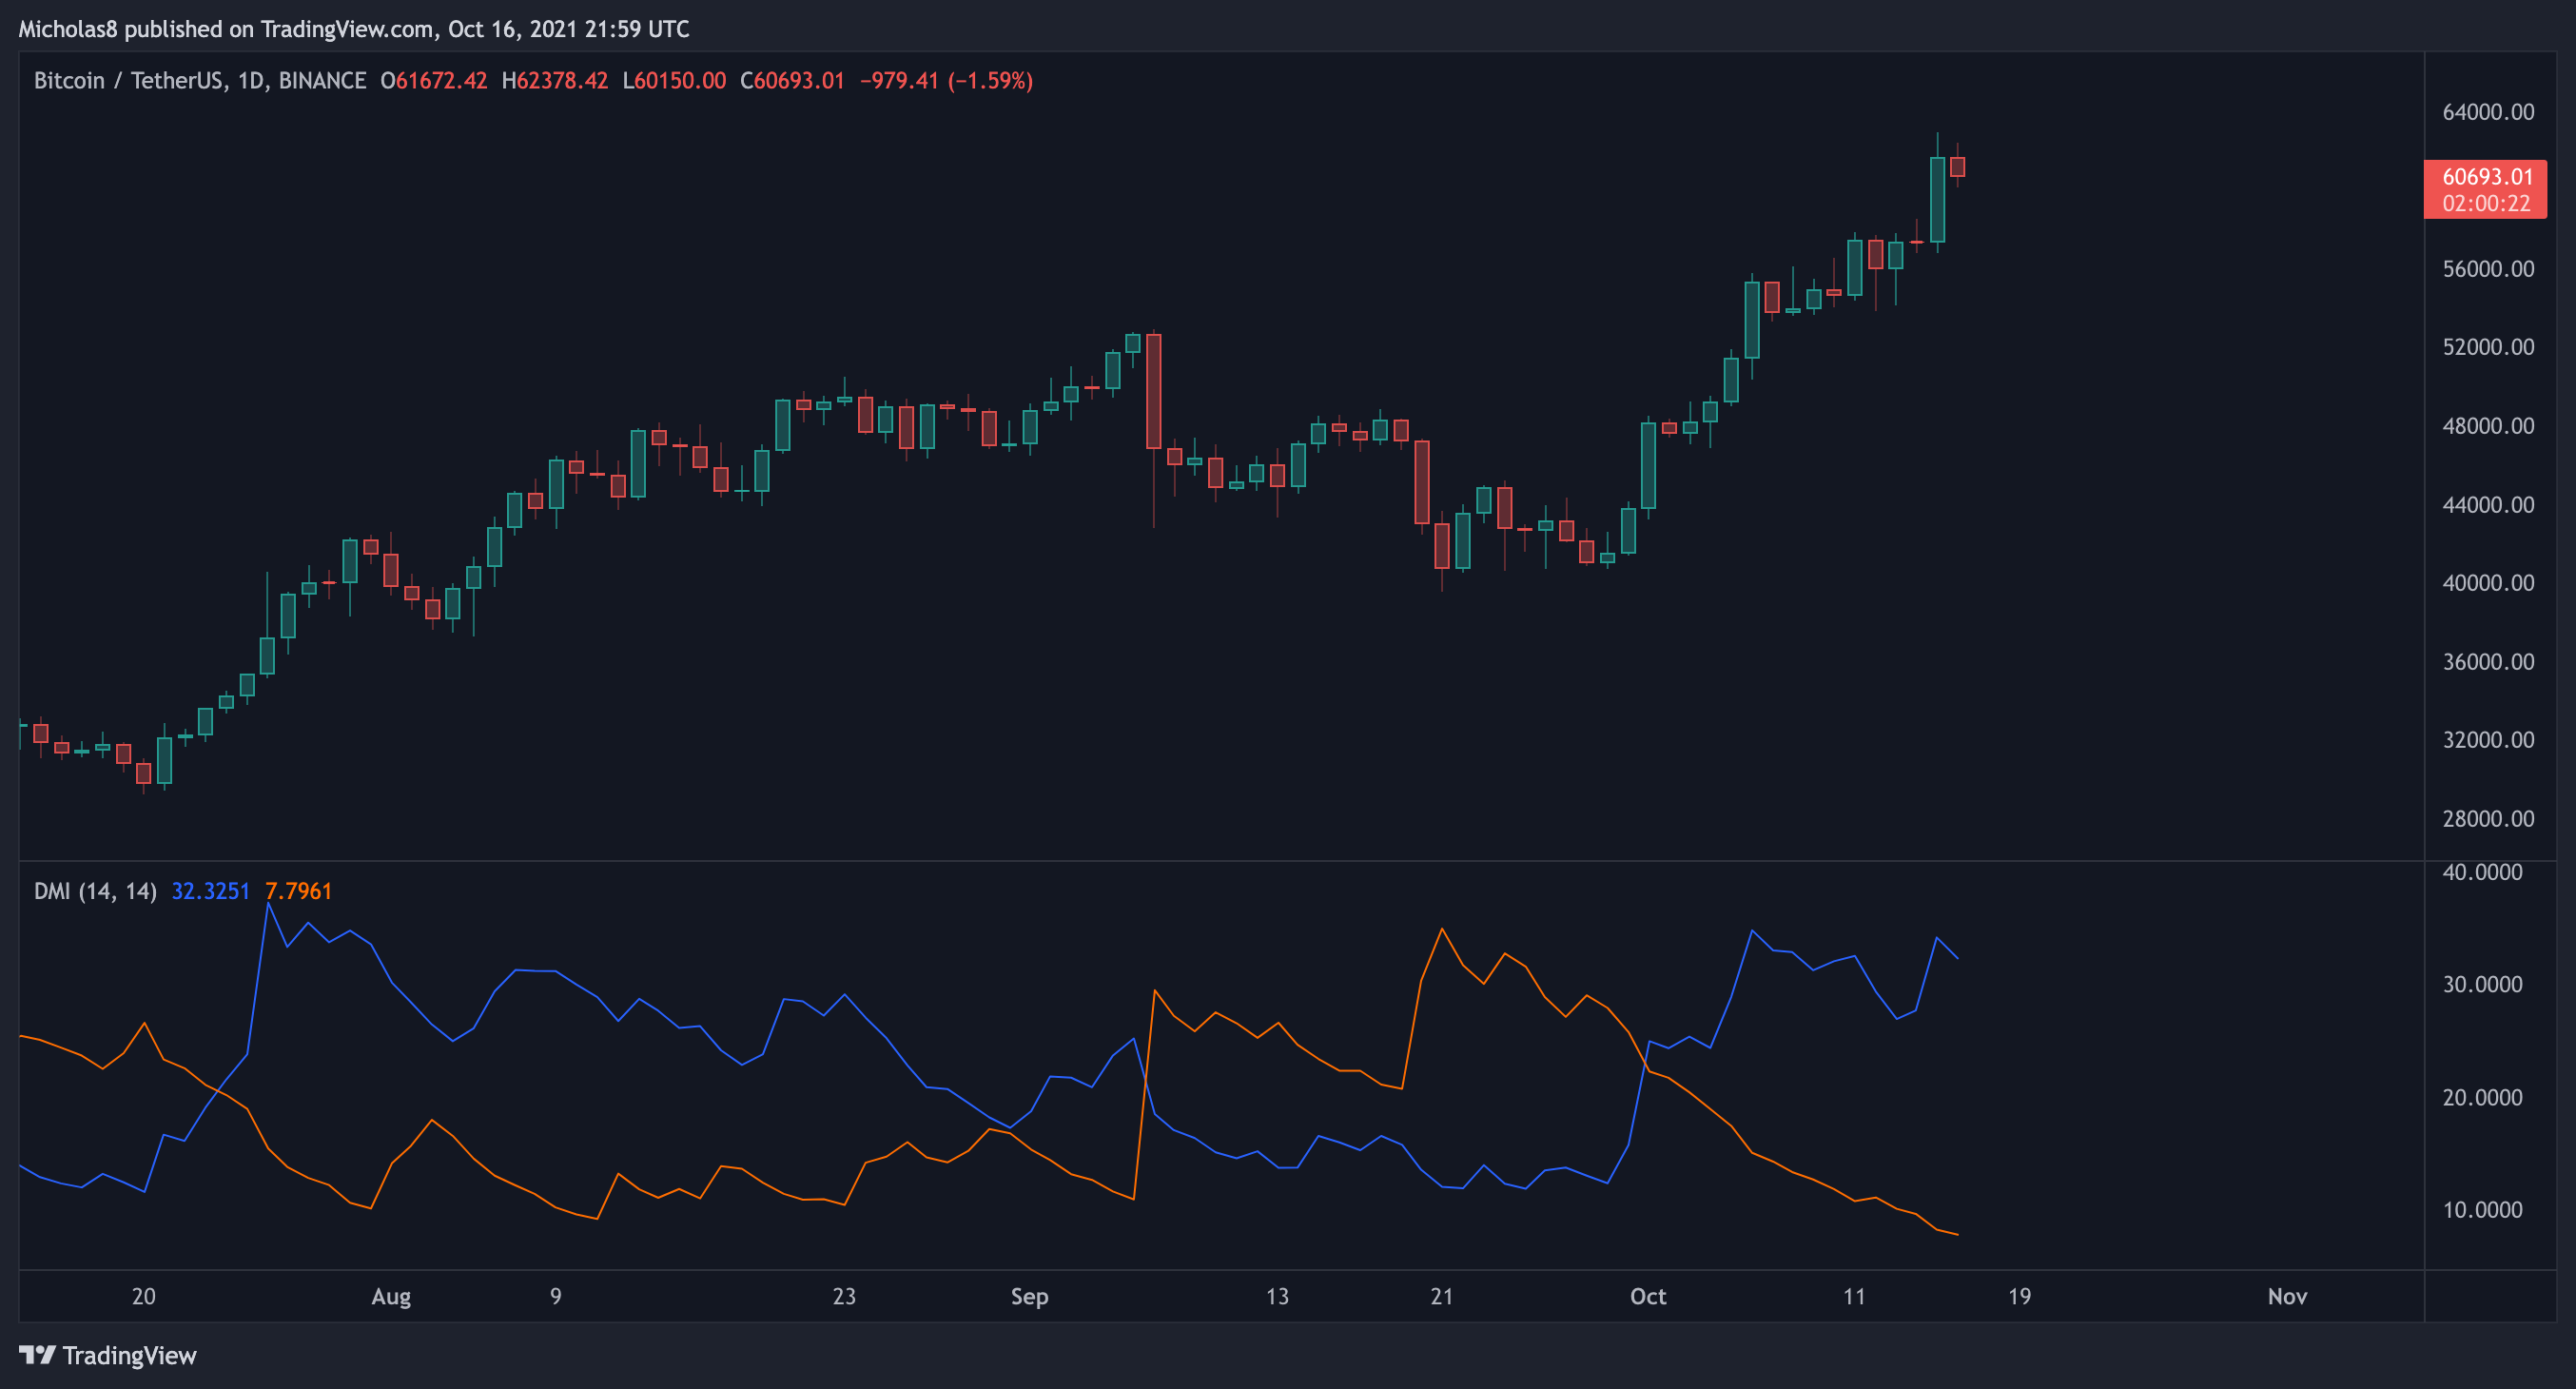
*This is another momentum indicator.
Generally speaking, when the blue line (bullish) crosses above the orange line (bearish), it signals a potential shift in momentum.
EMA Ribbon
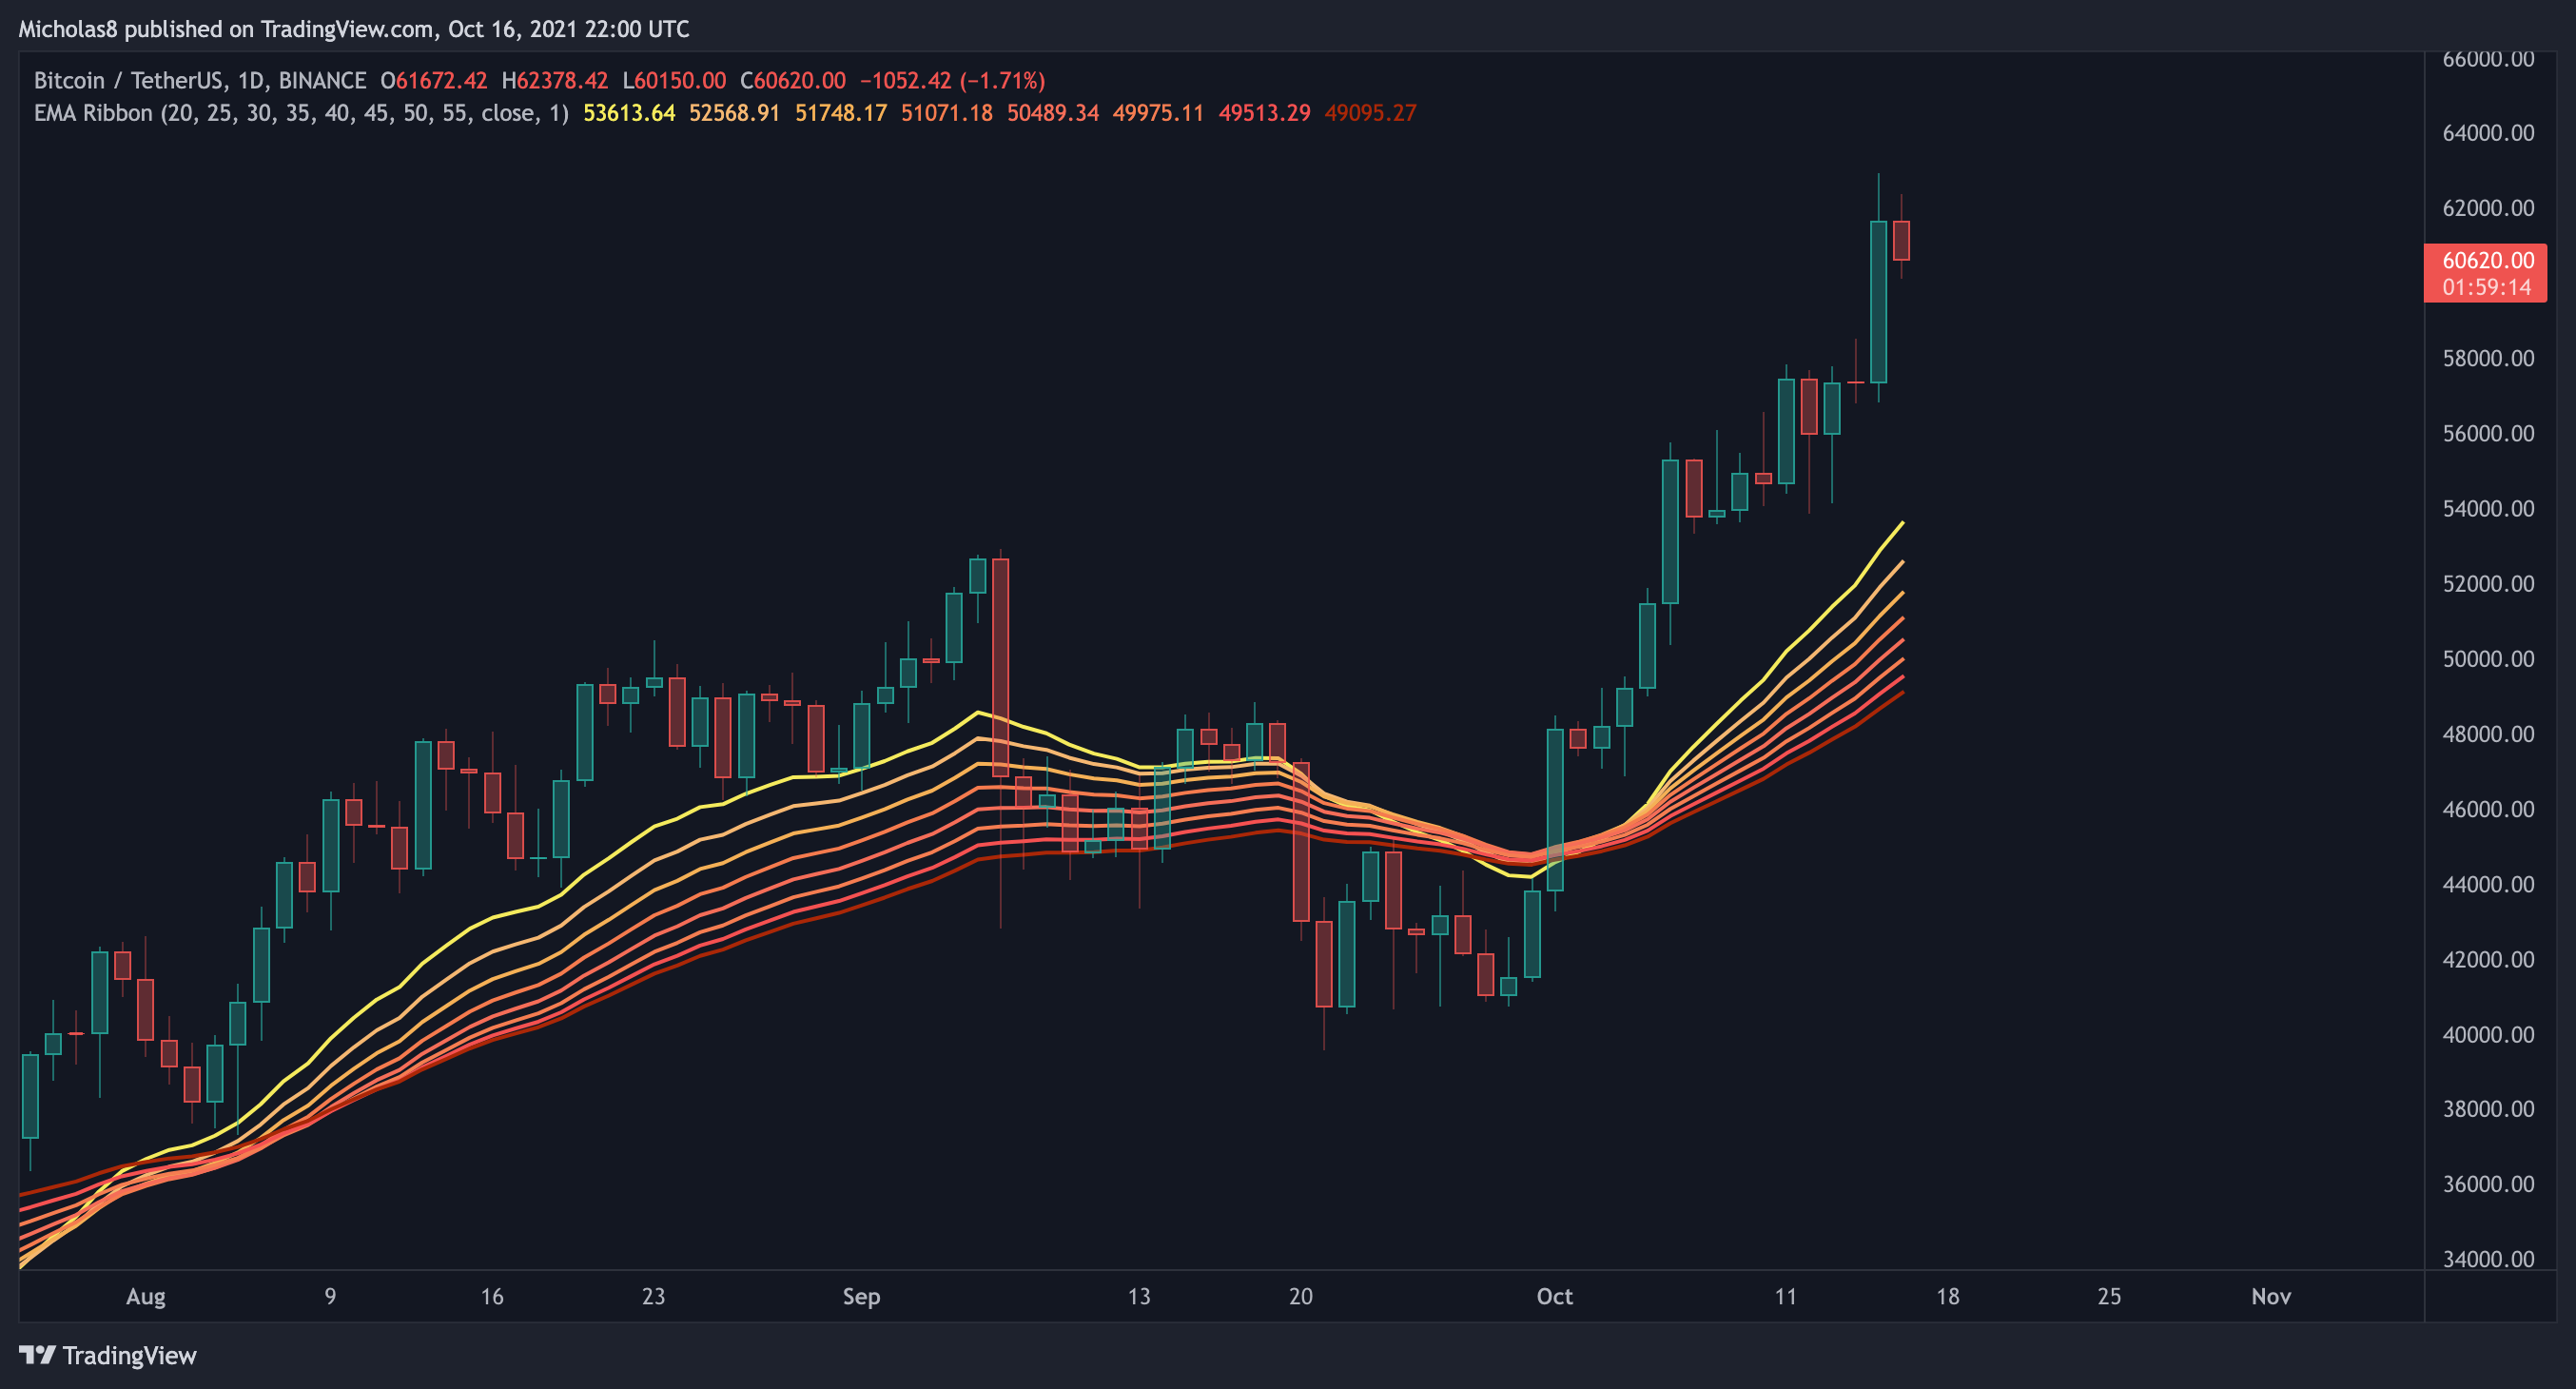
Bitcoin continues to trade above the EMA ribbon in this timeframe.
Implication: The momentum is with the bulls now.
Exponential Moving Average (EMA): 8, 21, 50 and 200
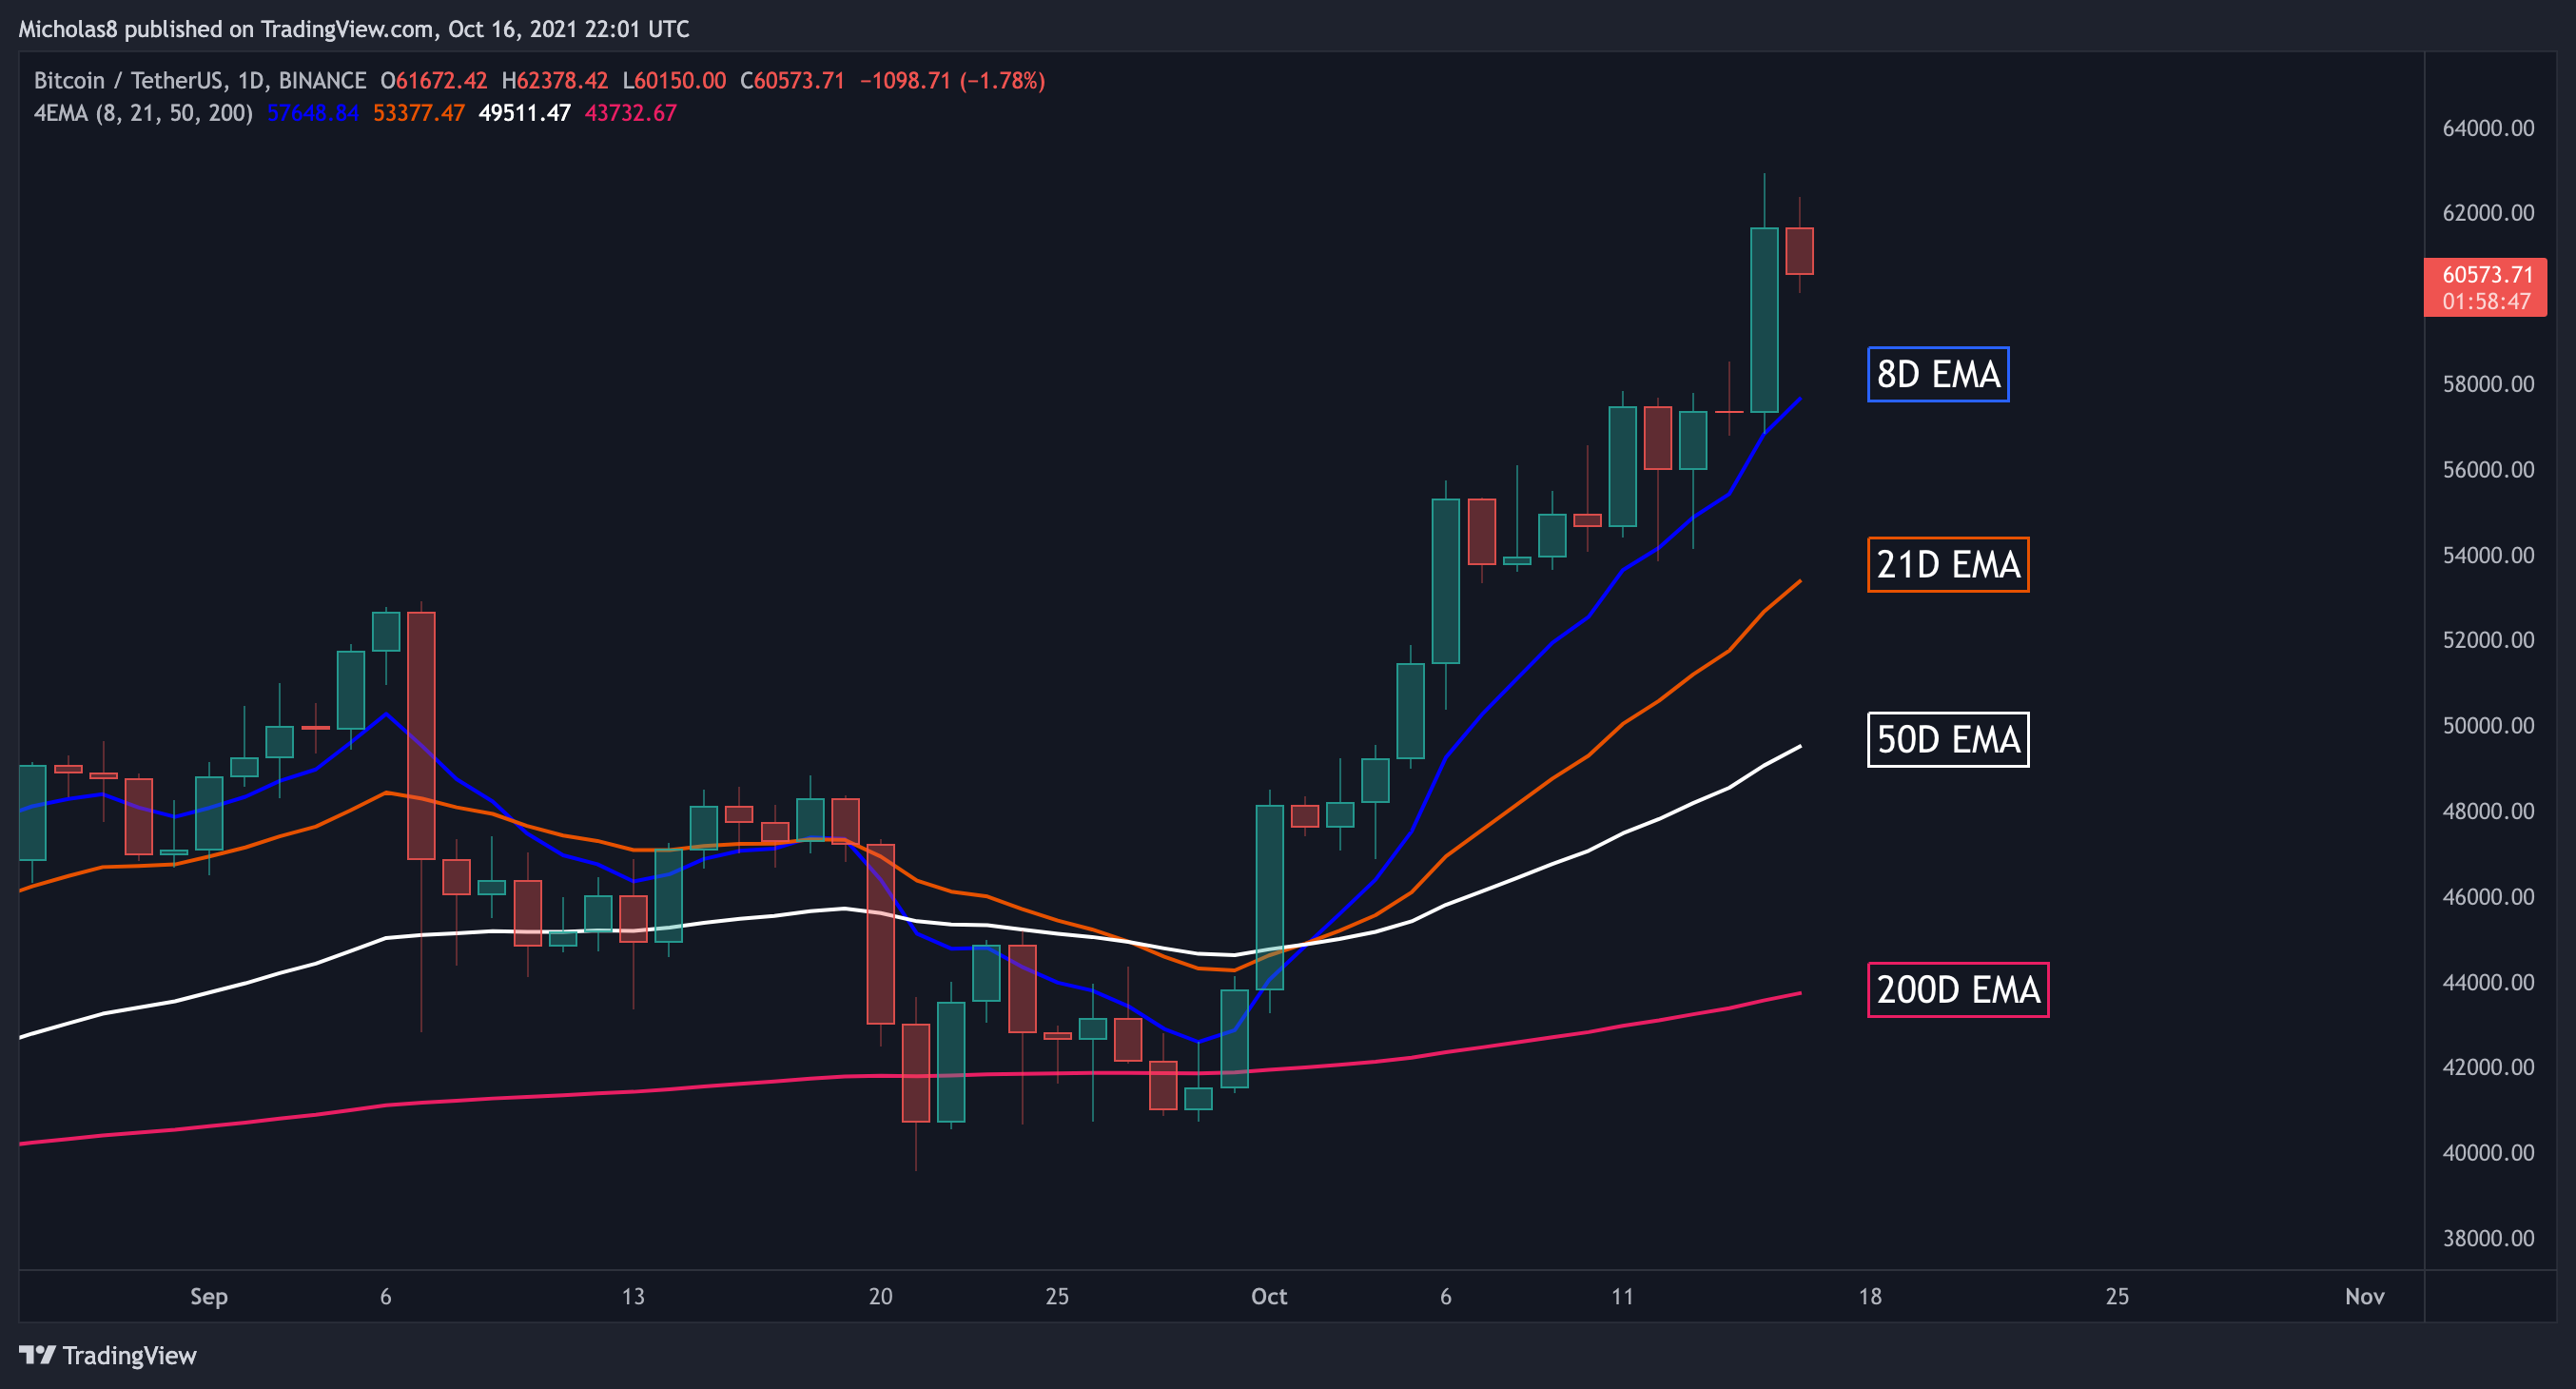
Bitcoin has risen above ALL four of these EMAs.
Implications: Ideally they will serve as support, as the 8-day EMA did today.
Simple Moving Average (SMA): 20, 50, 100 and 200
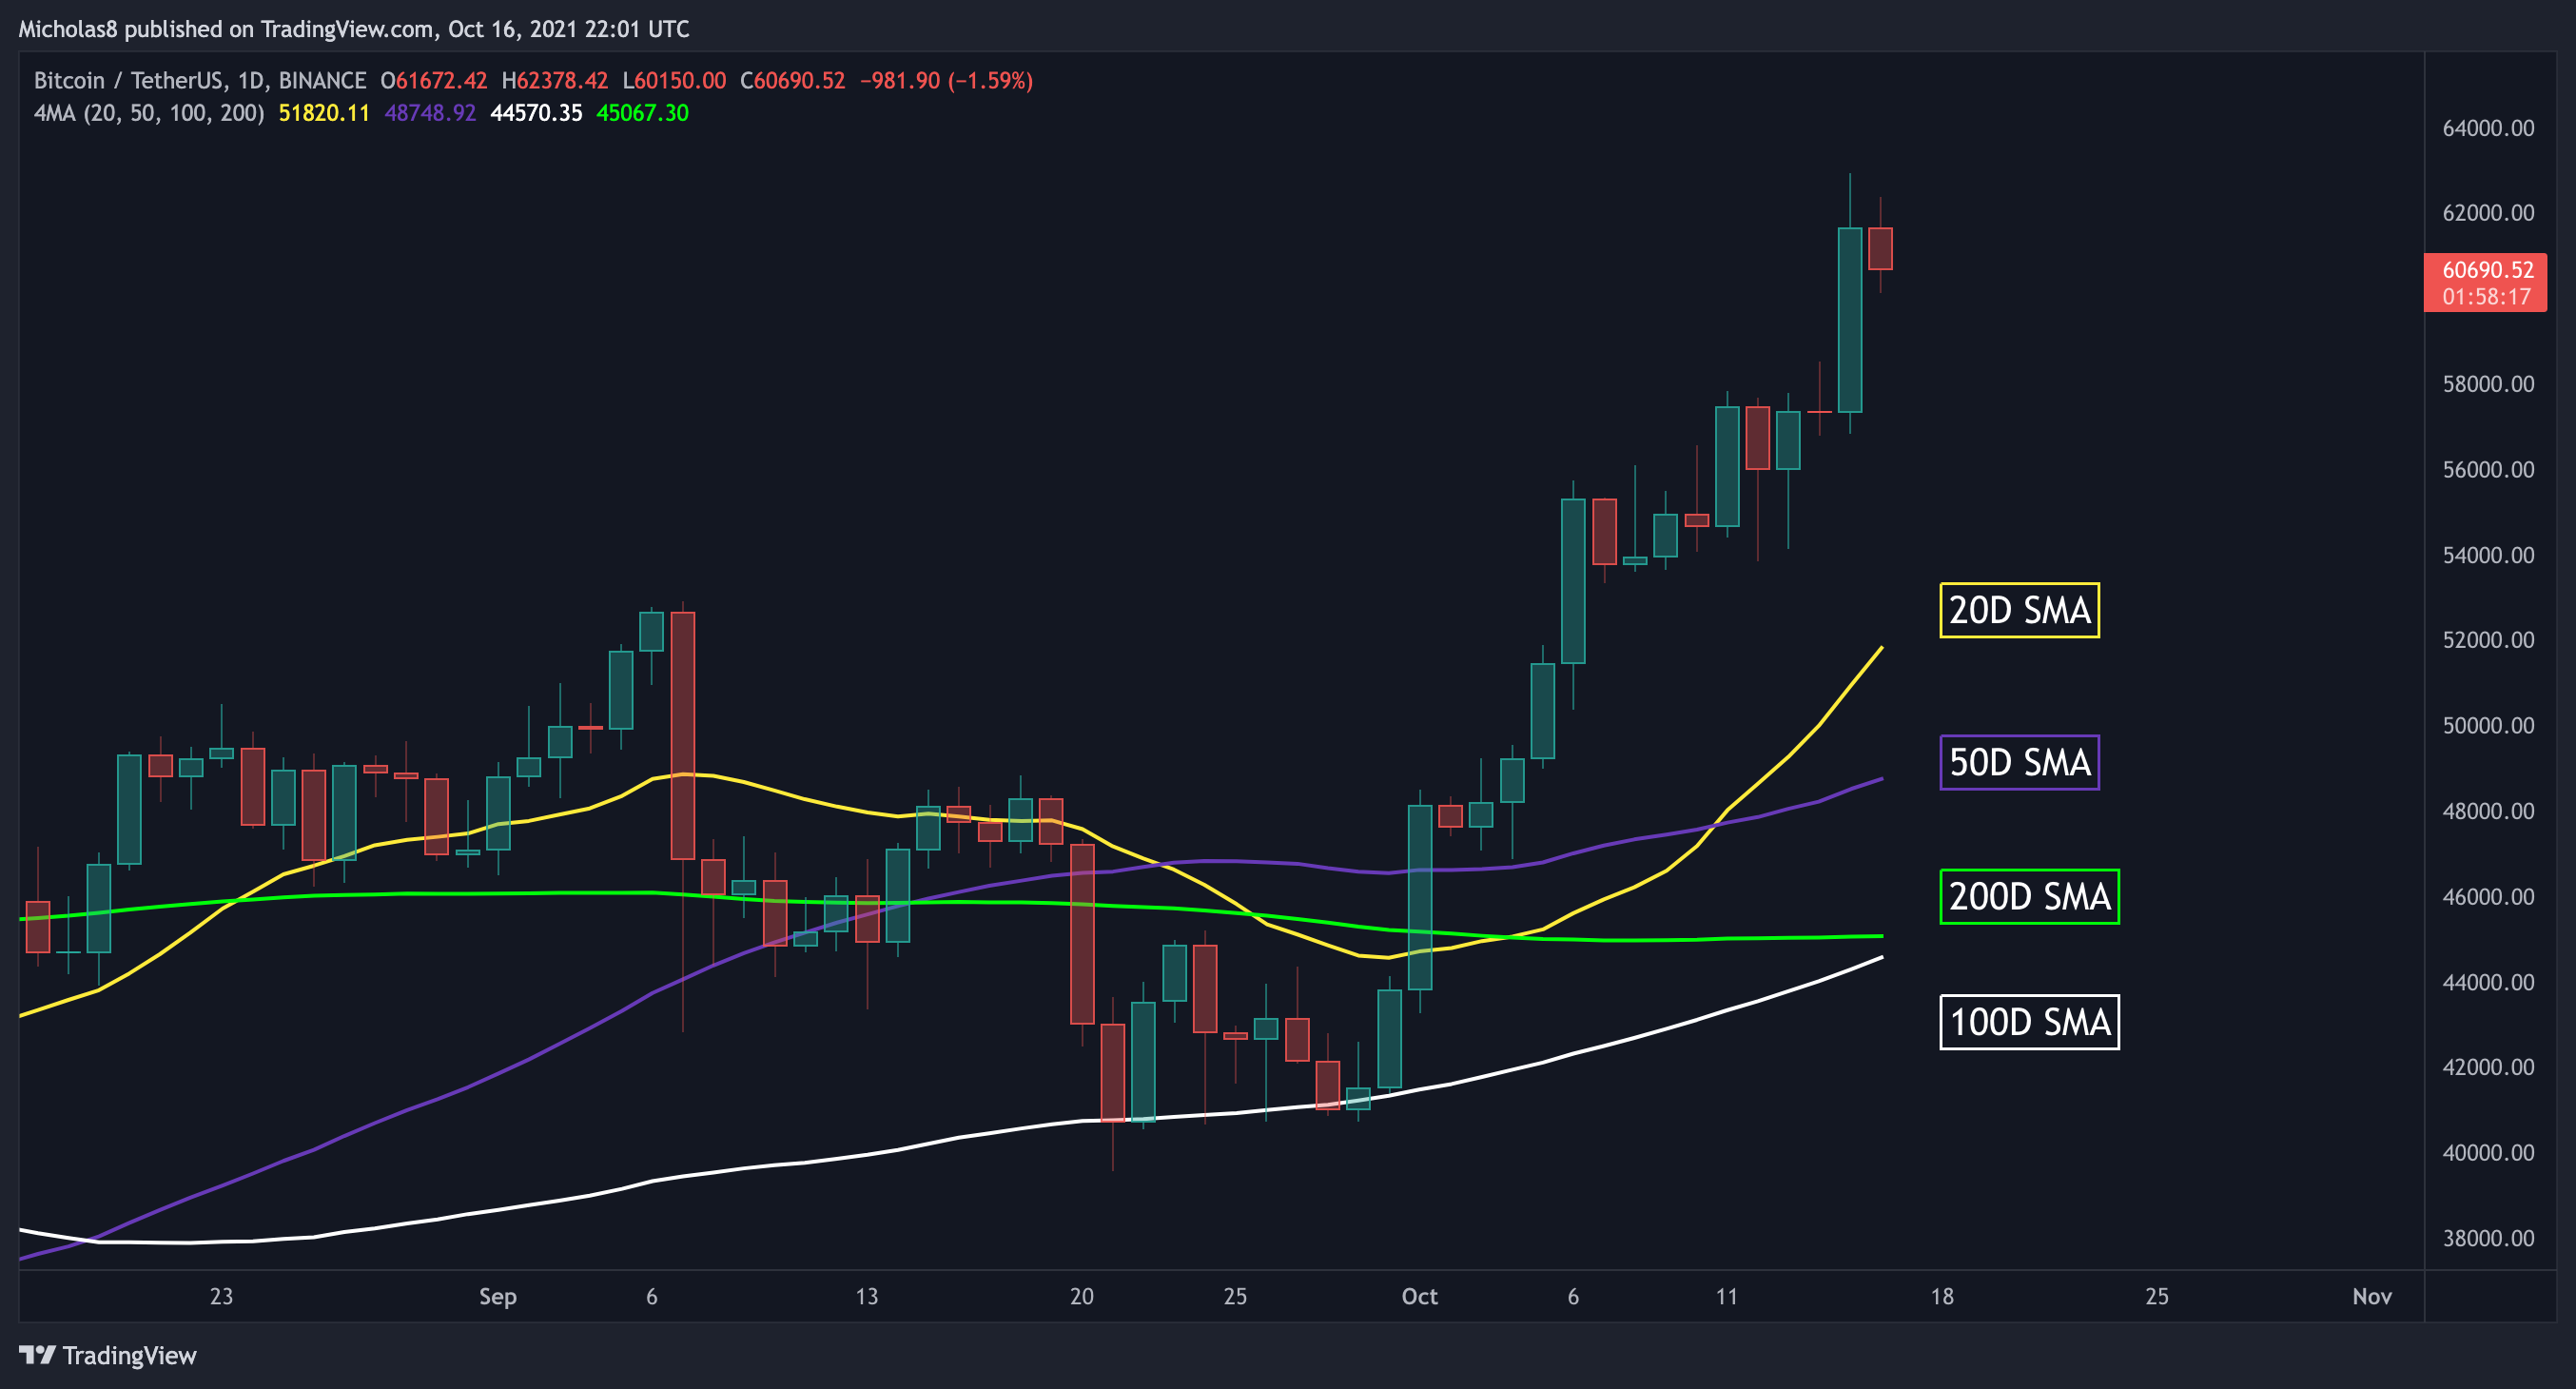
Bitcoin continues to trade above all four of these SMAs. We will also likely see a Golden Cross between the 100-day and 200-day SMAs next week.
Implications: These will ideally serve as a level of support.
Patterns
*Please note not all technical targets will be hit, so be aware of all key levels and Fibonacci Levels, and also look out for divergences as they have the power to reverse a trend
Rising Channel
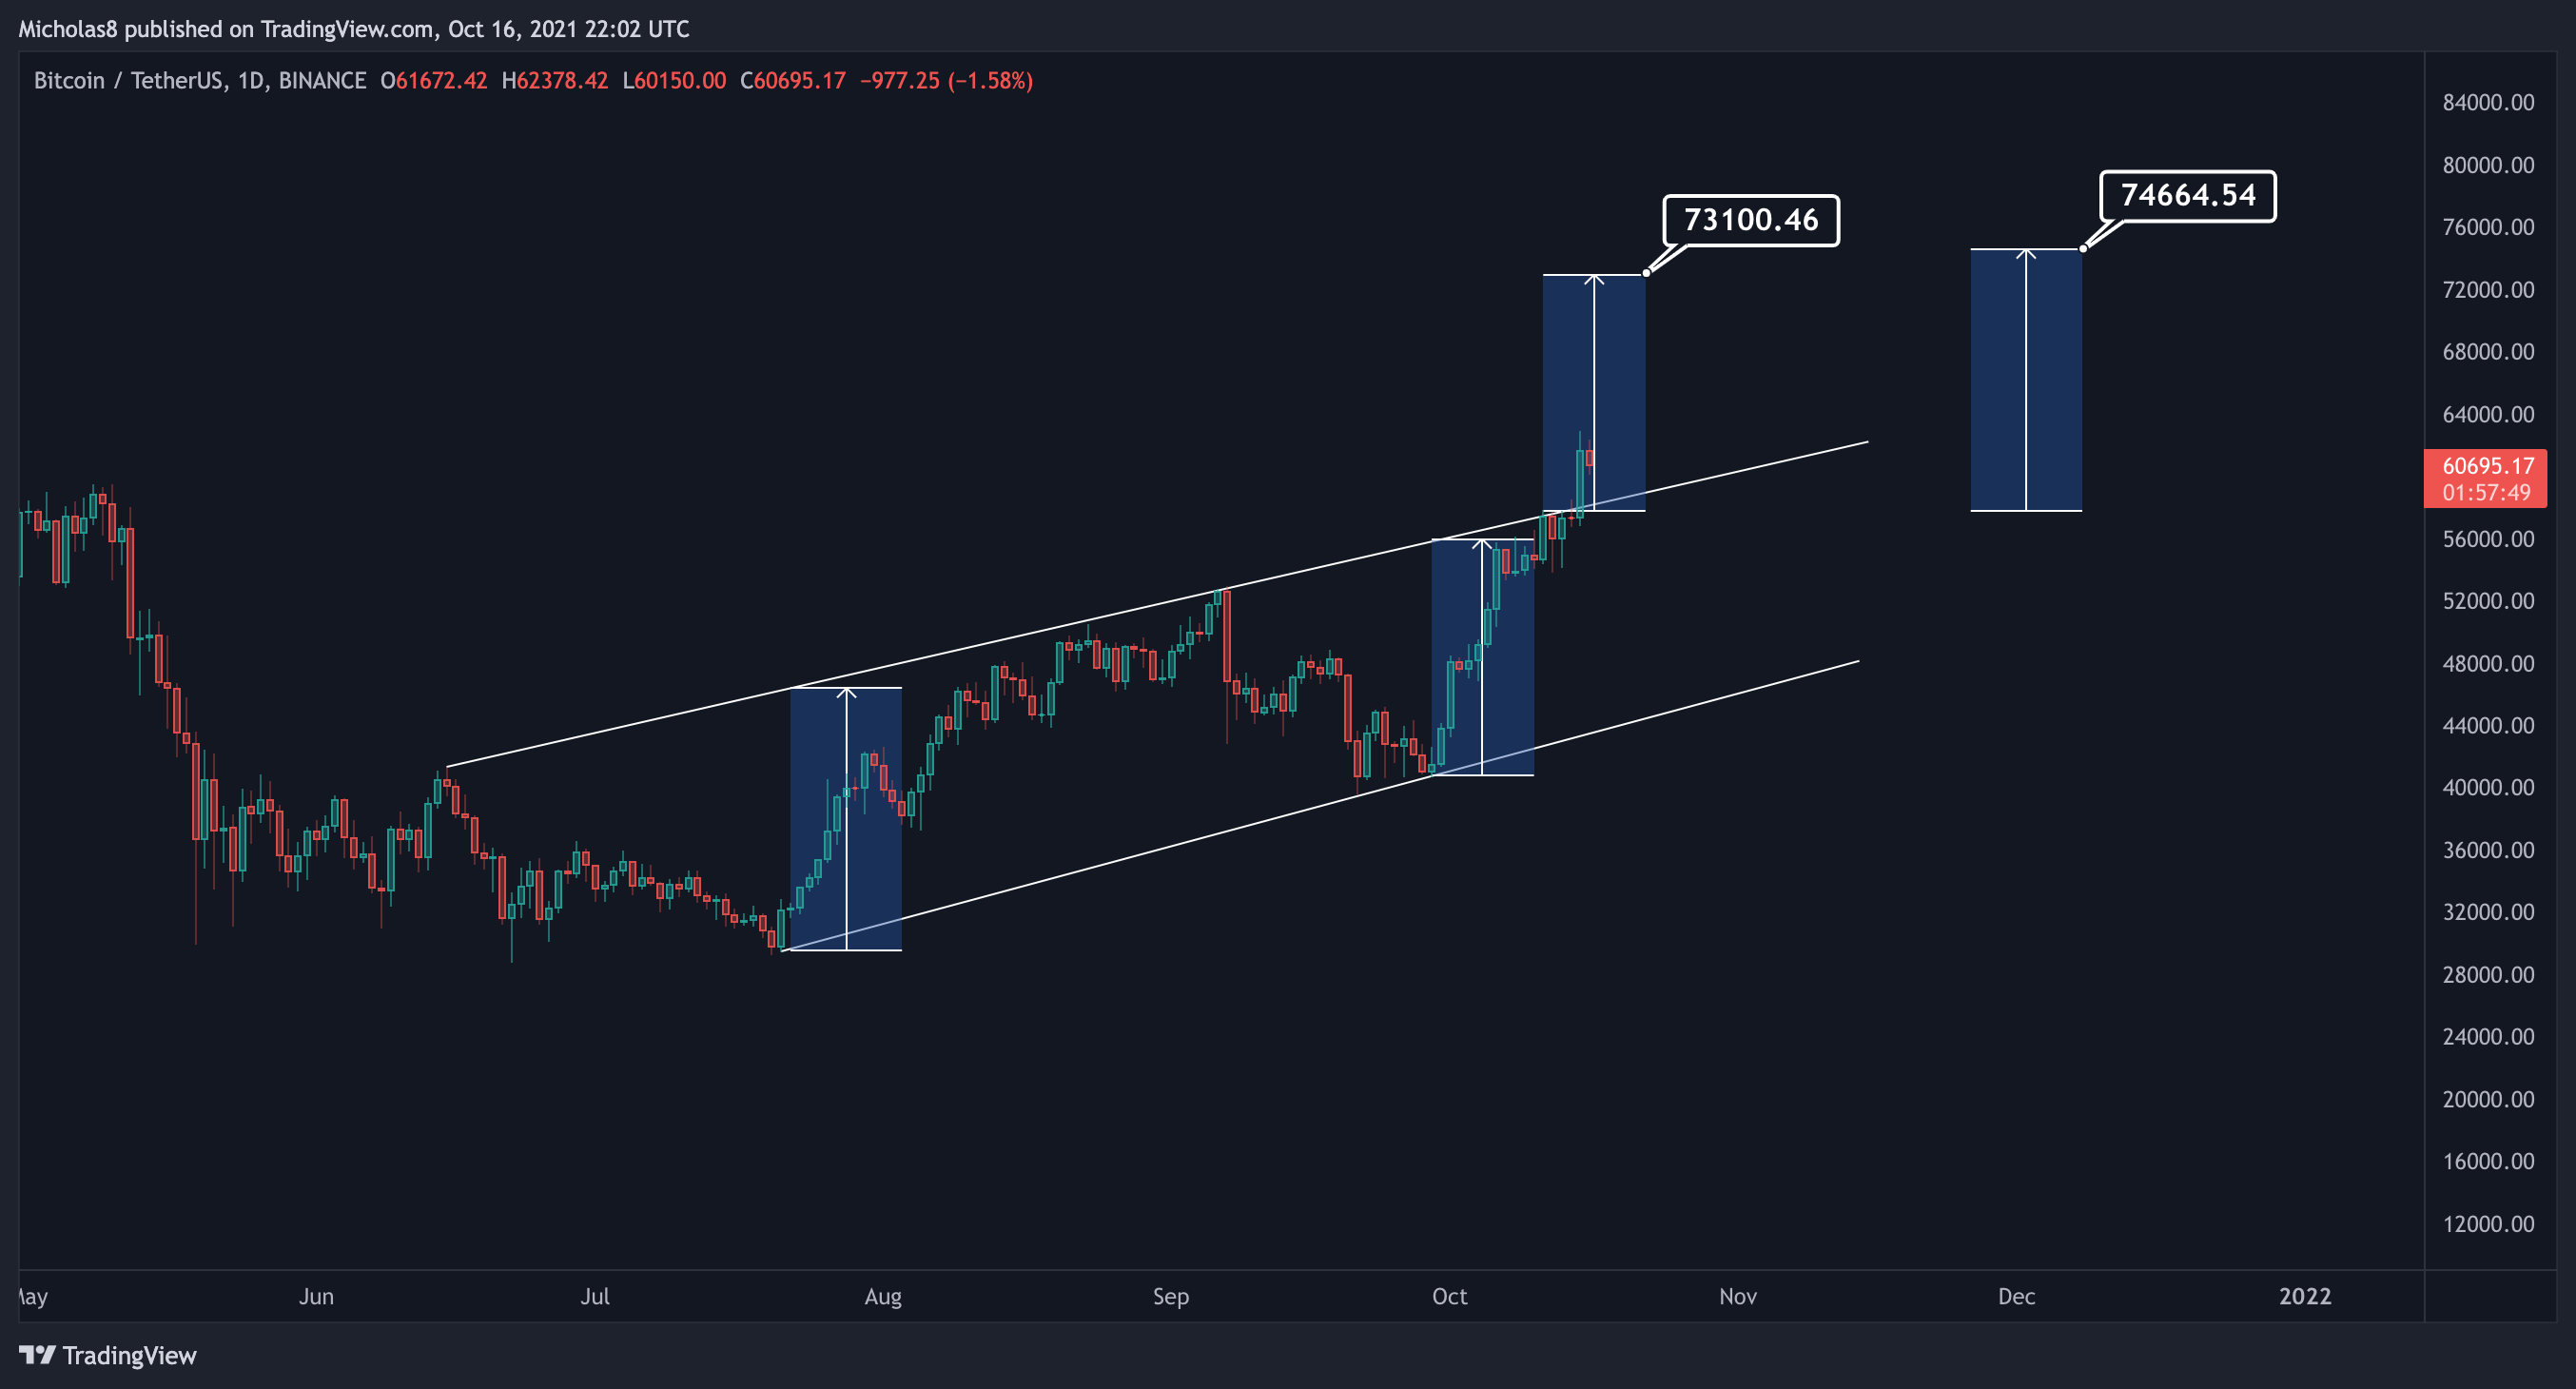
Technical Targets
73.1k
74.7k
4H Timeframe
Key Liquidity Zone (LQZ)
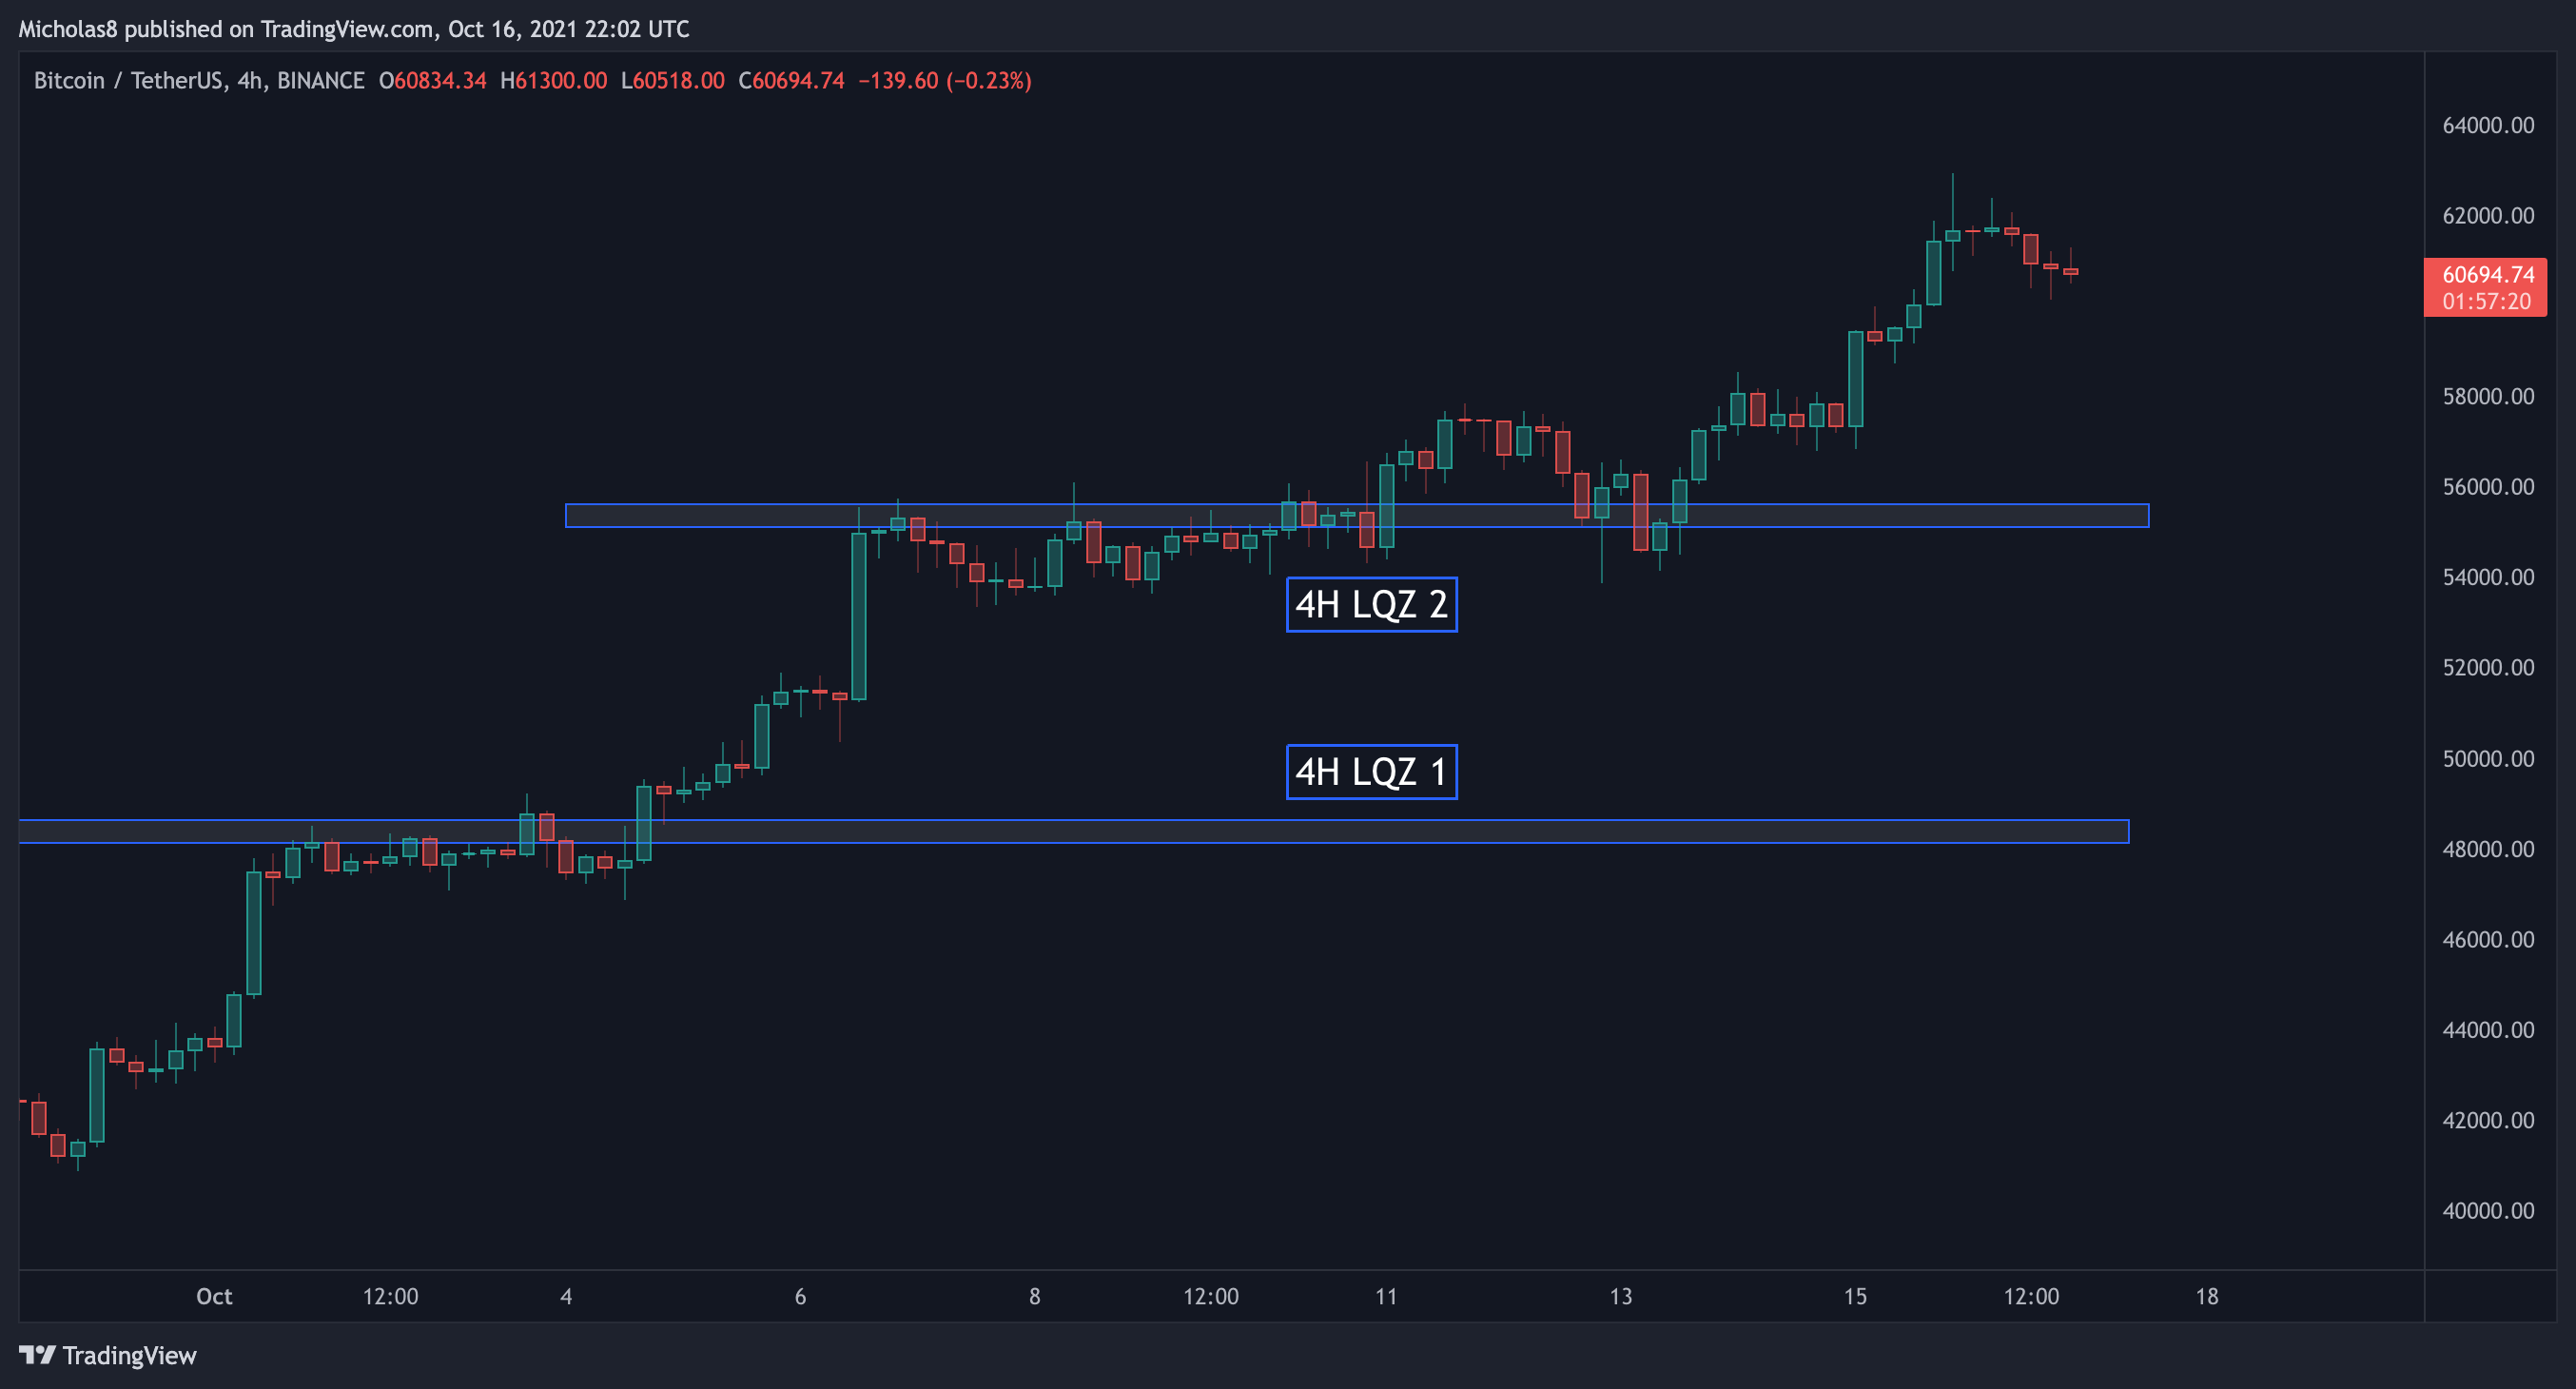
Zone 1: Bitcoin continues to trade above the LQZ in this timeframe, which now sits at 48.1k - 48.6k. The longer we trade above it, the higher the LQZ will be.
Zone 2: There is a new 4H LQZ sitting at 55.1k – 55.6k.
Implications: The majority of the liquidity in this timeframe rests below the current price of Bitcoin. Ideally, both of these LQZ will serve as support.
EMA Ribbon
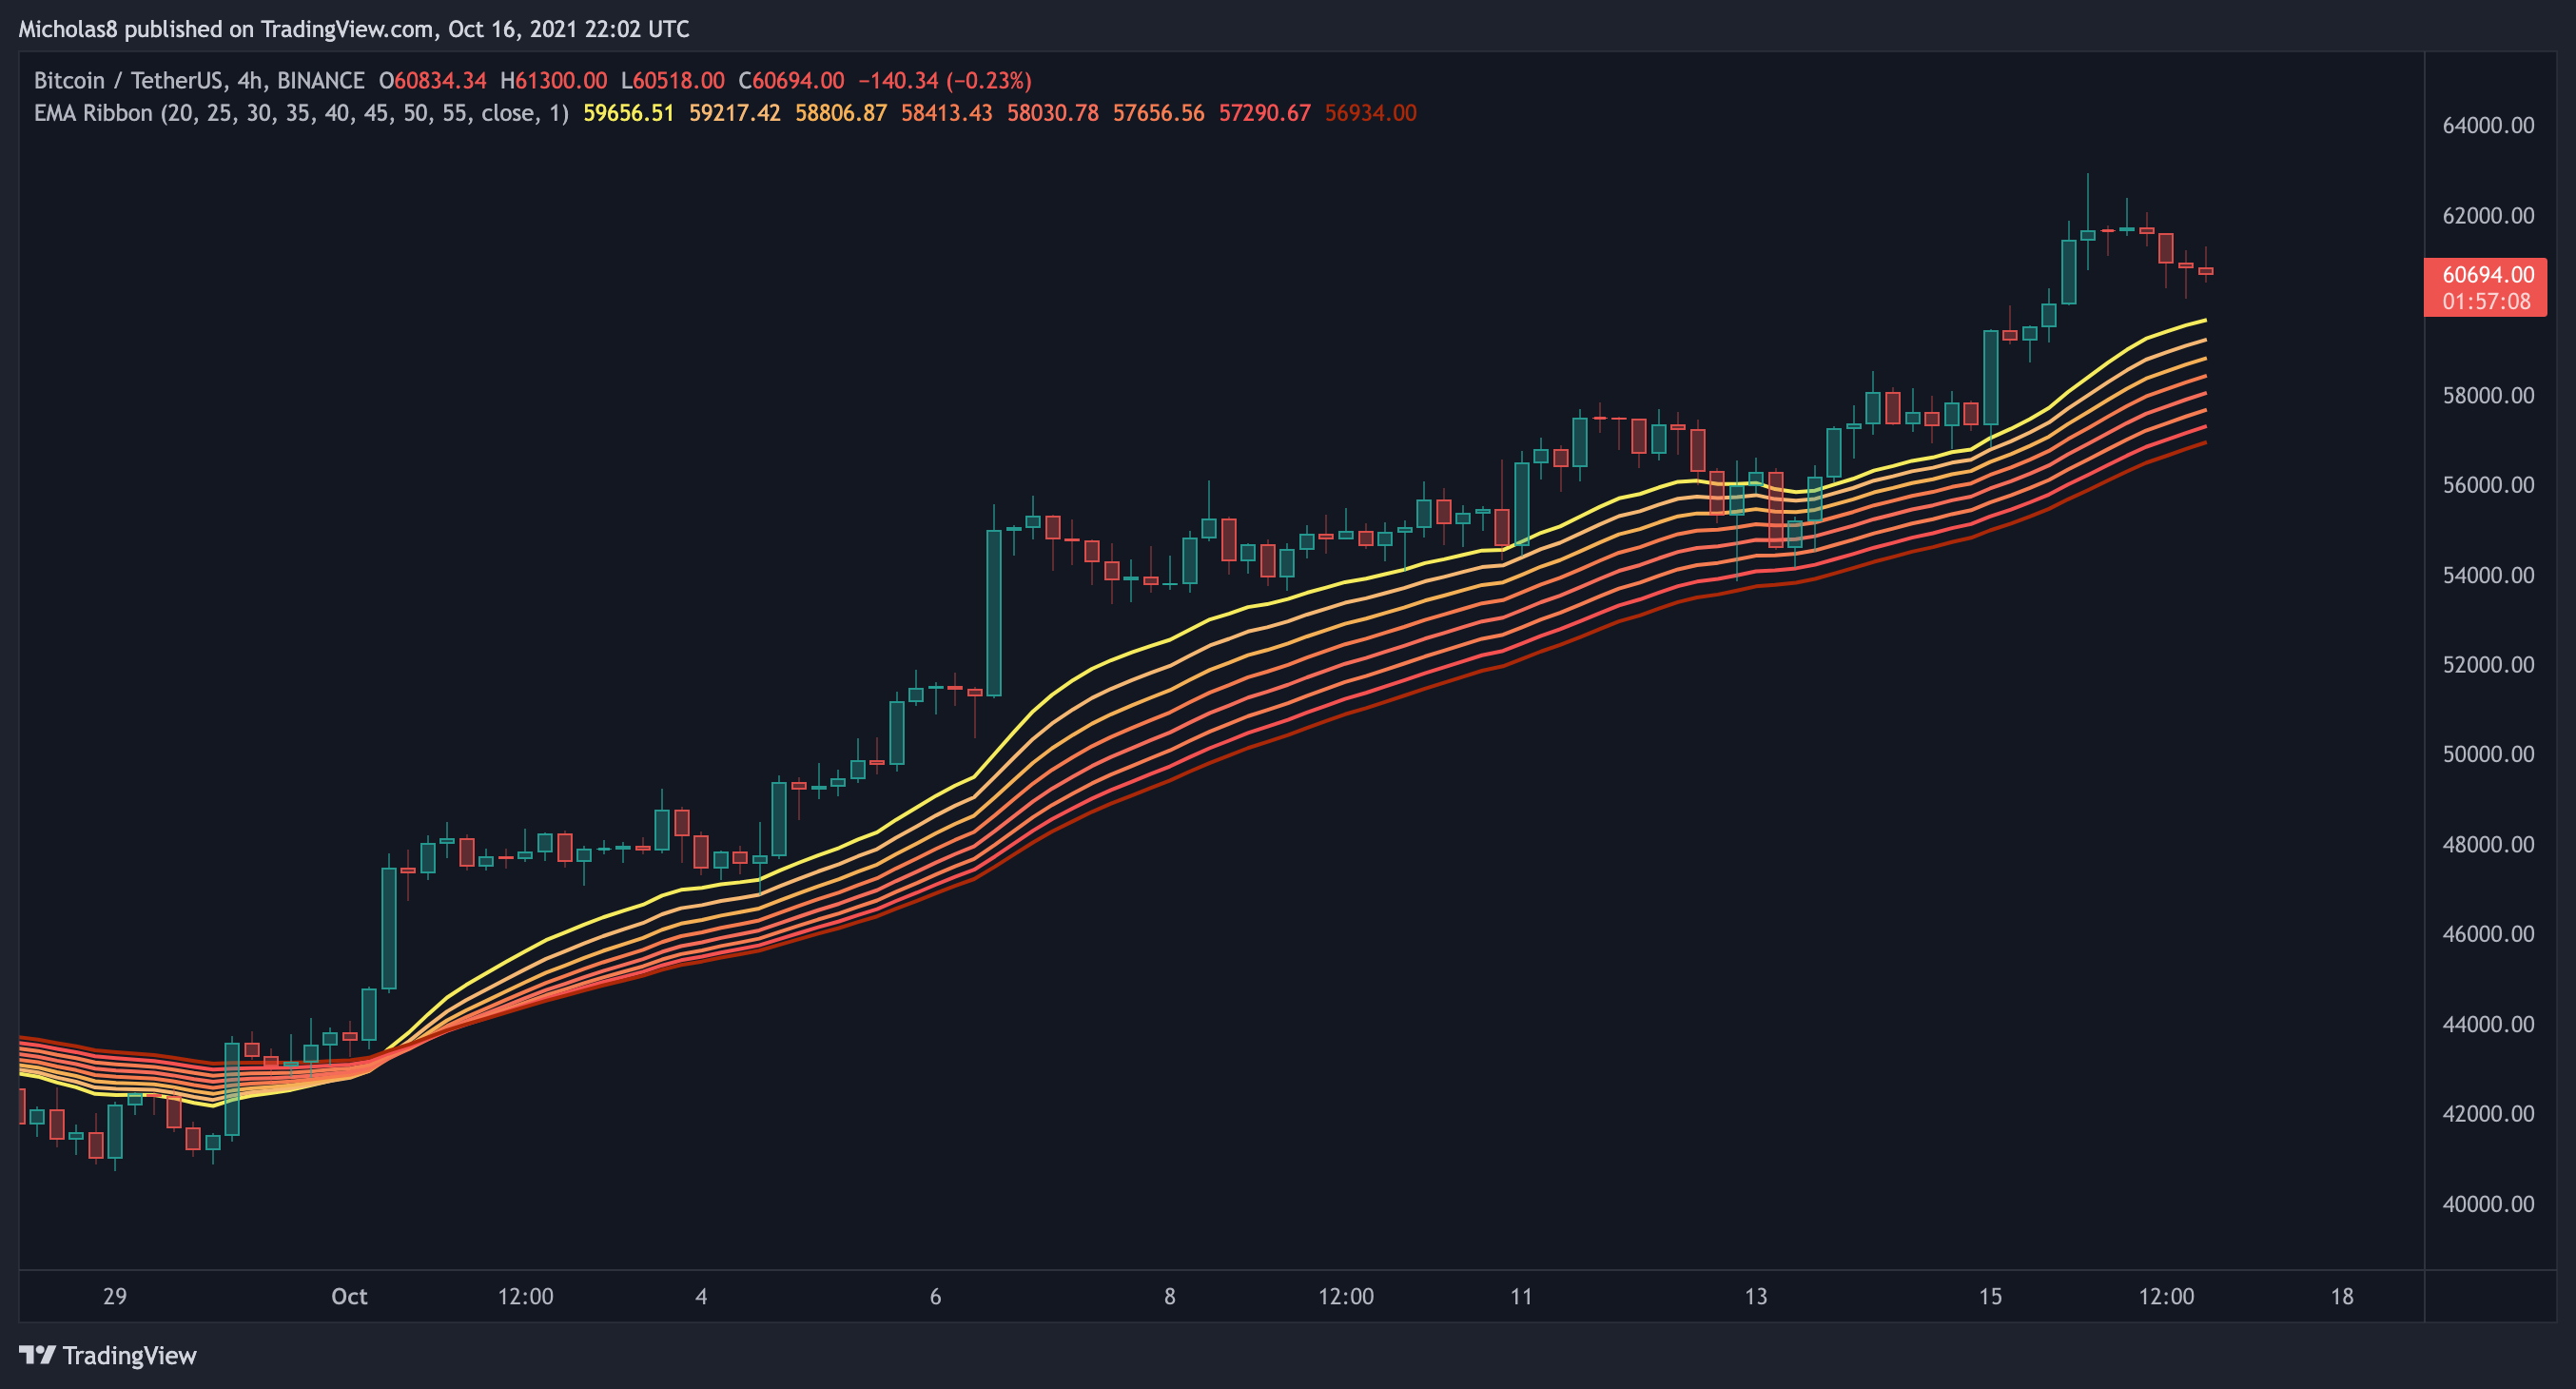
Bitcoin continues to trade above the EMA ribbon in this timeframe.
Implication: The momentum is with the bulls right now, and ideally, the ribbon serves as a level of support as it did earlier today.
Simple Moving Average (SMA): 20, 50 and 200
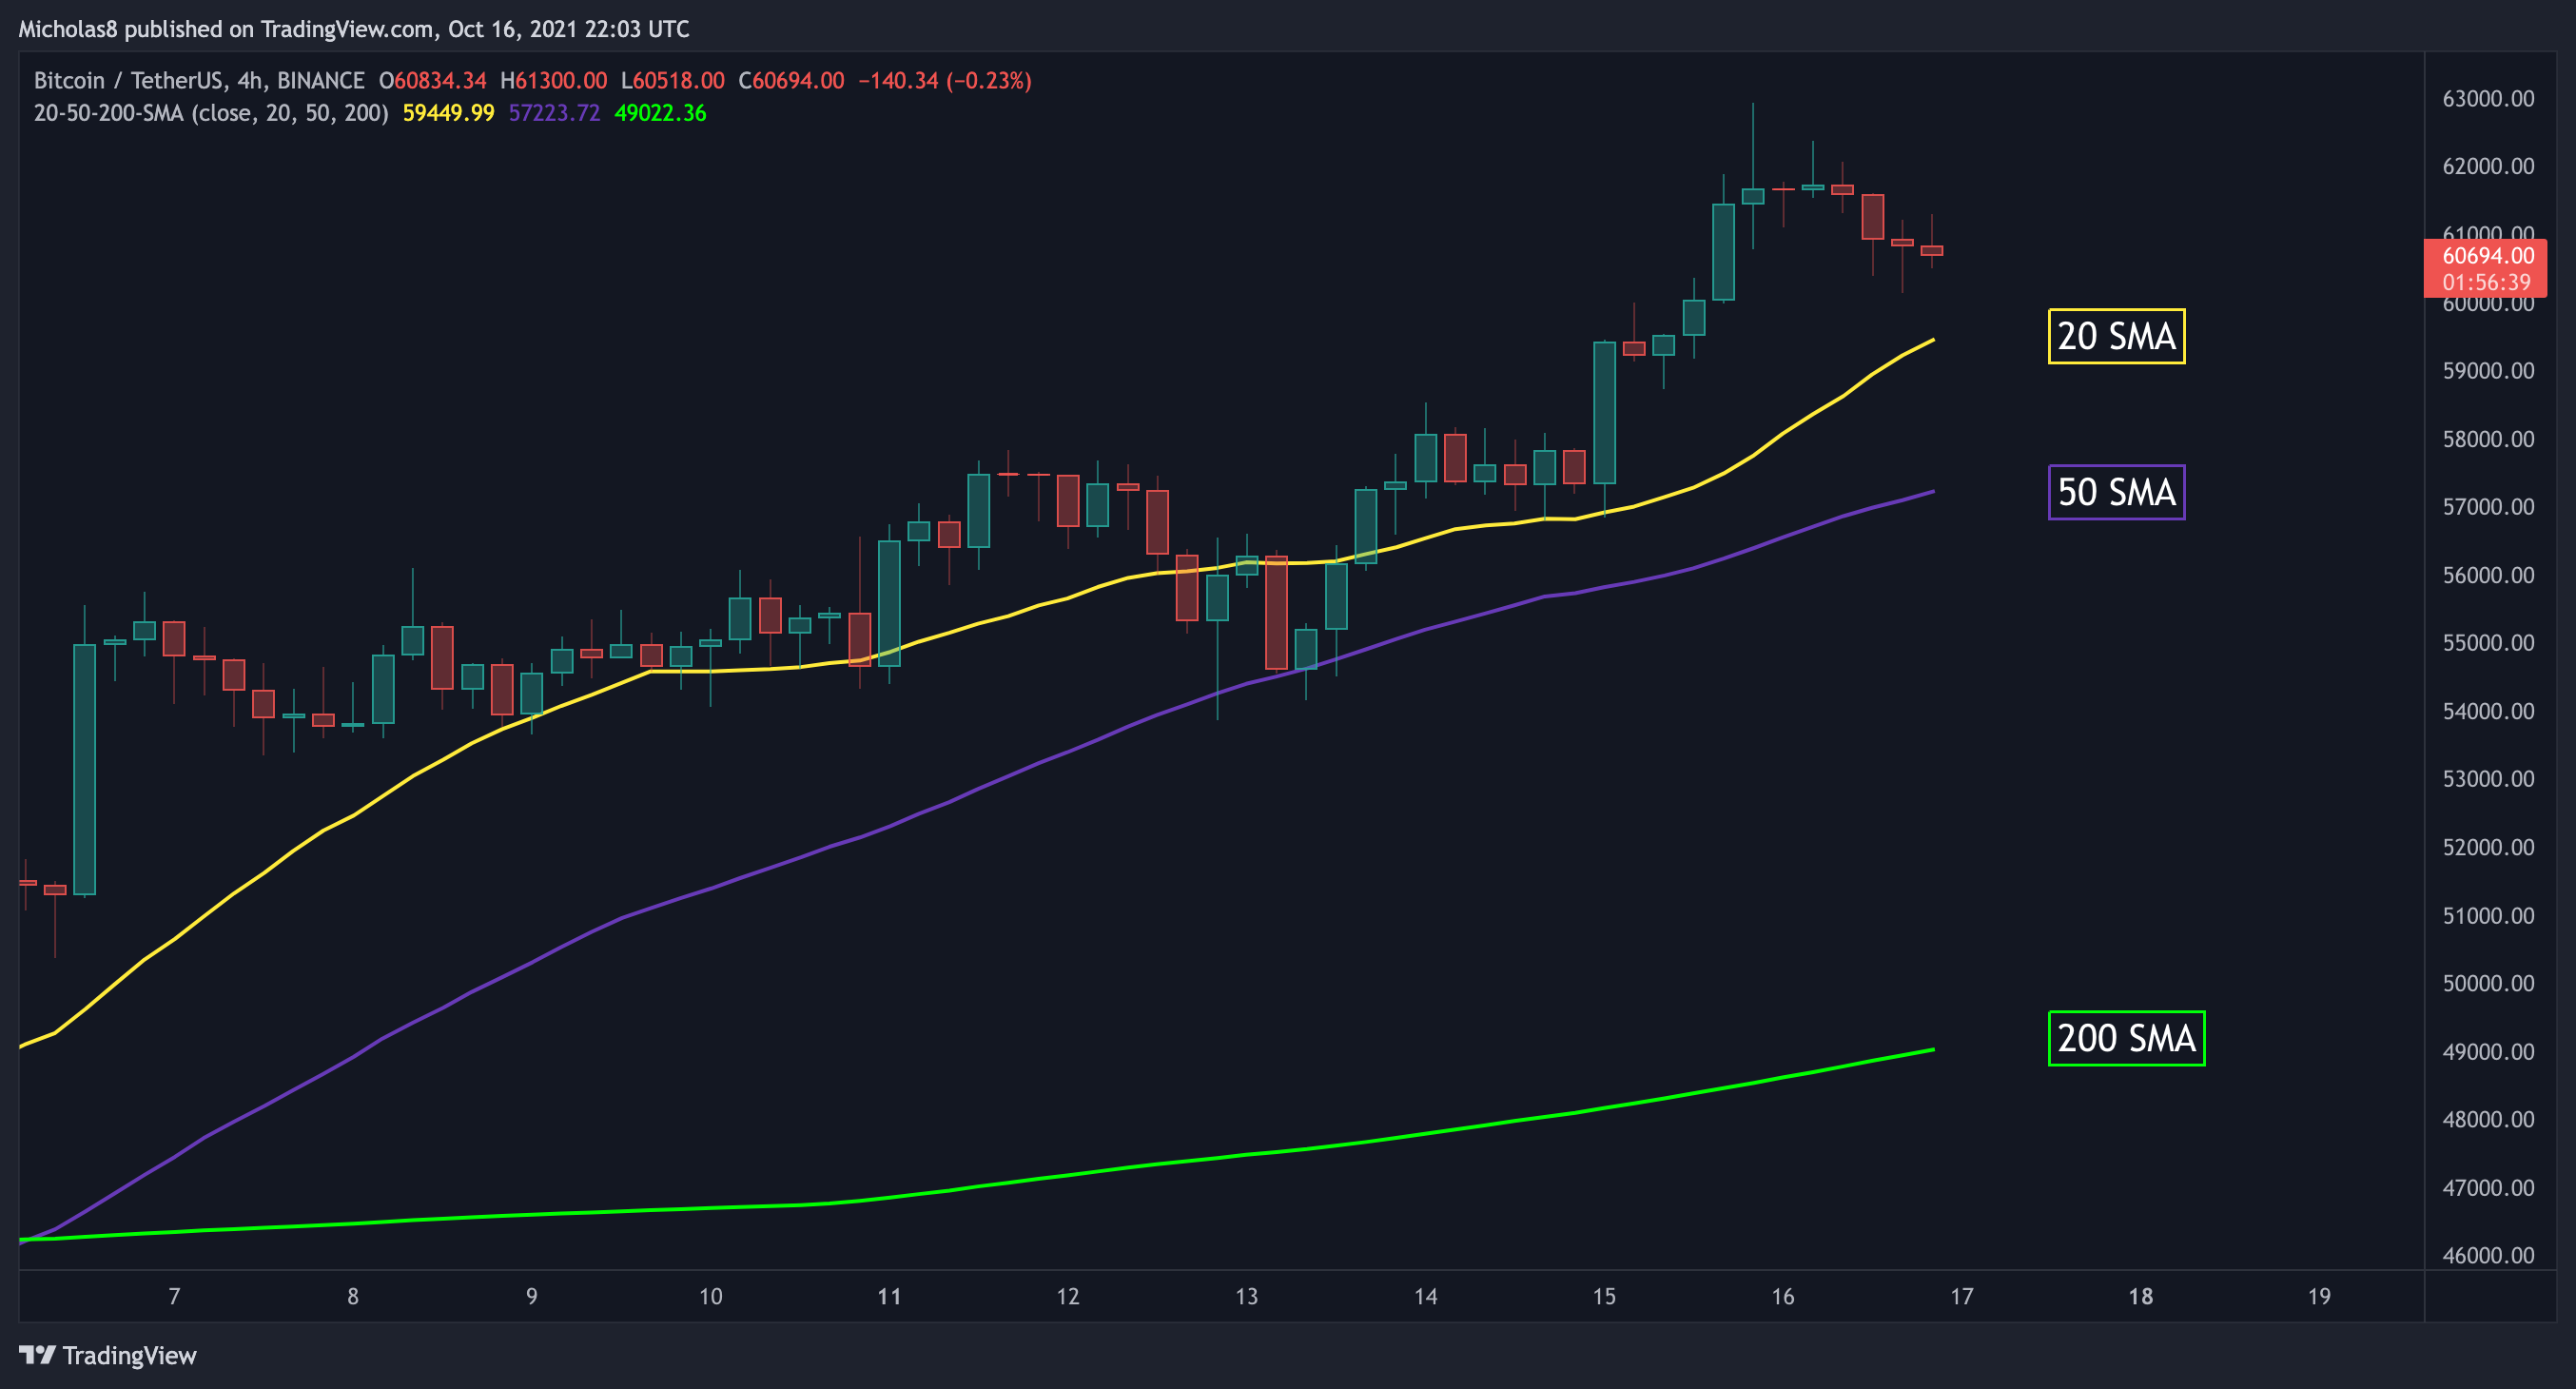
Bitcoin has reclaimed all of these SMAs.
Implication: Ideally, they serve as support as the 20 did earlier today.
1H Timeframe
EMA Ribbon
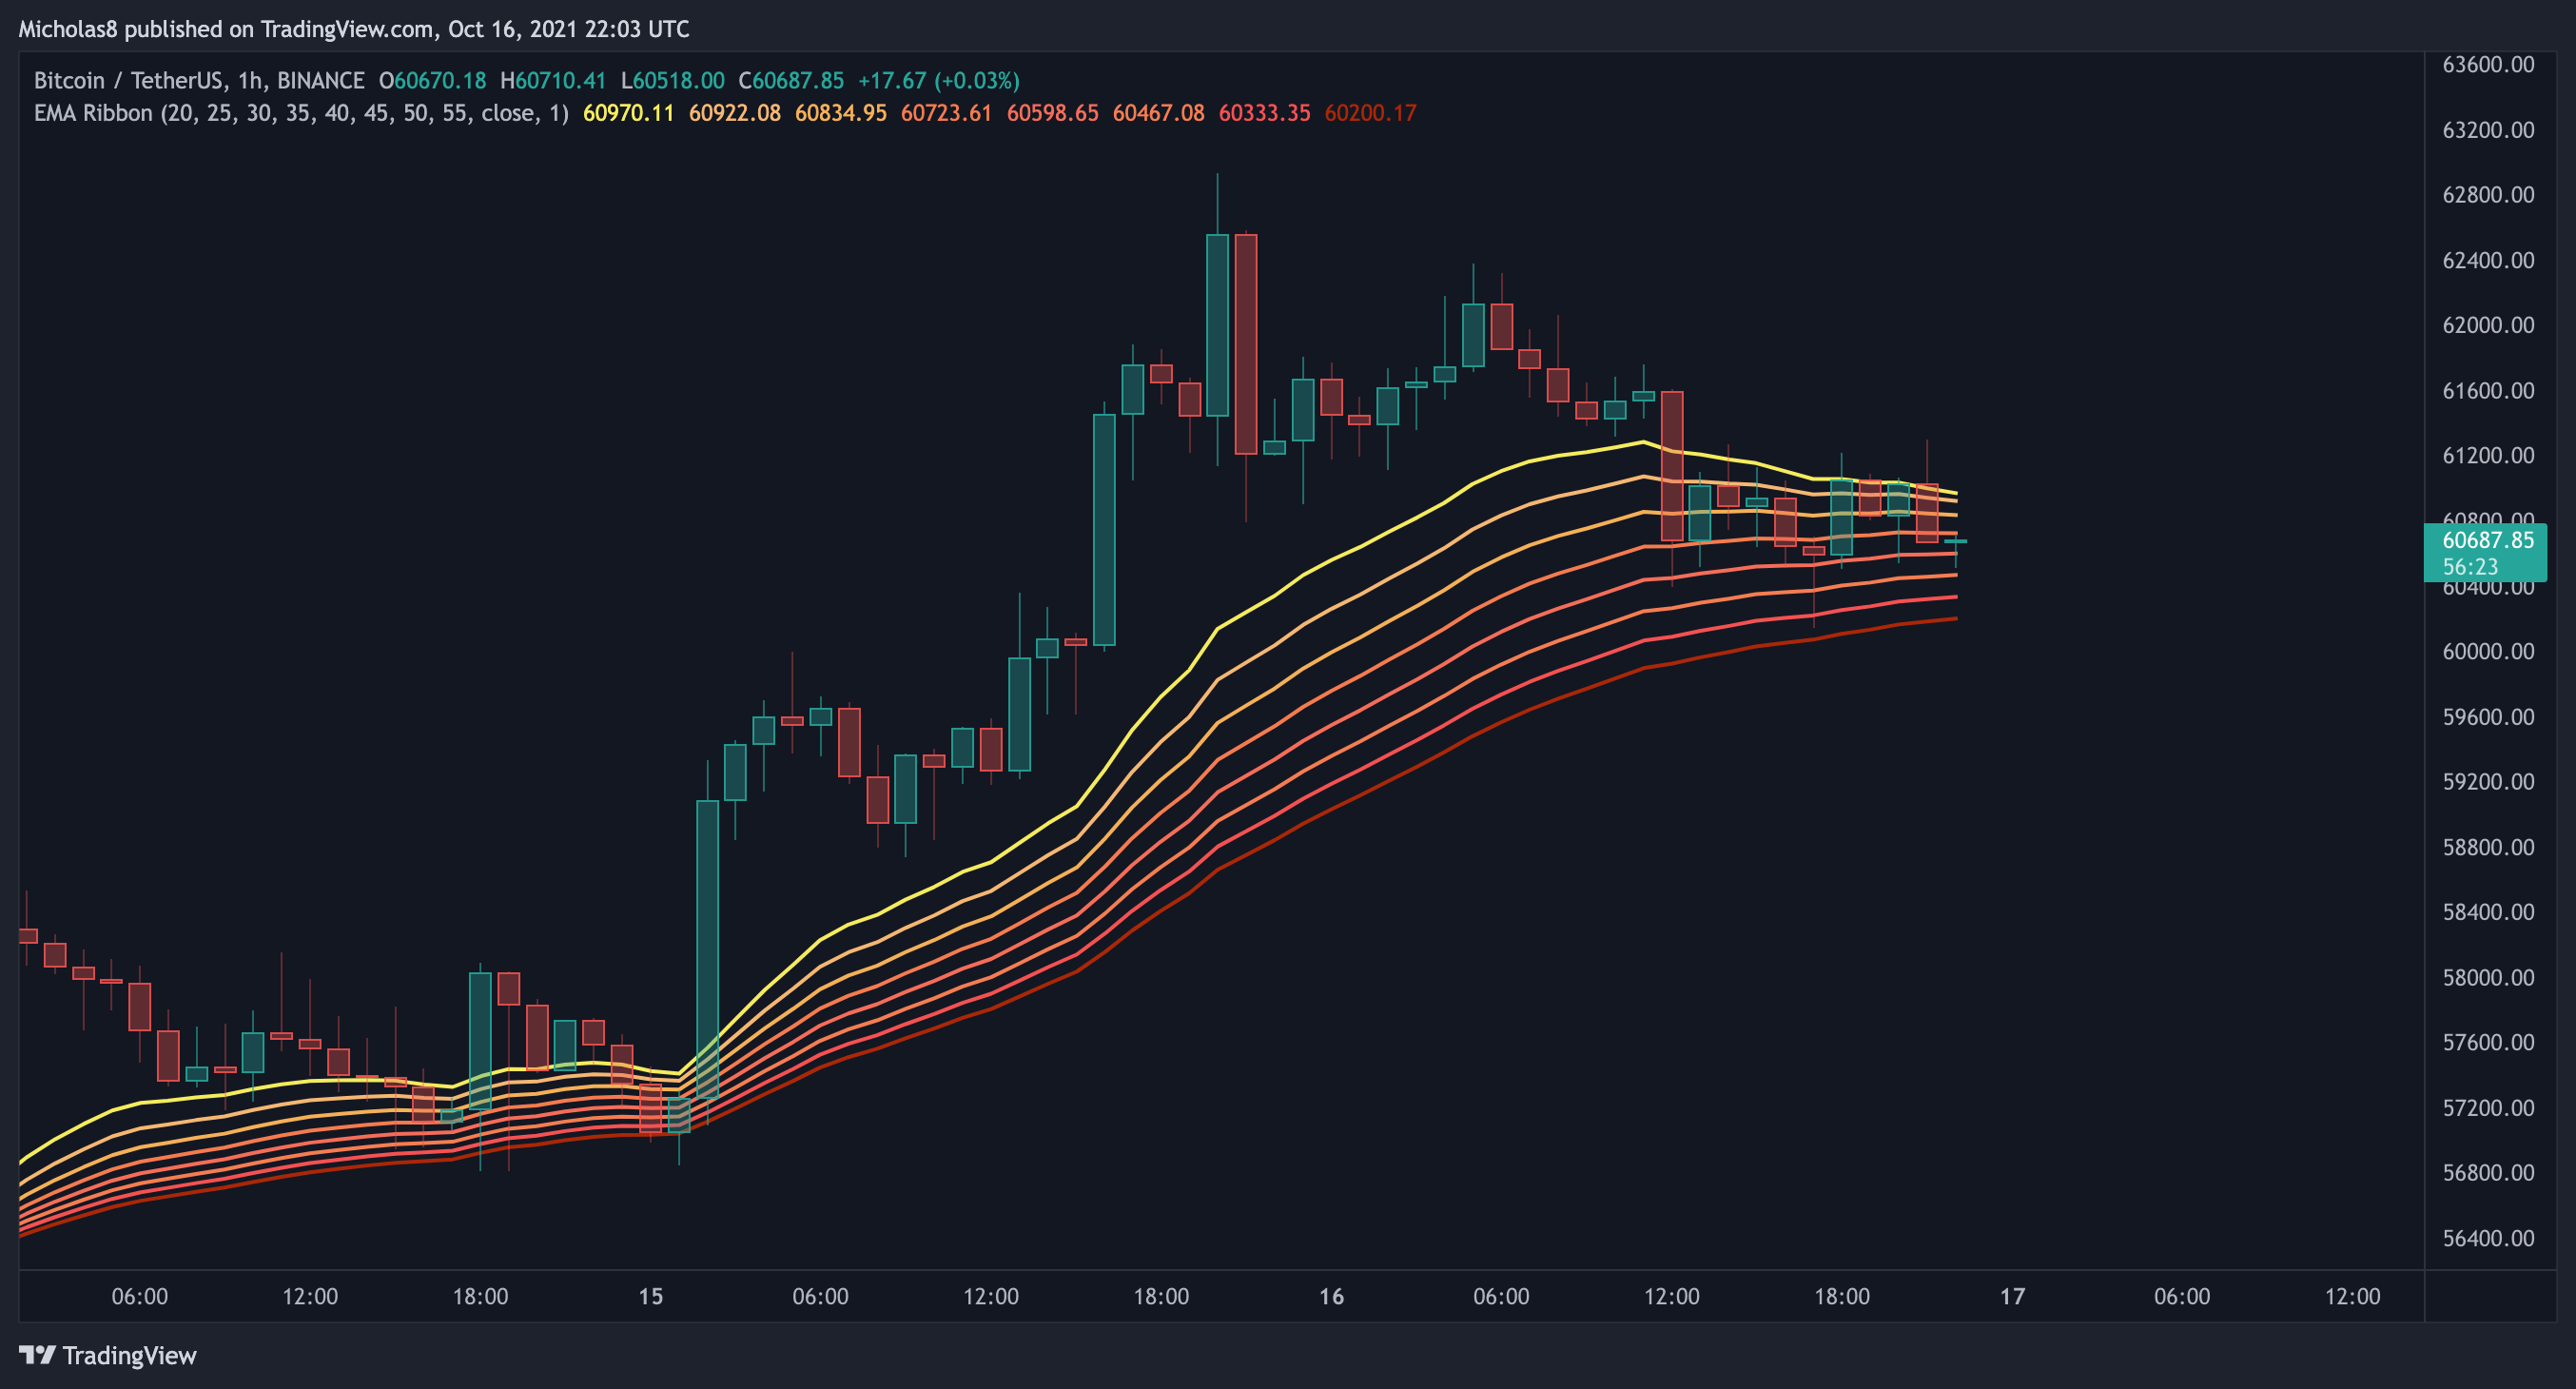
Bitcoin continues to trade above the ribbon in this timeframe.
Implication: Trading above the ribbon implies that momentum is with the bulls. Ideally, the ribbon serves as support as it may be right now.
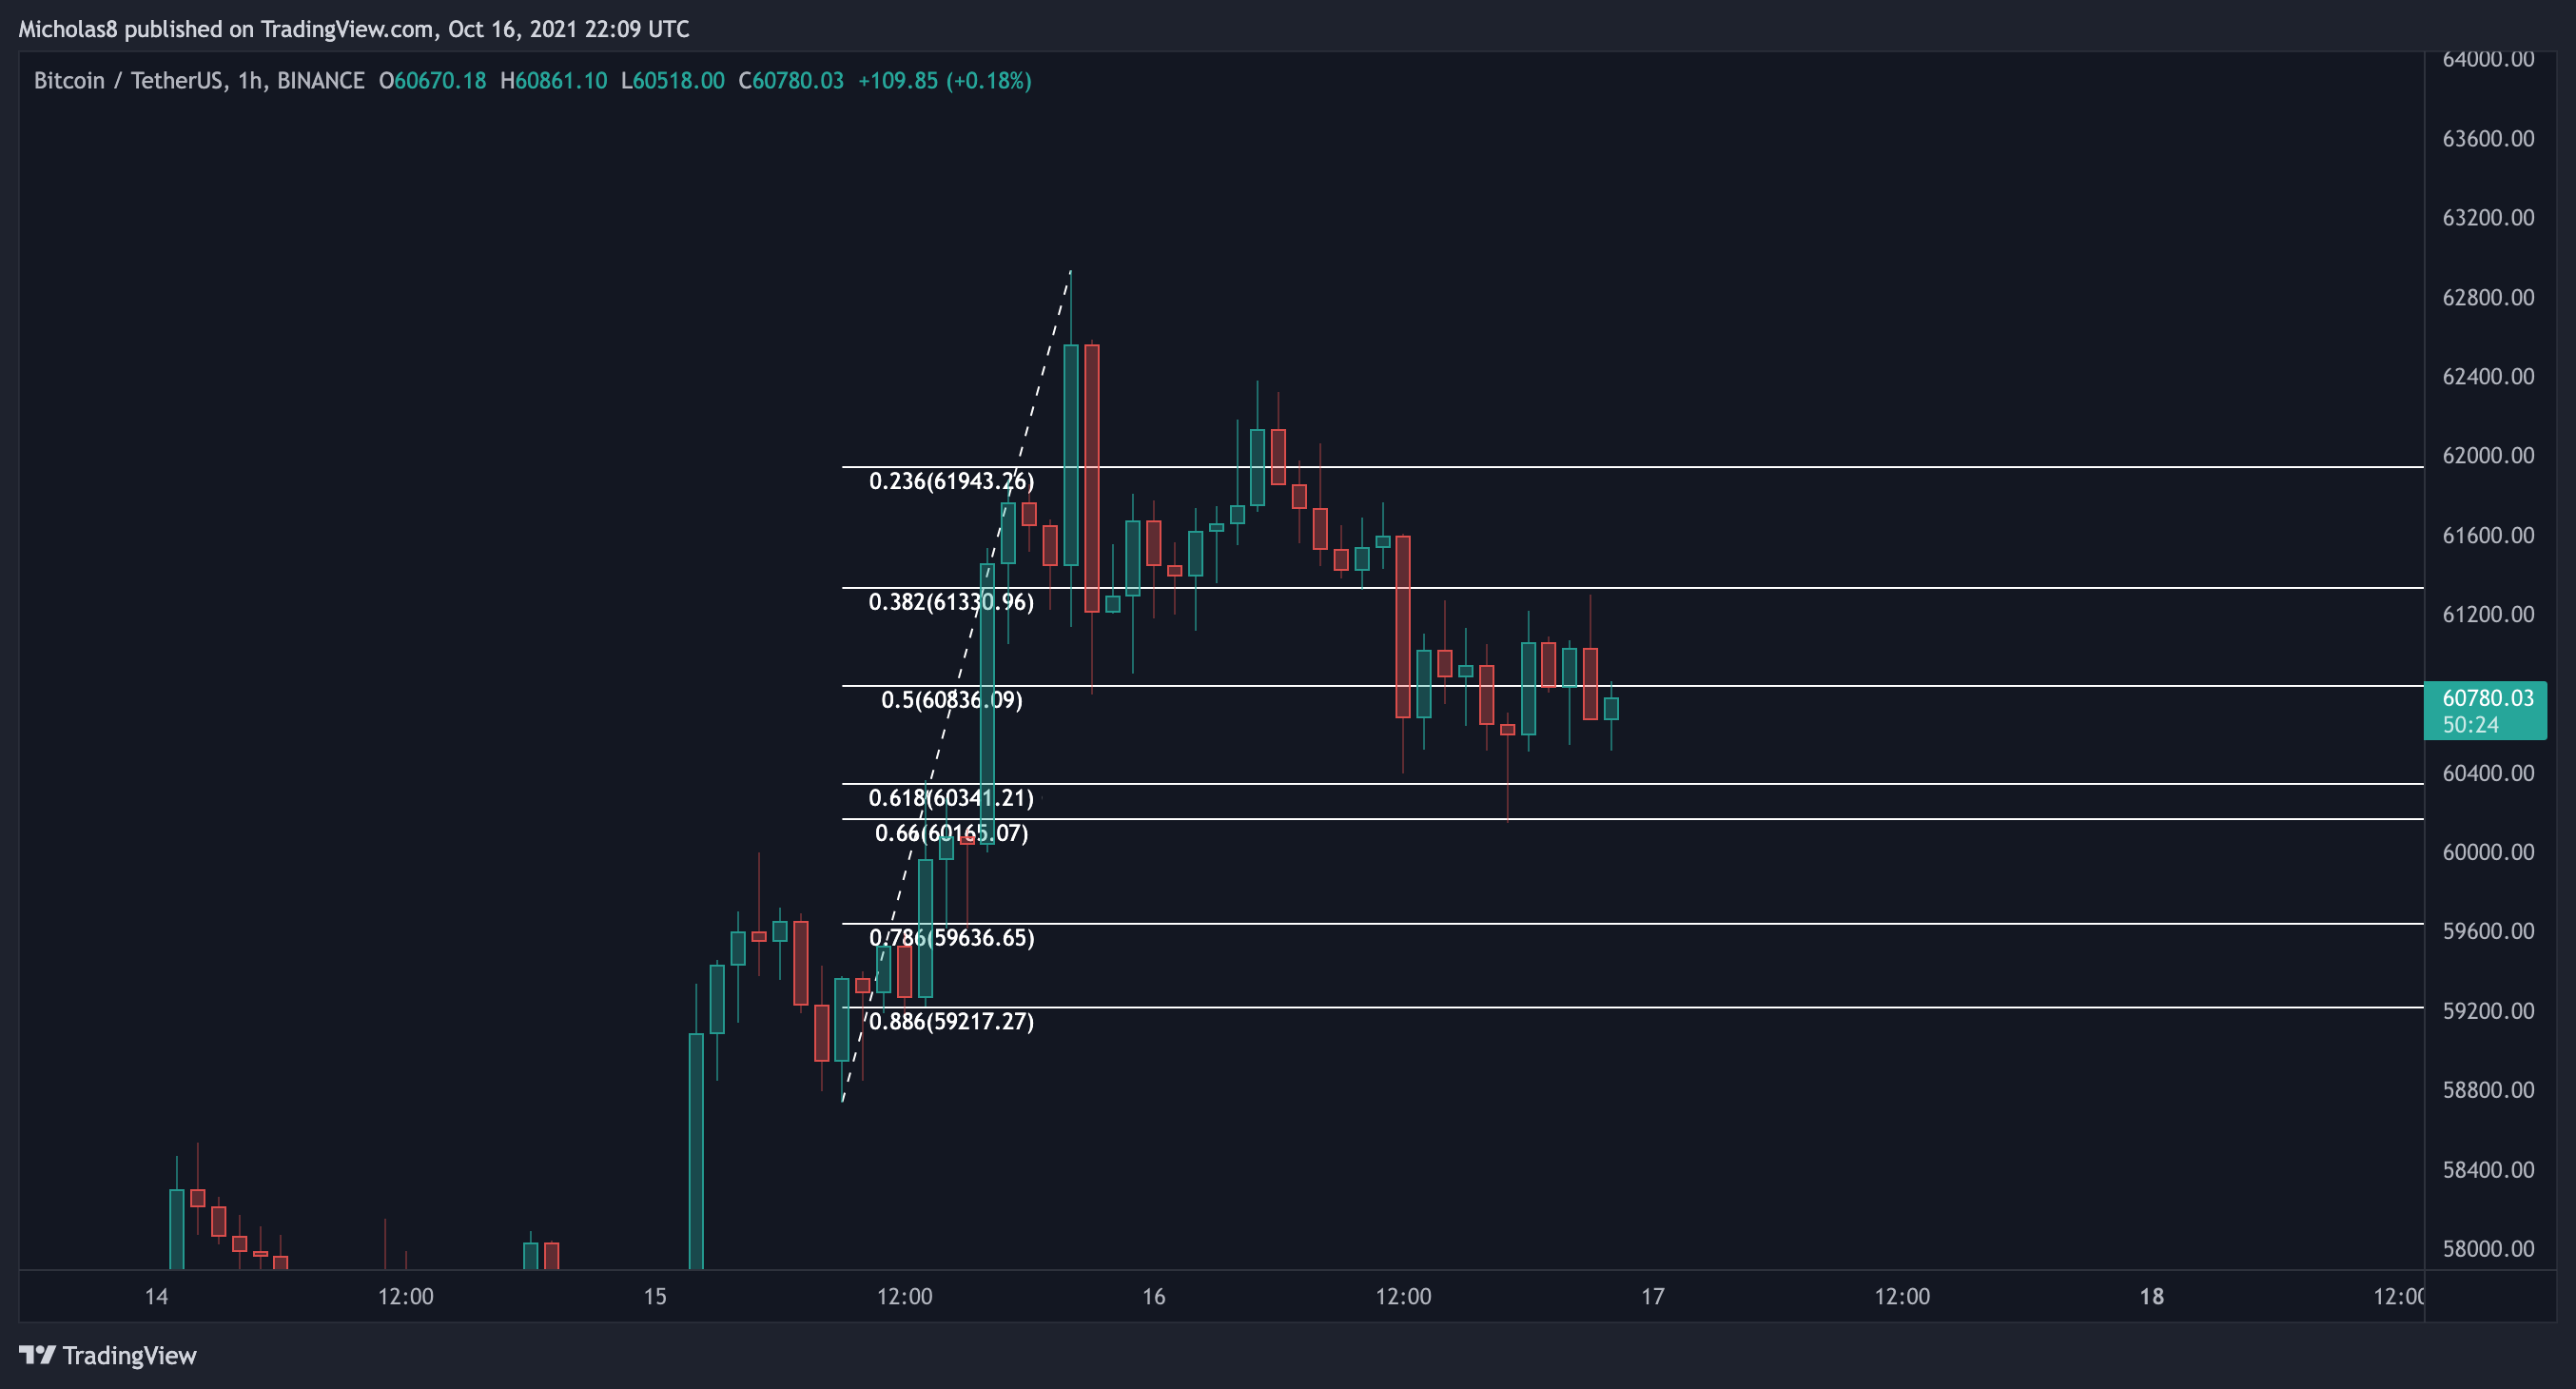
Divergences
Potential Hidden Bullish Divergence (green)
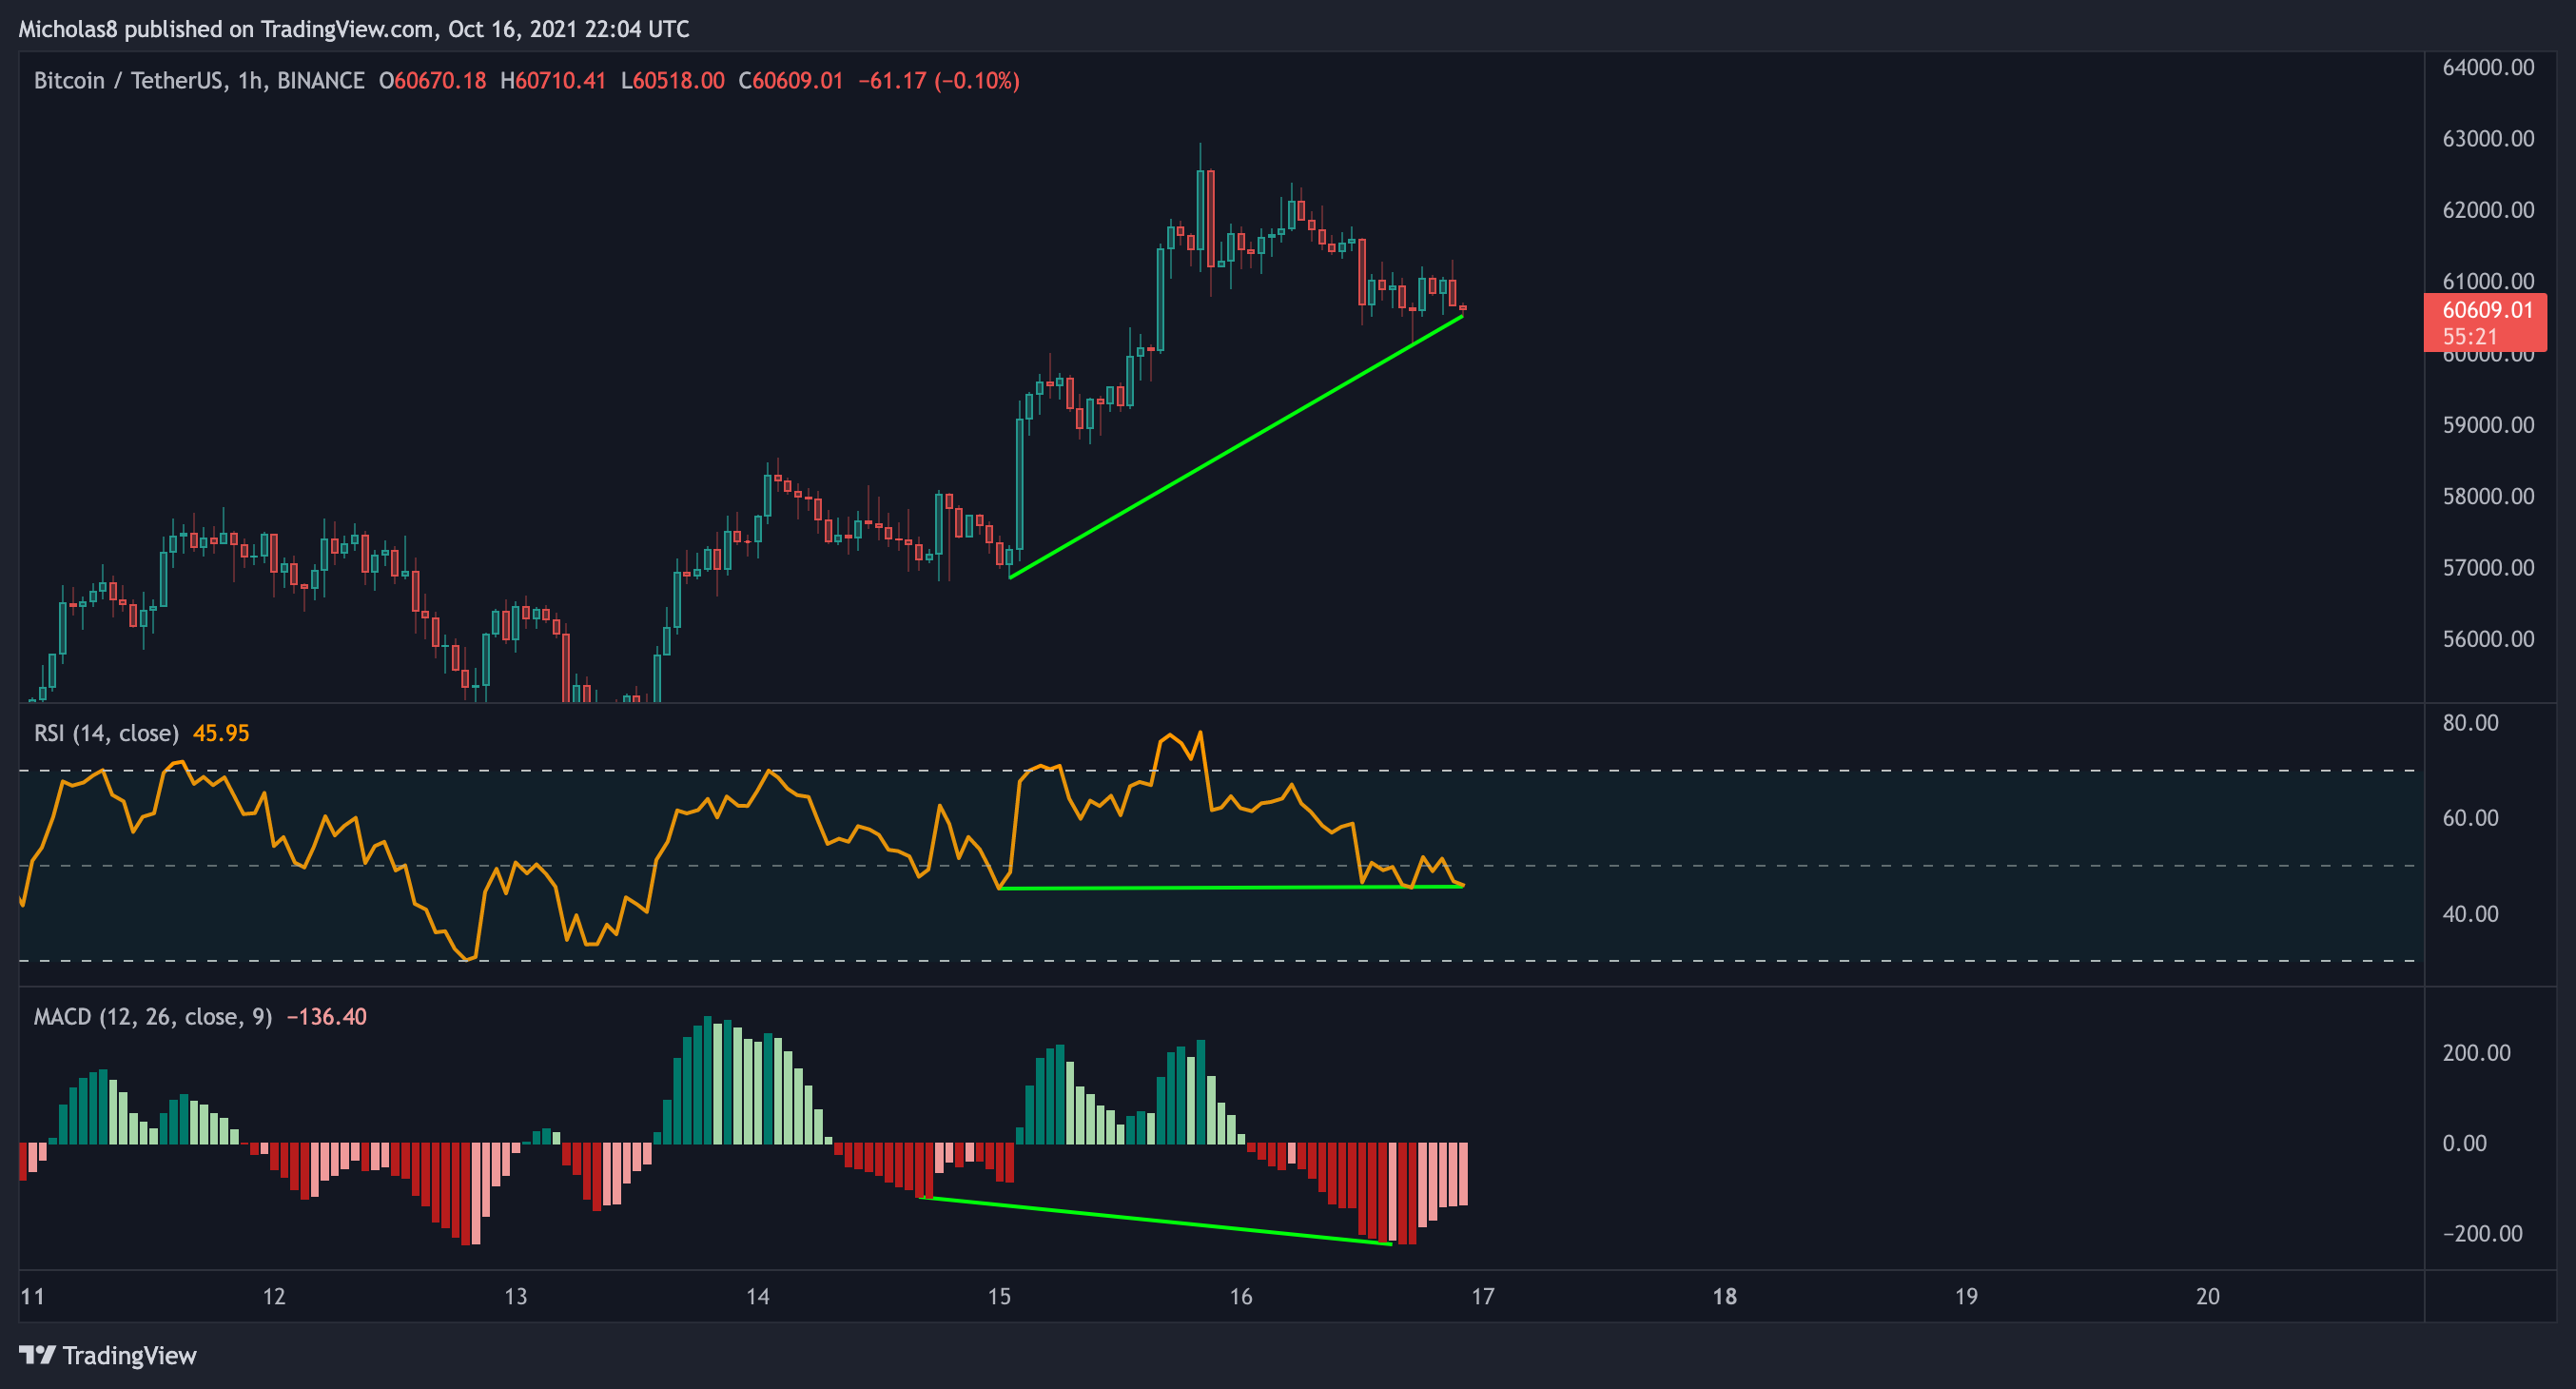
We have higher lows in price, with lower lows on the RSI/MACD. This is a hidden bullish divergence, which signals a possible trend continuation up.
Invalidation: Lower low in price, with a lower low in the oscillators.
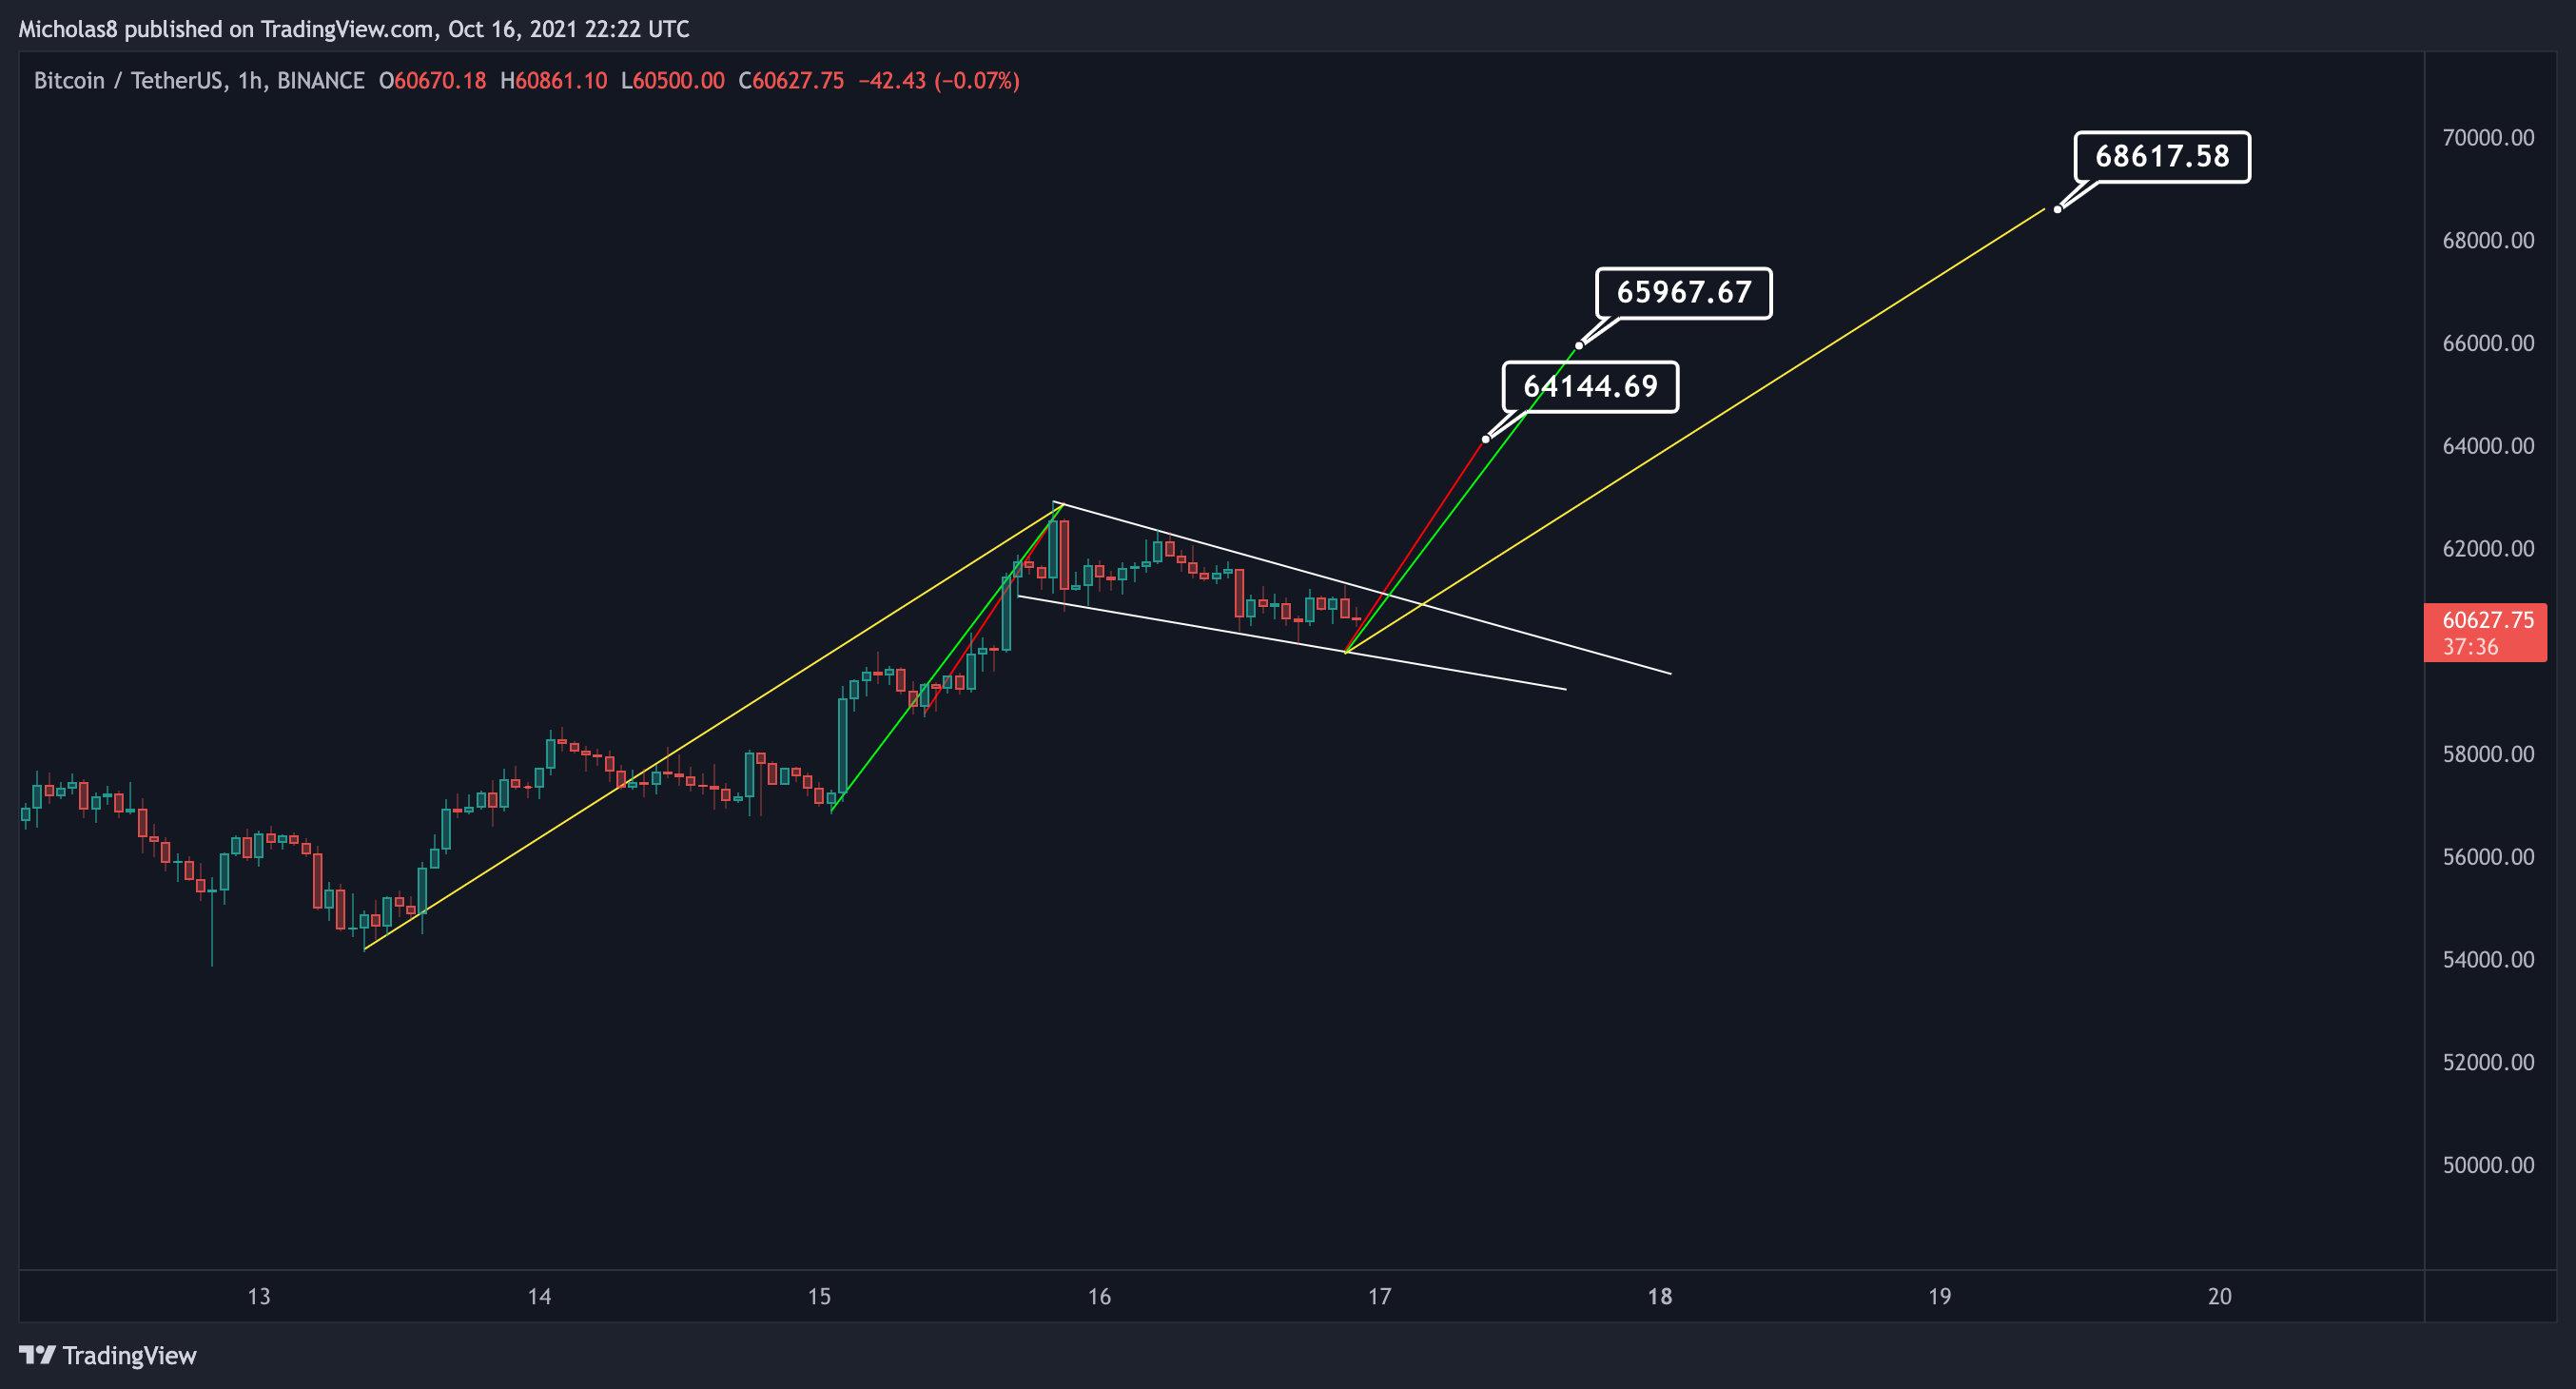
Patterns
*Please note not all technical targets will be hit, so be aware of all key levels and Fibonacci Levels, and also look out for divergences as they have the power to reverse a trend
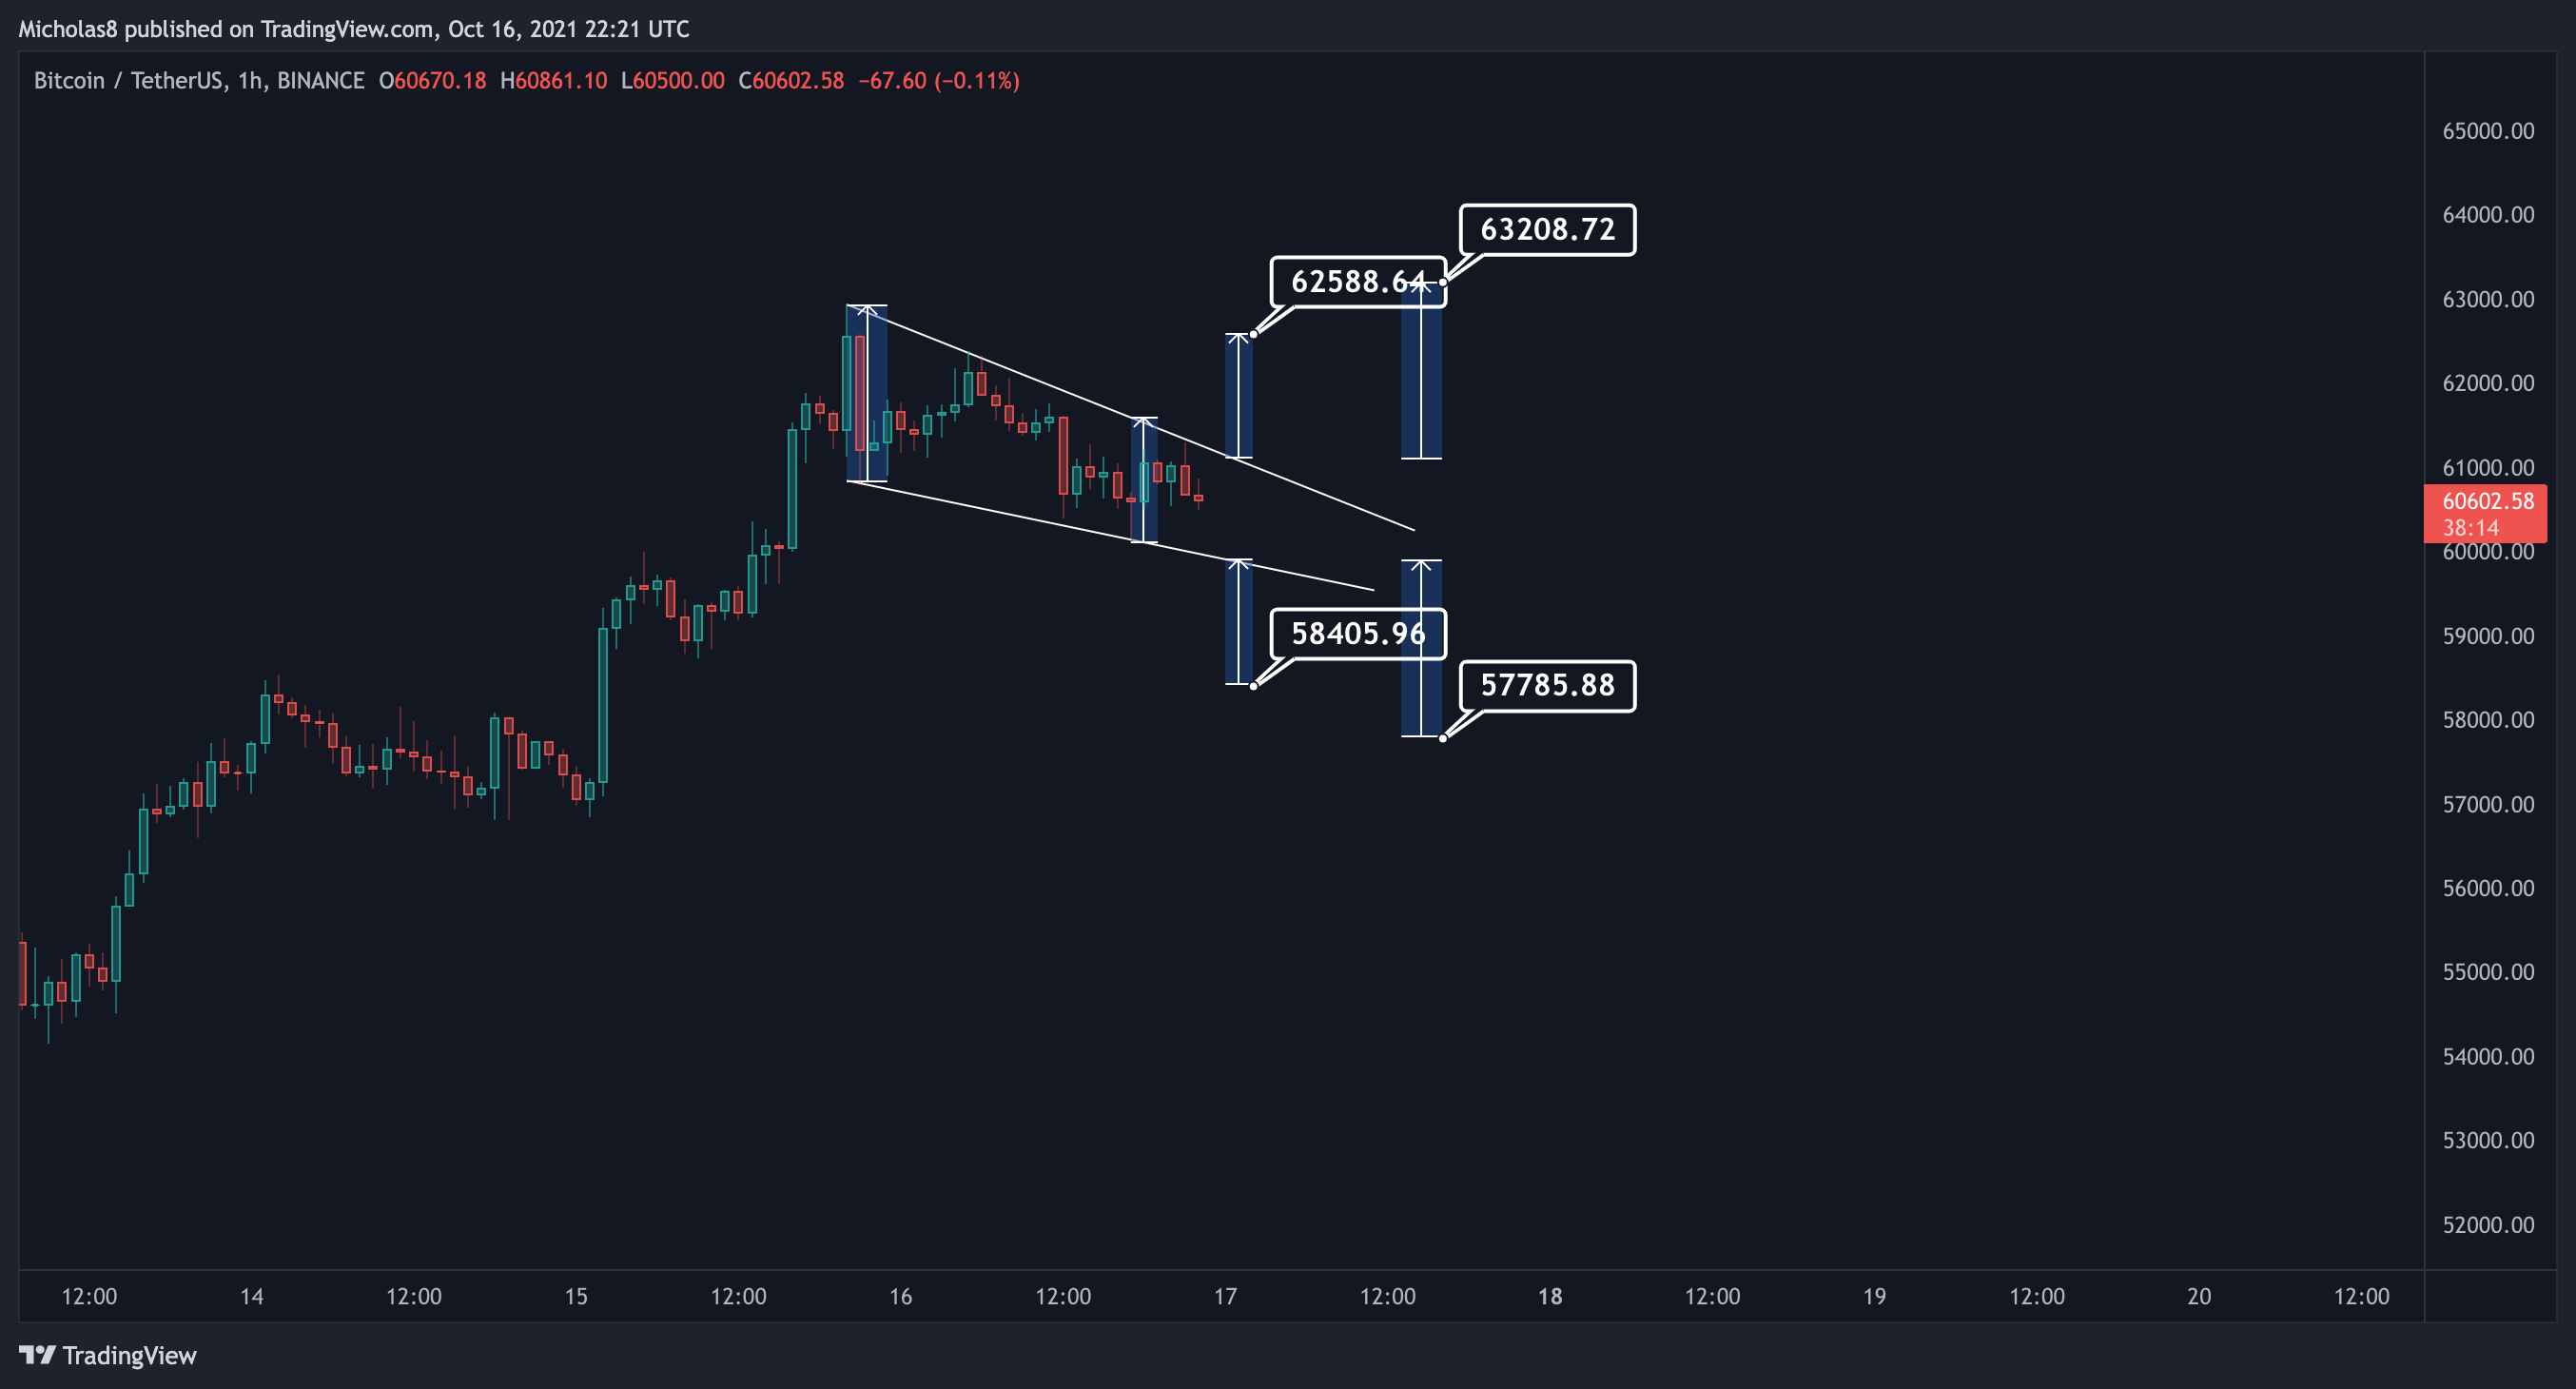
Falling Wedge
Bull Flag
THE BAD
Daily Timeframe
Bullish Exhaustion
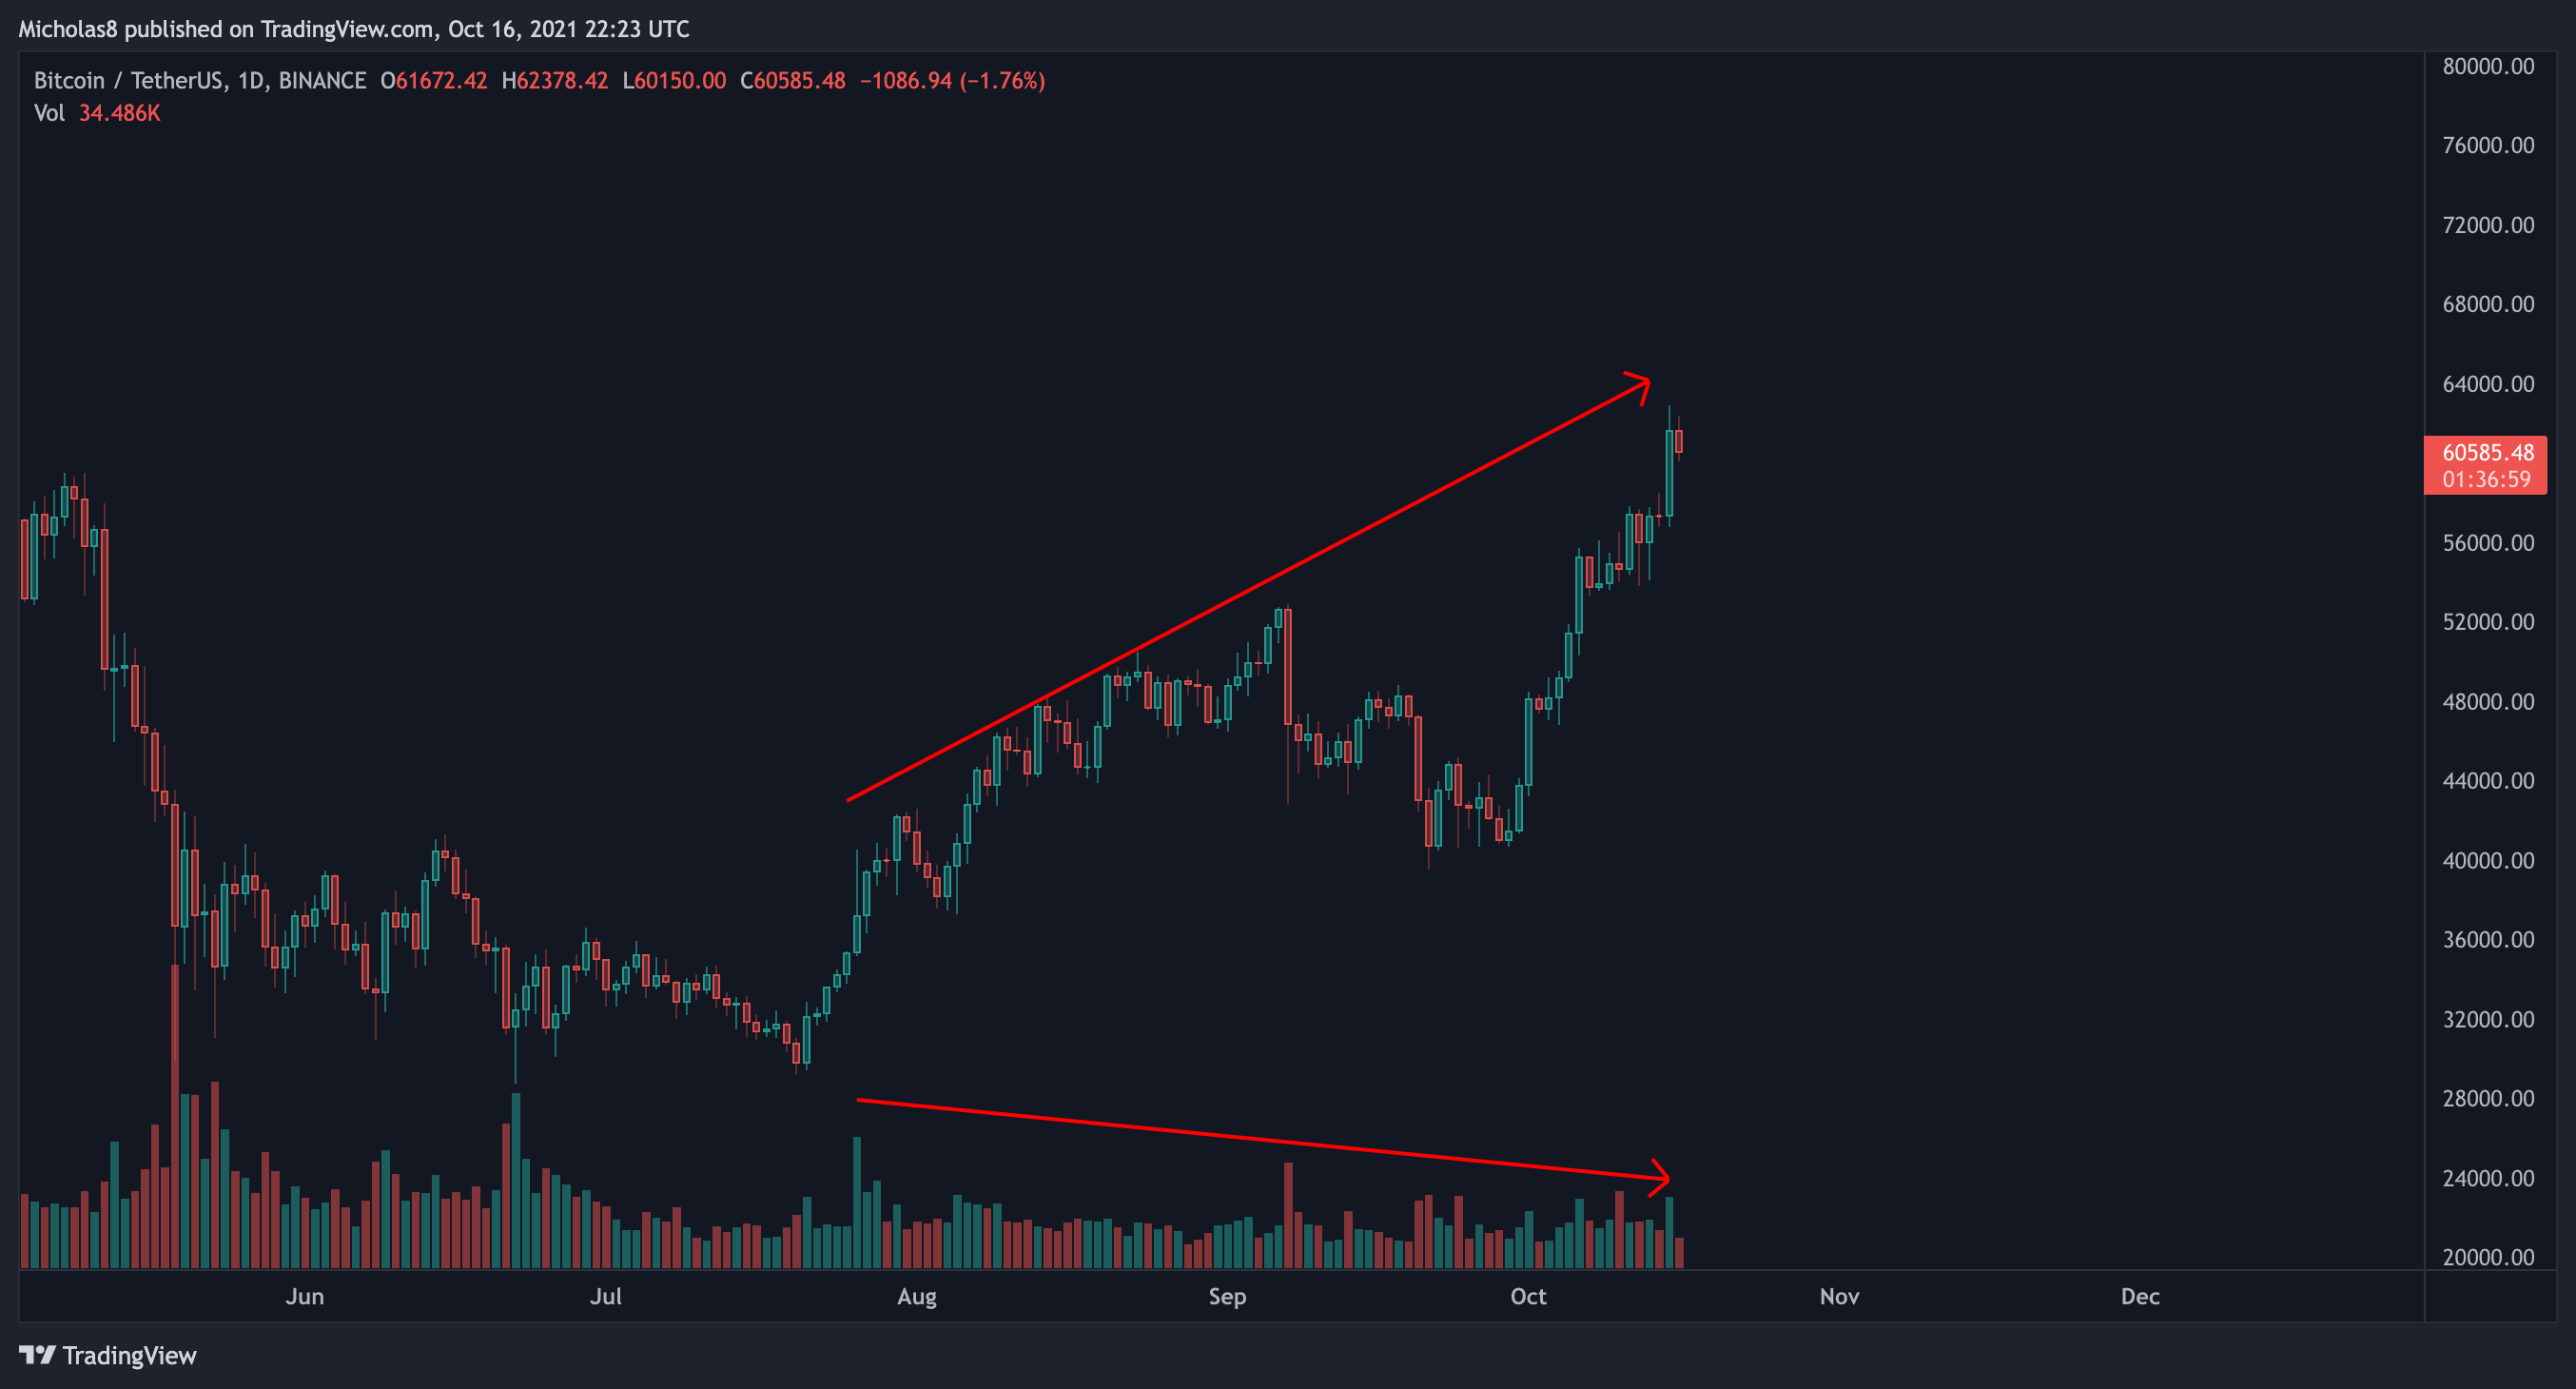
We have an increase in price with a decline in volume, possibly signalling a loss of bullish momentum in the market.
Divergences
Potential Bearish Divergence (red)
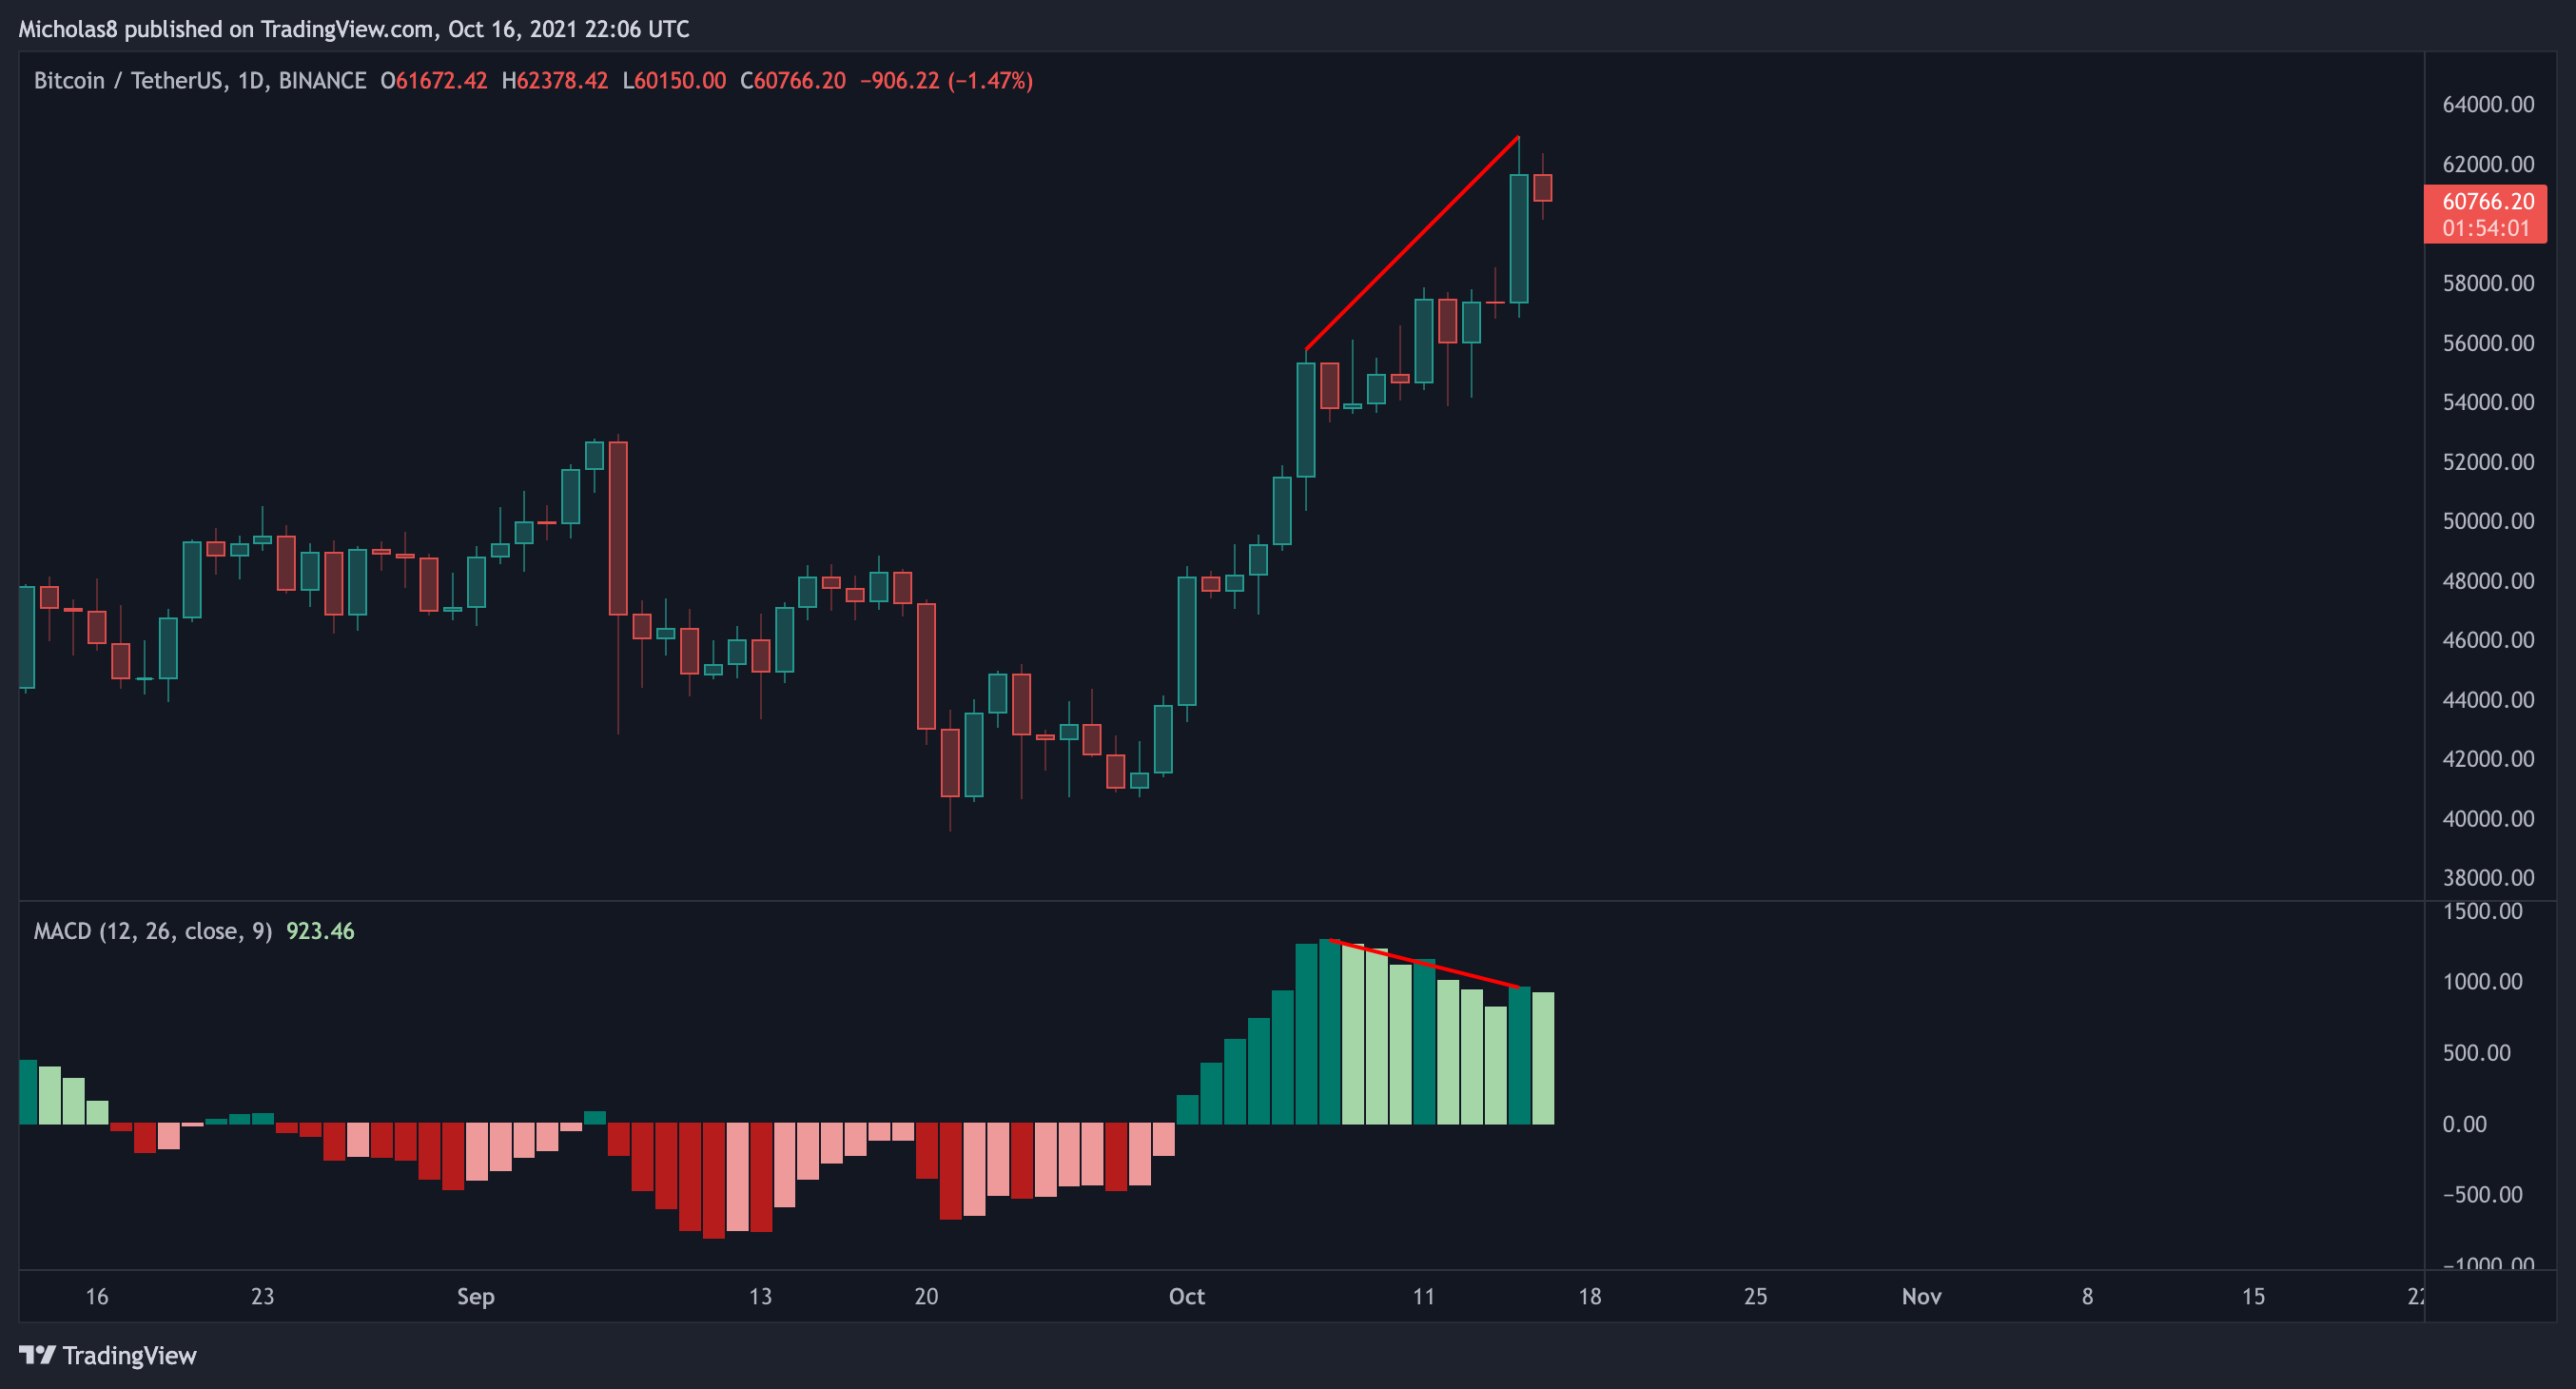
We have a higher high in price, with a lower high on the RSI. This is a bearish divergence, which signals a possible trend reversal. In this case, that means down. Alternatively, we may go sideways.
Note: The higher the timeframe, the longer divergences take to develop and play out. There's still a possibility this does play out.
Invalidation: Higher high in price, with a higher high on the MACD.
4H Timeframe
Divergences
Bearish Divergence (red)
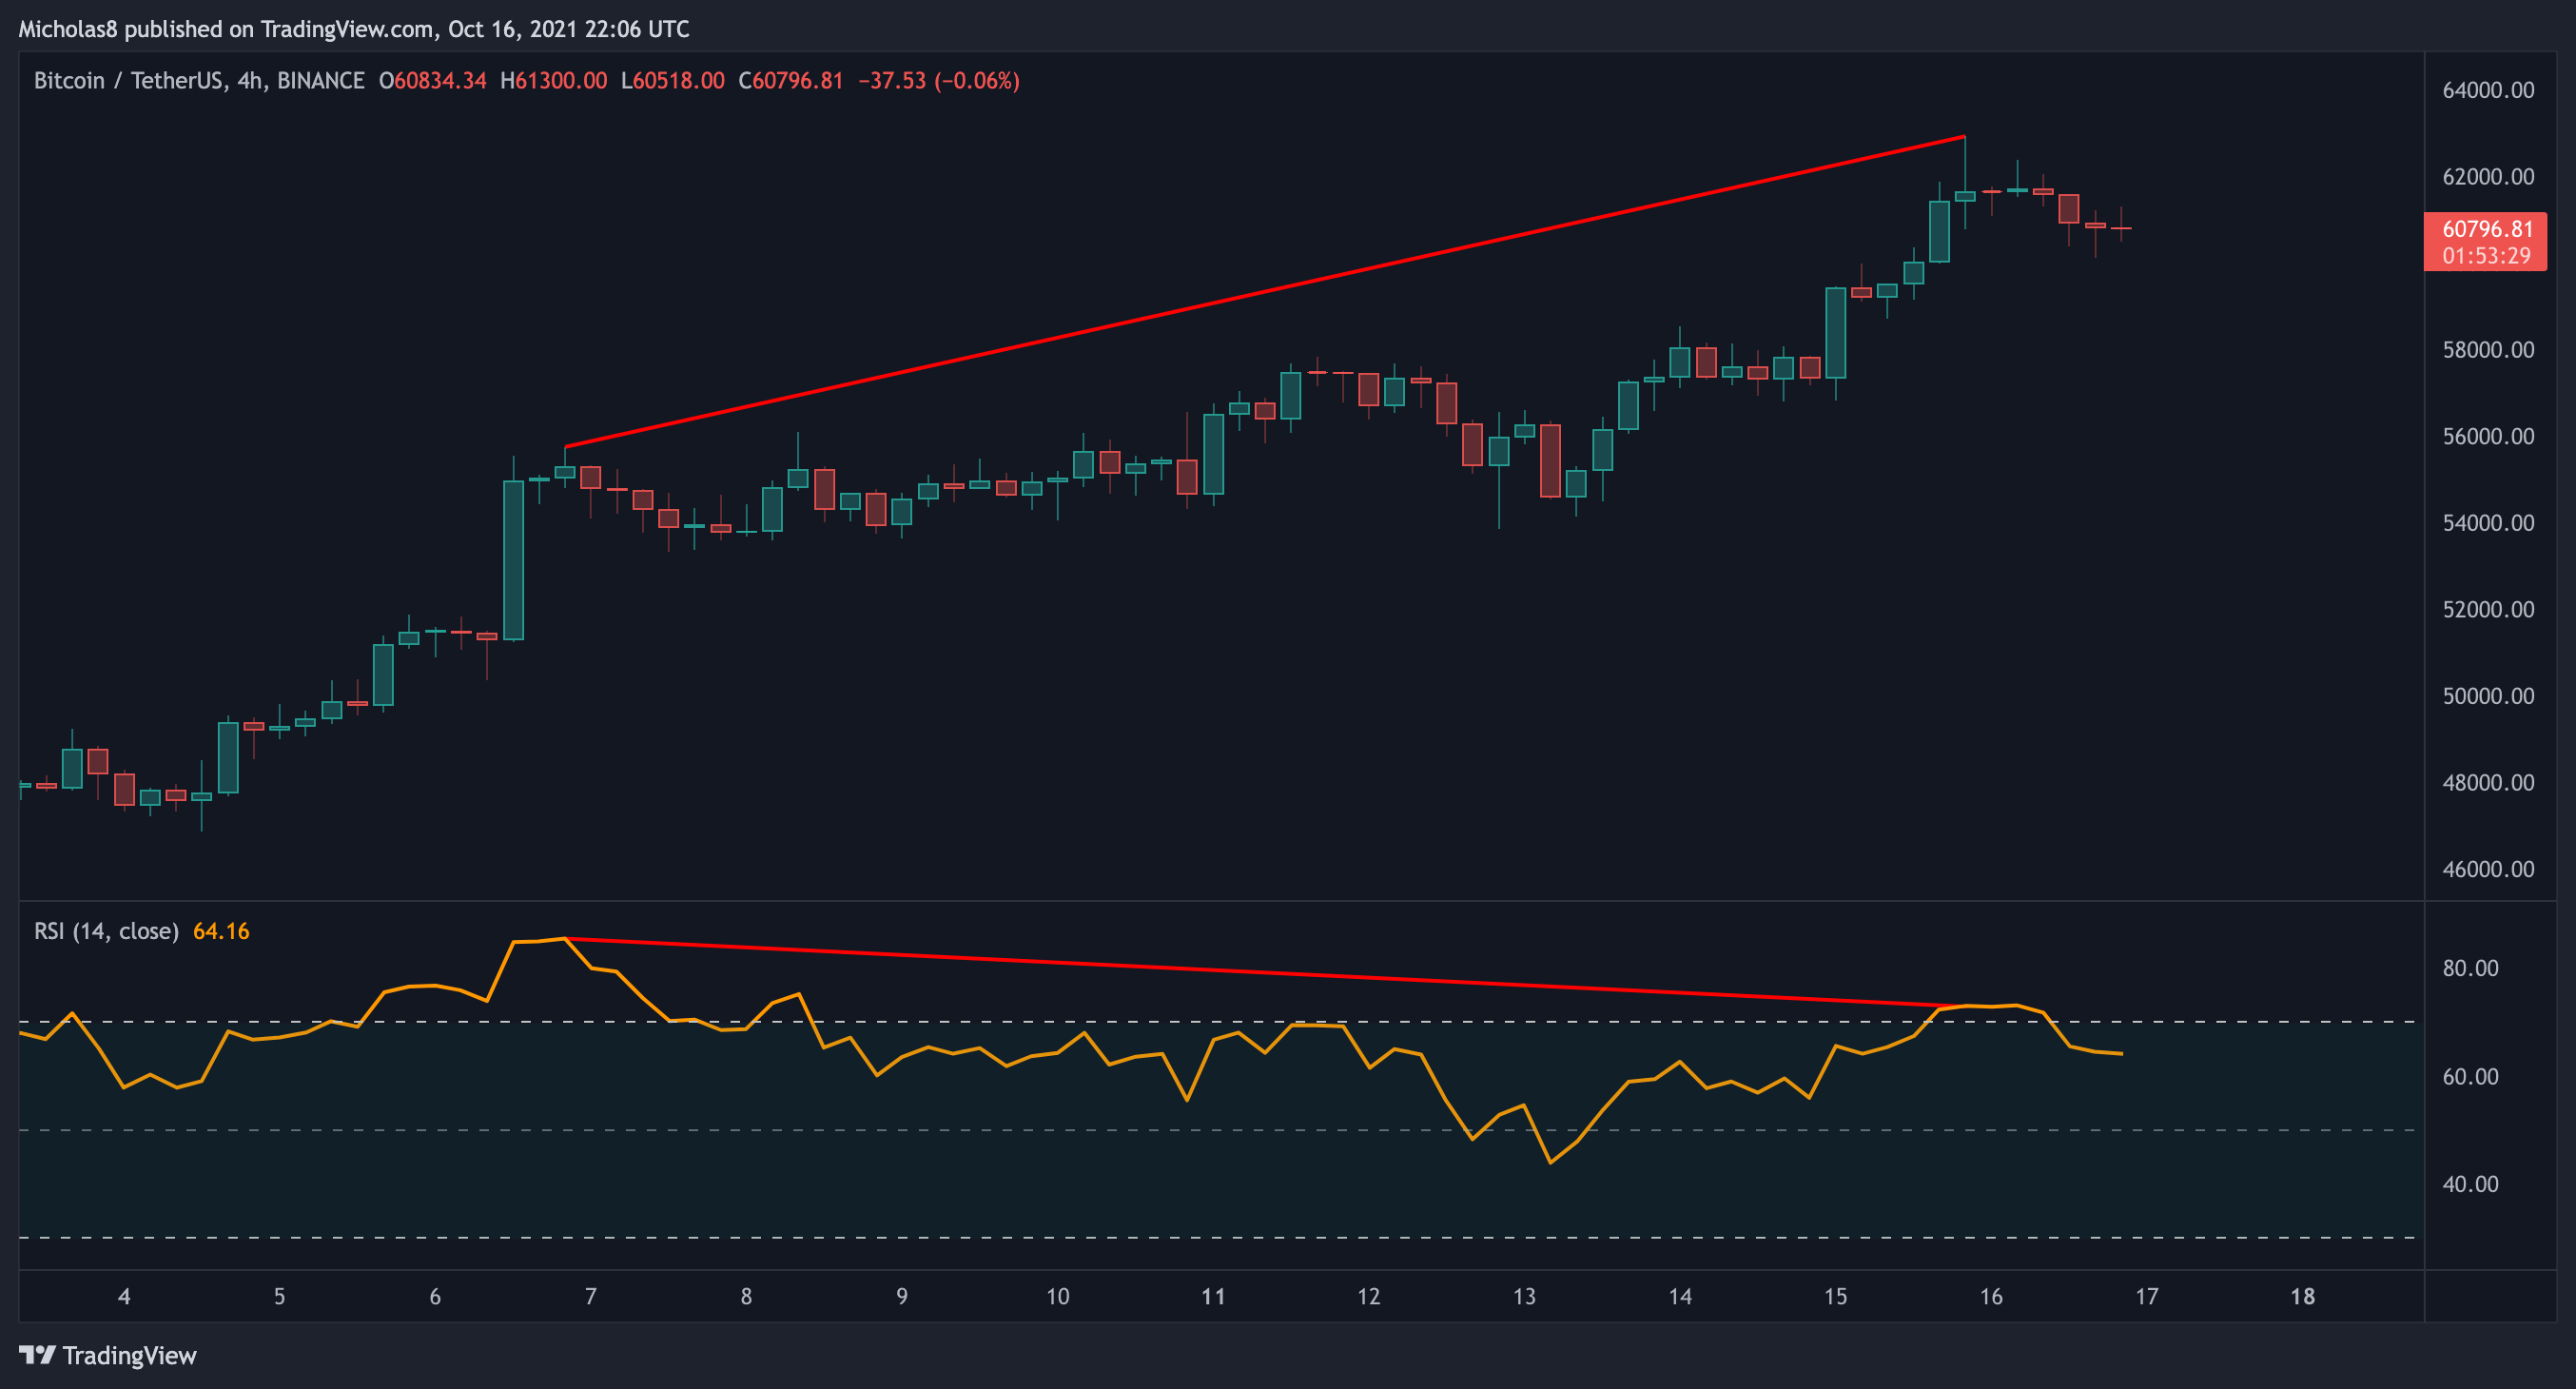
We have a higher high in price, with a lower high on the RSI. This is a bearish divergence, which signals a possible trend reversal. In this case, that means down. Alternatively, we may continue to go sideways.
Invalidation: Higher high in price, with a higher high on the RSI.
.
.
.
CME GAPS
The immediate gap below us at 32480 is still open. Although not all gaps fill, they do tend to, which is why I'm still including this gap as something to be aware of.
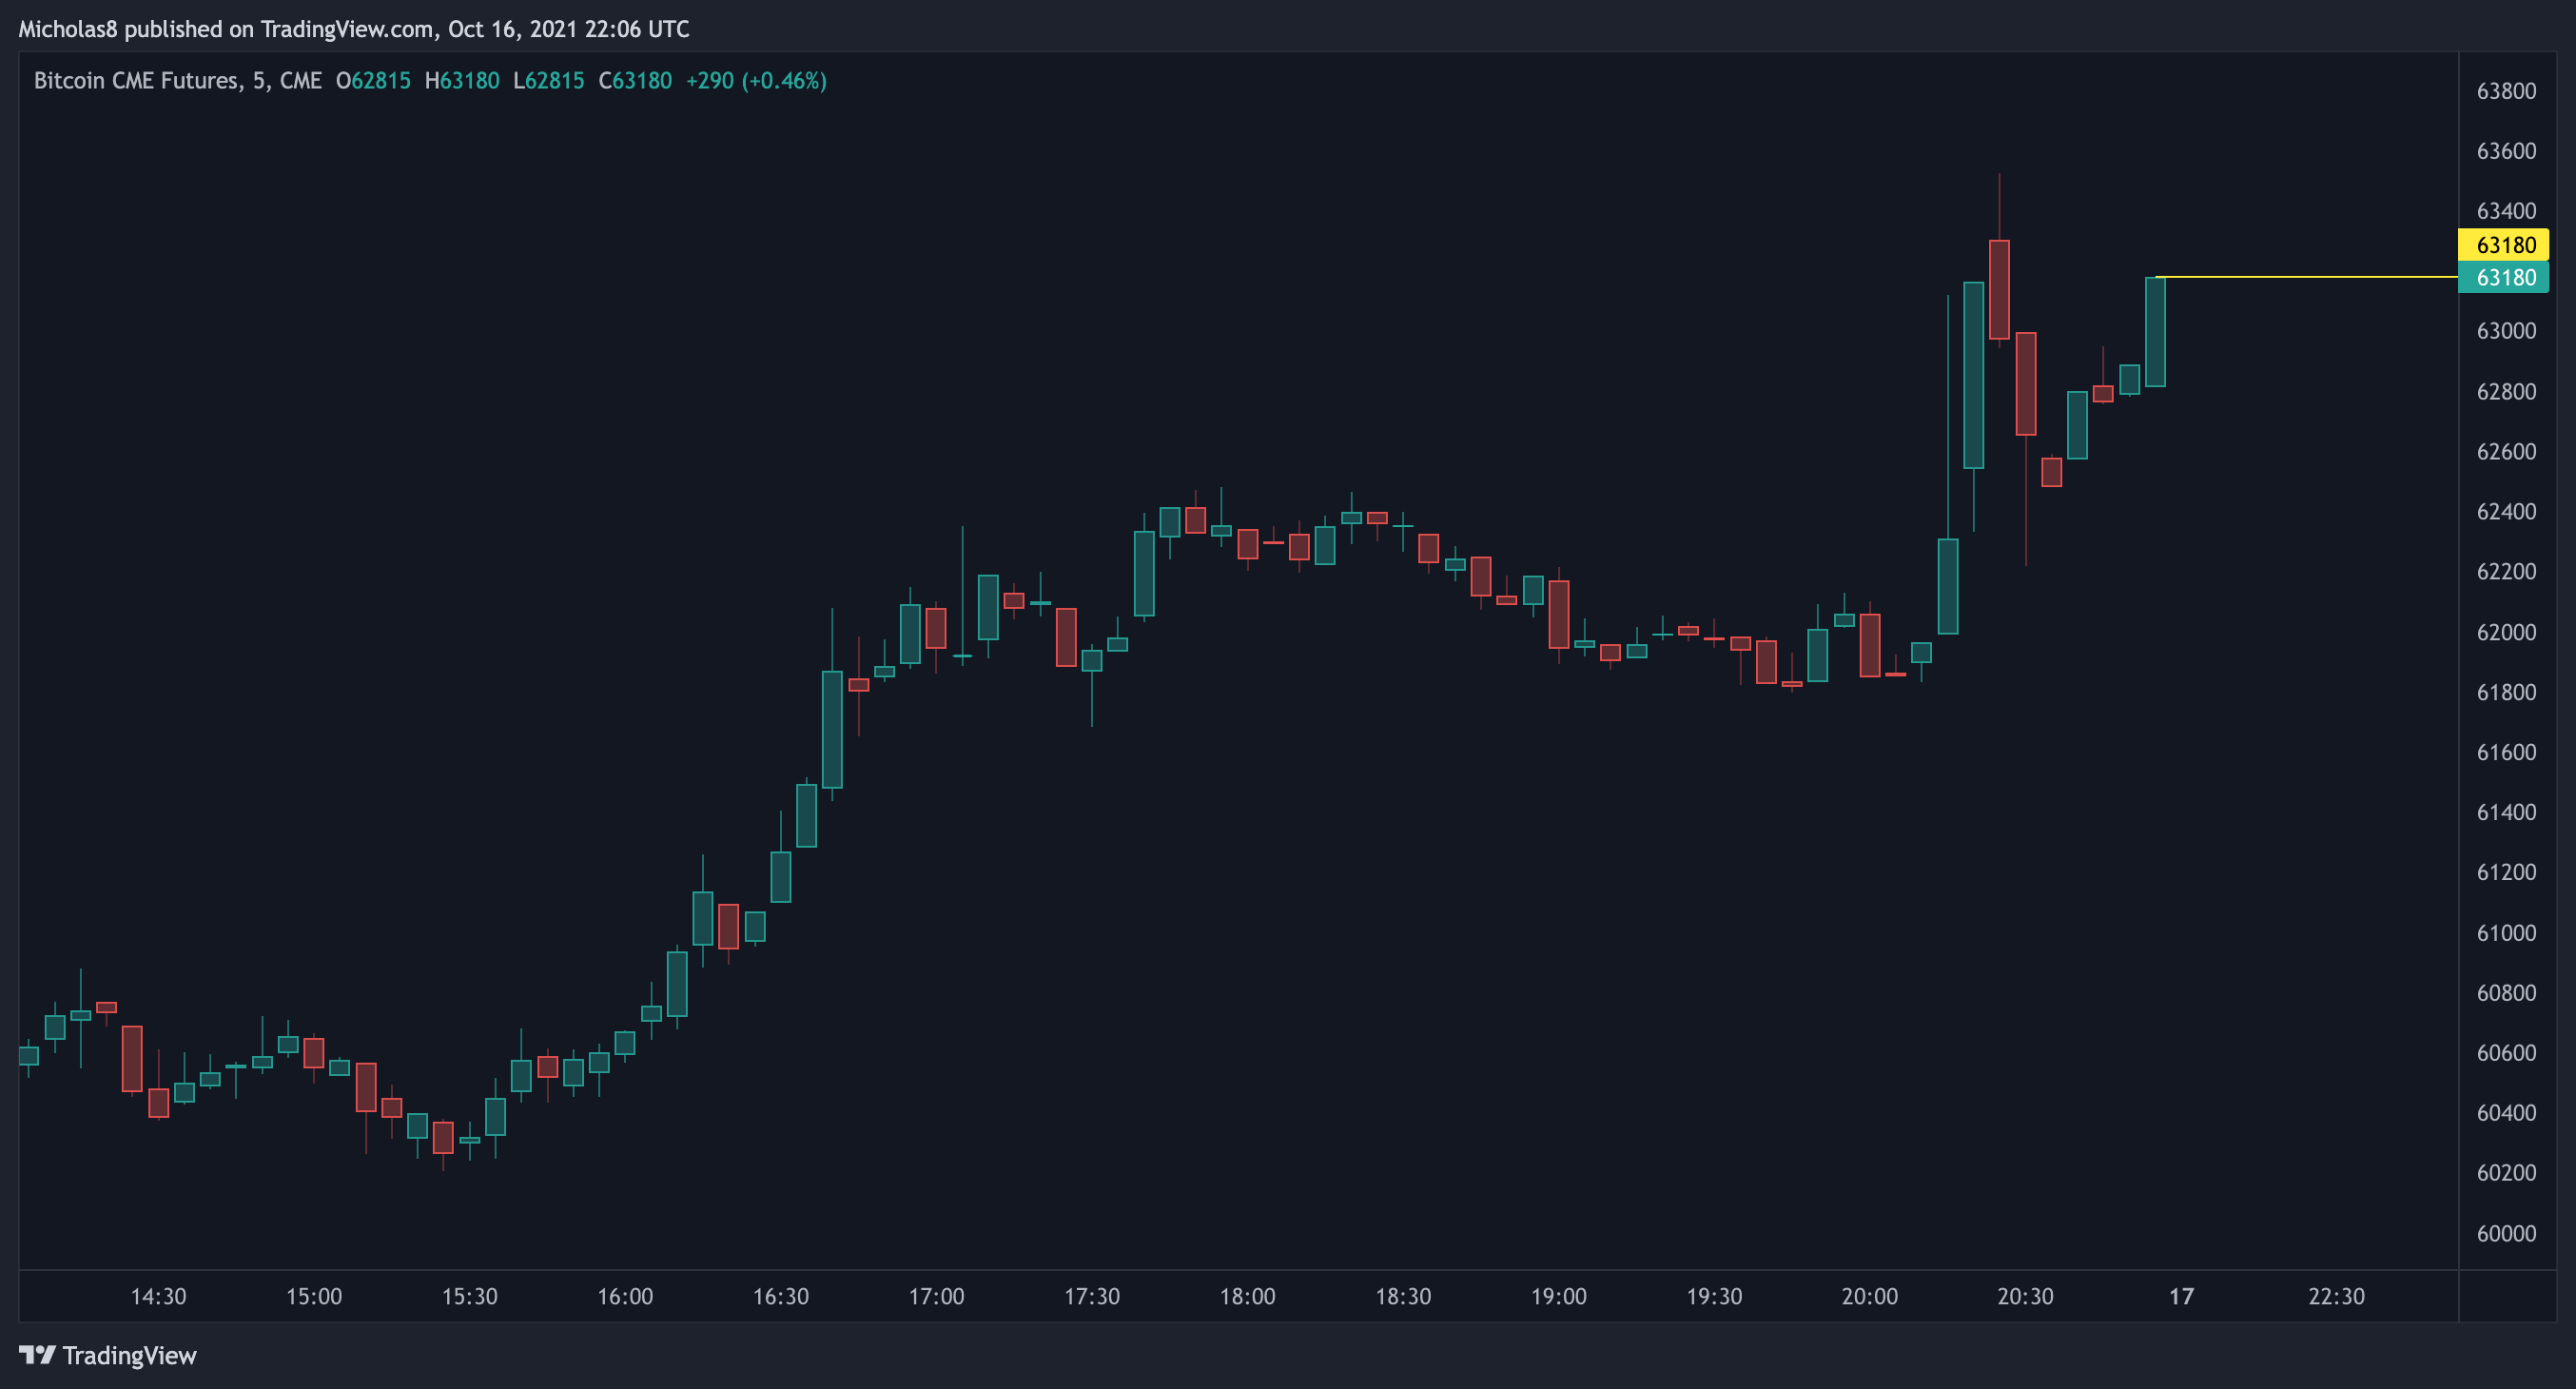
NEW: The CME closed at 63180 this evening.
.
.
.
Key Levels
Daily Timeframe
49440
50000
51295
51755
52120
52665
53950
54340
55315
55995
56670
57470
58865
61190
63575
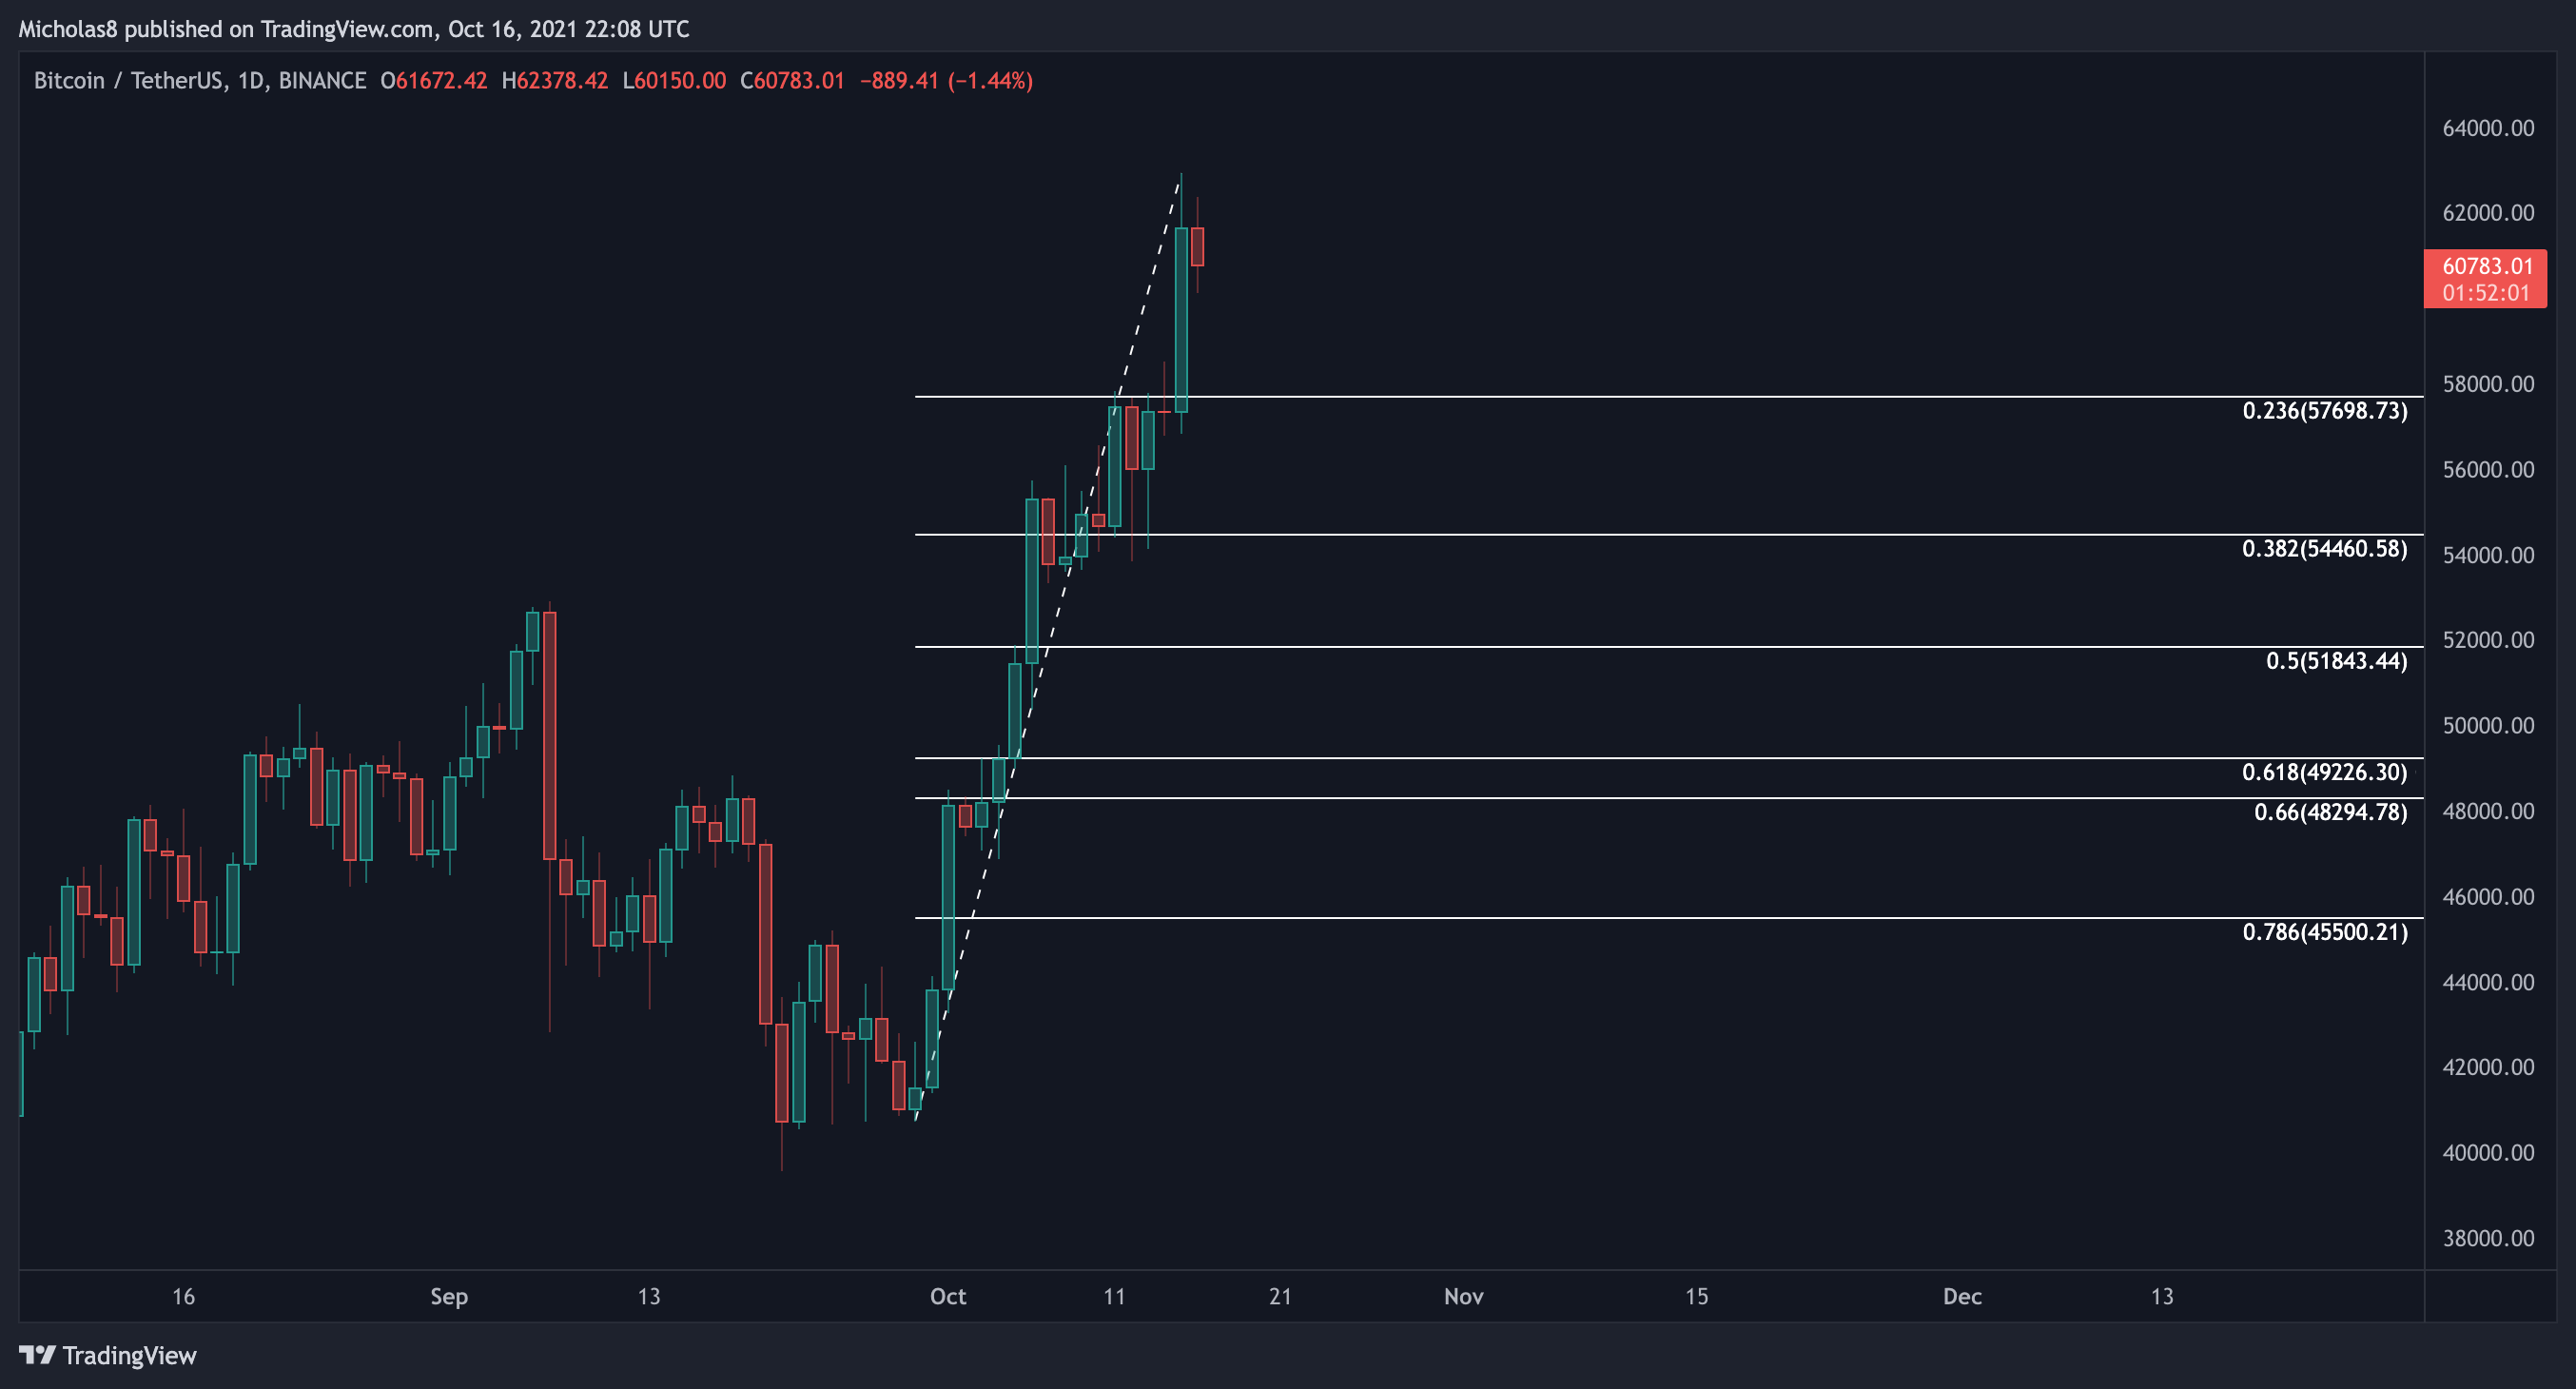
Fibonacci Levels
4-hour Timeframe
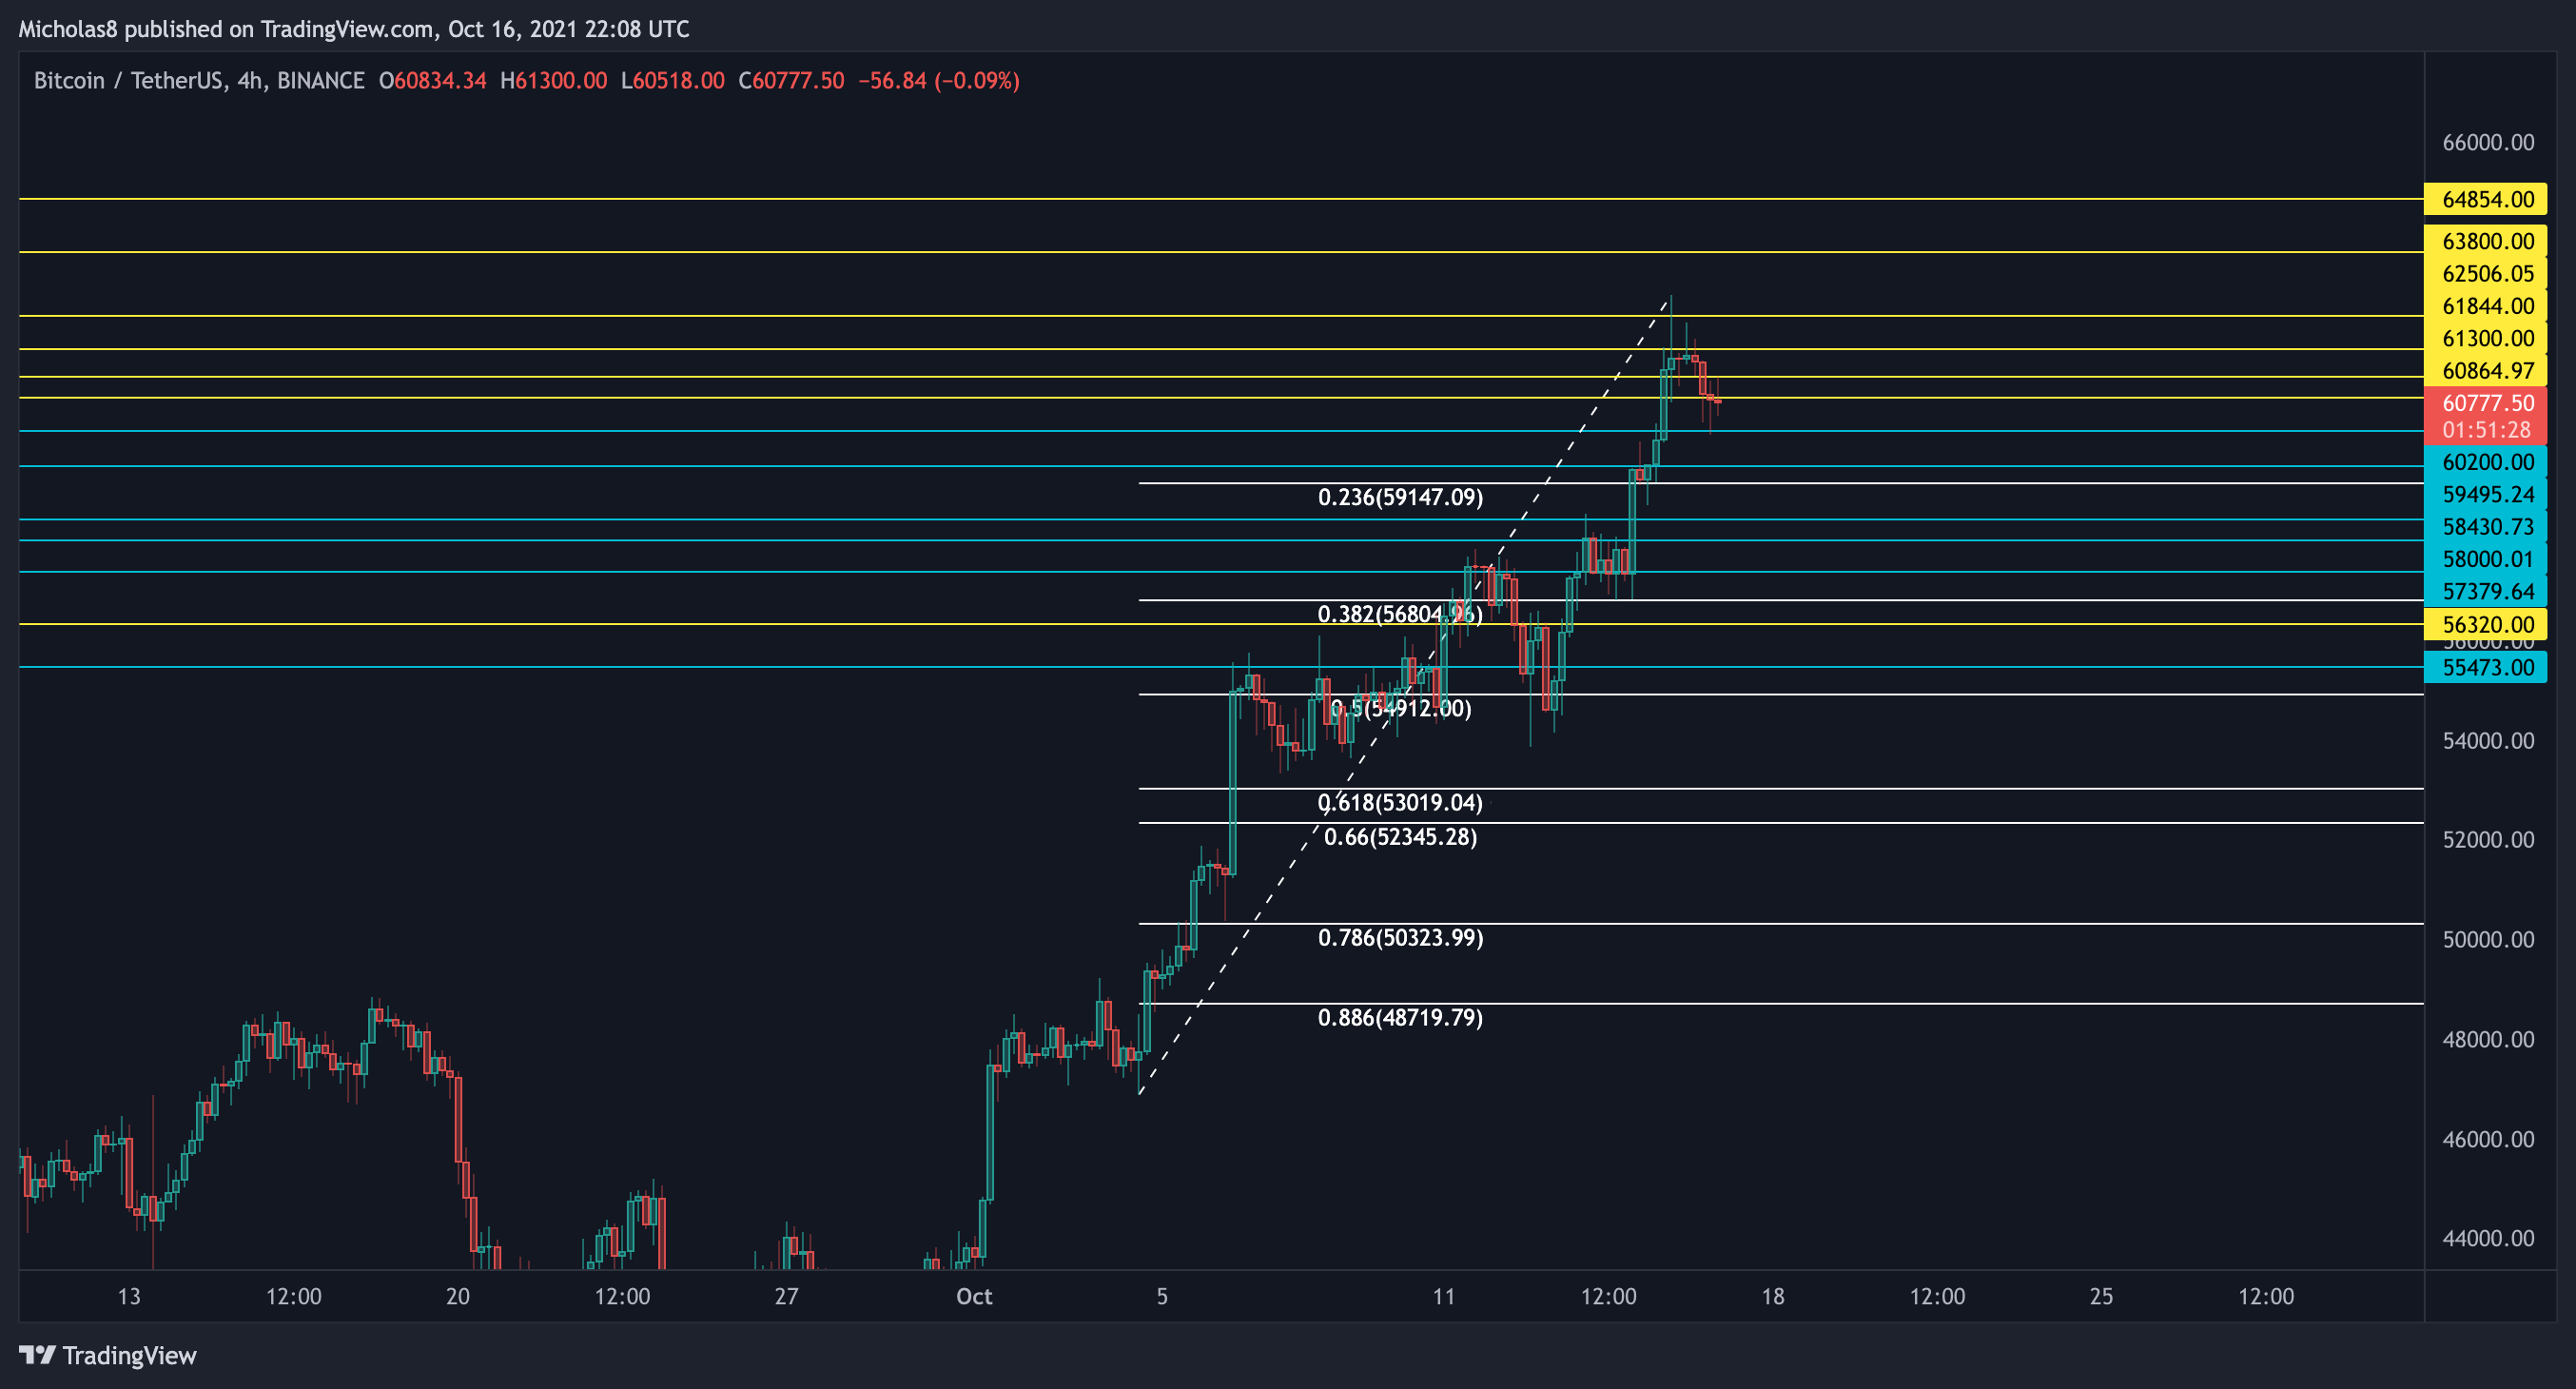
55473
56320
57380
58000
58430
59500
60000
60865
61300
81845
62505
63800
64855
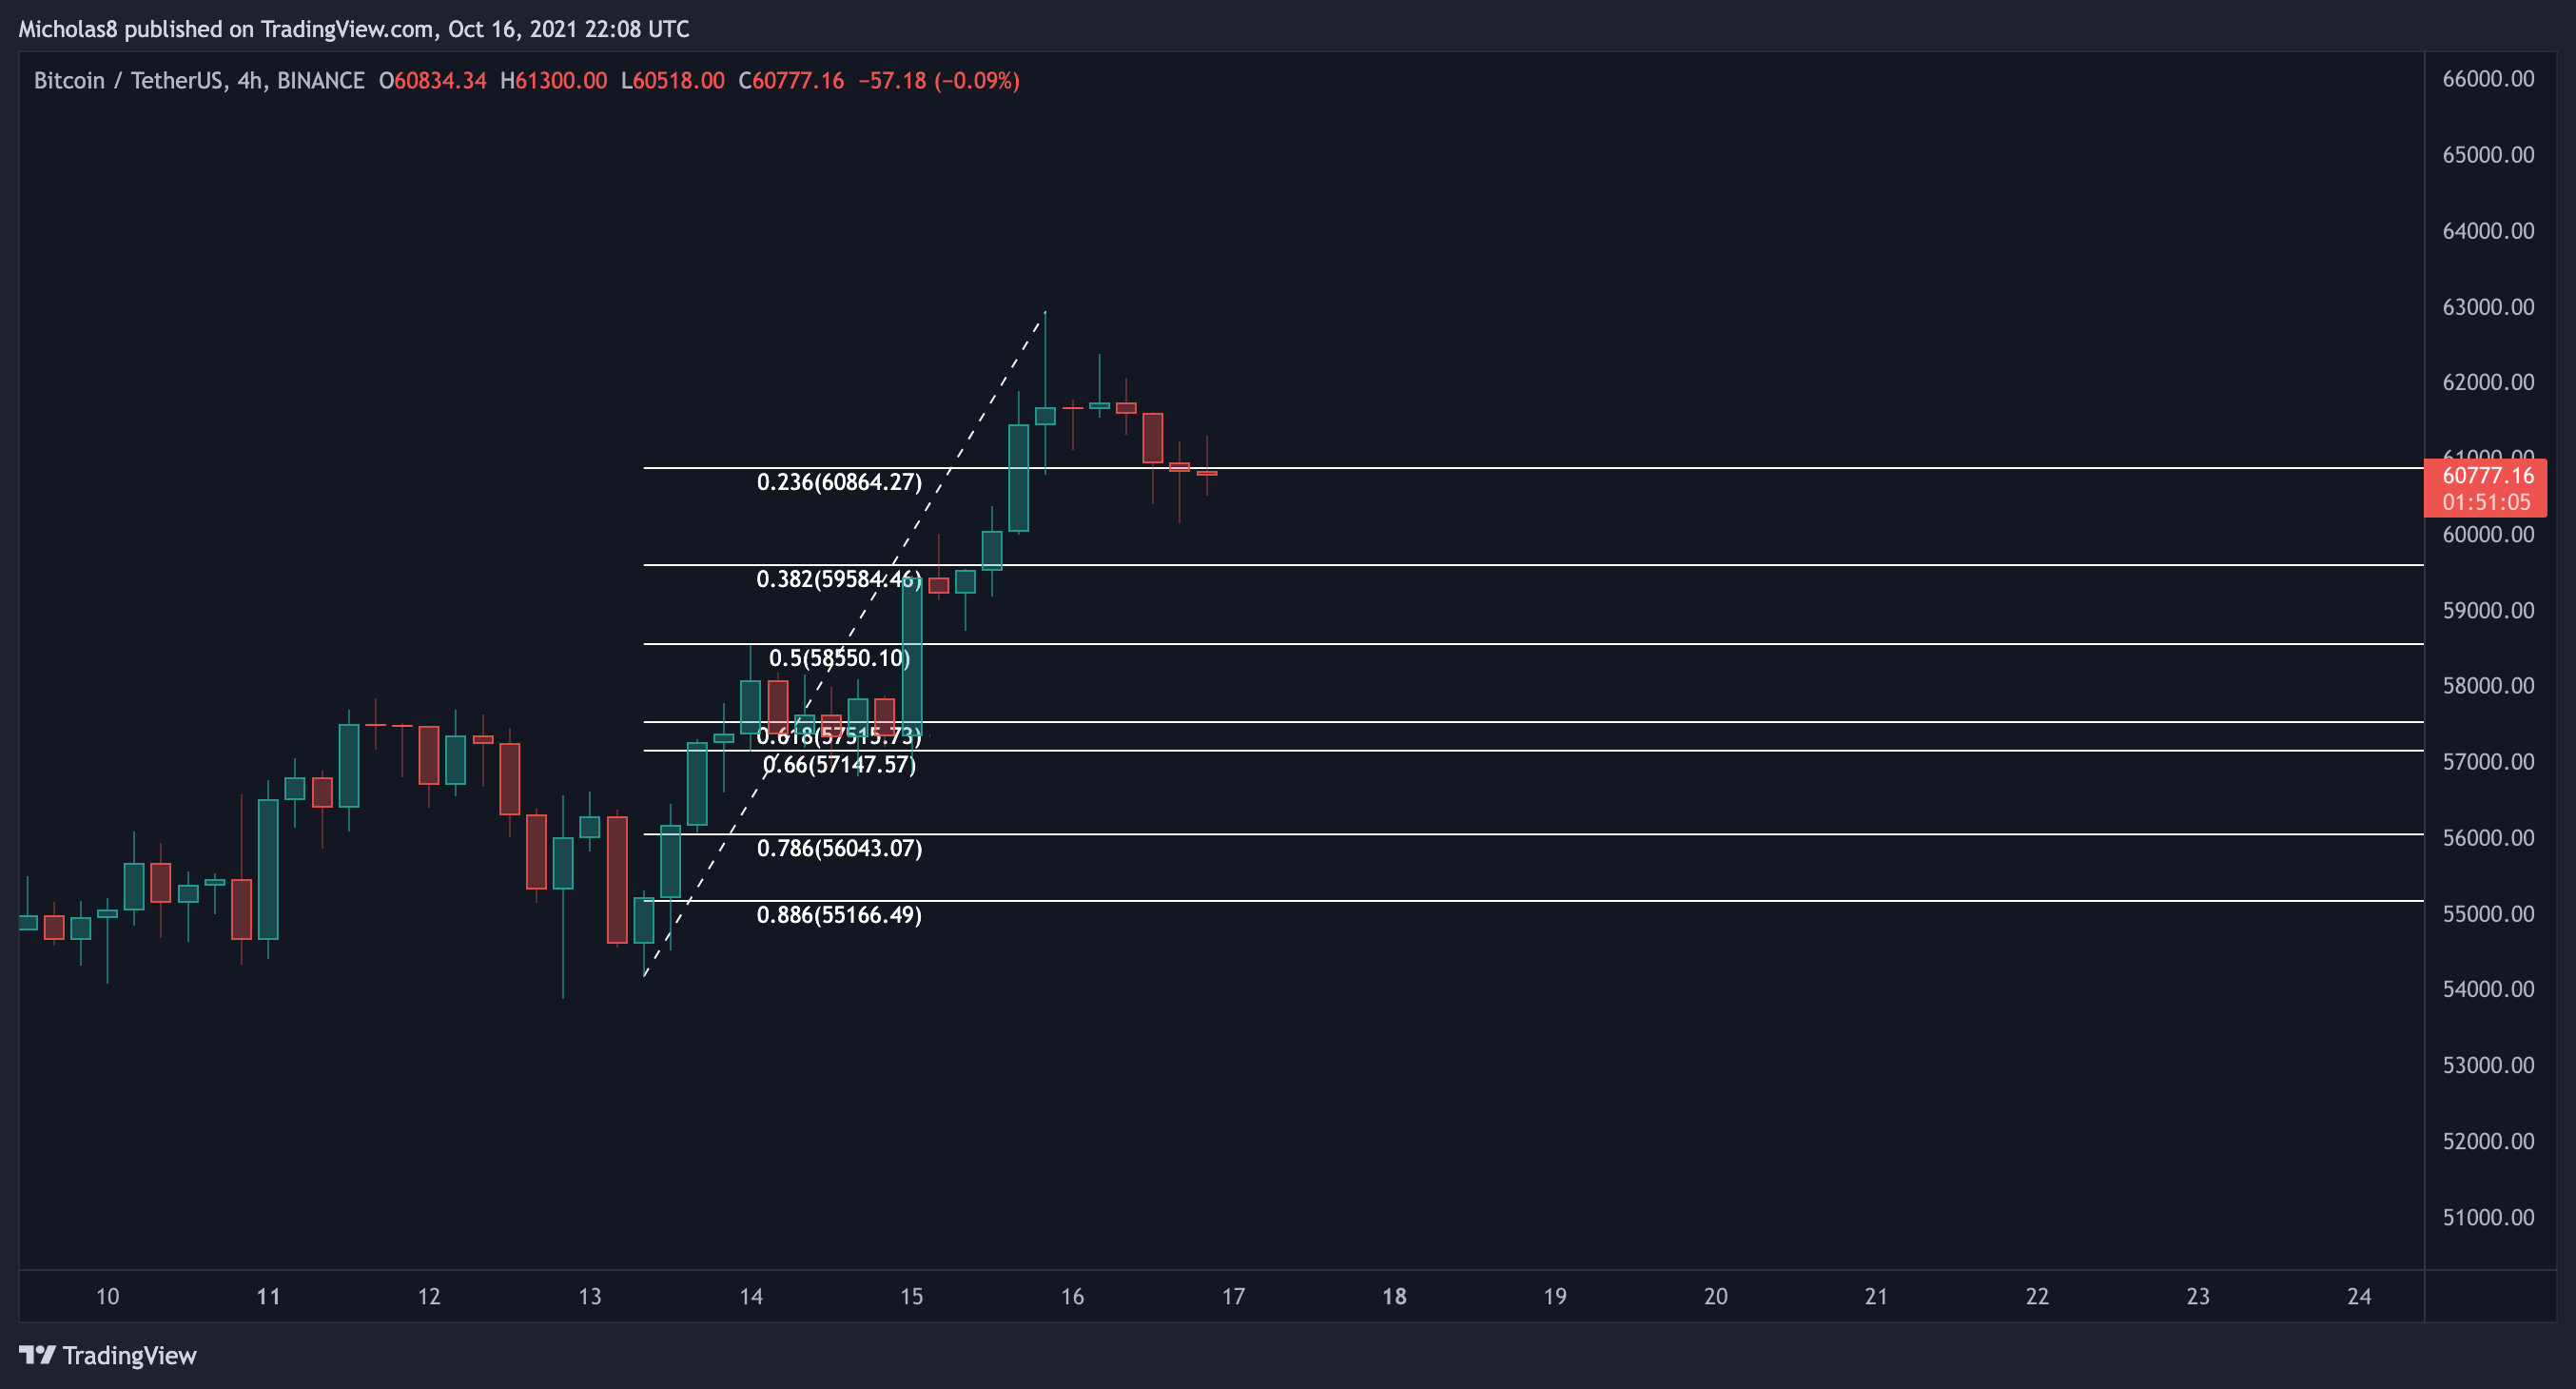
Fibonacci levels
1-hour Timeframe
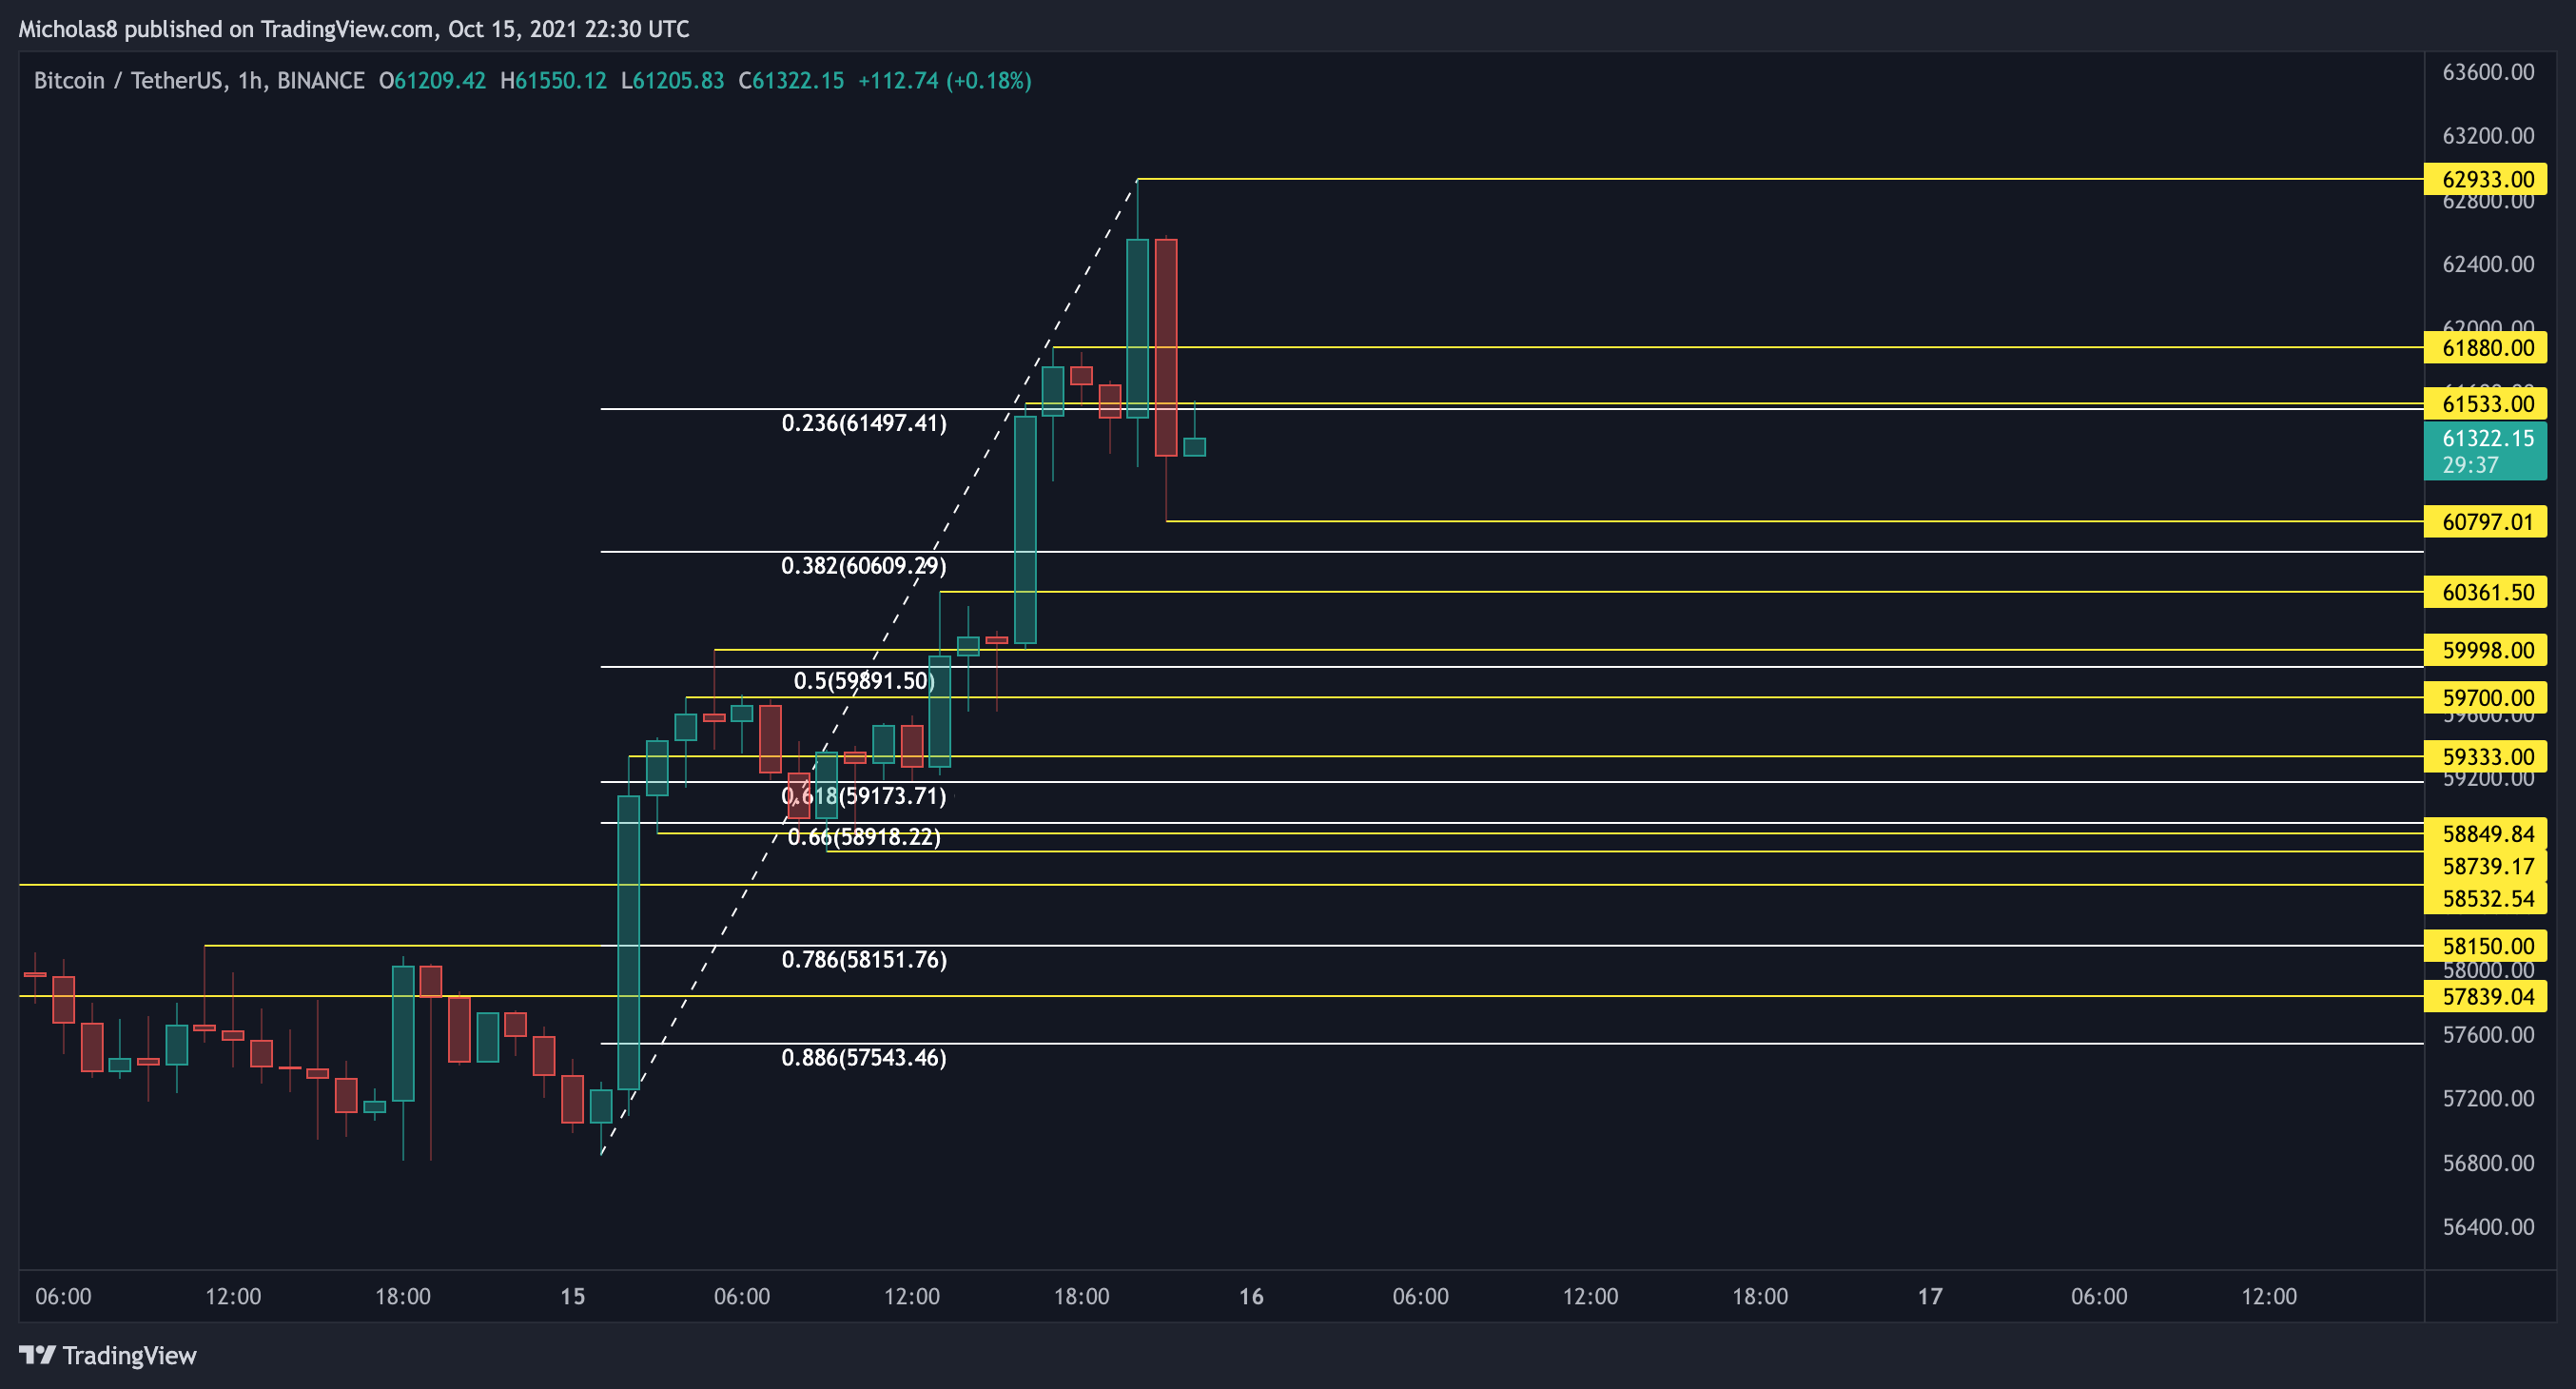
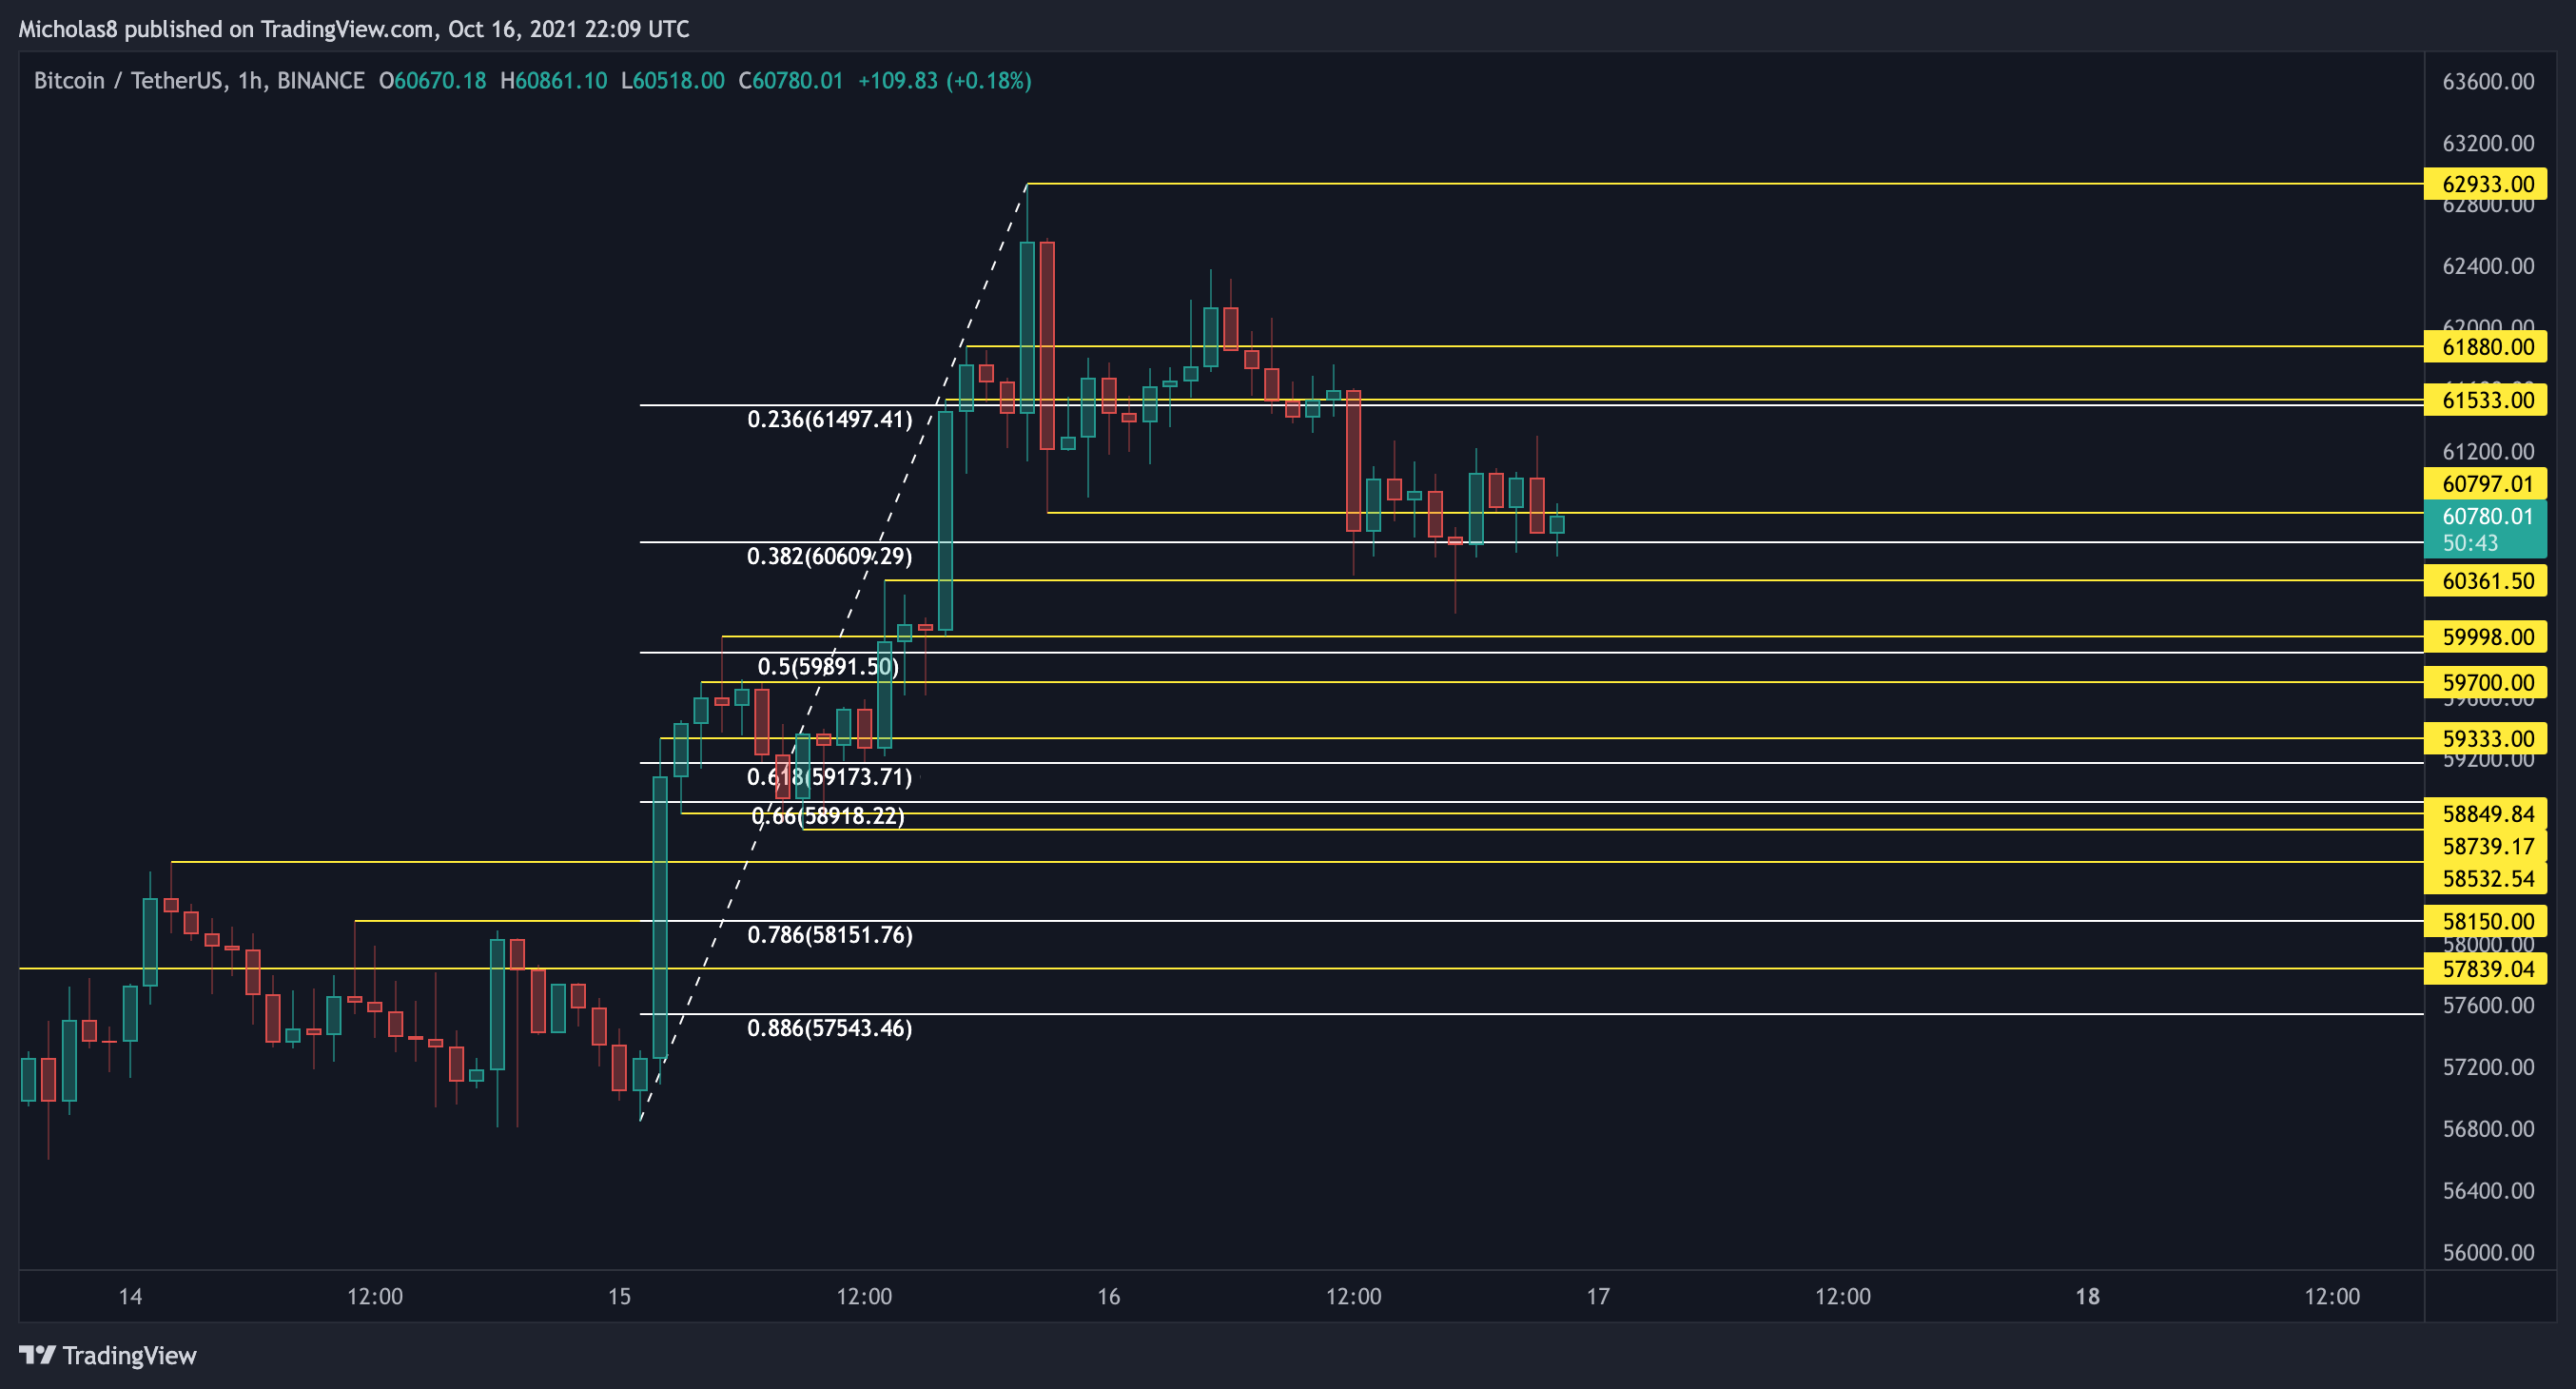
57840
58150
58530
58740
58850
59333
59700
60000
60360
60800
61500
61880
62930
Fibonacci levels
.
.
.
FINAL THOUGHTS
TONIGHT
The Good
Trading above ALL Daily LQZ
Trading above the 4H/1D EMA ribbons
Trading above ALL 4H SMAs
Trading above ALL 1D EMAs
Trading above ALL 1D SMAs
Bullish DMI
Bullish NVT
Trading above both 4H LQZ 1 and 2
Golden Crosses
Risen above the Logarithmic Curve Median Line
New Falling Wedge
CME Gap above us
_
The Bad
Potential for 4H/1D bearish divergence
Bullish exhaustion?
_
Bitcoin has seen a small pullback, which is normal after such volatile moves.
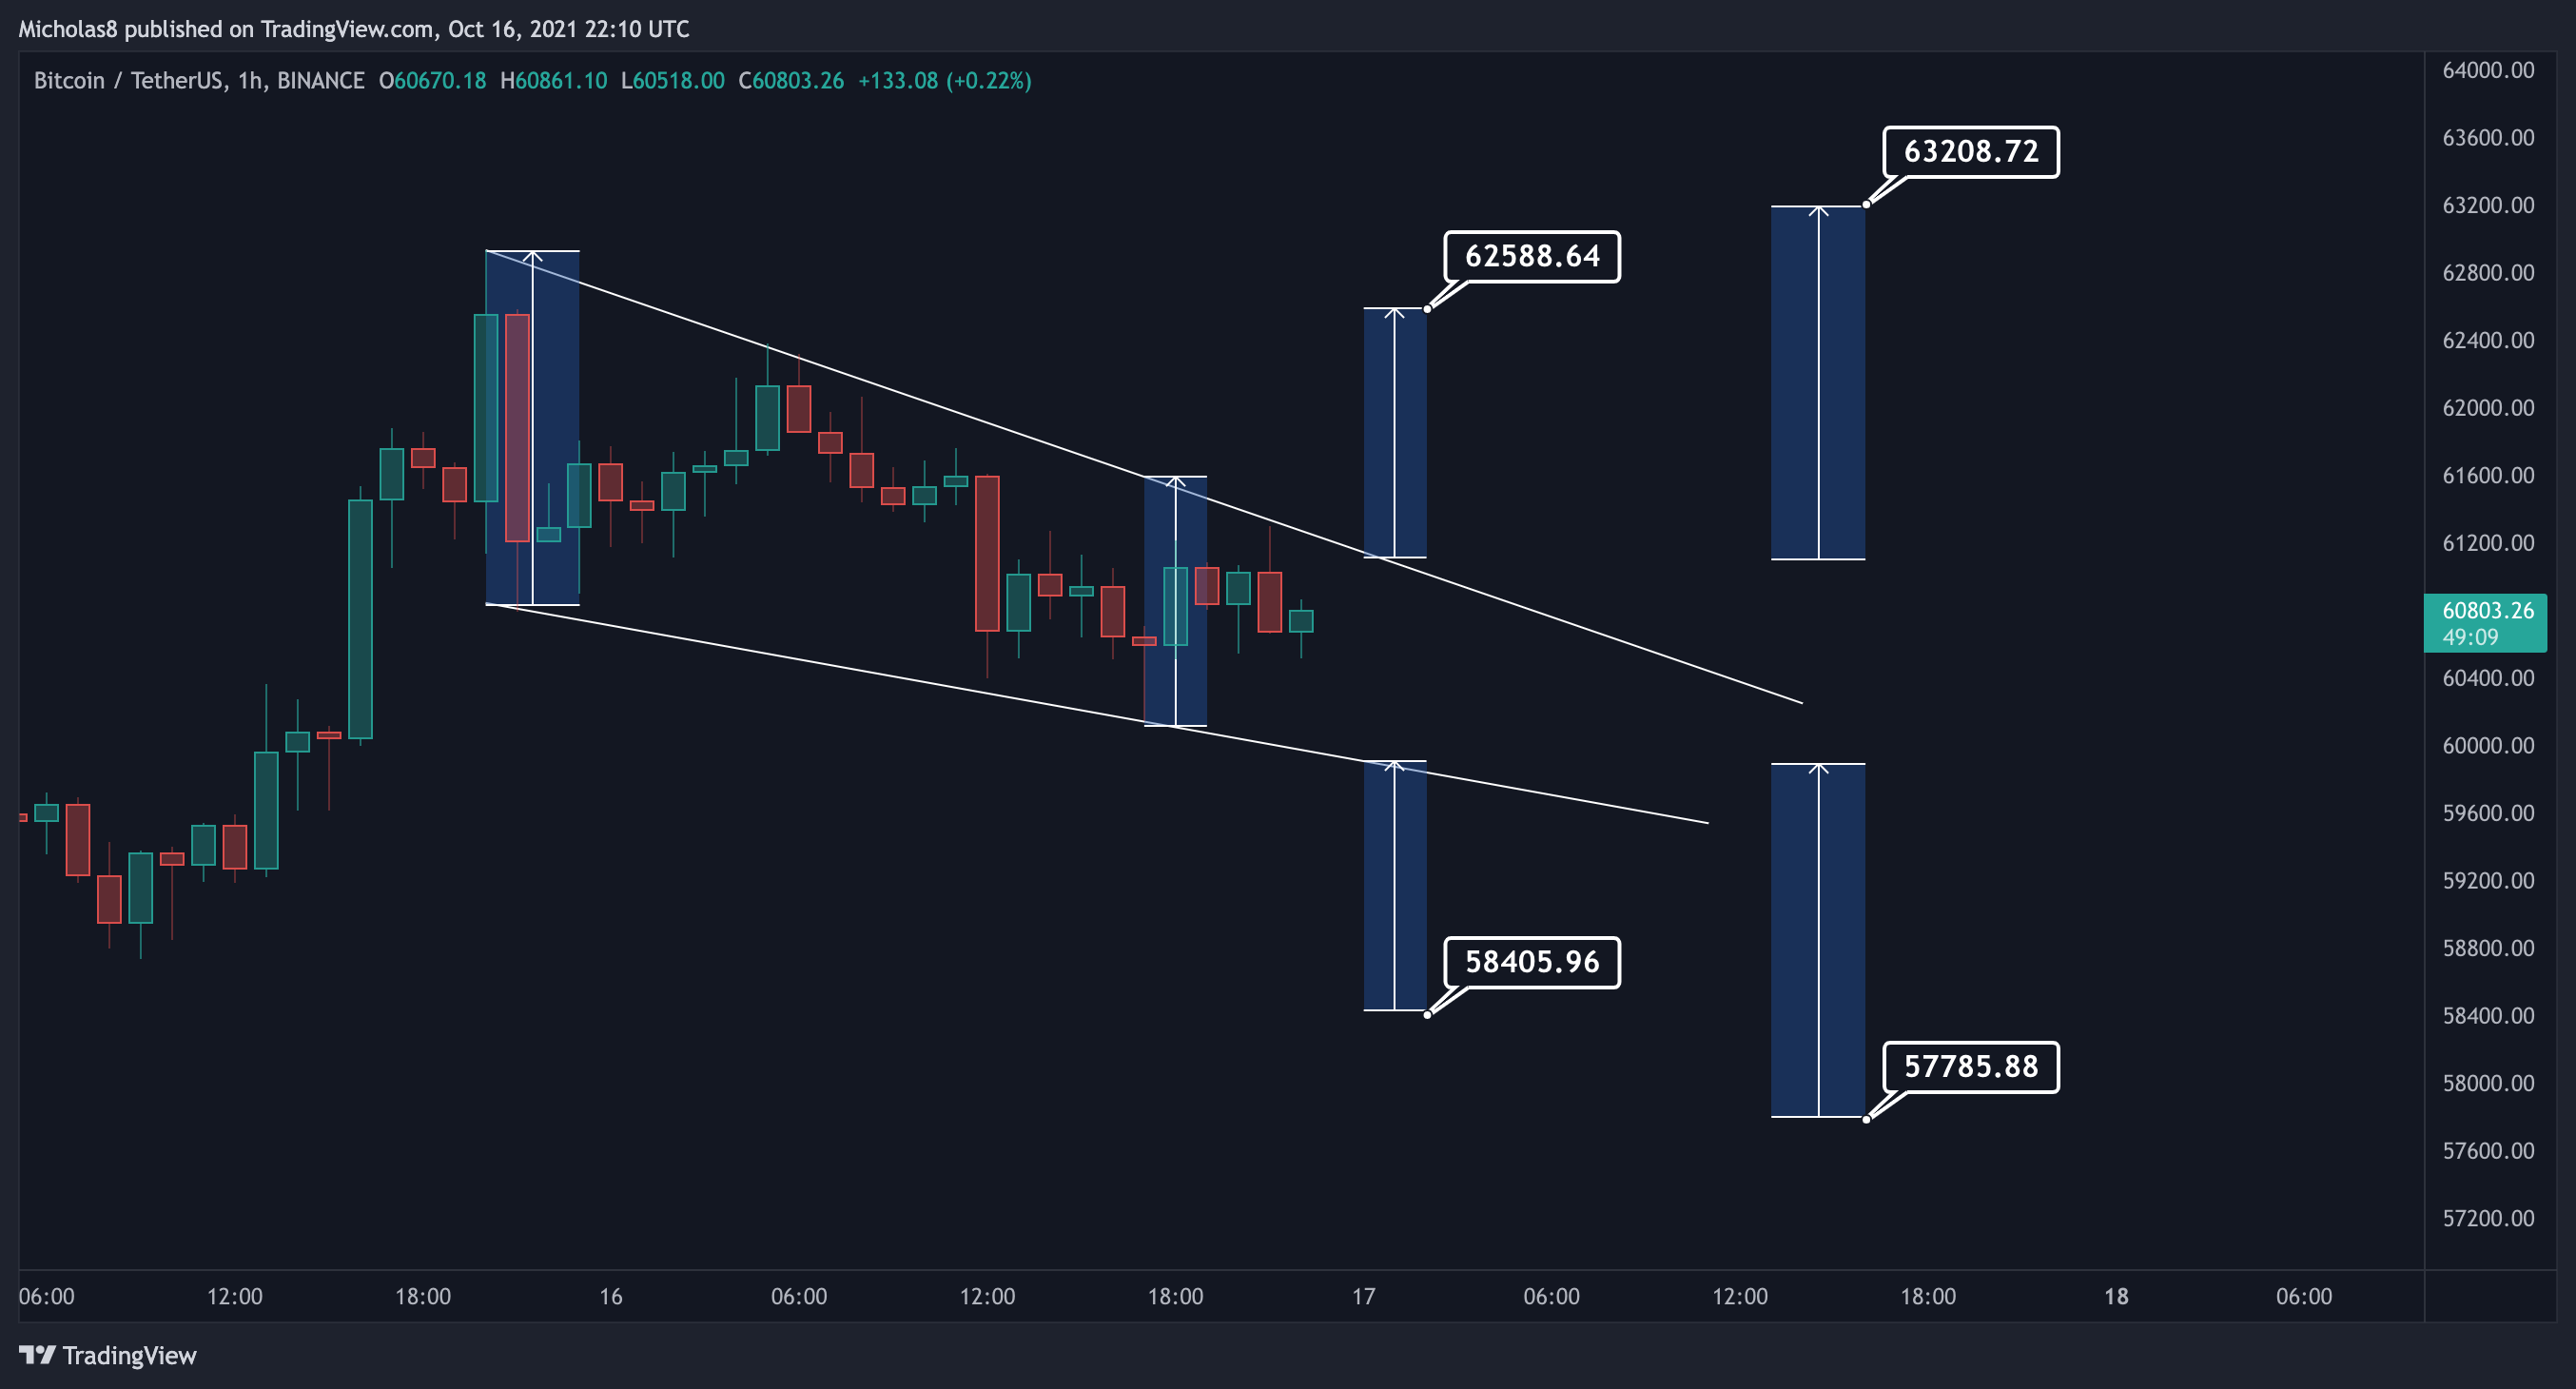
We are now trading inside of this Falling Wedge. These patterns come with a bullish bias, but as always, there's still the possibility of a break to the downside. I've included both sets of targets.
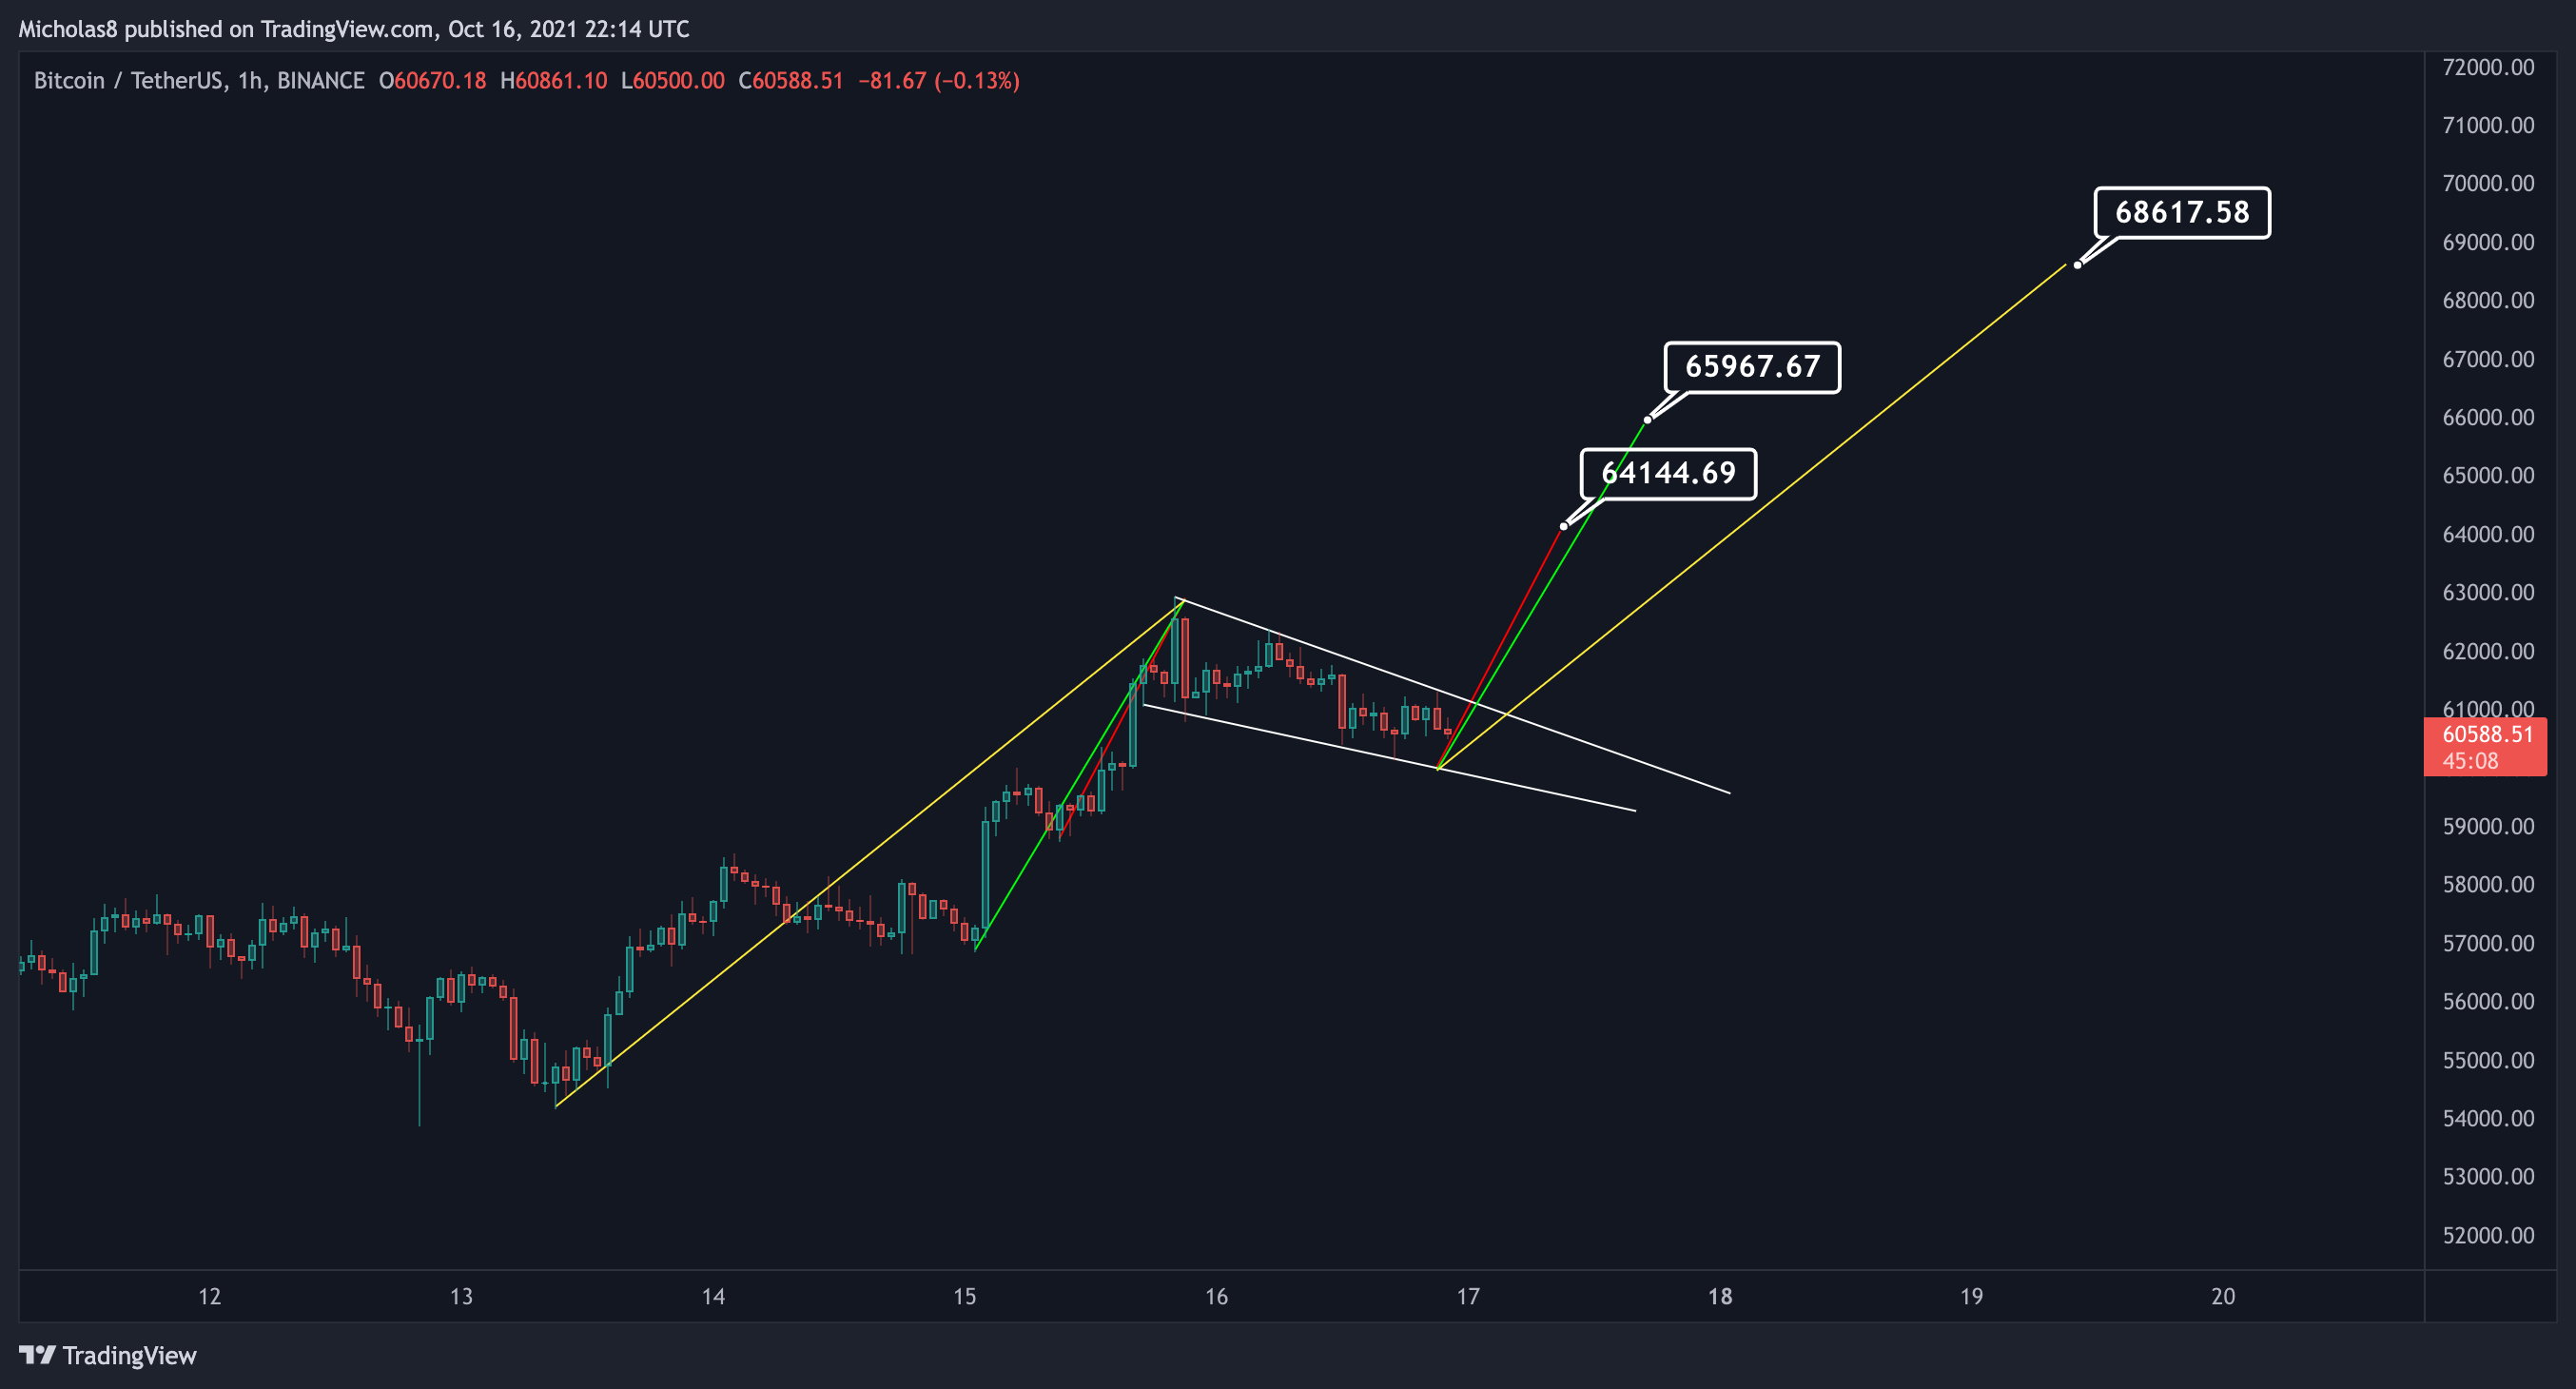
If we continue past the Falling Wedge targets, we can look to the targets of this Bull Flag.
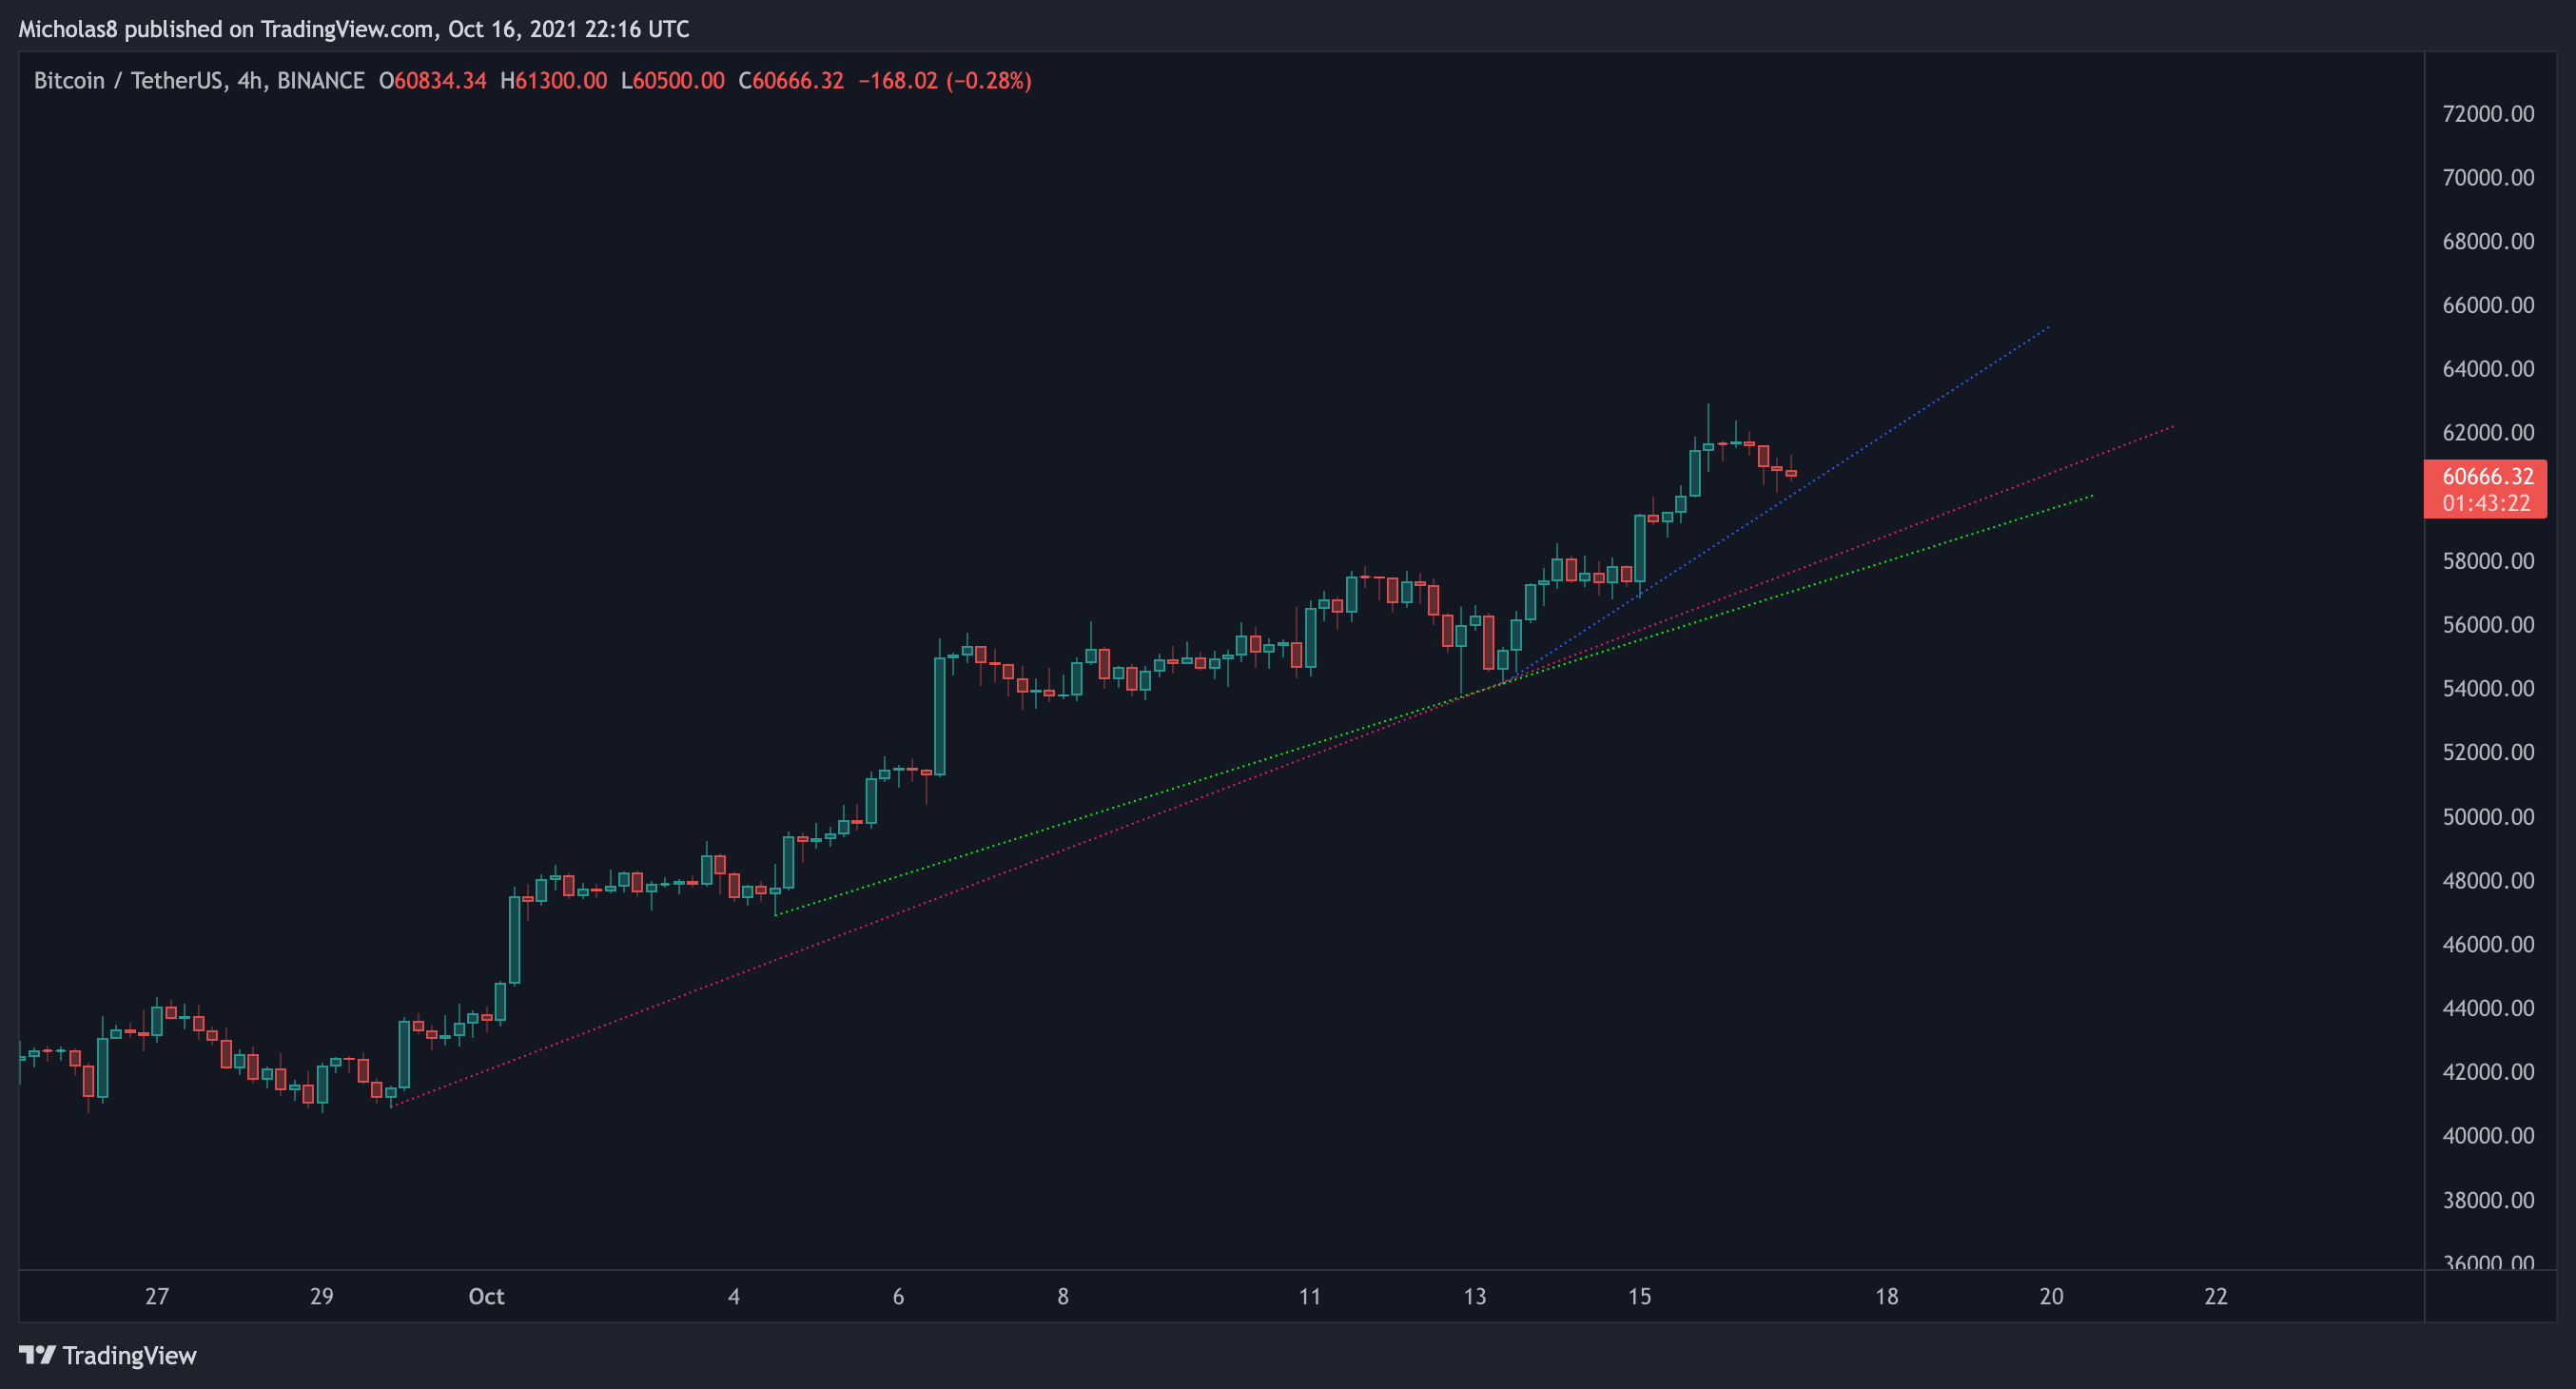
These are the current upsloping support trendlines in play for Bitcoin. If we do see a move down from here, we may find support from any of these trendlines.
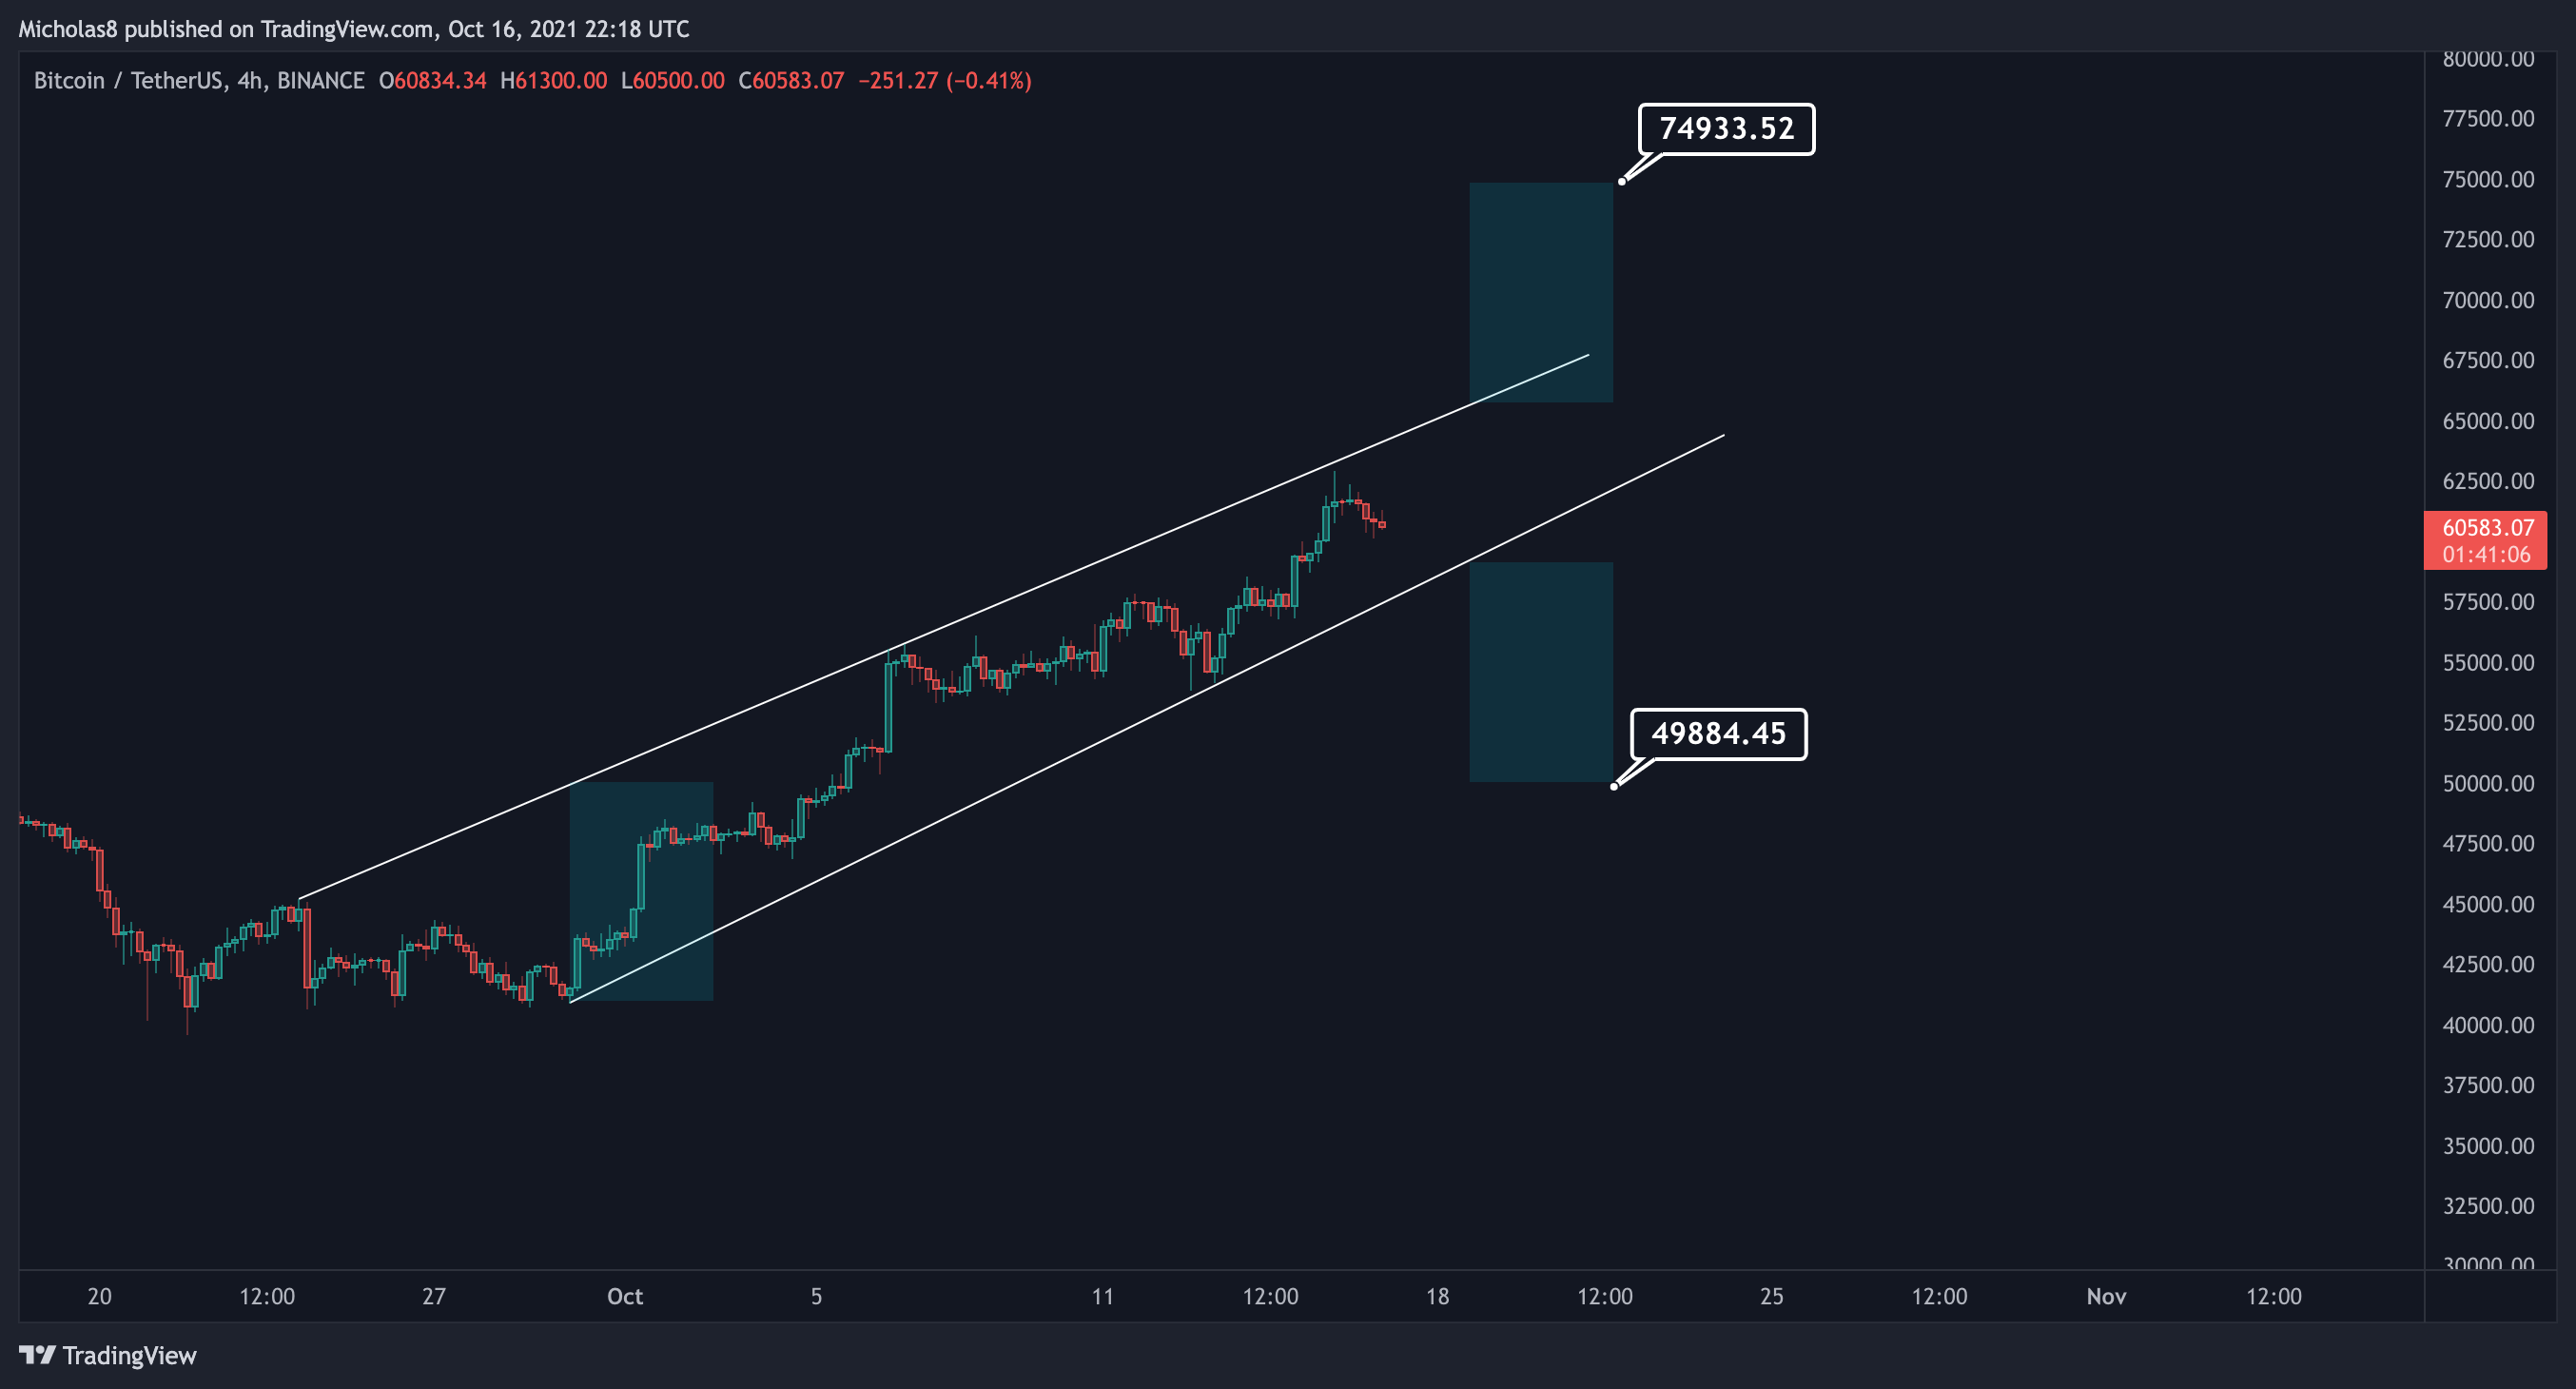
We can also consider this PA in a Rising Channel. These patterns come with a bearish bias. I've included both sets of targets.
All in all, on many fronts, Bitcoin is looking very bullish. But, with the bearish divergences, bullish exhaustion, and a possible "buy the rumours, sell the news event, I remain somewhat cautious.
Thank you all for your continued support. I hope you all have an amazing weekend!
Take it easy, and take care.
Cheers!
Premium Information
To learn more about the different Premium Memberships, please visit: https://www.buymeacoffee.com/MICKrypto
Trading Bonuses
Phemex – $1000 BONUS
https://phemex.com/register?group=1268&referralCode=G2CCQ2
Bybit – $600 BONUS