Thank you for your interest!
If you're in a hurry you can make your request for access by clicking HERE.
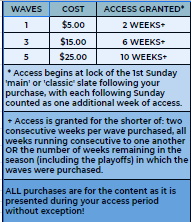
It is strongly suggested that you BUY A WAVE HERE beforehand to insure prompt servicing of your request and remember, continued support ensures continued access. Current Pricing:
Please note, though I do add people for free, I don't keep them around for free.
LET'S HIT IT!
If you haven't previously used my sheets or have not used my NFL sheet, you may be wondering what you can expect when you show your support and request access. Let's take a look!
For starters, all OCEAN DFS sheets are (for the most part) driven by my proprietary value metric, CREAM. If you're from the Slums of Shaolin you probably already know CREAM stands for, it's an acronym for Cash Rules Everything Around Me and if you know that, then you also know that 'CREAM GETS THE MONEY'
Quickly, CREAM is a non-linear, dynamic value metric that allows us to compare value in an apples to apples way, across different positions and price points in a way that traditional linear, static value metrics such as Fantasy Points per Dollar (FP/D or FP/$) or Points per $1000 (PPK) simply cannot. In short, these outdated metrics give too much credit to the "value" of lower priced options, while not properly 'valuing' the raw points from higher priced options. Similarly, projections do the exact opposite. For these reasons, dynamic value metrics such as CREAM which expects a different 'multiplier' from each price point. What separates CREAM from other similar metrics (of which there are very few) is that it's uniquely calibrated to the characteristics of each position, within each sport based on historical contest data and then uniquely 'tuned' to each slate.
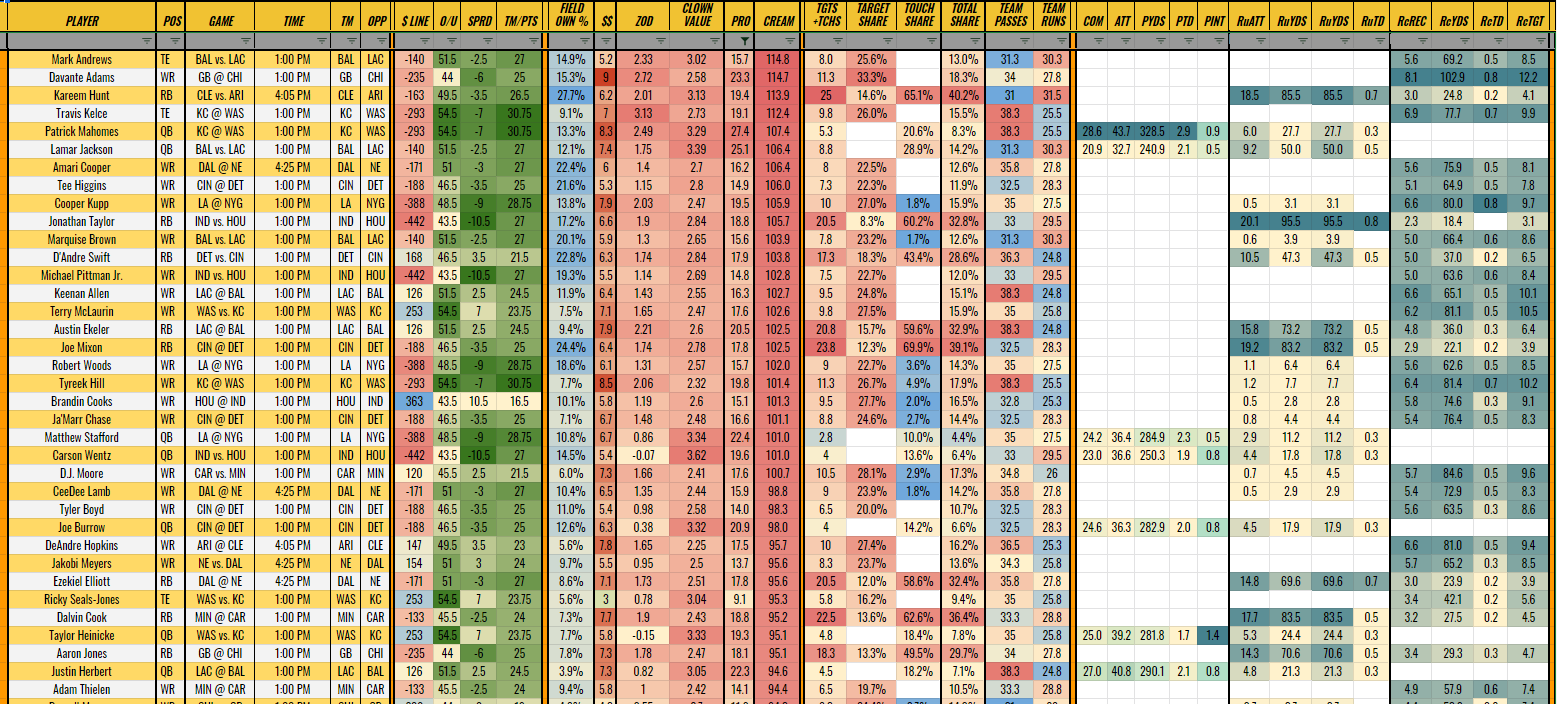
FD CHEAT and DK CHEAT:
My personal favorite and 'go to' sheet when I play as it tells me nearly everything I need to know (Ownership, Cost, Projection, CREAM, etc.) and allows me to build competitive lineups quickly without sacrificing much of anything. I love this sheet for it's versatility and simplicity, I can start my builds here, I can find my last guy here, I can see how each position shakes out and compares to one another, I can get a good idea of top stacks, etc. I will build off the top of each position, looking to maximize my lineups total CREAM rating, incorporating stacks and making ownership pivots as needed based on my contest type. Insider Tip: If you're someone who overthinks being 'contrarian', sticking to this sheet can ensure that you avoid taking some WR4 that you talked yourself into because he's min salary and you 'really like the rest of your roster'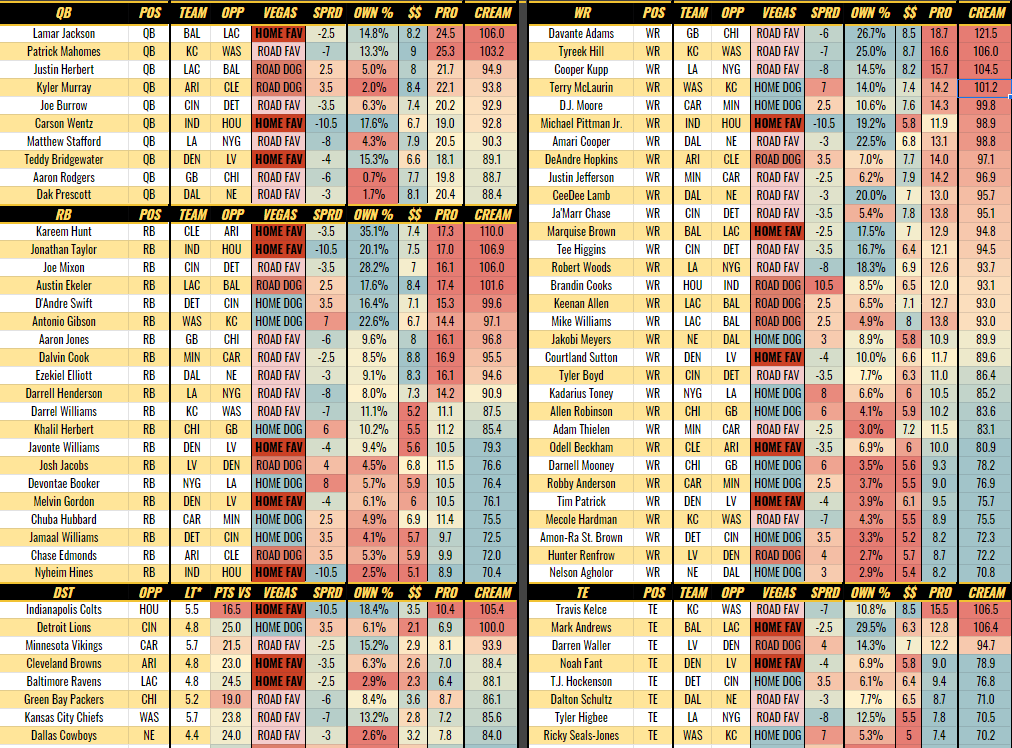
FD STACKS and DK STACKS:
As you'll see, stacks are central to my NFL strategy because stacks are a proven component of winning NFL strategies across tens of 1000s of slates. As such, I want to see them ranked by type and within each type, ranked by key factors. Note: QB-WR1 is by far the best stack option. At this point, I feel that most DFS players know this but I also know that they play them based on 'feel' and popular assumptions and in doing that, they sometimes miss obvious value or are overweight (or under) on some stacks based on a stacks historic on in-week 'reputation'. These 'faux pas' aren't something that I attempt to be aware of when building, but they're always obvious once lock hits. I play the numbers because the fact of the matter is that your feelings or my gut are flawed, inconsistent in their analysis and application of said analysis, full of varied types of various bias rooted in absurdities, full of confirmation bias, full of over confidence and/or self doubt, etc.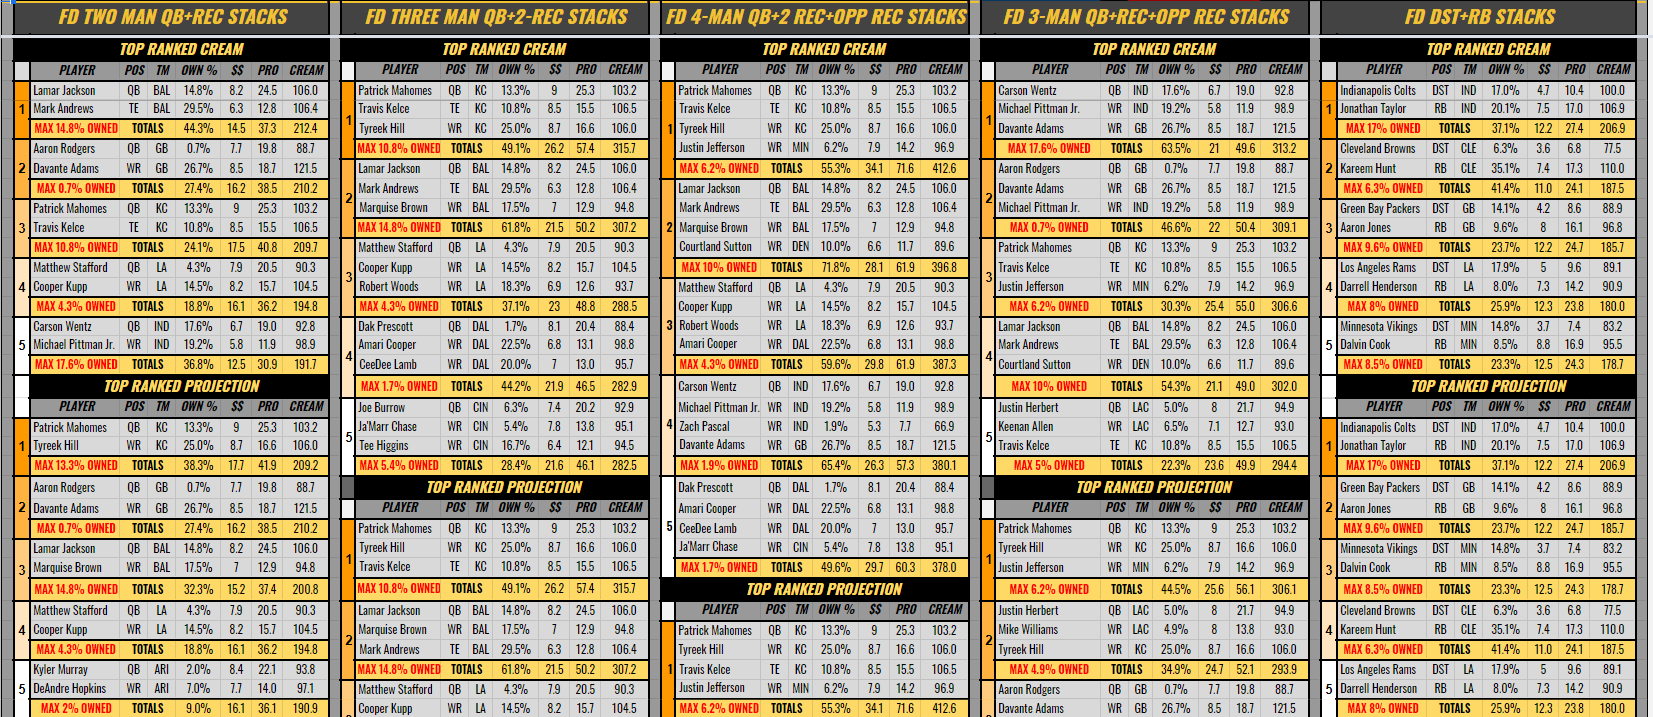
CHALK/PIVOTS for FD and DK:
This one is simple: Show me the chalk at each position, in two tiers, and then show me lower owned pivots at similar price points to each 'chalk' player. This covers two of the three factors of what I call 'P is for Pivot Point.' There are only three 'points' that you can pivot from in the NFL (and NBA):
Price, Position, and/or Production. Ideally, you should try to cover at least two of these with each pivot.
First, up is price: You play a player at a similar price at a different position. Which can lead extra pivots if you can't go tit for tat between the two positions with price+position pivot I'll soon mention.
Next is position: You play a player at the same position, different price. This one is a little more difficult to fully pull off in football due to the way rosters are constructed. One easy way is to positionally flip the chalk construction from a salary perspective, i.e. if two cheap backs with two more expensive WR, instead spend up at RB and go cheap at WR. Also viable is the price+position pivot, which would be playing a player at a similar price at the same position, this allows you to play similarly constructed rosters when it comes to some of the chalk (which you will usually need), while being different at that one or two positions.
Lastly, production: My personal favorite and also the most easy to identify. Basically, you're choosing the player(s) that are most likely to benefit in the event a chalk player does not meet their expectation but the team still performs as expected. Usually this will be a 'same position' or 'similar role' player, i.e. pass catcher to pass catcher, whose stat accumulation comes at the expense of a chalkier player because they generally accrue points from the same finite stats such as catches and yardage or ideally touchdowns, whose pivots can come from different roles, such as RB over WR. If an RB snags two TDs, that obviously limits the number of TDs that are available to that teams pass catchers and caps their upside. I like to exploit these edges when ownership among a teams skill players doesn't accurately reflect the production 'potential' of each player in the matchup. An example of this would be heavy ownership on one Vikings WR, when there is no obvious reason for that WR to have double the ownership of the other. Keeping with the Vikings, yet another example is heavy ownership on the two WR but lower ownership on Dalvin Cook in a decent matchup where he could easily get two TDs and rip off big runs because he's that talented. The Mother Pivot is when an RB with a similar price to Cook is also chalk. I will double dip on this pivot, going with Cook in lieu of the chalkier Vikings WR, but also in lieu of a similarly priced chalk Derrick Henry at RB and then on the flipside be playing a Titans WR in lieu of the chalkier Henry, but also in lieu of the chalk Vikings WRs.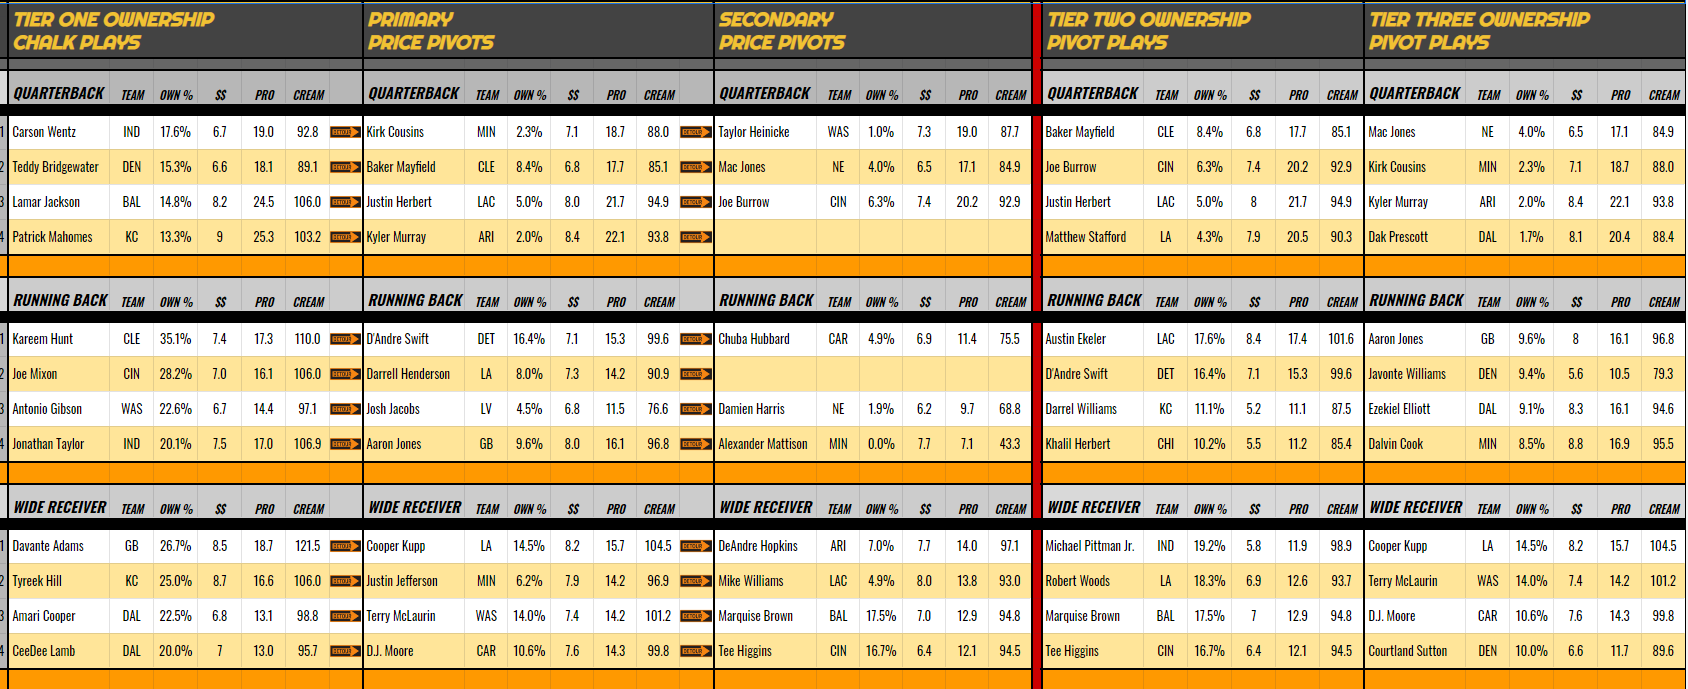
GAME THEORY for FD and DK:
Without getting into what game theory is and how is best executed when playing DFS, this page is based on another metric I created called NASH, named for famed mathematician and game theorist, John Nash. Basically, this page highlights players whose projected ownership does not correlate with their projected, position relative output. It's not necessarily limited to lower owned plays, as it's absolutely possible that even a chalky player can have ownership that's approximately half of what it should be, but most featured here are lower owned.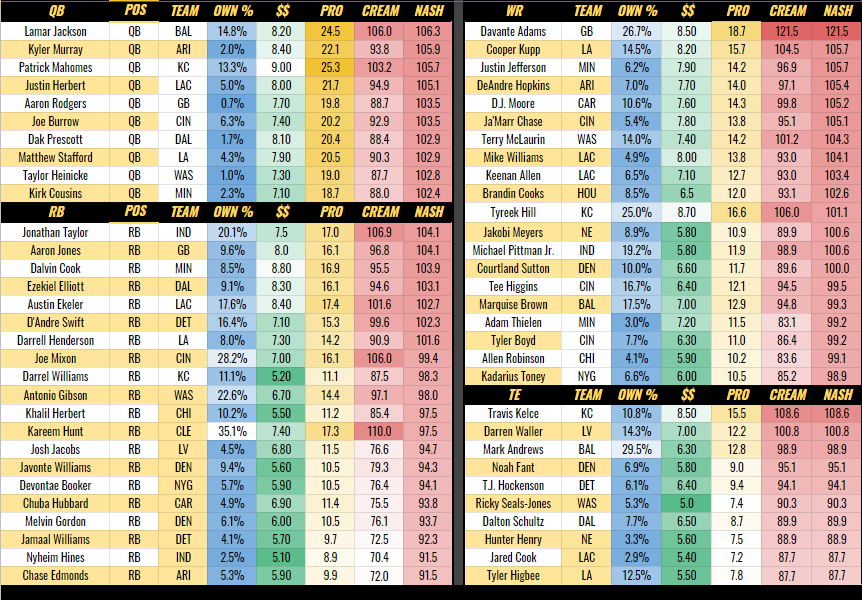
NO QB STACKS for FD and DK:
For similar reasons as the previously mentioned 'stacks' pages, but because you can only play one QB, we have 'no QB stacks.' I enjoy using these to compliment my QB stacks for a measure of safety that you can't get from one off plays. Projections are more accurate in larger groups and this is true among any projection source. The total team projection is more accurate than the passing game or rushing game projection, and both of those are more accurate than the individual player projections that make up those groups, and then similarly, small groups of players are more accurate than individual players, especially when those groups are where you expect a good amount of production to be consolidated. For example, though I (and more often the field) may completely wrong about who among Lockett and Metcalf will get 10 catches, 90 yards and one or two TDs and which one will get 5 catches, 60 yards and be lucky to get a RZ target, much less a TD, it's likely that I'm relatively accurate in my projection that between the two of them we'd get 15 catches, 150 yards and one or two TDs. This is the safety of grabbing the whole pie, rather than trying to be right about which piece will be bigger. Having said that, this does cap your upside a bit in that you are less likely to have two top tier WRs on your roster. Let's use the Vikings and Seahawks pairs as an example of the lost upside vs. safety gained by same team stacks. Ceiling Game Lockett+Ceiling Game Thielen >Good Matchup, Expectations met Seahawks WRs>Jefferson Expectations met+ Metcalf Dud.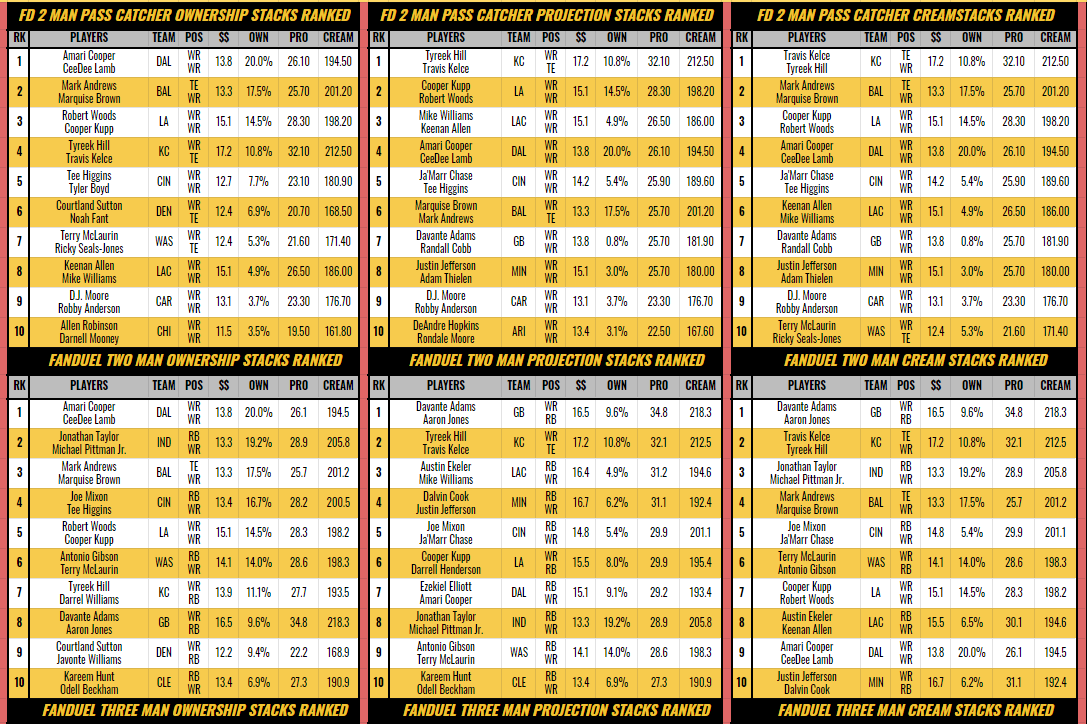
GAME STACKS for FD and DK:
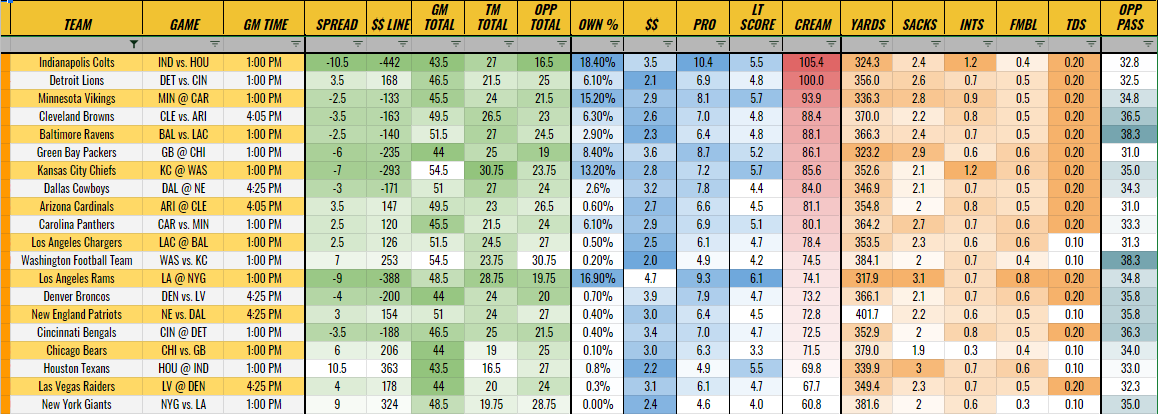
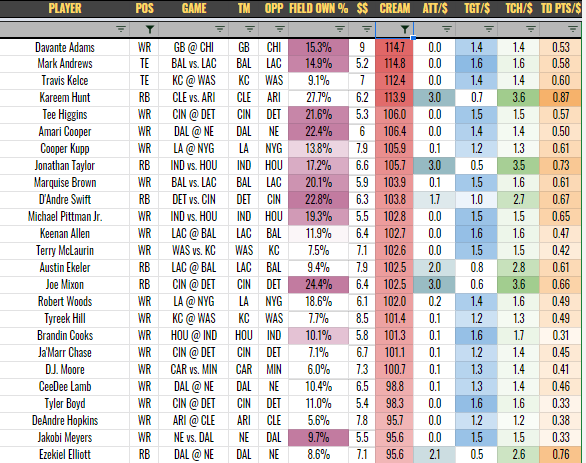
This one is for those of you that enjoy or prefer stacking full games or are who are looking for production pivots or lower owned plays in higher owned or better projected games. Again, ranked by projection, ownership and CREAM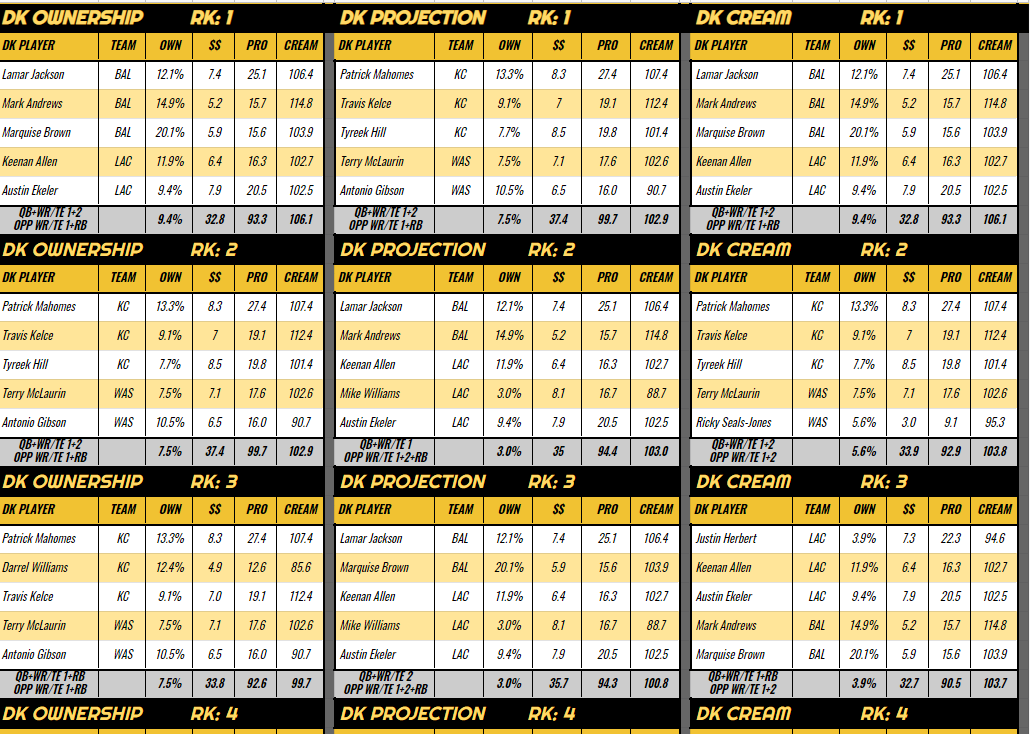 Lastly, we have more standard statistical pages for the QB and skill position players, along with similar DST pages, as well as a Touch+Targets sheet for both DK and FD which you see just below. Also of note, I will occasionally showcase some top projected lineups for FD and DK, as well as the per player exposure levels among top projected lineups.
I appreciate you taking the time to check these out and hope I have offered you some strategic insight along with a clear idea of both the content and quality you will receive with your request.
Good luck to you with whatever you play in life.