To become a Premium Member, follow the link below:
I recommend reading these reports on the Buy Me A Coffee platform for optimal formatting.
You will find the content below in this order:
1. Definitions
2. The Good
3. The Bad
4. CME Gaps
5. Key Levels
6. Final Thoughts
DEFINITIONS
Liquidity zones are high volume levels that offer support and resistance
Hidden bearish divergence: creating a lower high in price, with a higher high on the oscillators. This signals a possible trend continuation down.
Bearish divergence: higher high in price, lower high on the oscillators. This signals a possible trend reversal down.
Hidden bullish divergence: creating a higher low in price, with a lower low on the oscillators. This signals a possible trend continuation up.
Bullish divergence: creating a lower low in price, with a higher low on the oscillators. This signals a possible trend reversal up.
SR flip: turning old resistance into support, and vice-versa.
Fractal: recurring geometric pattern.
THE GOOD
Daily Timeframe
Logarithmic Curve
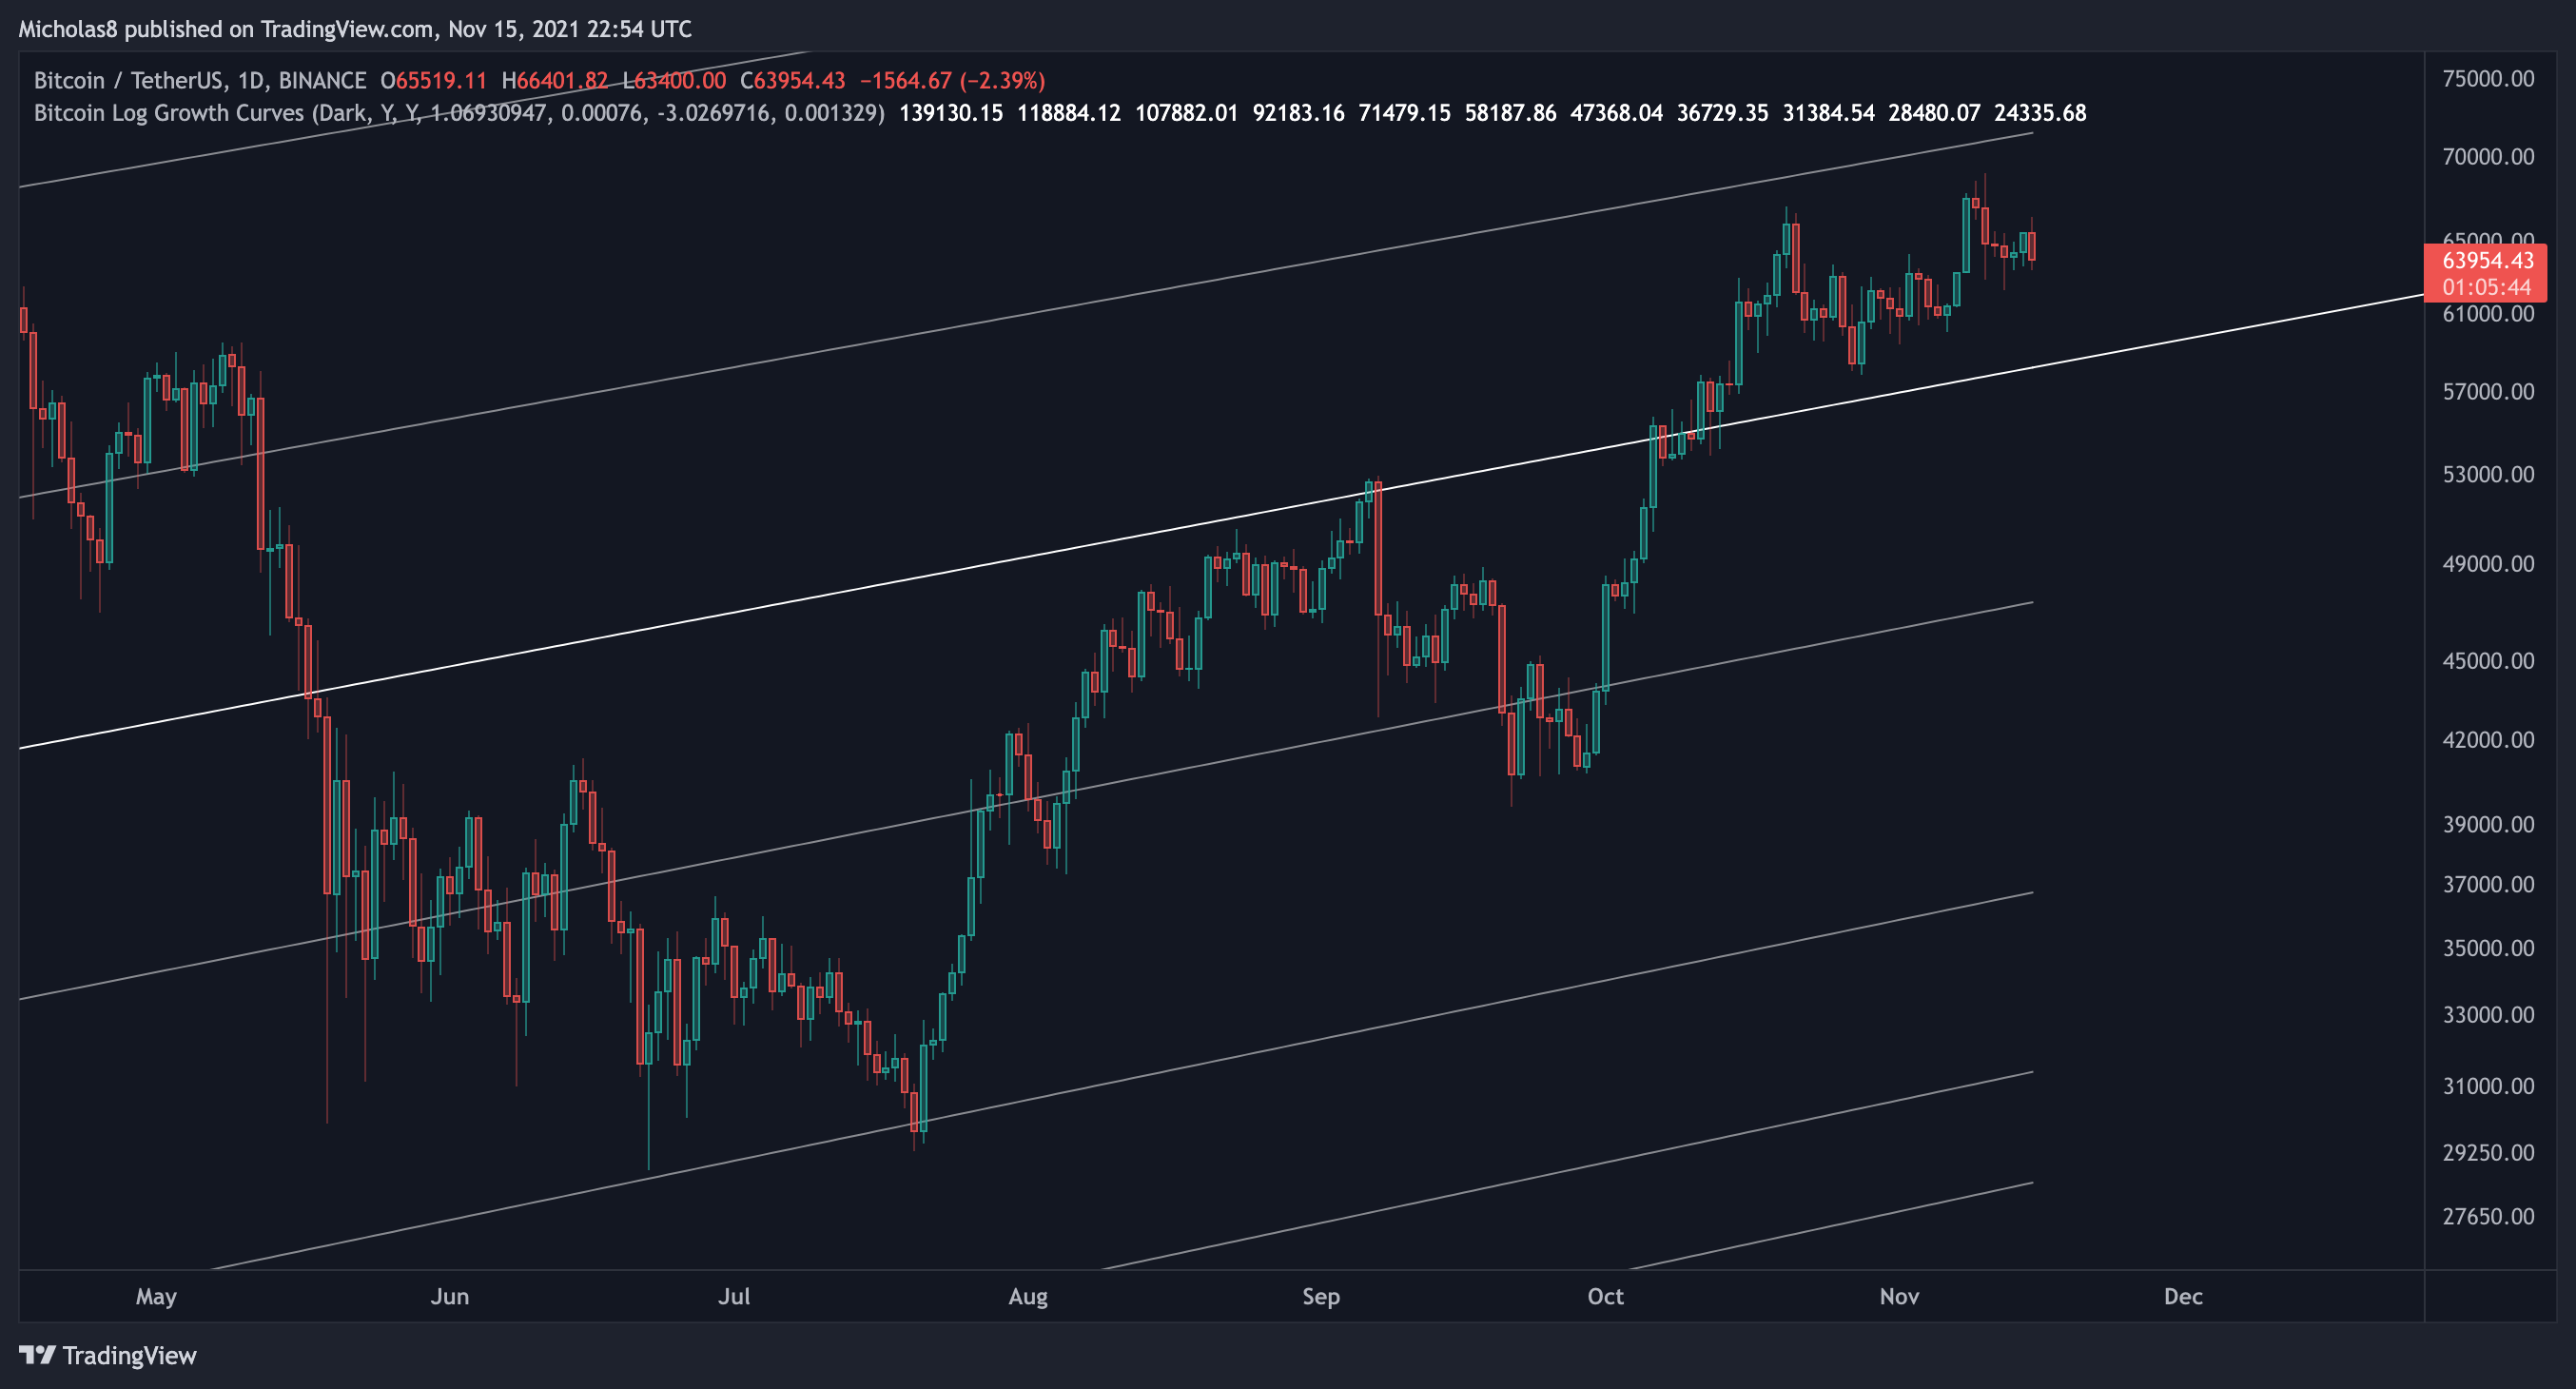
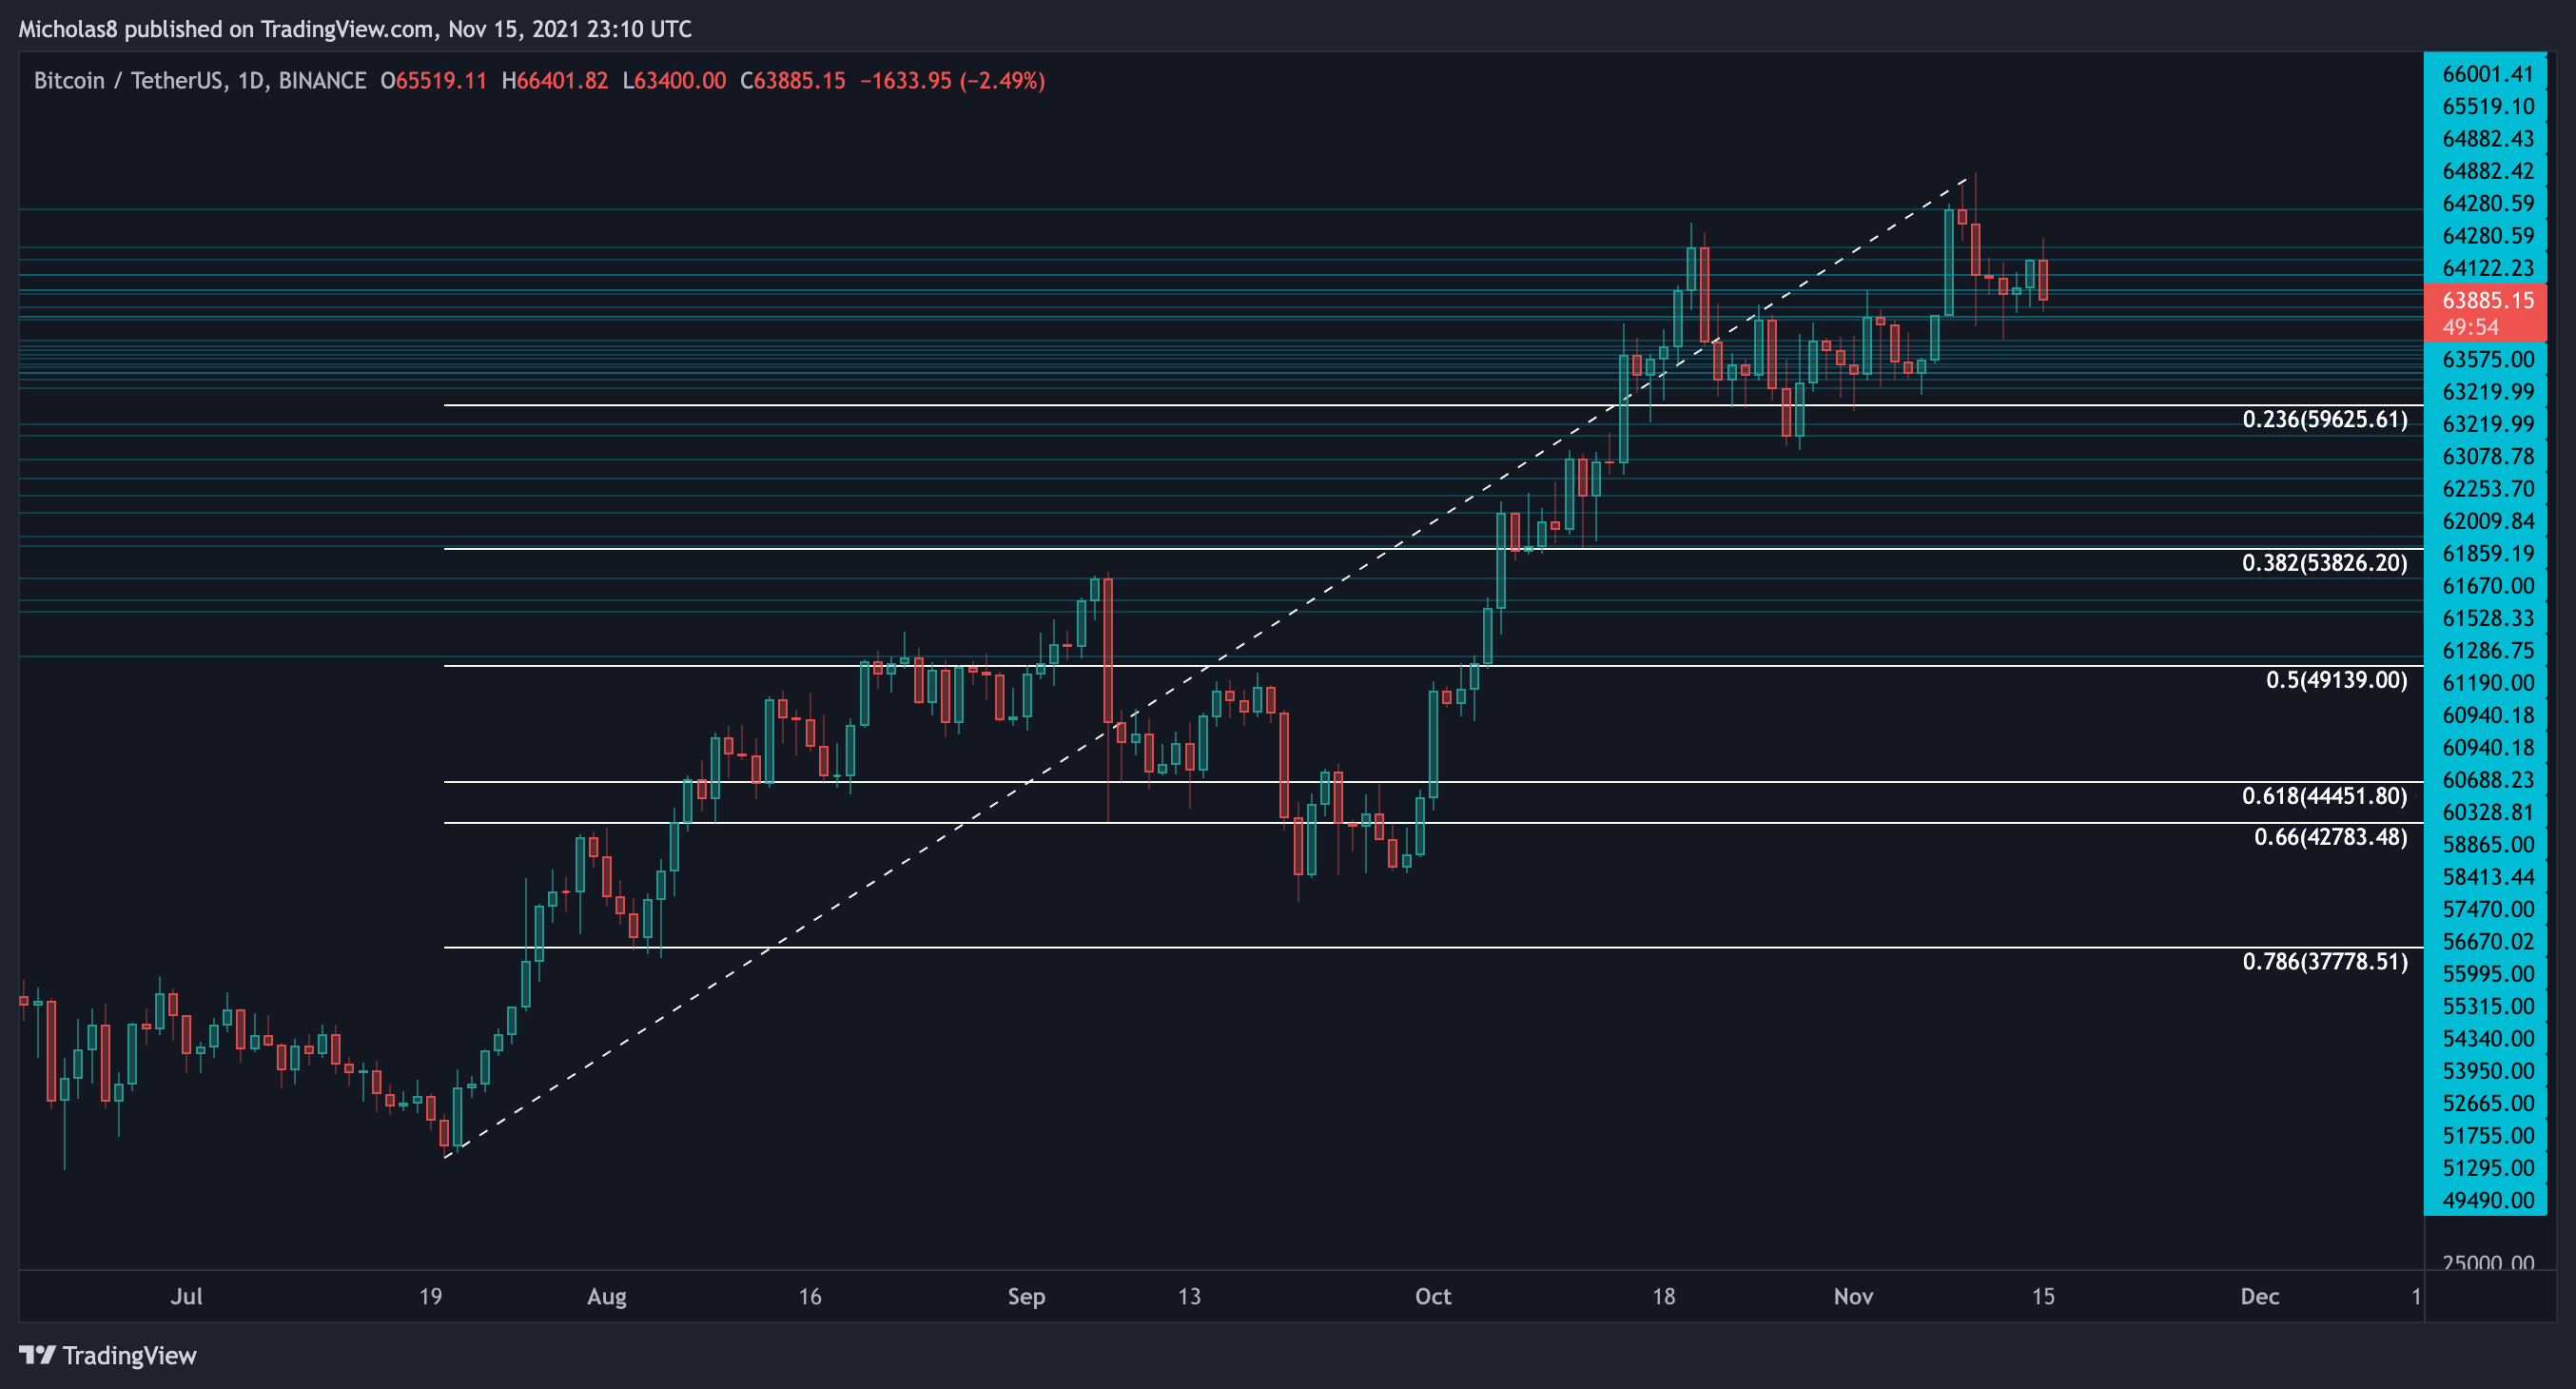
We have now seen multiple candles close above the median line (the thicker white line). To me, this is extremely bullish. Ideally, we make our way up to the next Fibonacci level, which is the 61.8 currently at $71,500.
Key Liquidity Zone (LQZ)
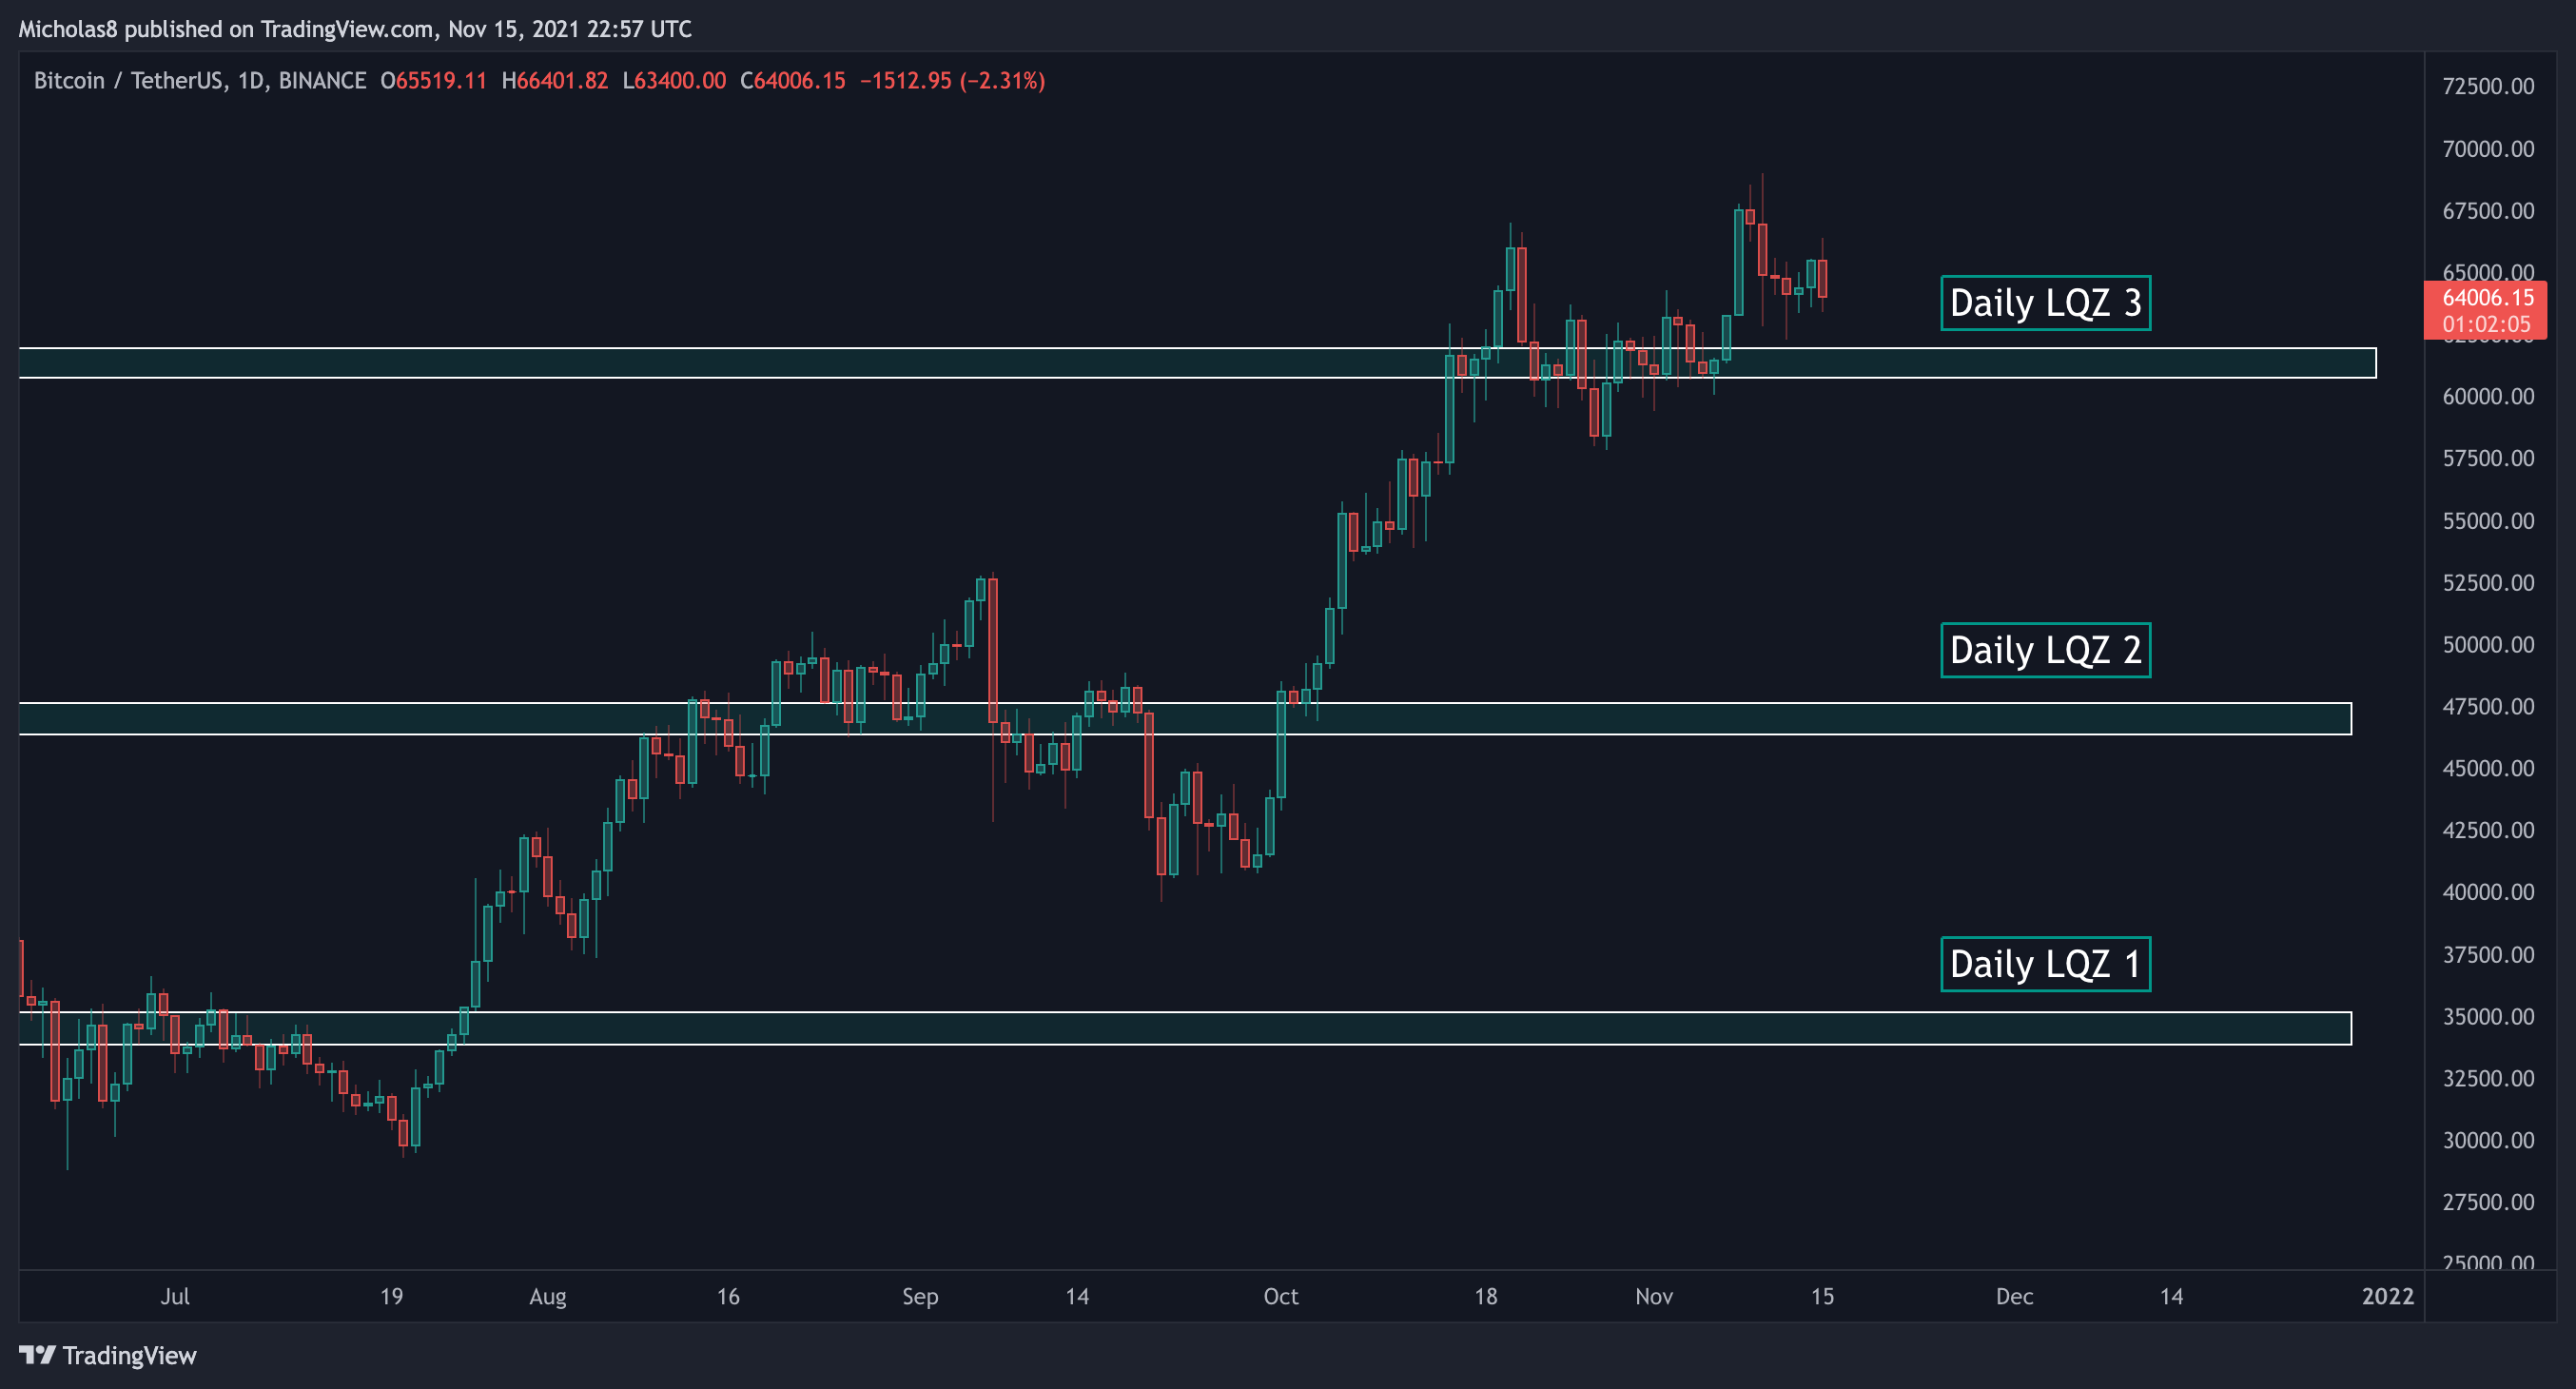
Zone 1: Sitting between 33.9k and 35.2k, Bitcoin is still trading above this Key Daily Liquidity Zone. As long Bitcoin remains above this zone, we can expect it to act as support.
Zone 2: The second LQZ sits at 46.4k - 47.6k.
Zone 3: The final daily liquidity zone sits at 60.7k-61.9k. This was the last major LQZ that was holding the price of Bitcoin down. As we can see in the chart above, the moment we broke through it we saw an insane pump follow. Ideally, this serves as strong support moving forward.
Directional Movement Index (DMI)
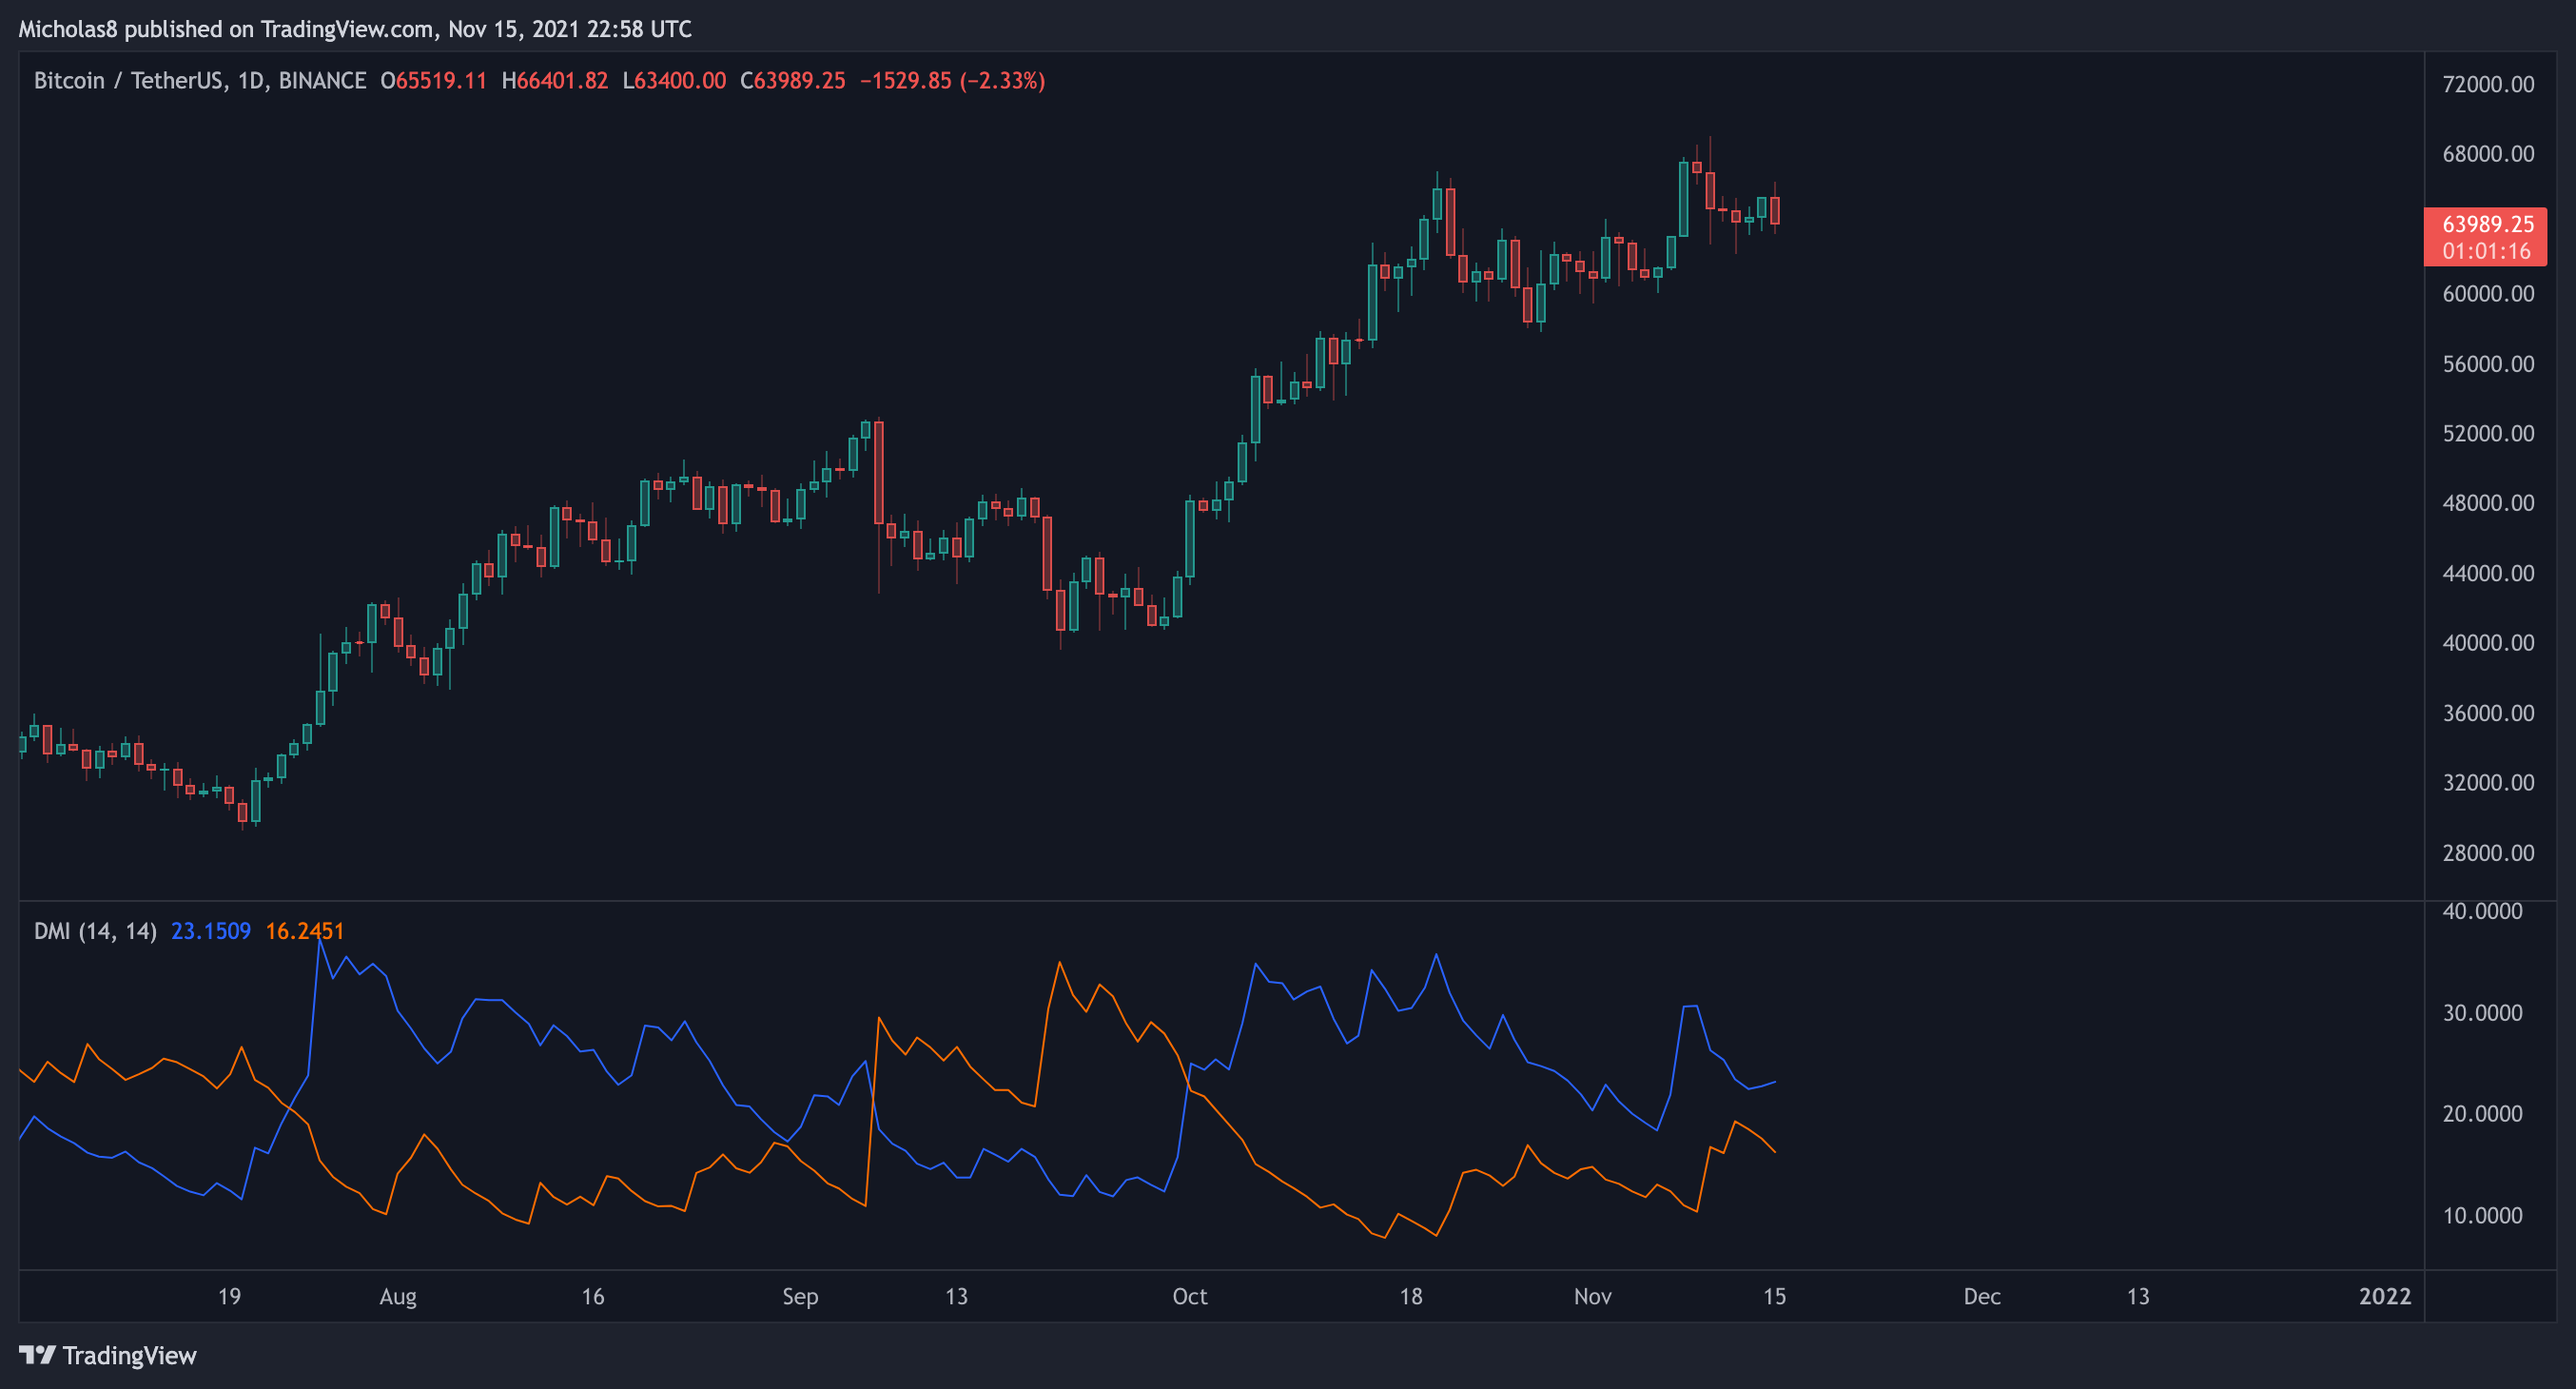
*This is another momentum indicator.
Generally speaking, when the blue line (bullish) crosses above the orange line (bearish), it signals a potential shift in momentum.
EMA Ribbon
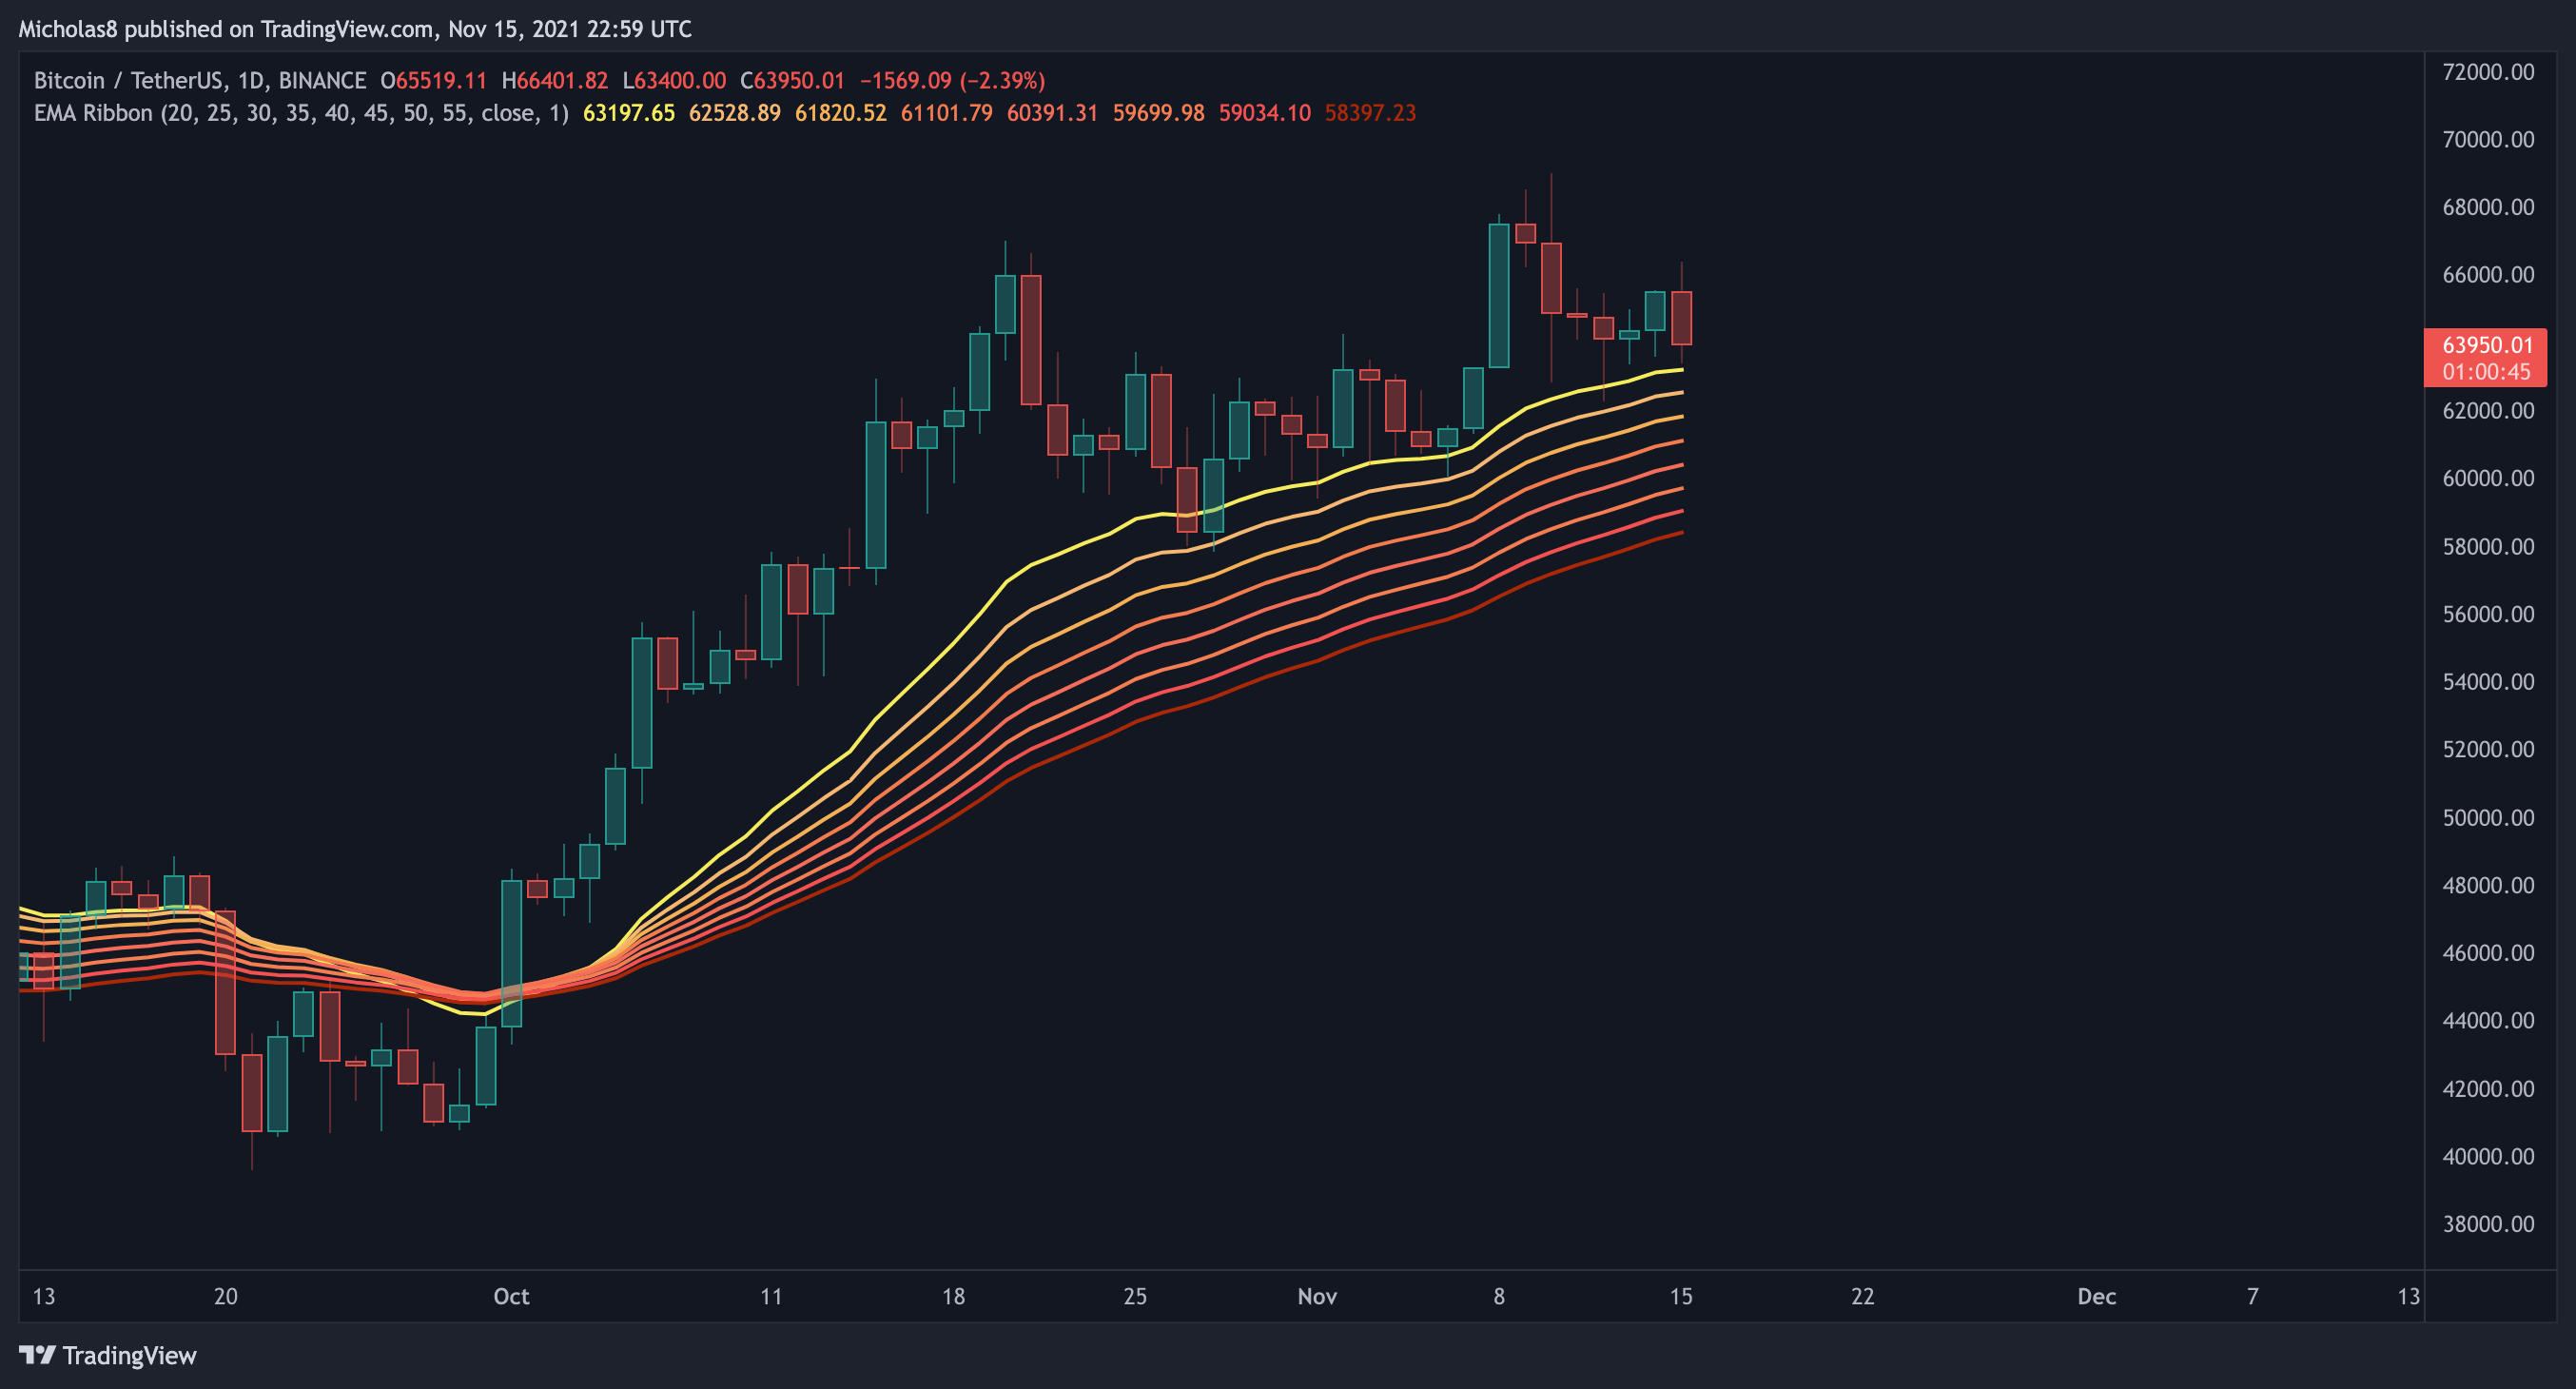
Bitcoin continues to trade above the EMA ribbon in this timeframe.
Implication: The momentum is with the bulls now.
Exponential Moving Average (EMA): 8, 21, 50 and 200
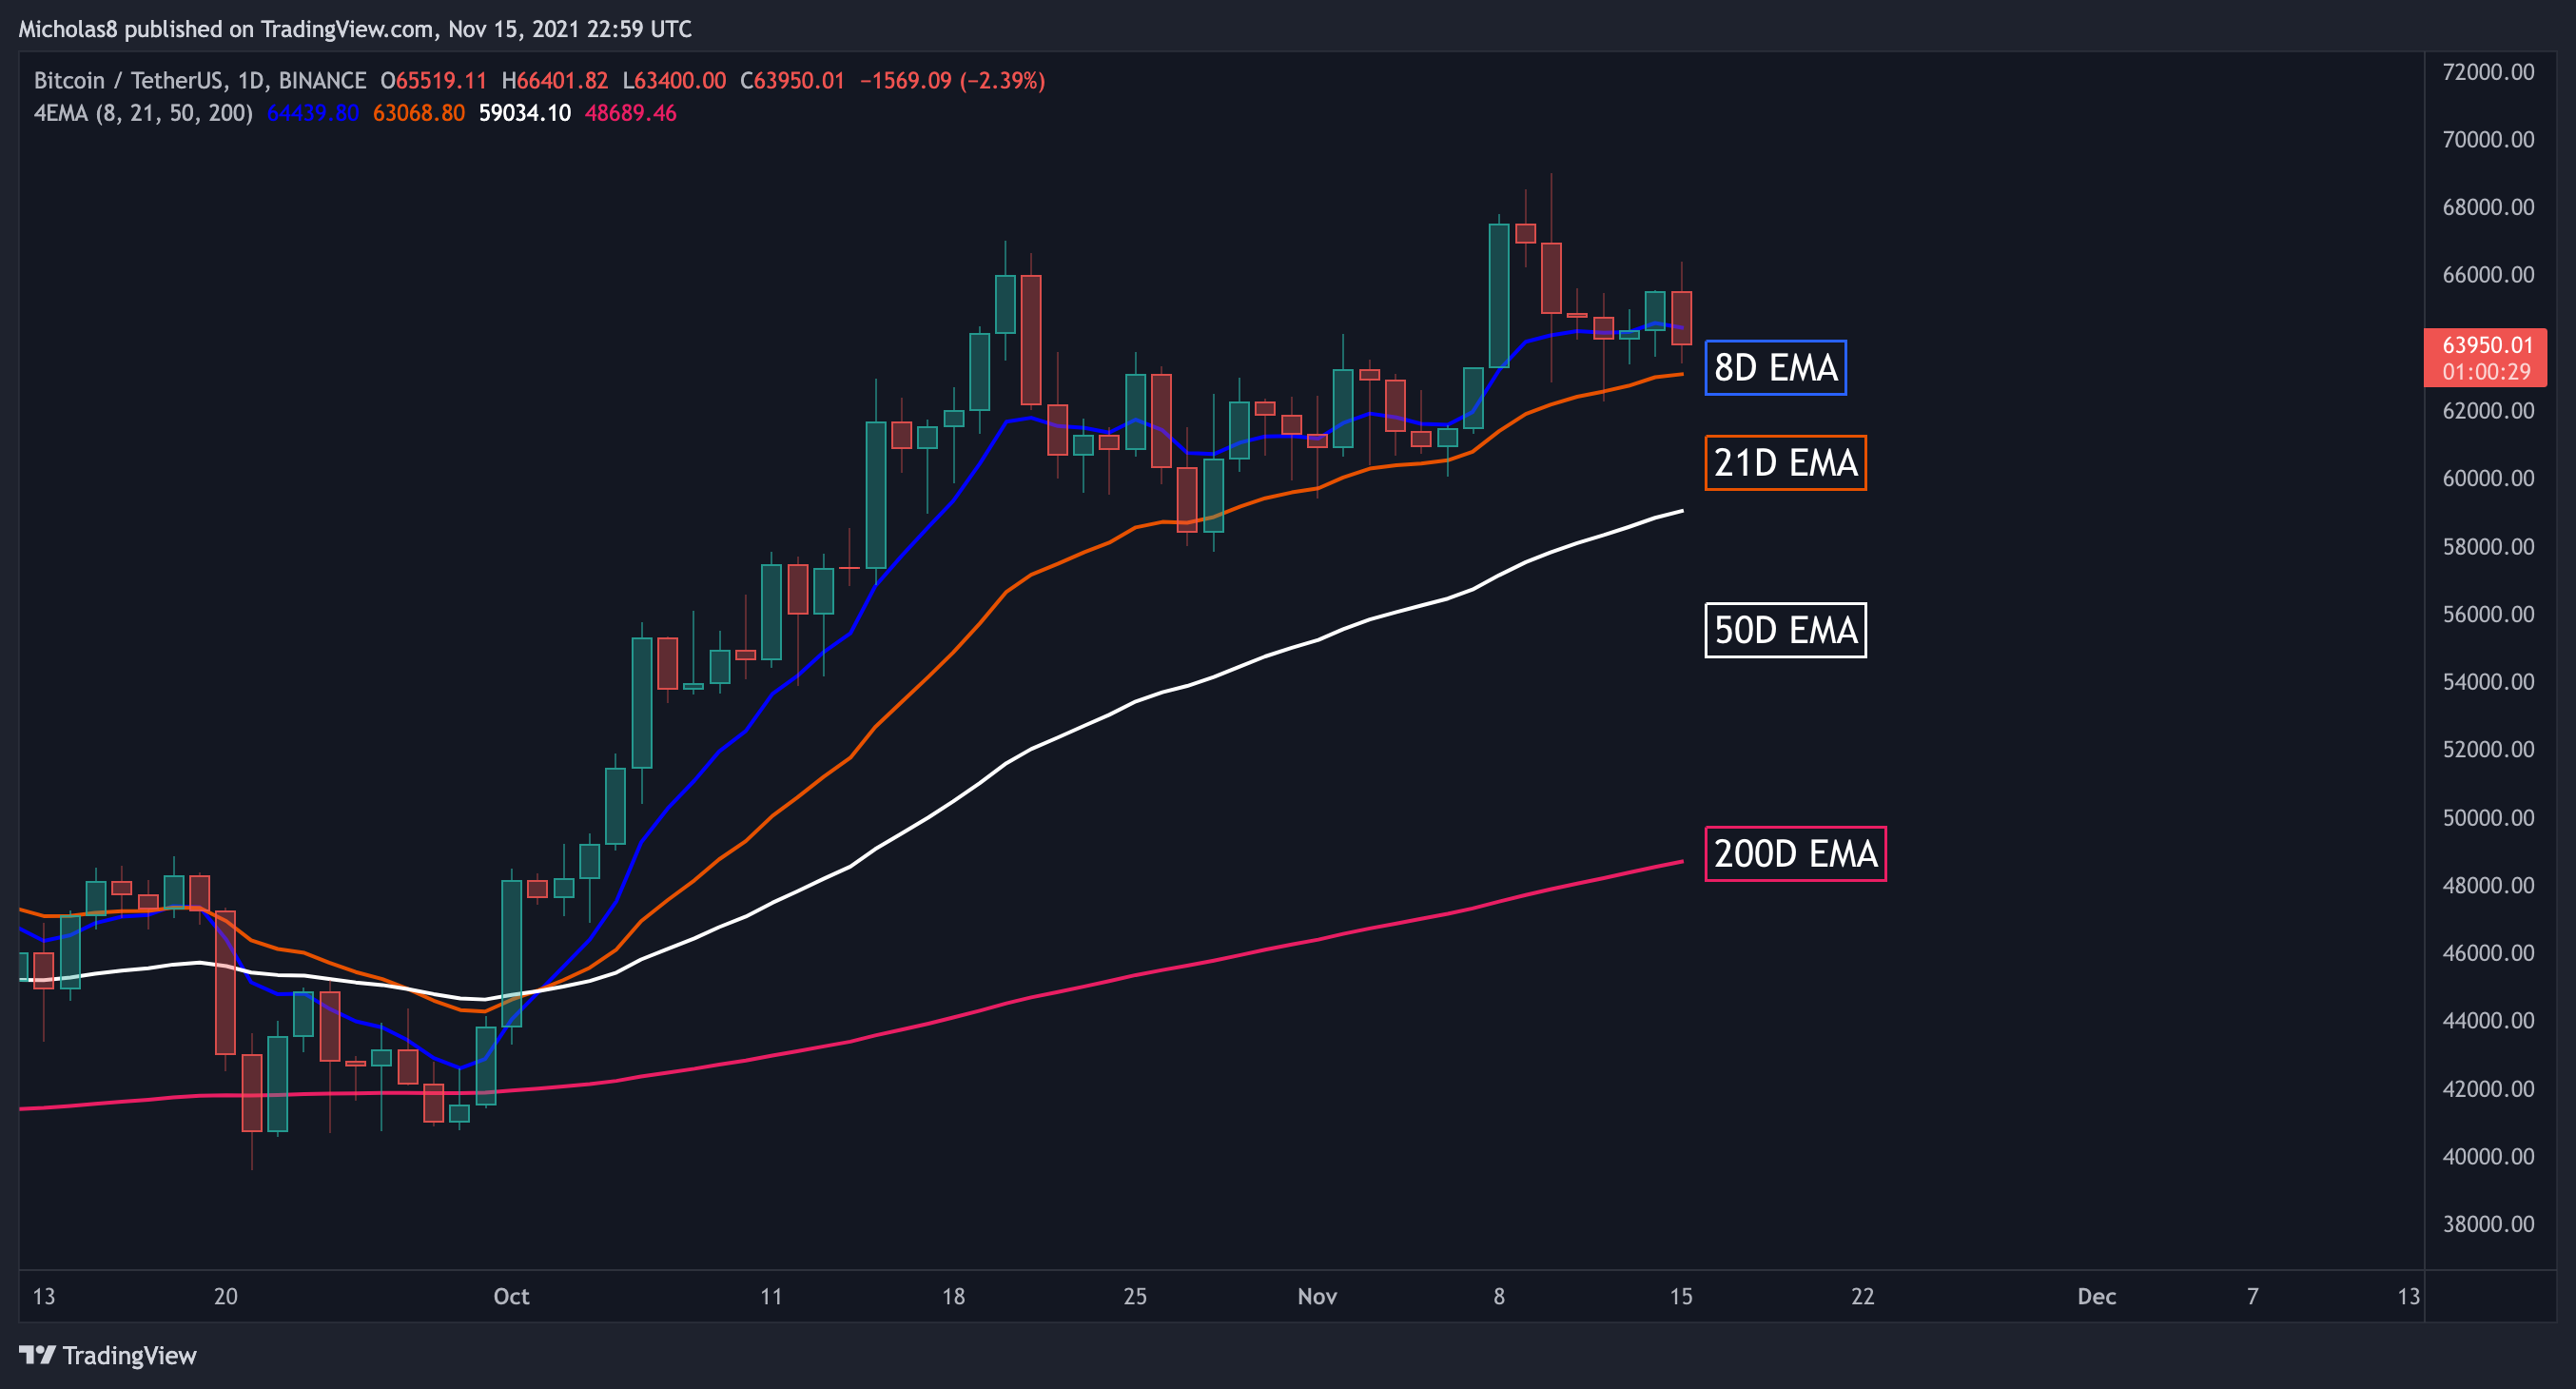
Bitcoin is trying to find support from the 8-day EMA and is currently trading above the other three EMAs.
Implications: Ideally they will all serve as support.
Simple Moving Average (SMA): 20, 50, 100 and 200
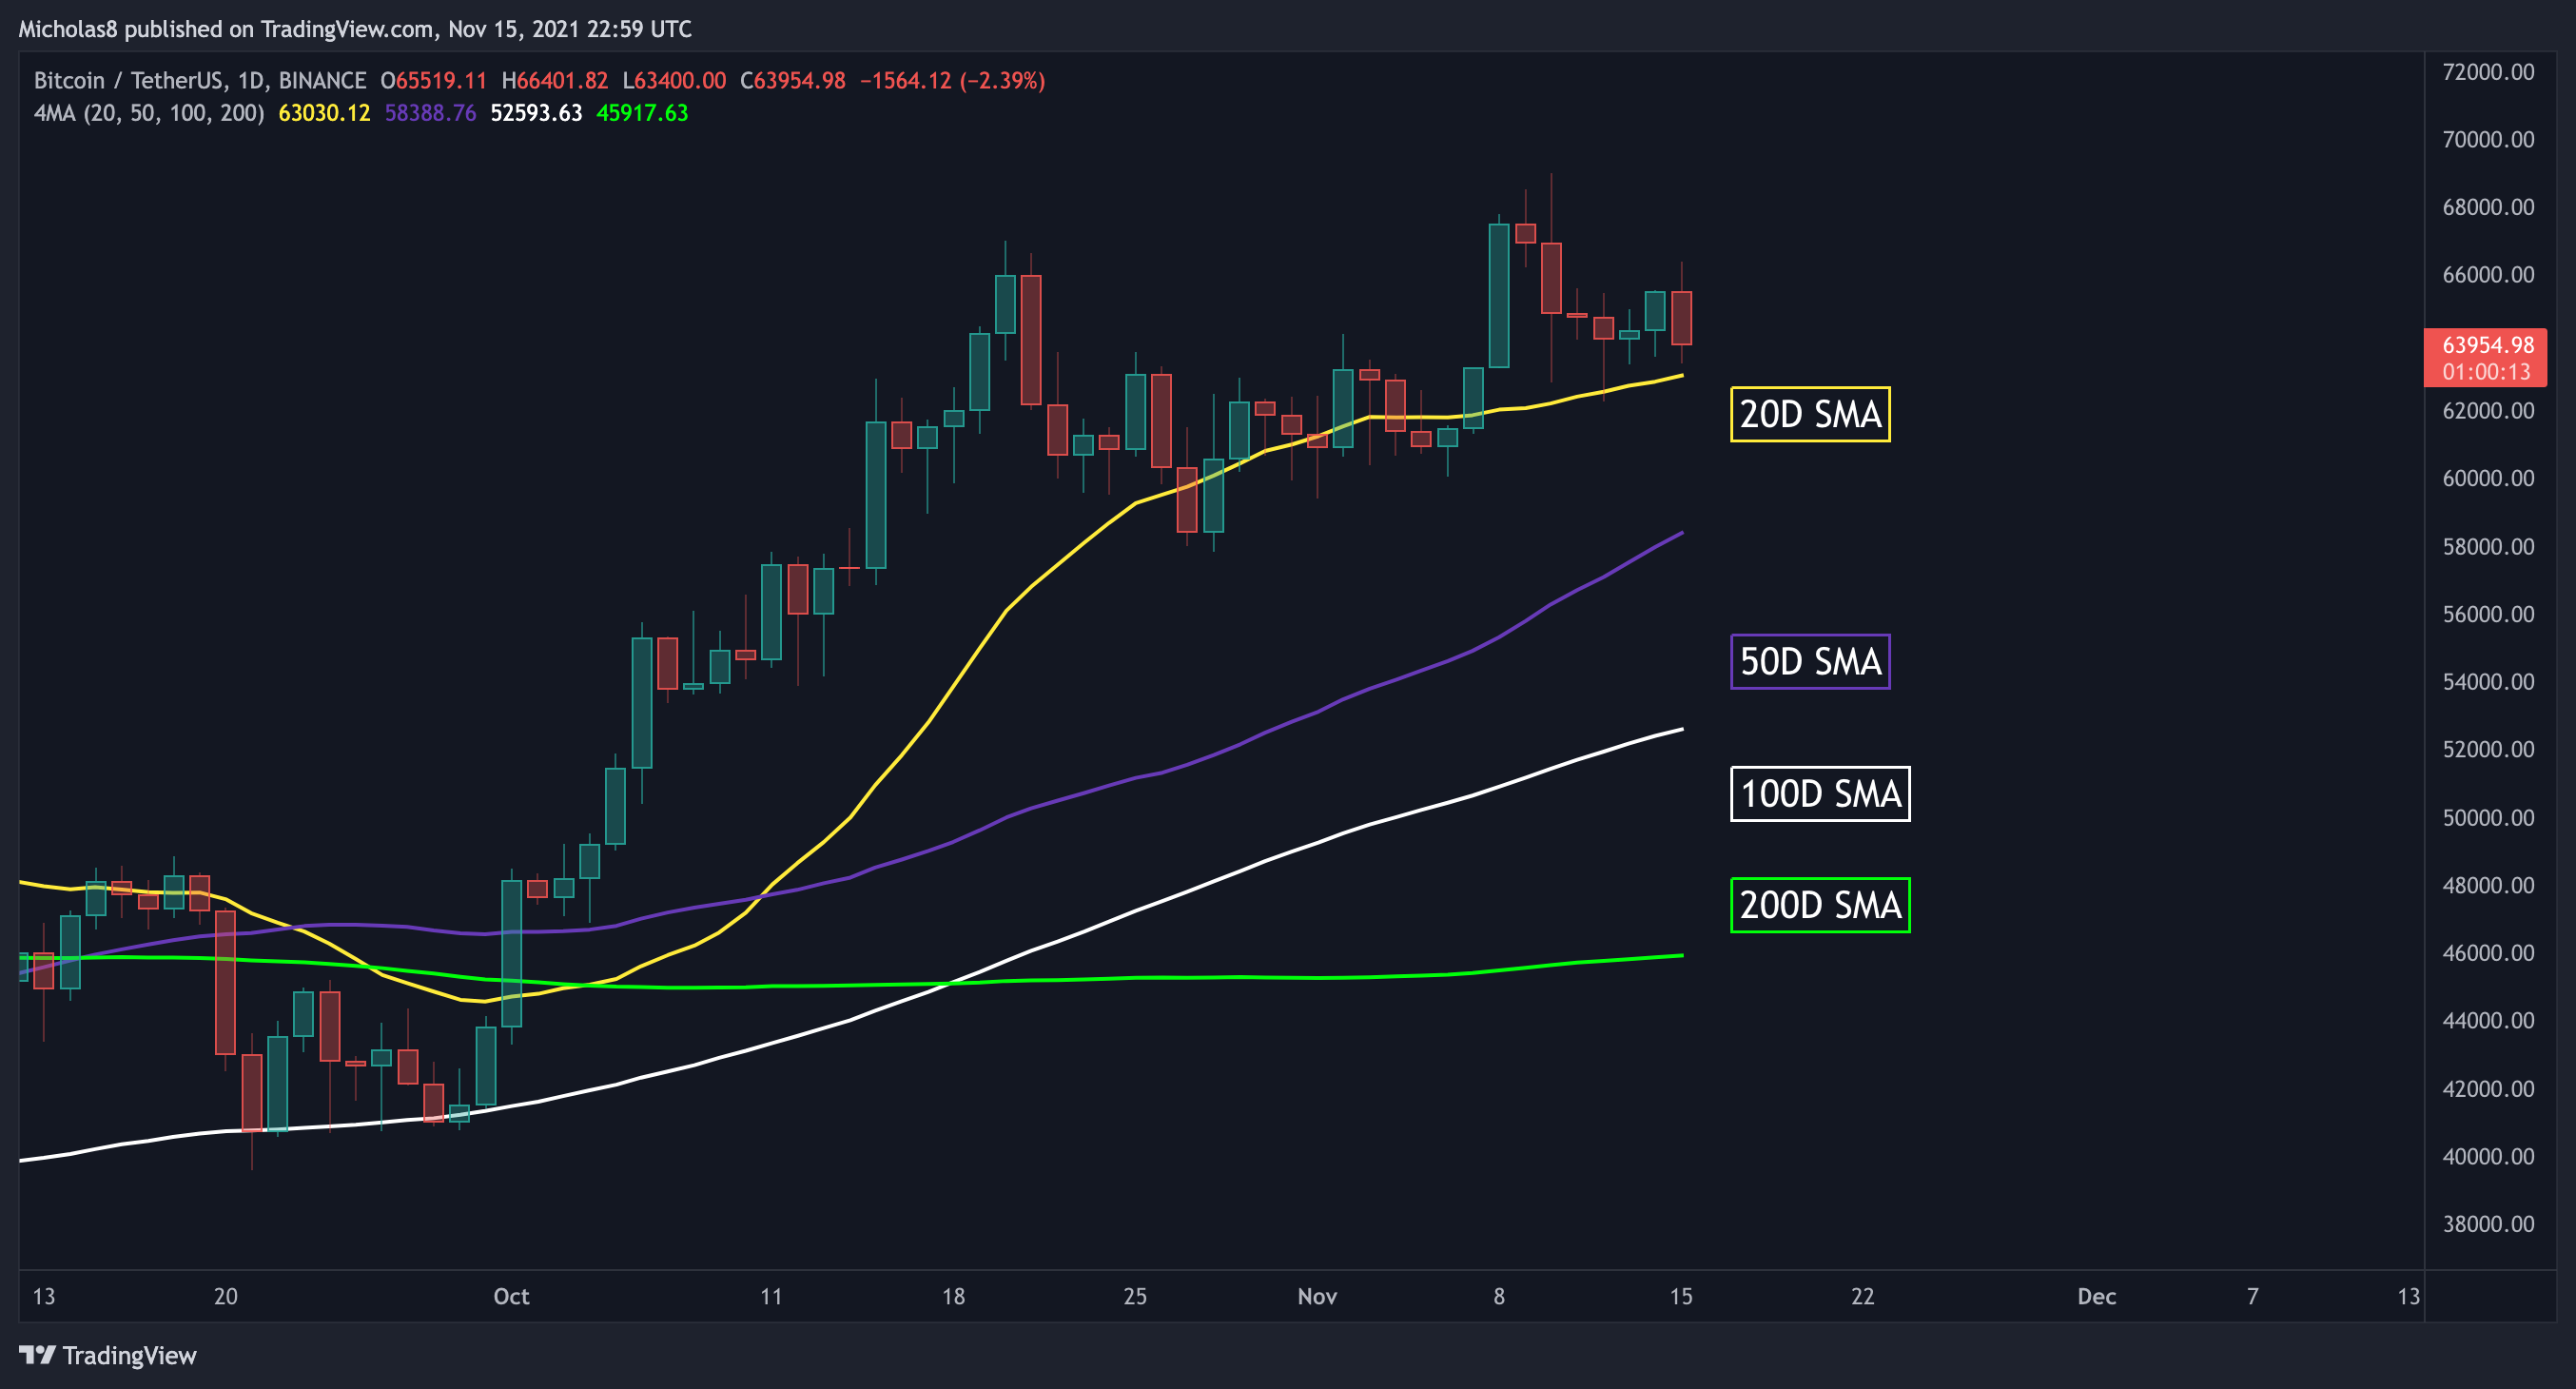
Bitcoin is trading above the 50/100/200-day SMAs and has found support from the 20-day SMA.
Implications: These will ideally serve as a level of support.
Patterns
*Please note not all technical targets will be hit, so be aware of all key levels and Fibonacci Levels, and also look out for divergences as they have the power to reverse a trend
Symmetrical Triangle
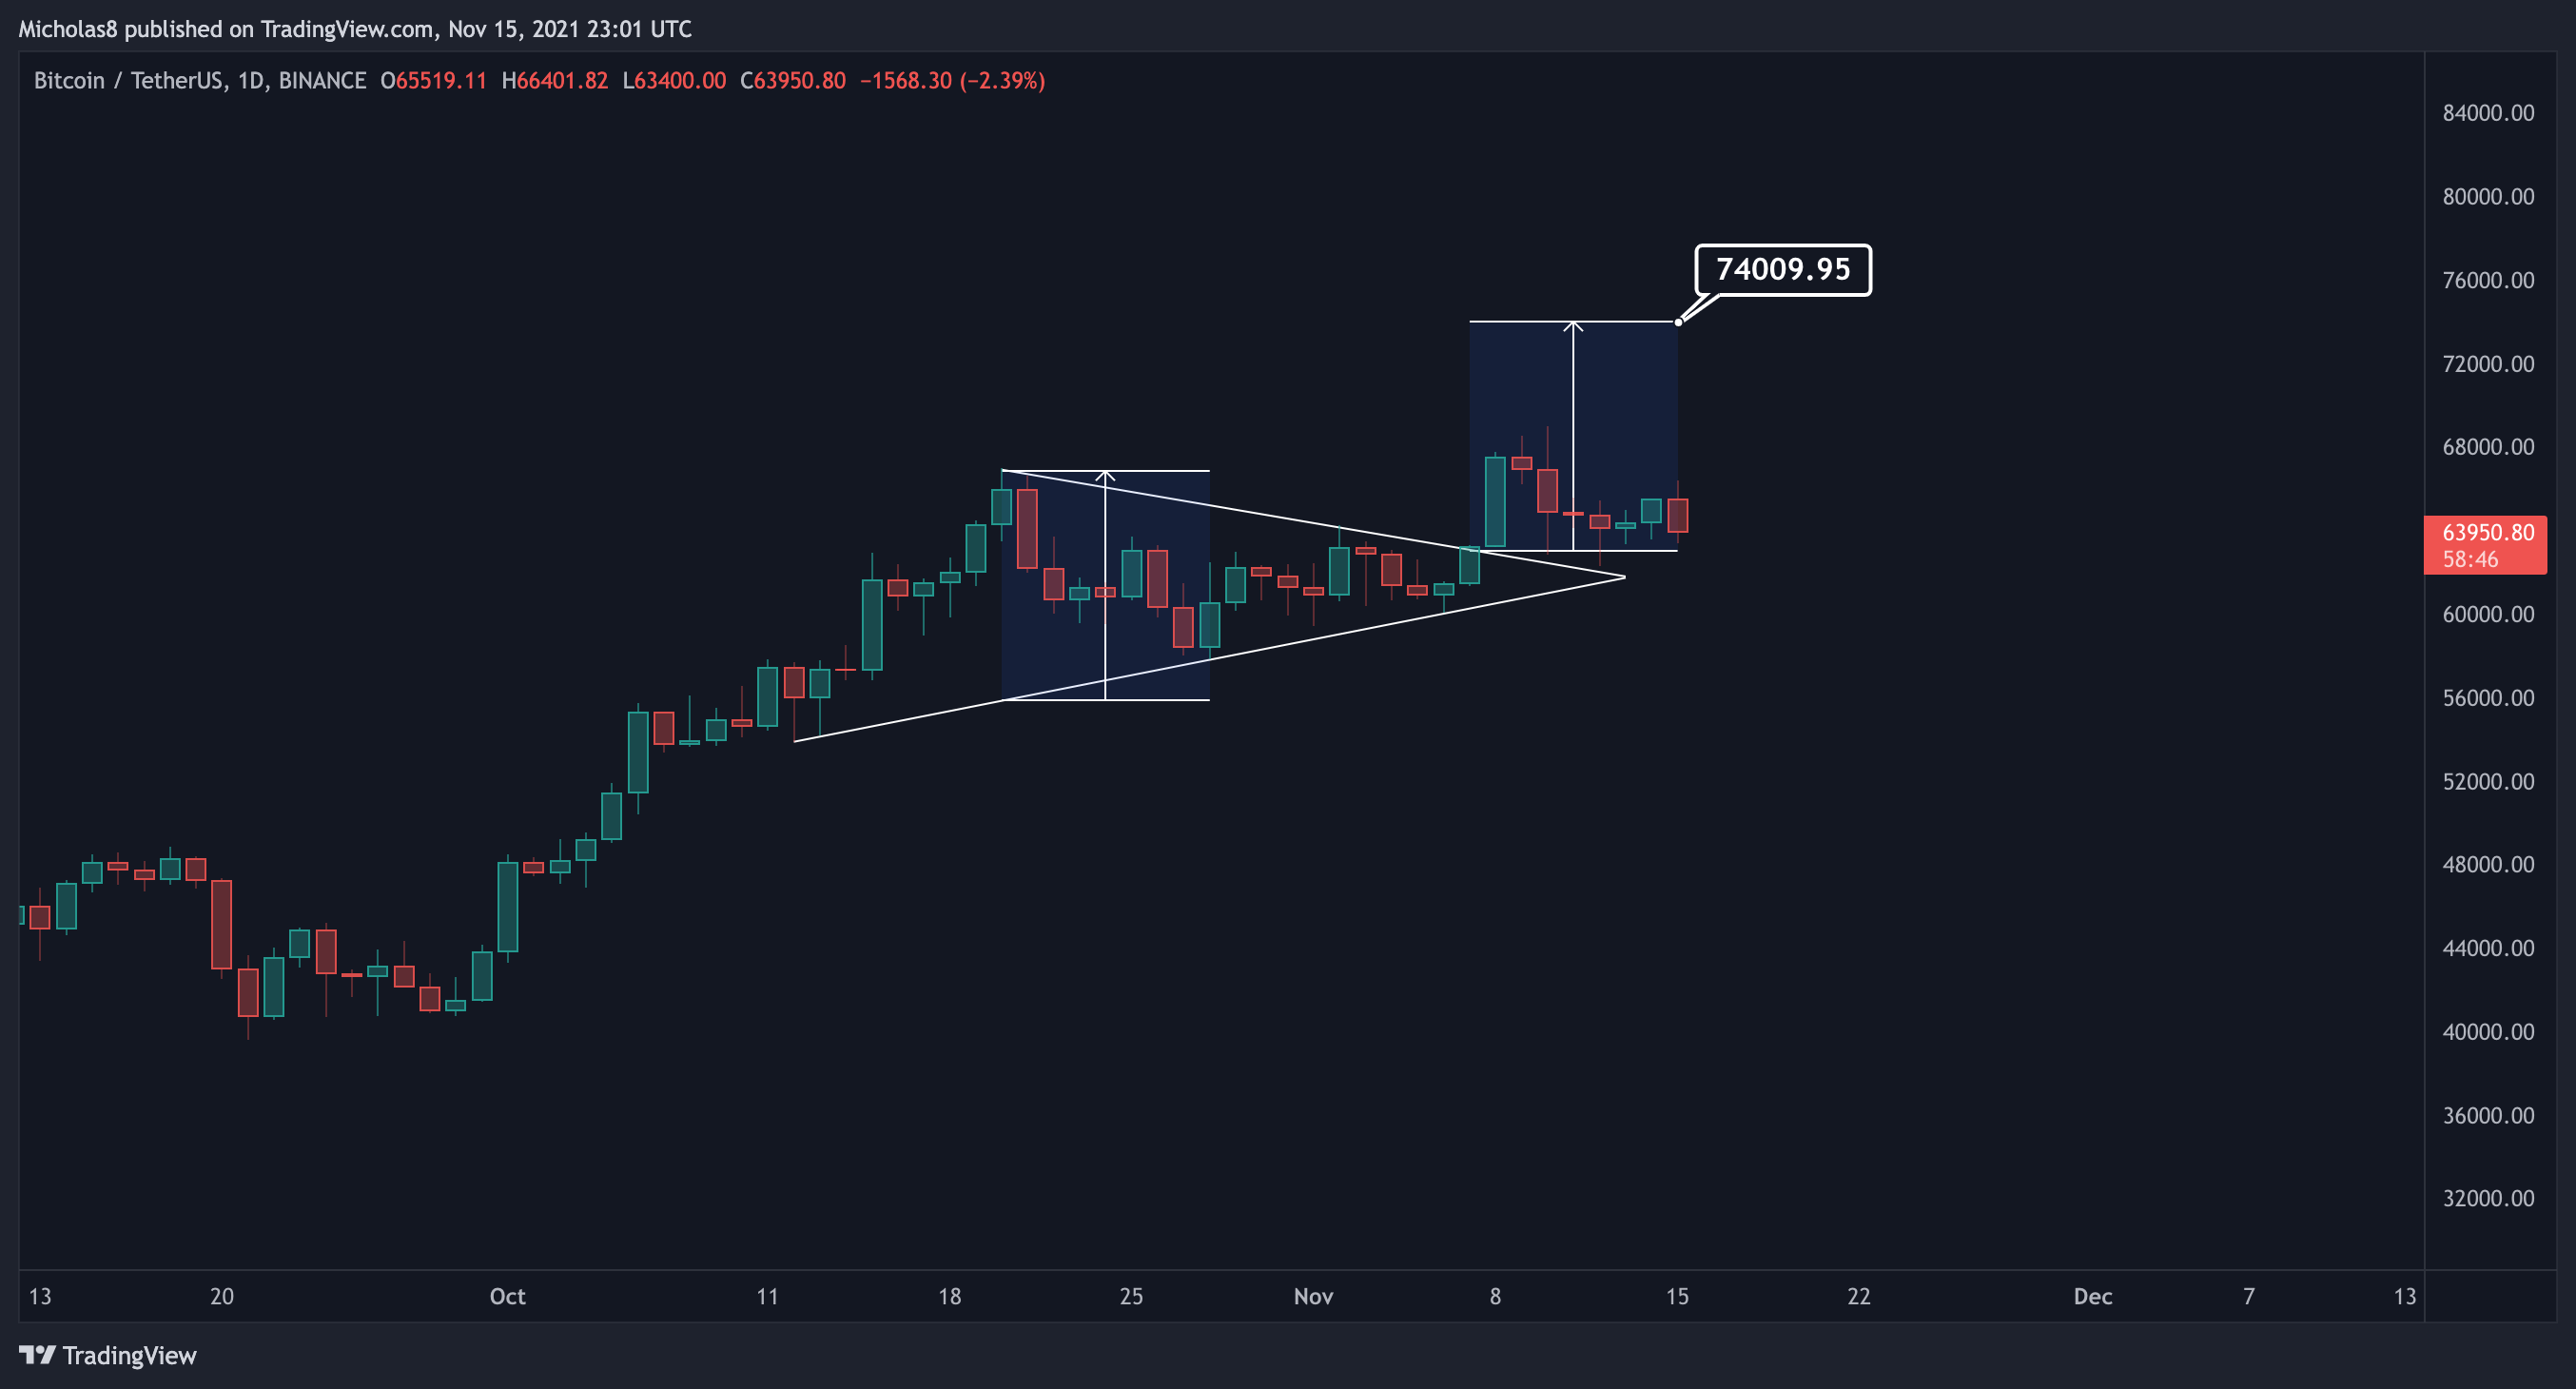
The first target has been hit!
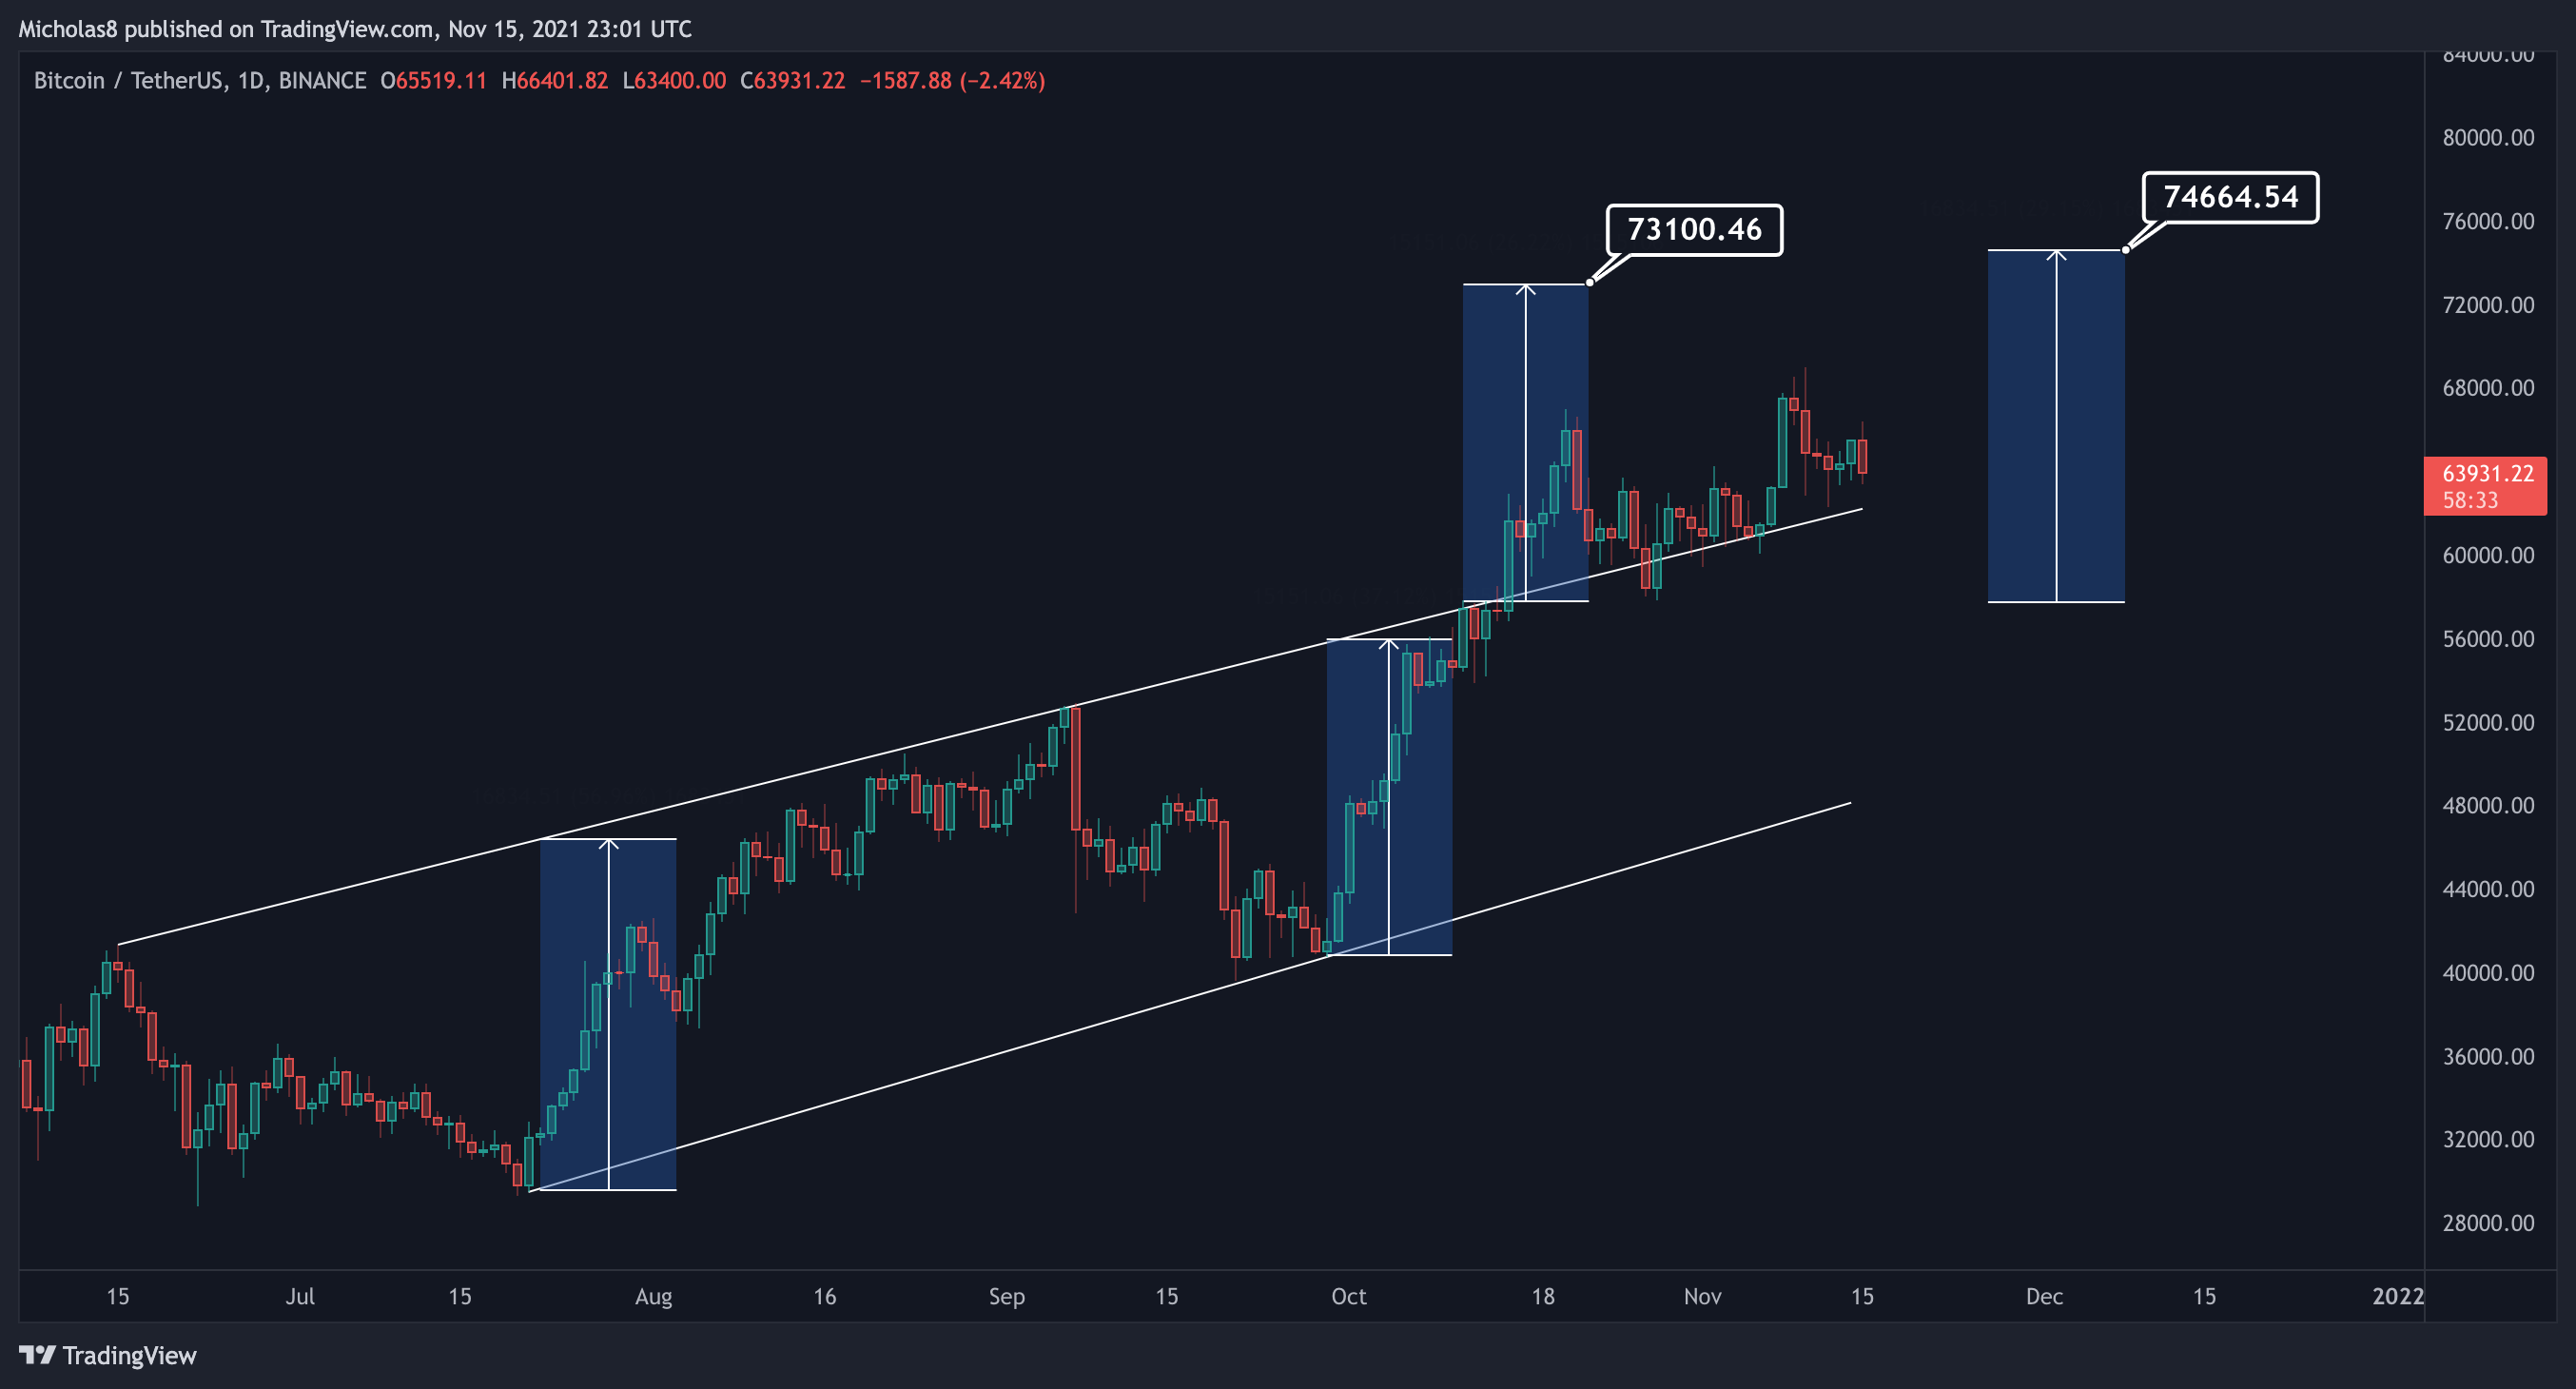
Rising Channel
4H Timeframe
Key Liquidity Zone (LQZ)
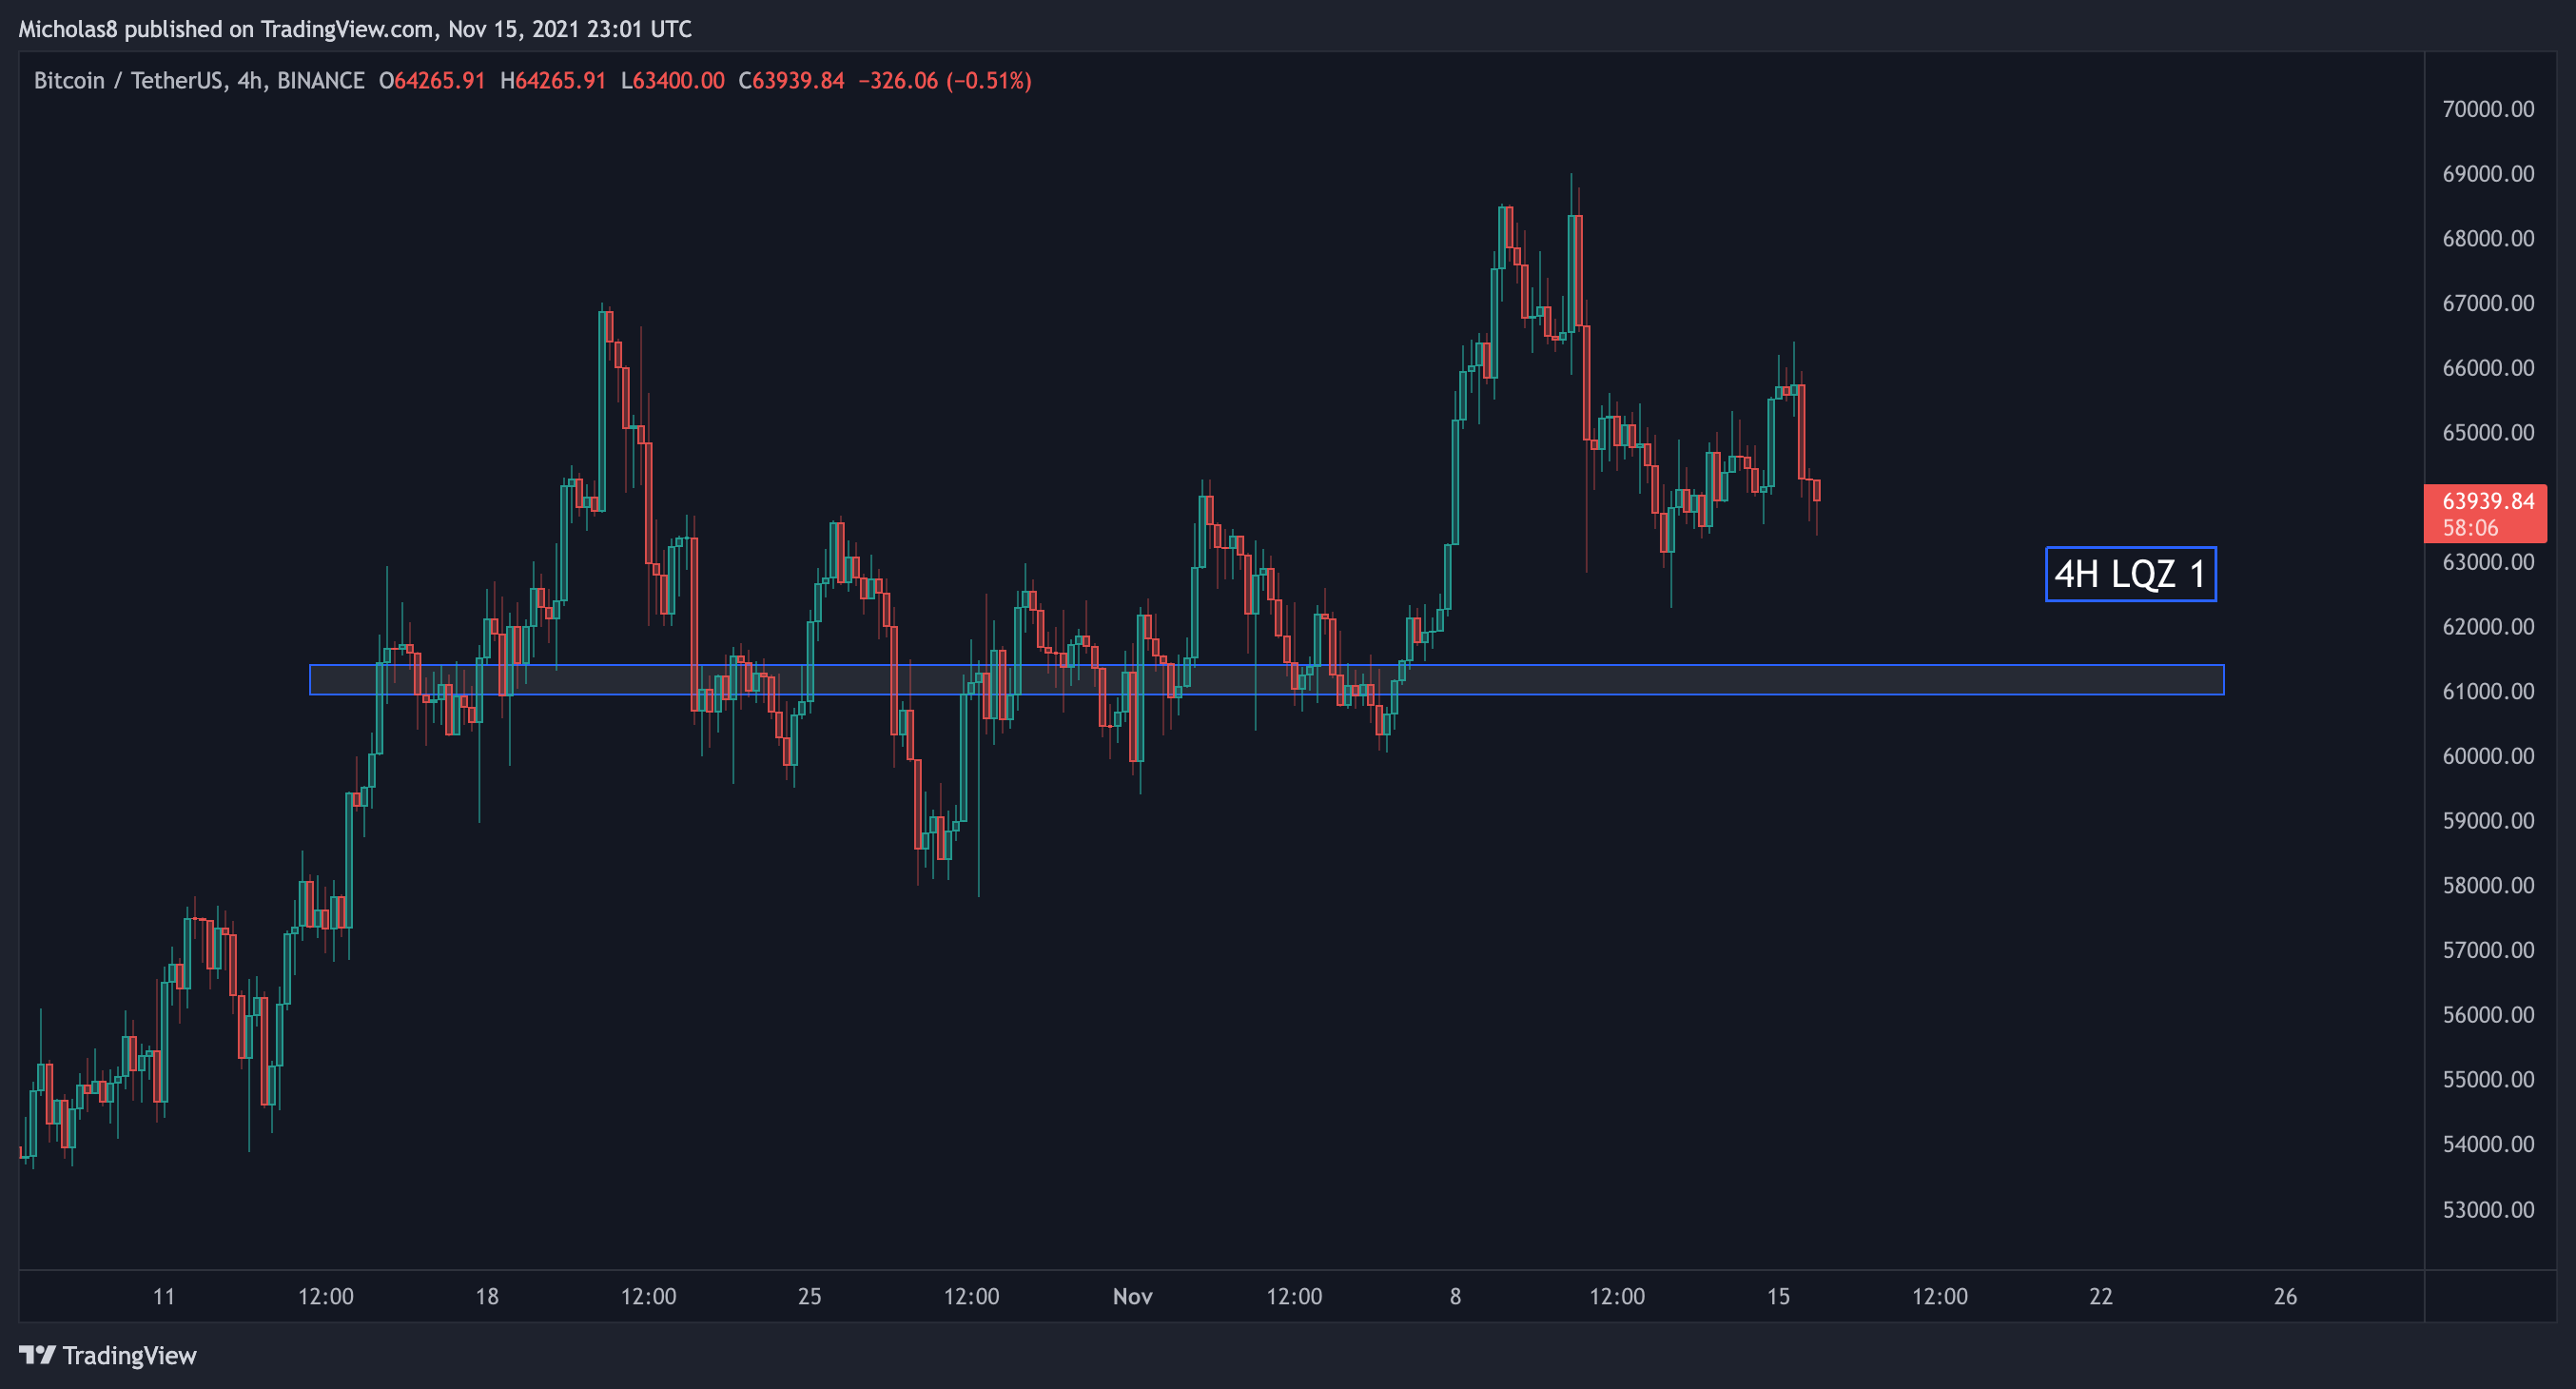
Zone 1: Bitcoin is attempting to hold this LQZ as support, which sits at 60.9k - 61.4k.
Implications: A lot of the liquidity in this timeframe rests below the current price of Bitcoin. Ideally, this LQZ will serve as support.
Simple Moving Average (SMA): 200
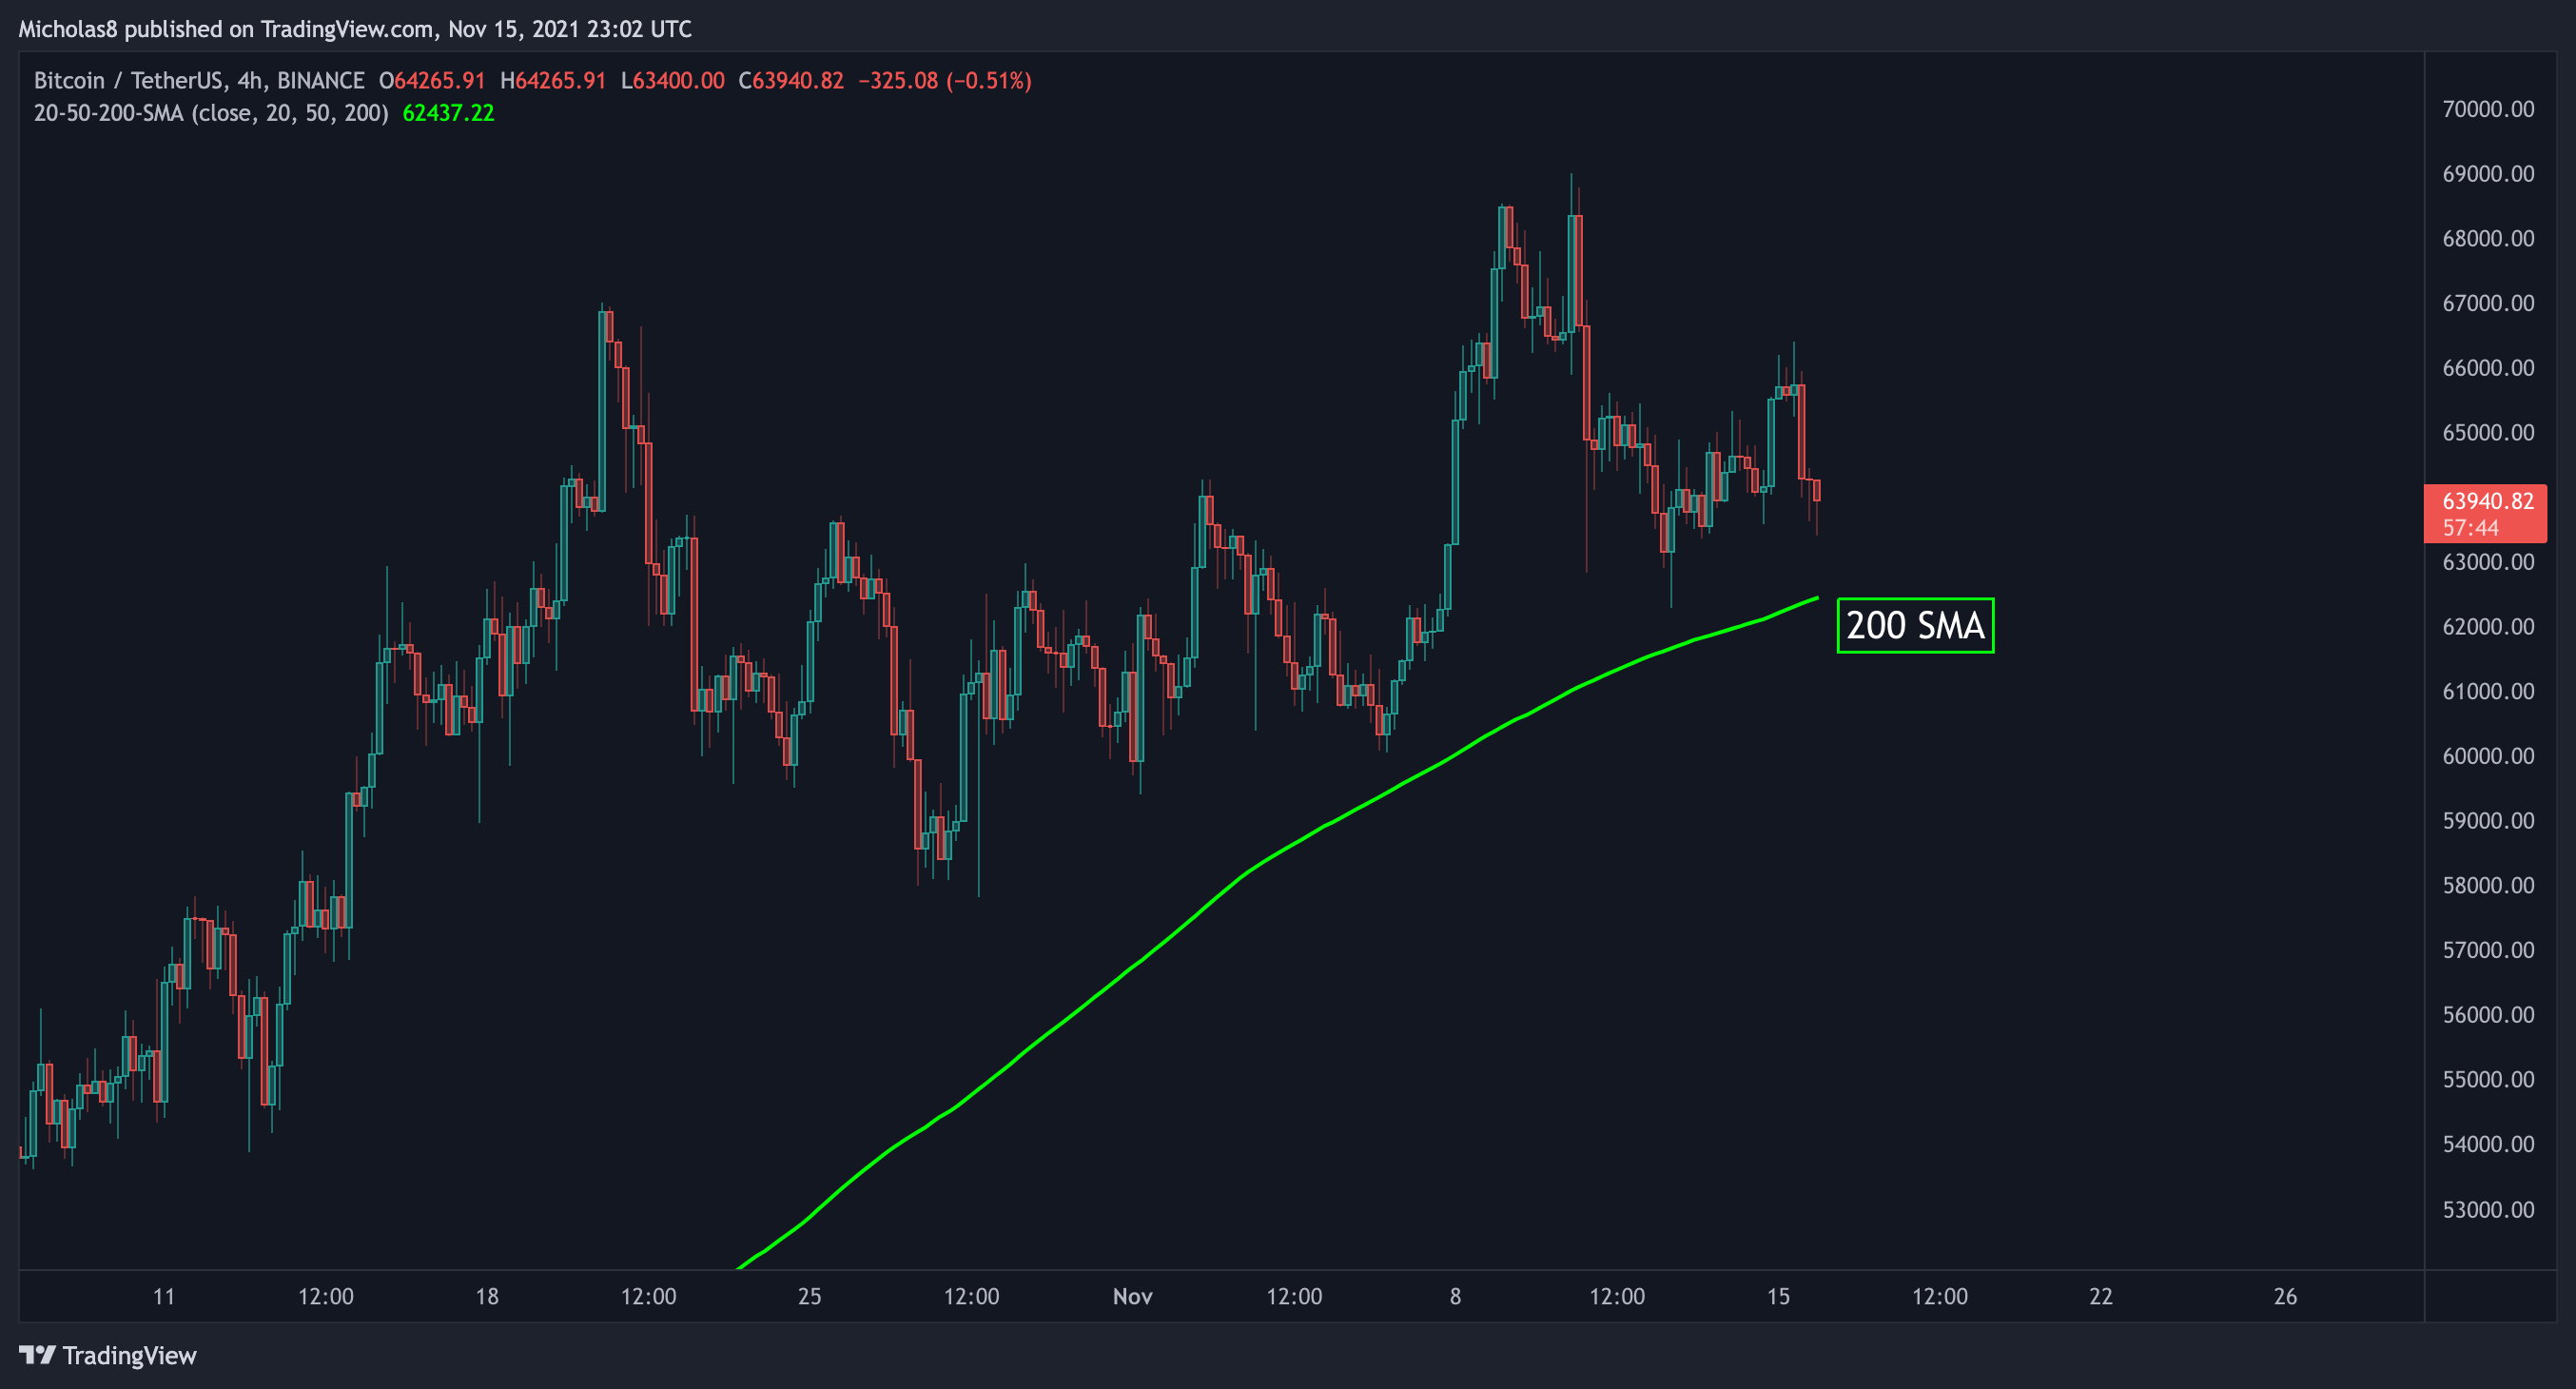
Bitcoin is trading above this SMA.
Implications: It will ideally serve as a level of support.
THE BAD
Daily Timeframe
Bullish Exhaustion
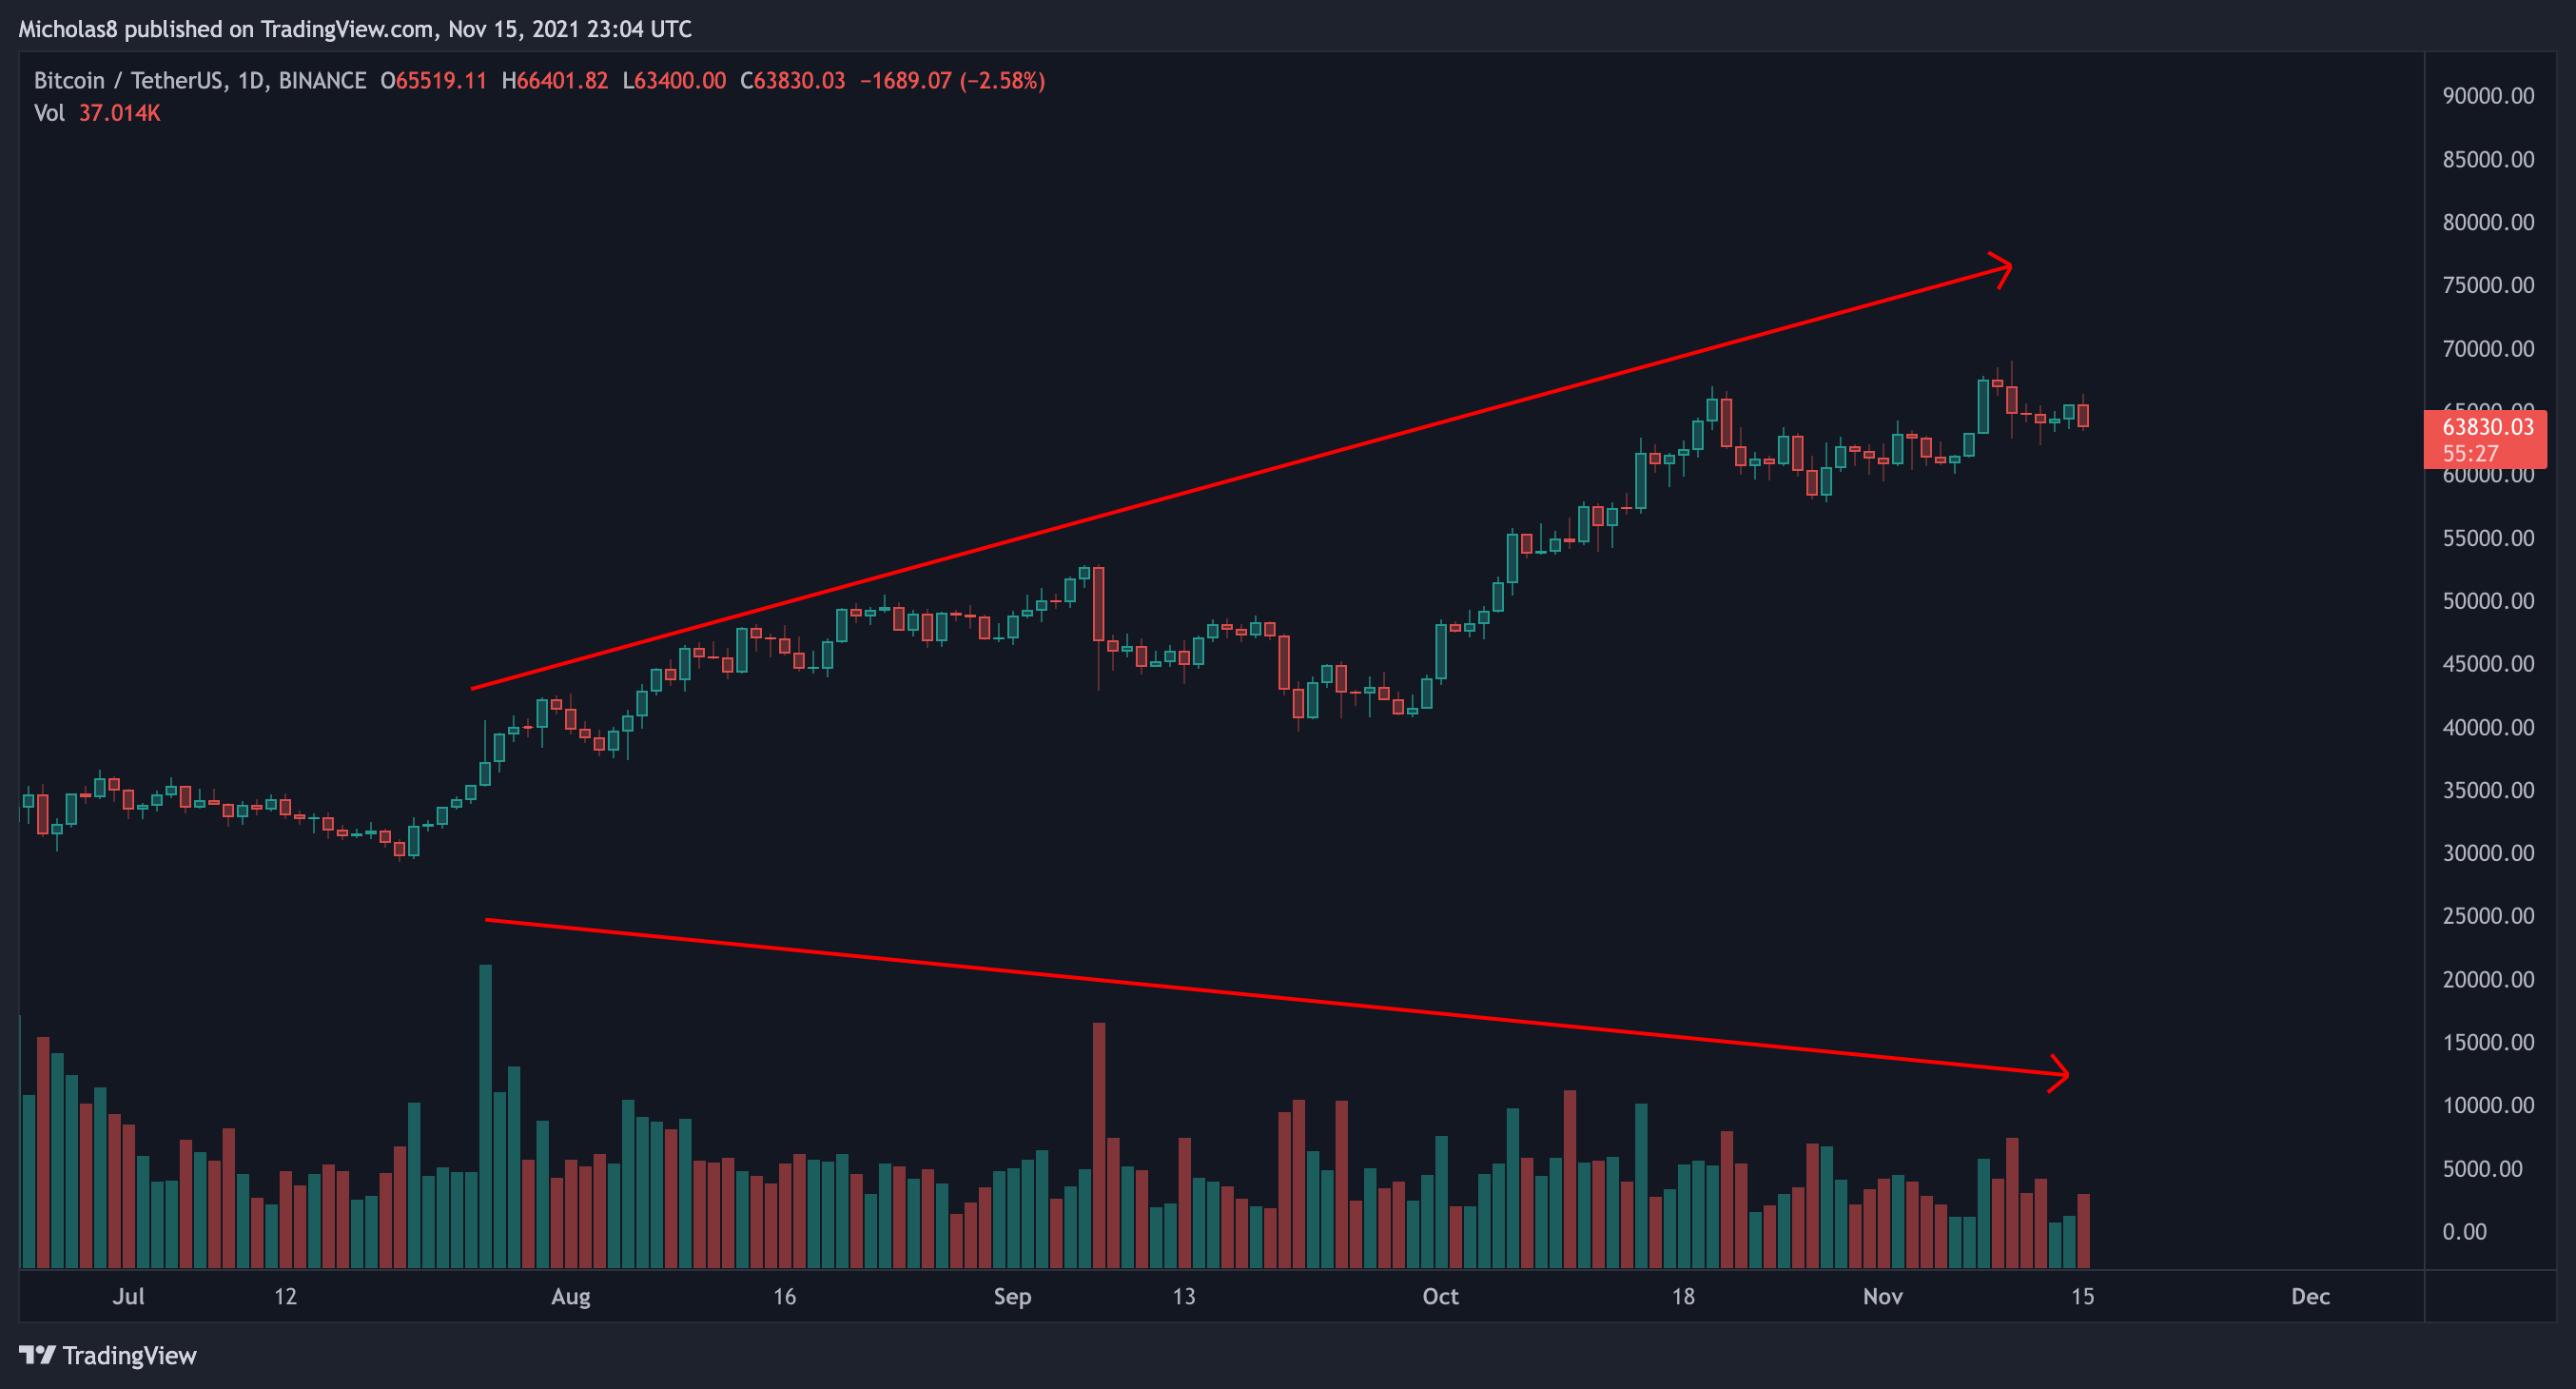
We have an increase in price with a decline in volume, possibly signalling a loss of bullish momentum in the market.
Network Value to Transaction (NVT)
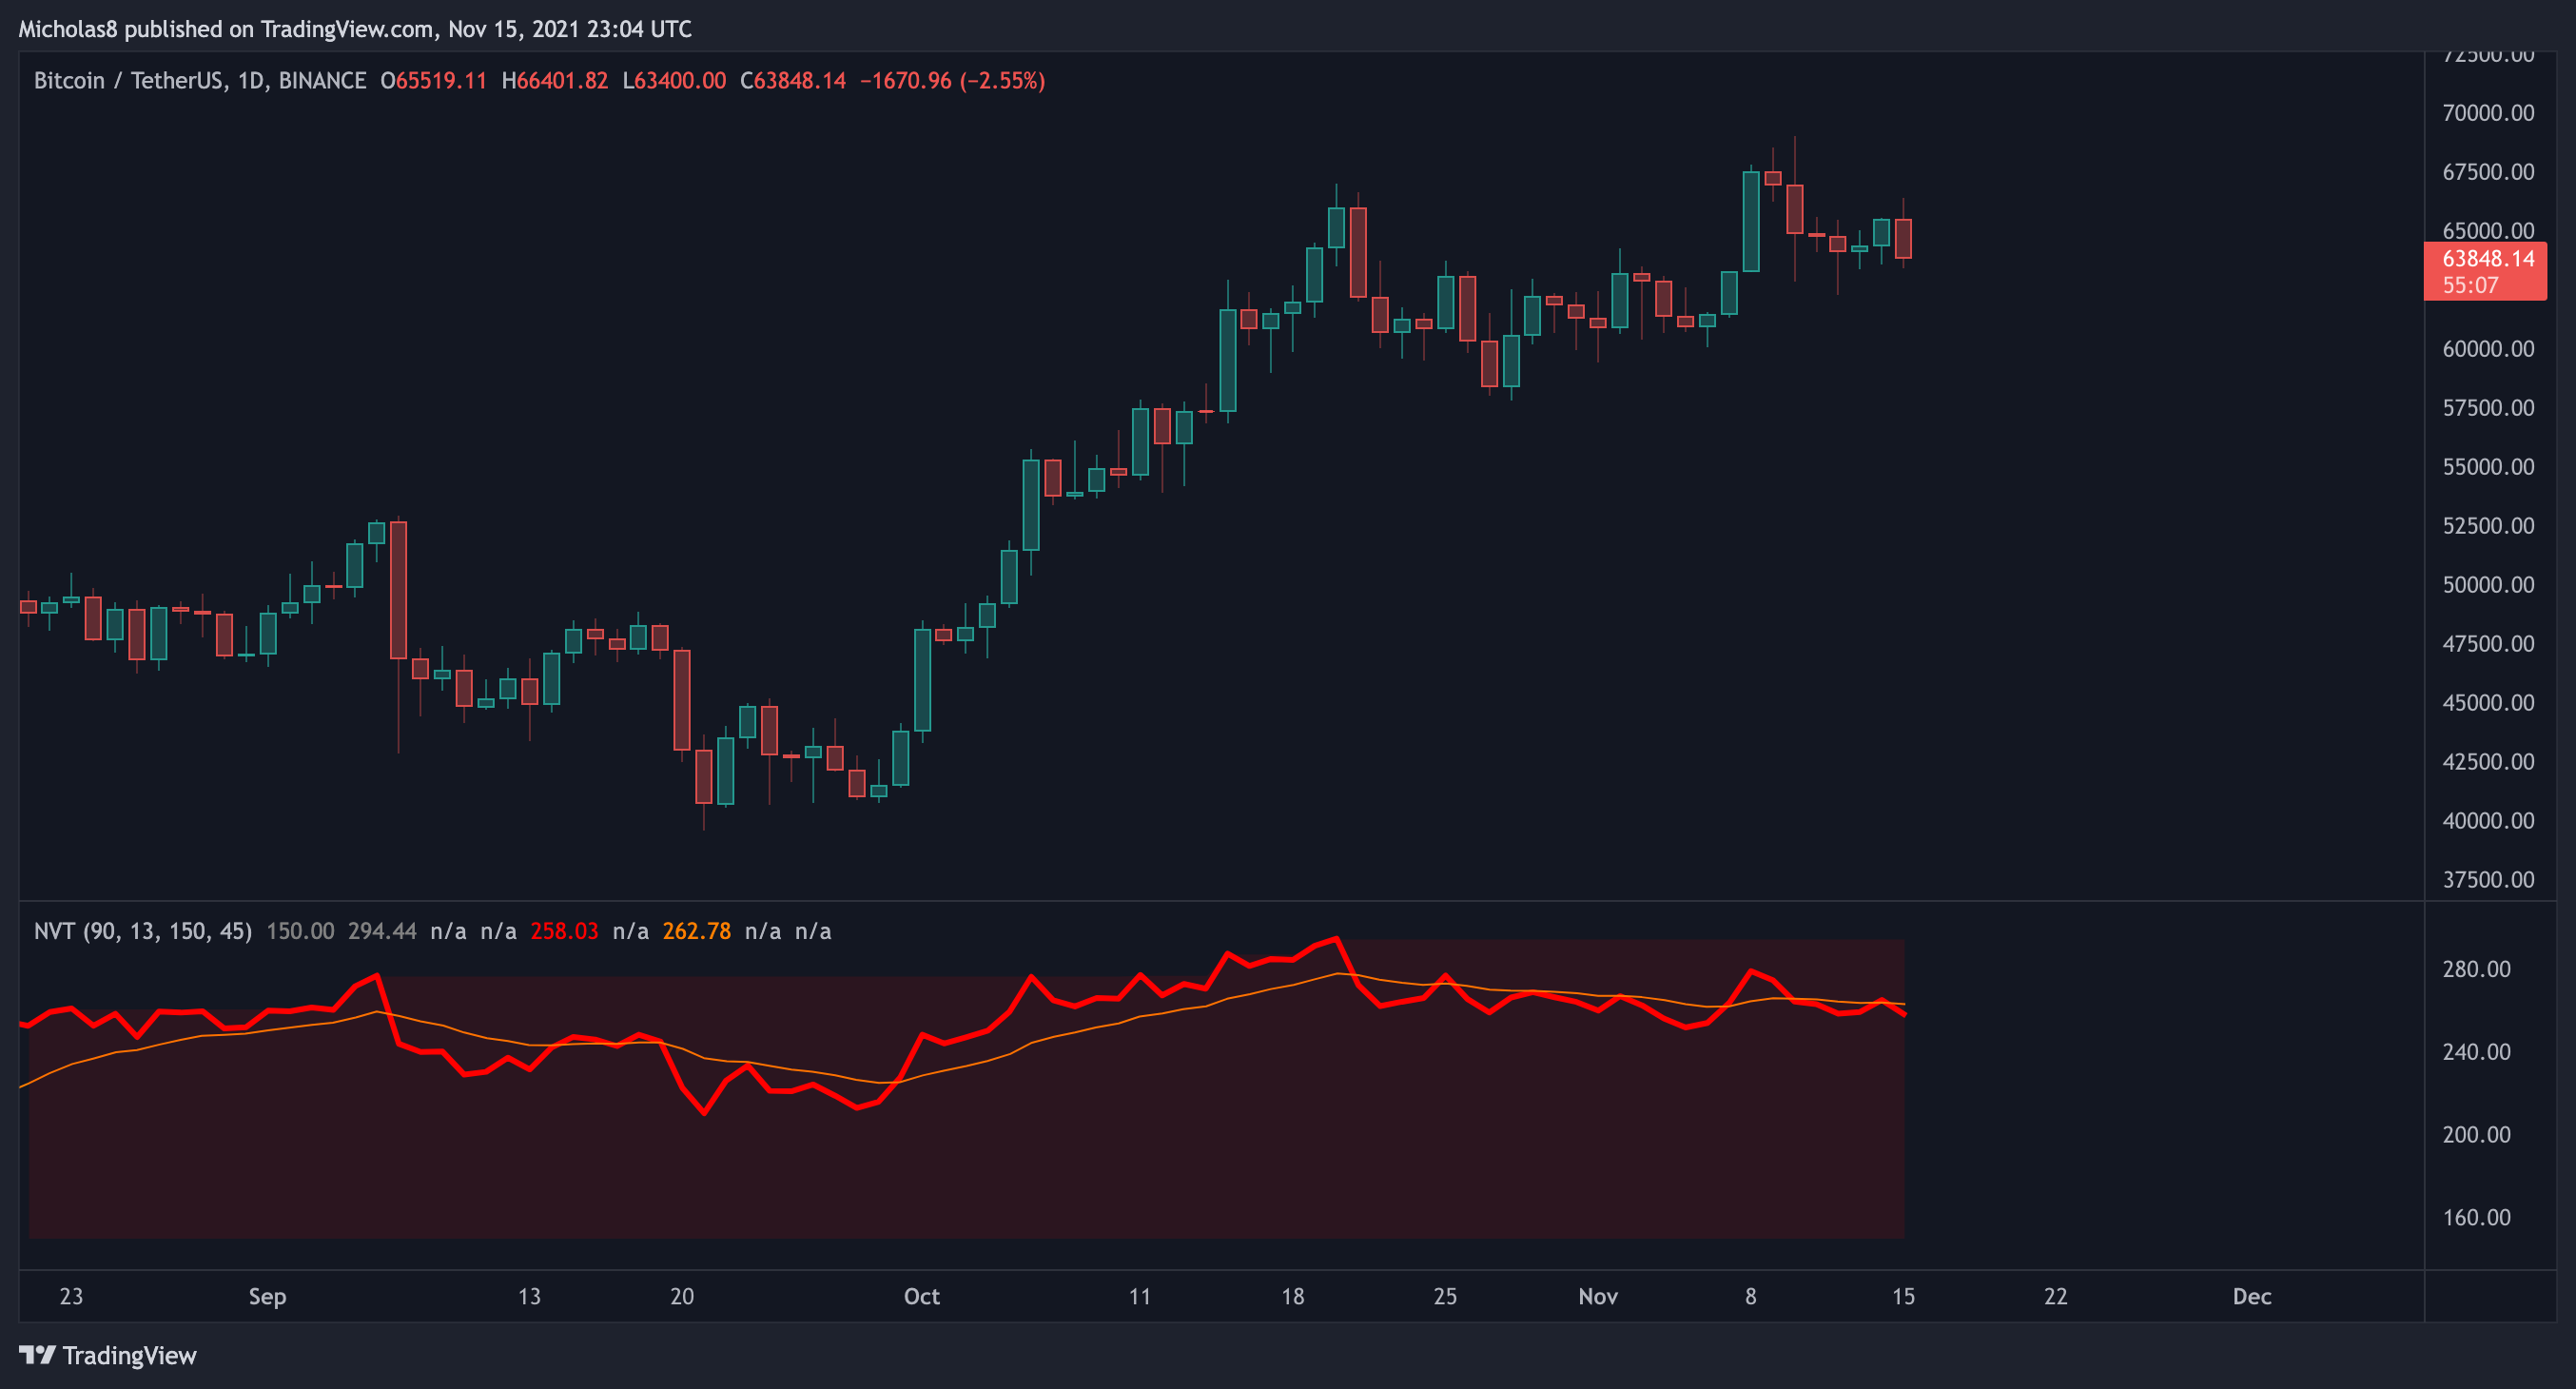
*This indicator describes the relationship between market cap and transfer volumes.
Bitcoin has lost the NVT Signal Line as support. Typically when this happens, Bitcoin sees a more sustained correction.
Divergences
Bearish Divergence (red)
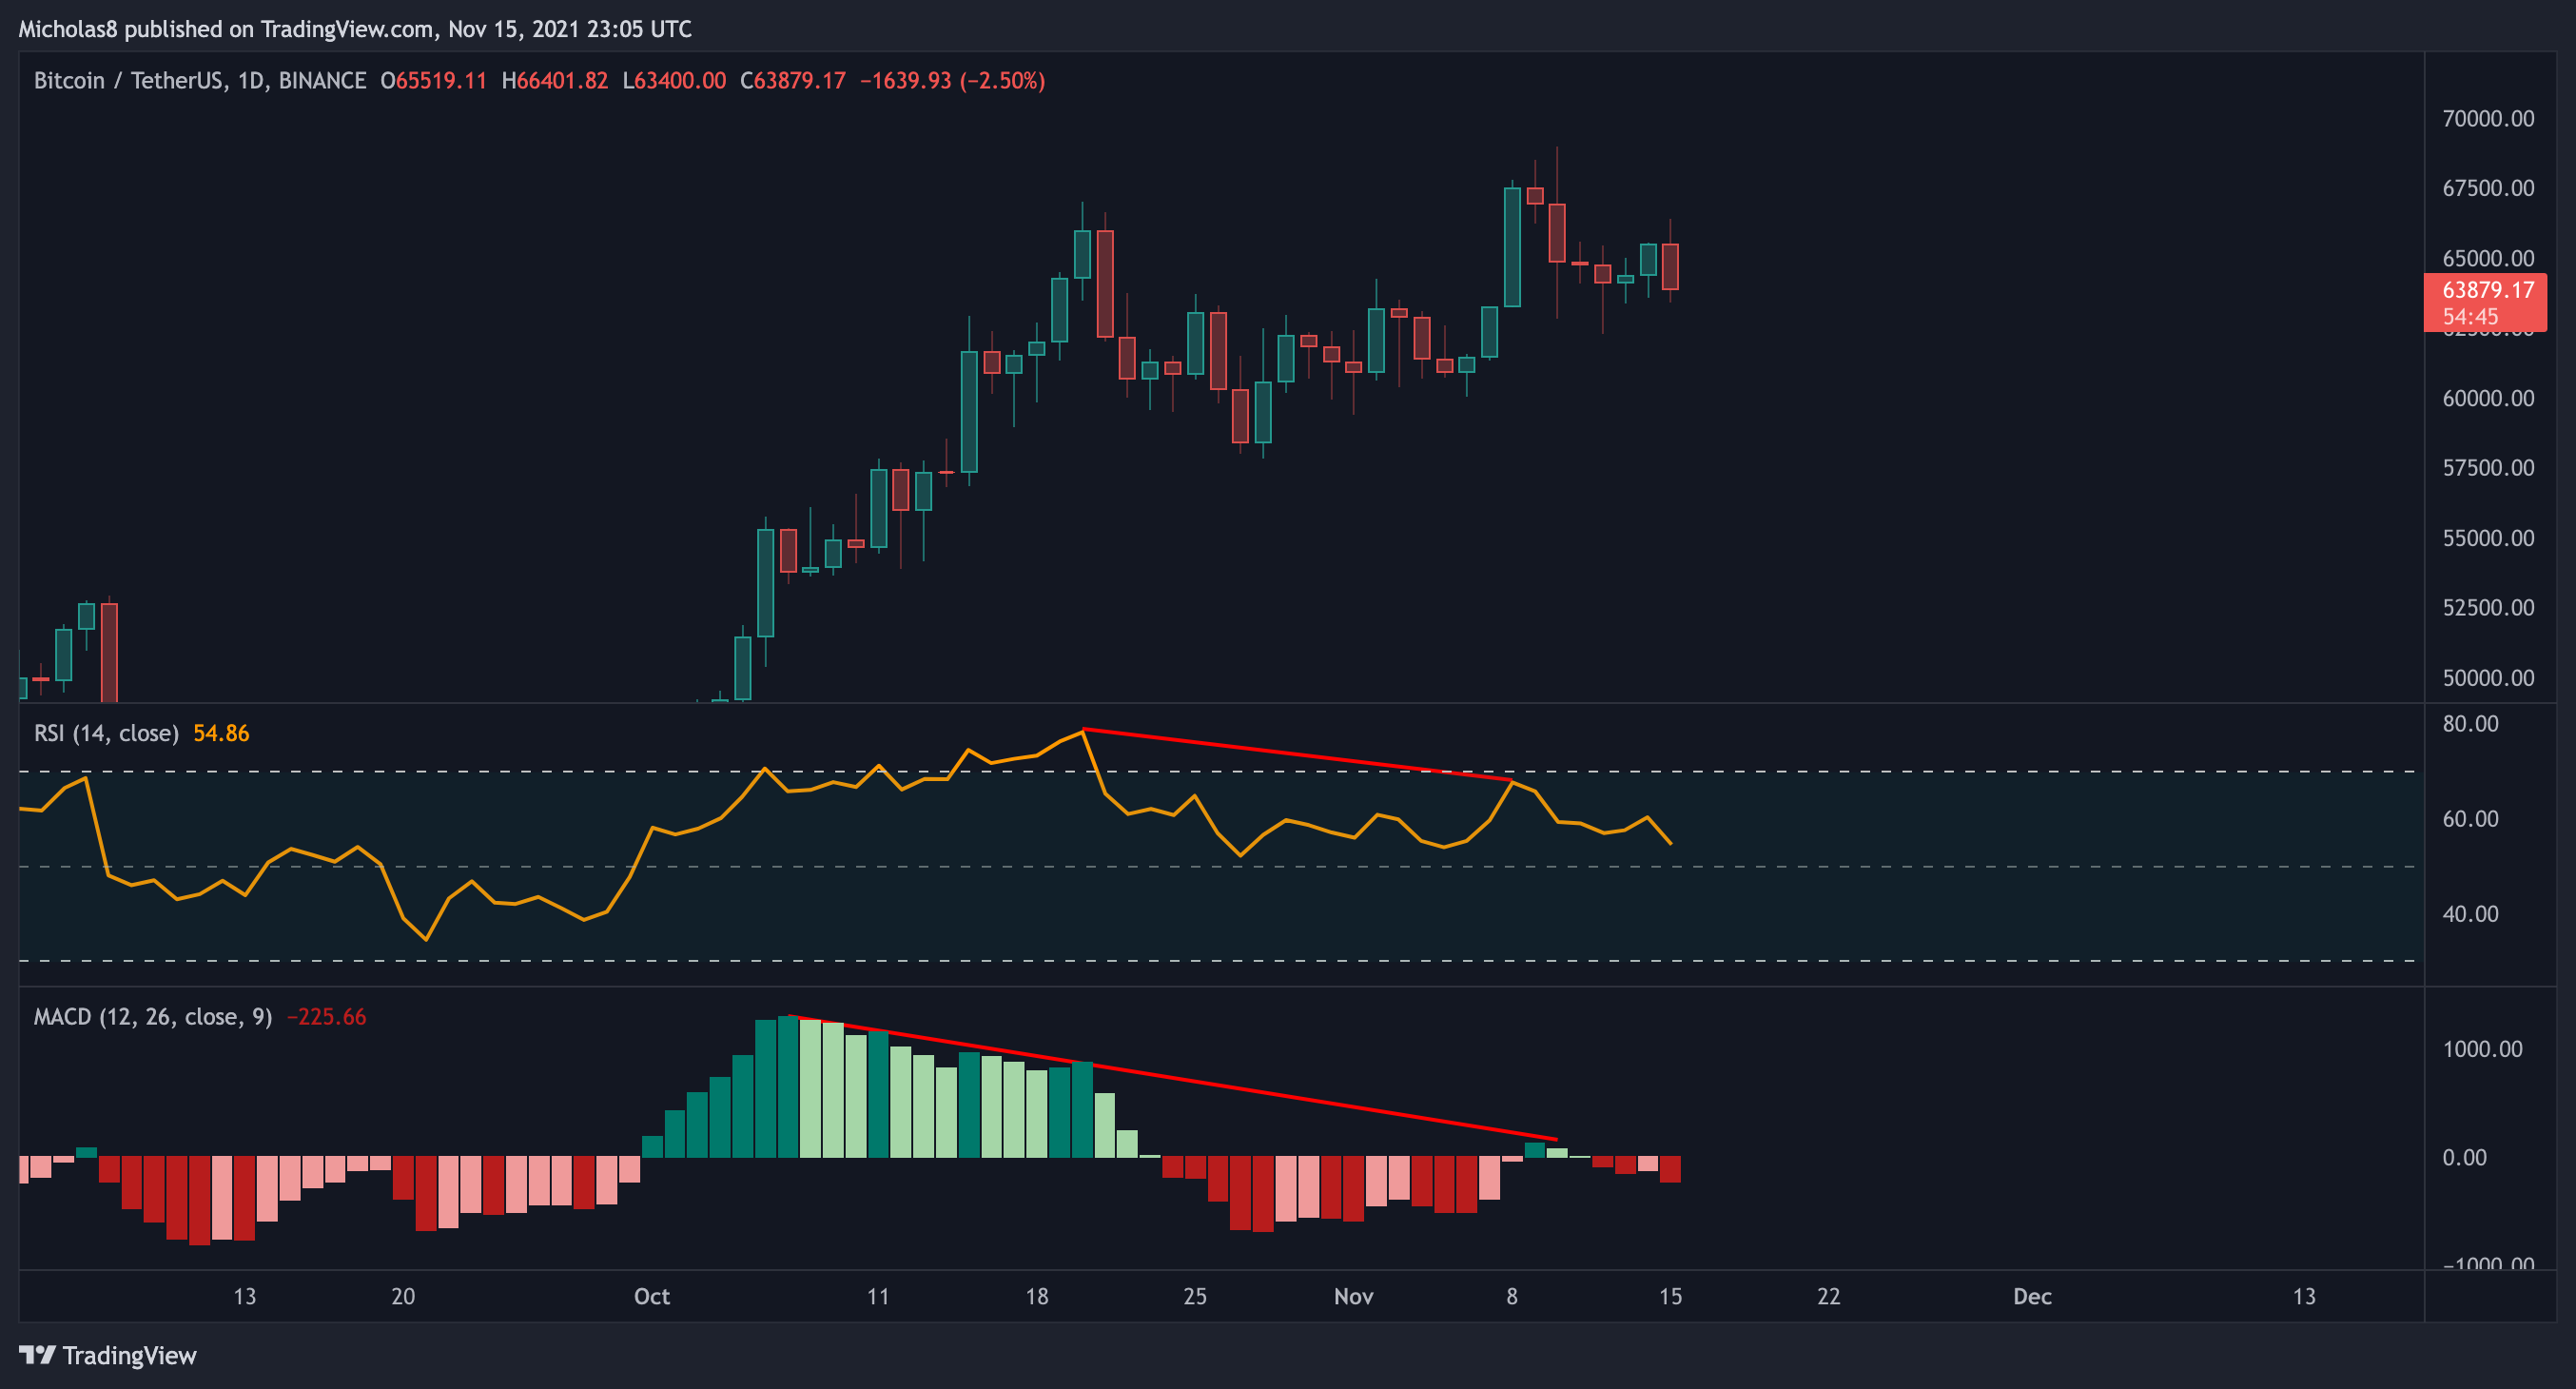
Bitcoin has a higher high in price, with a lower high on the RSI/MACD. This is a bearish divergence, which signals a possible trend reversal. In this case, that means down.
Note: The higher the timeframe, the longer divergences take to develop and play out.
Invalidation: Higher high in price, with a higher high on the RSI/MACD.
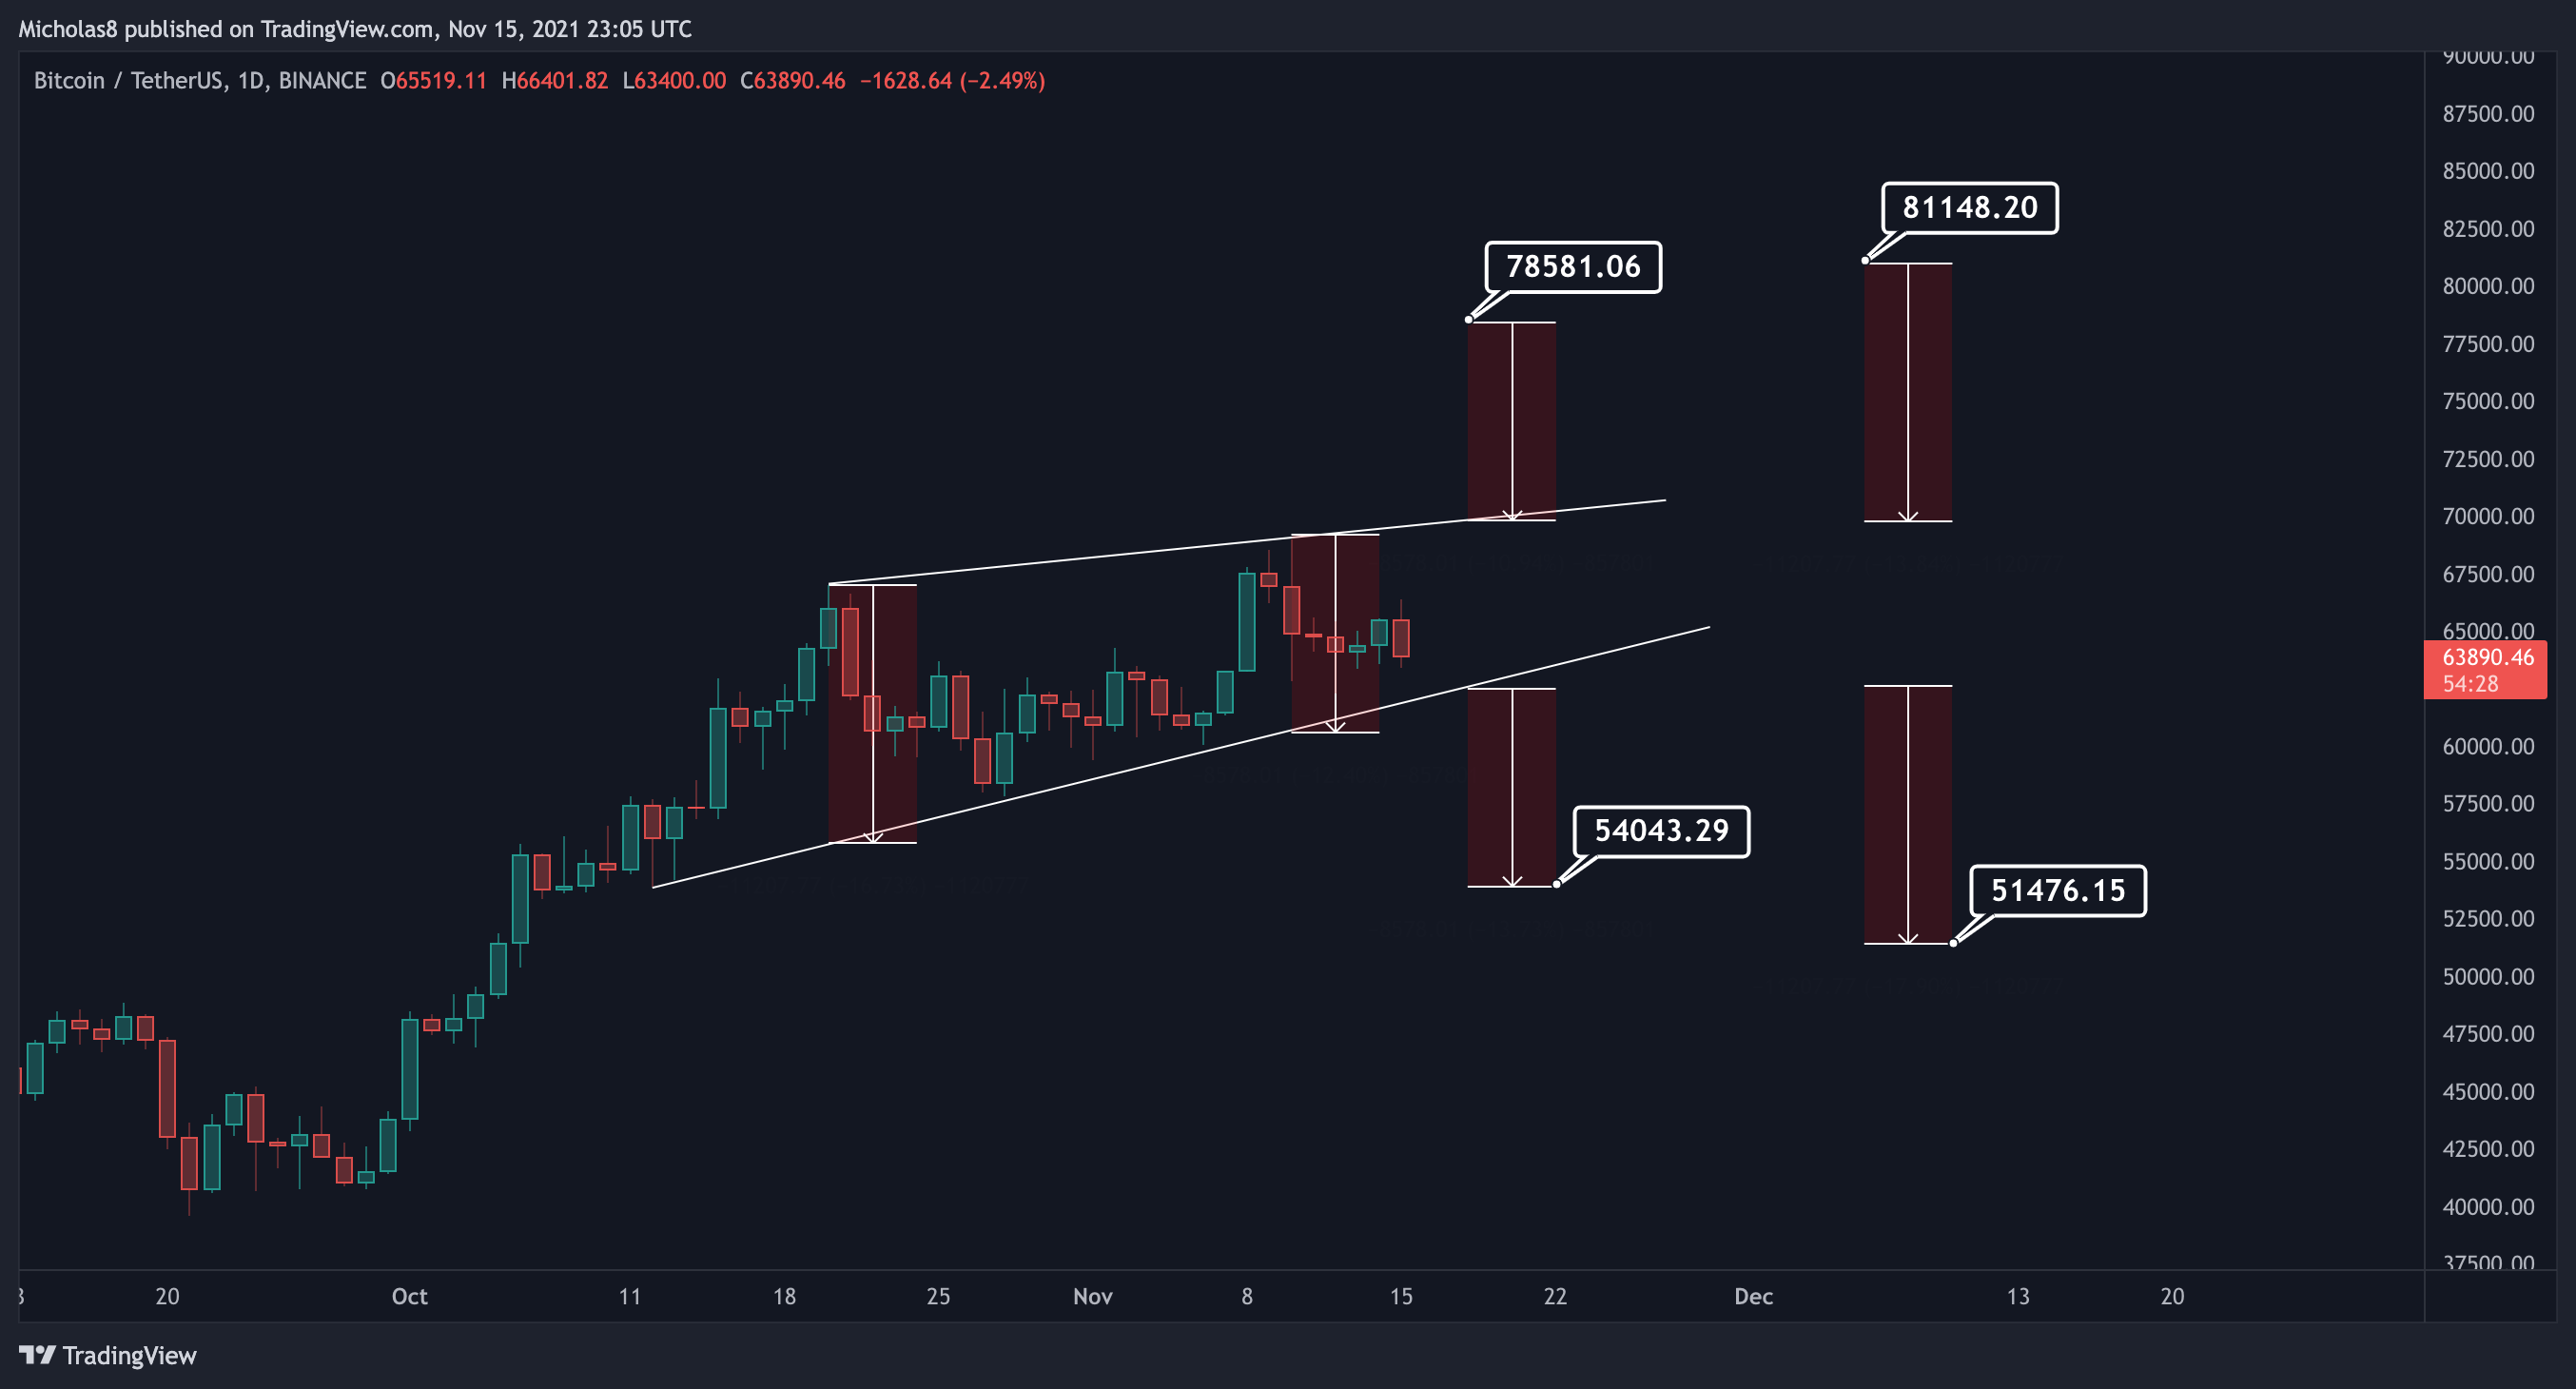
Patterns
*Please note not all technical targets will be hit, so be aware of all key levels and Fibonacci Levels, and also look out for divergences as they have the power to reverse a trend
Rising Wedge
4H Timeframe
EMA Ribbon
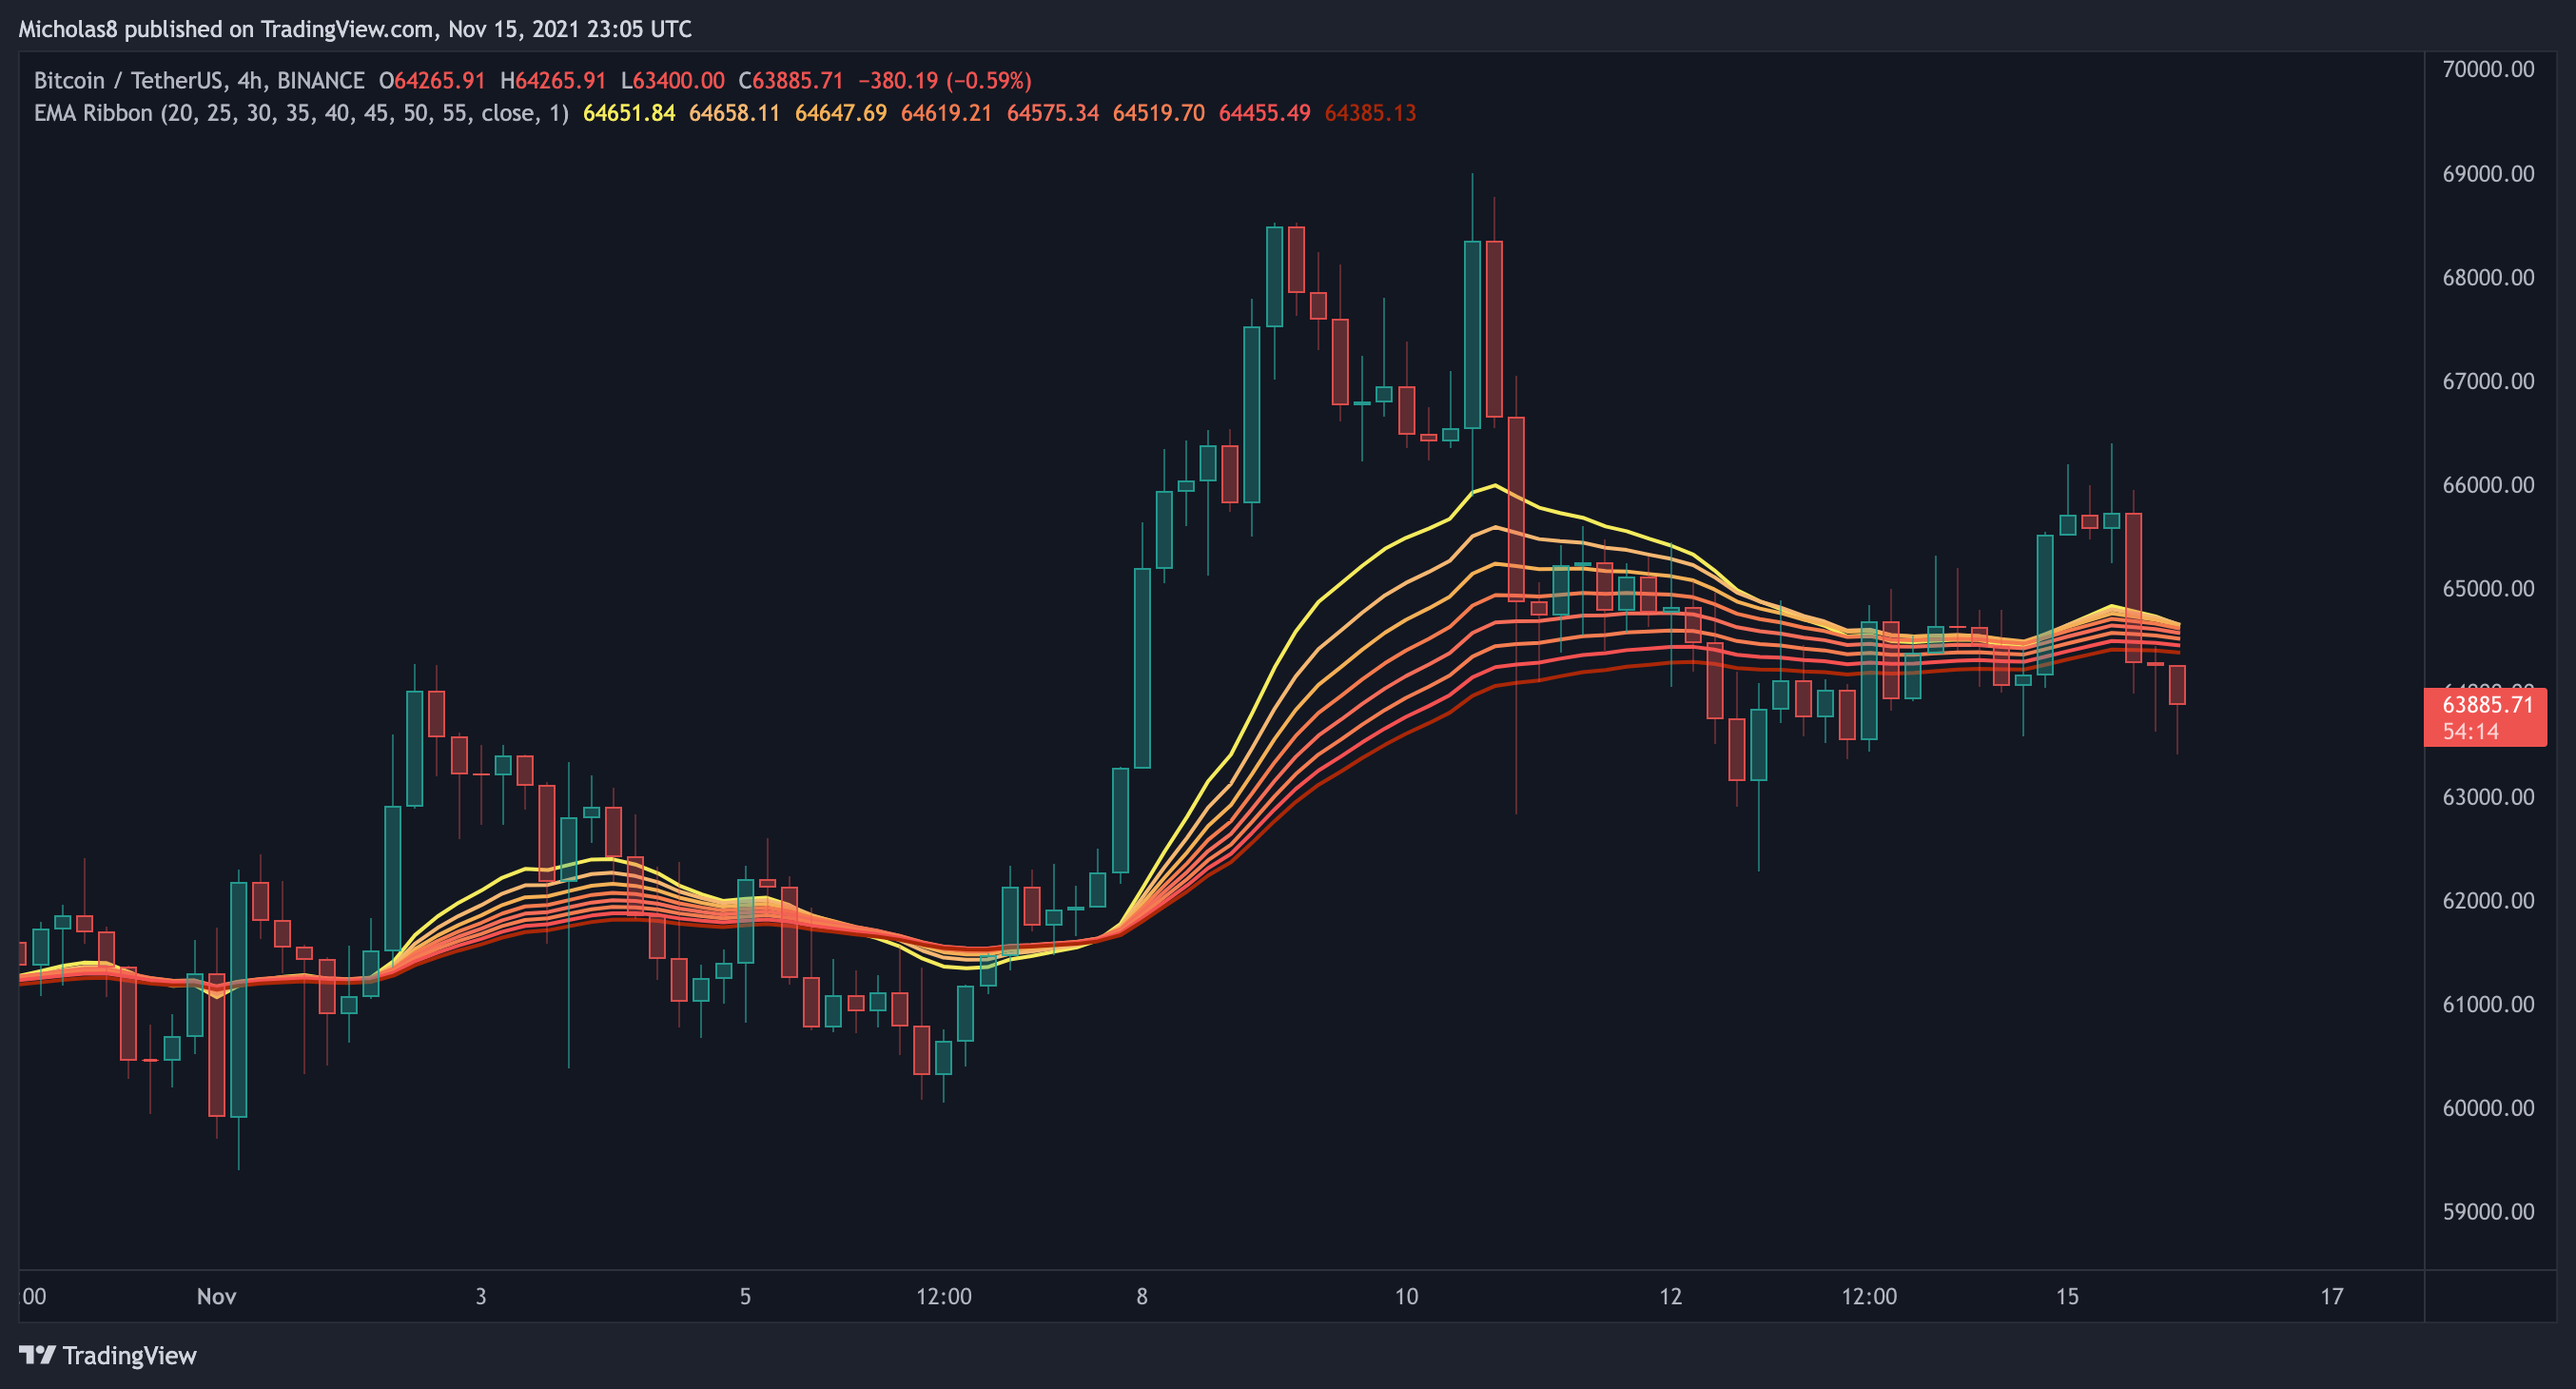
Bitcoin has fallen below the EMA ribbon.
Implication: Momentum is with the bears. Keep in mind, the narrower the ribbon the weaker it serves as support/resistance.
Simple Moving Average (SMA): 20 and 50
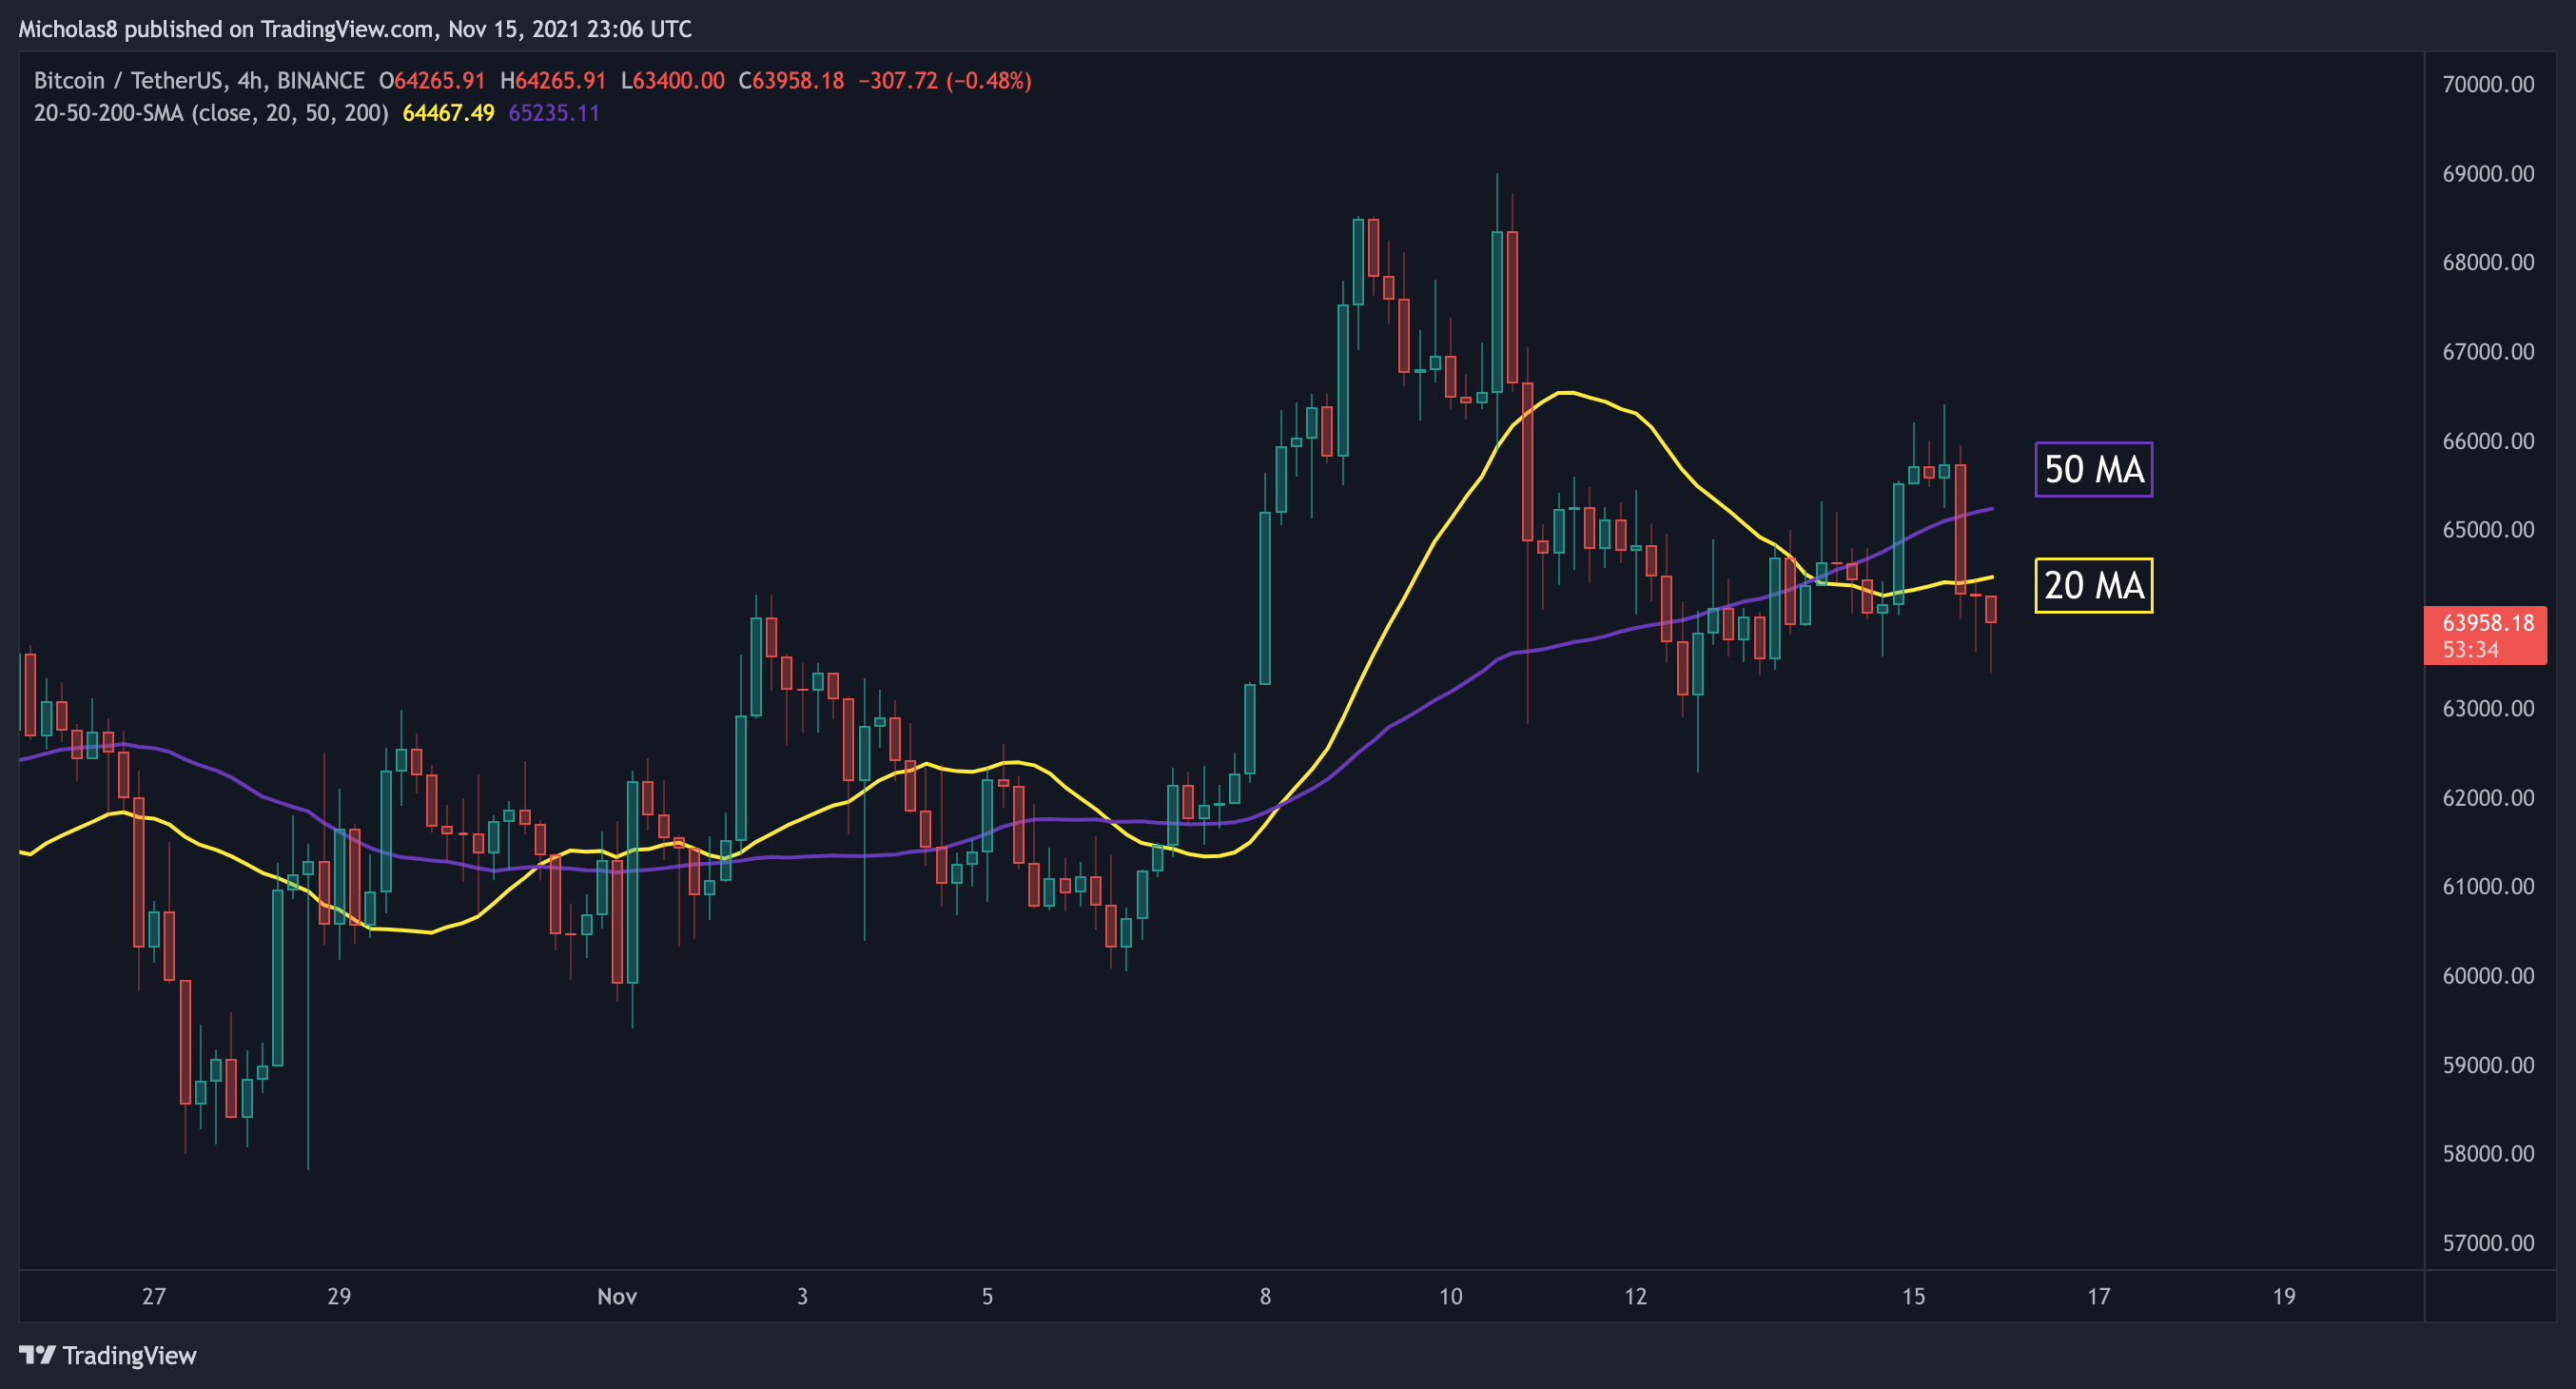
Bitcoin is currently finding resistance from these two SMAs.
Implication: They may continue serving as resistance for the foreseeable future.
1H Timeframe
EMA Ribbon
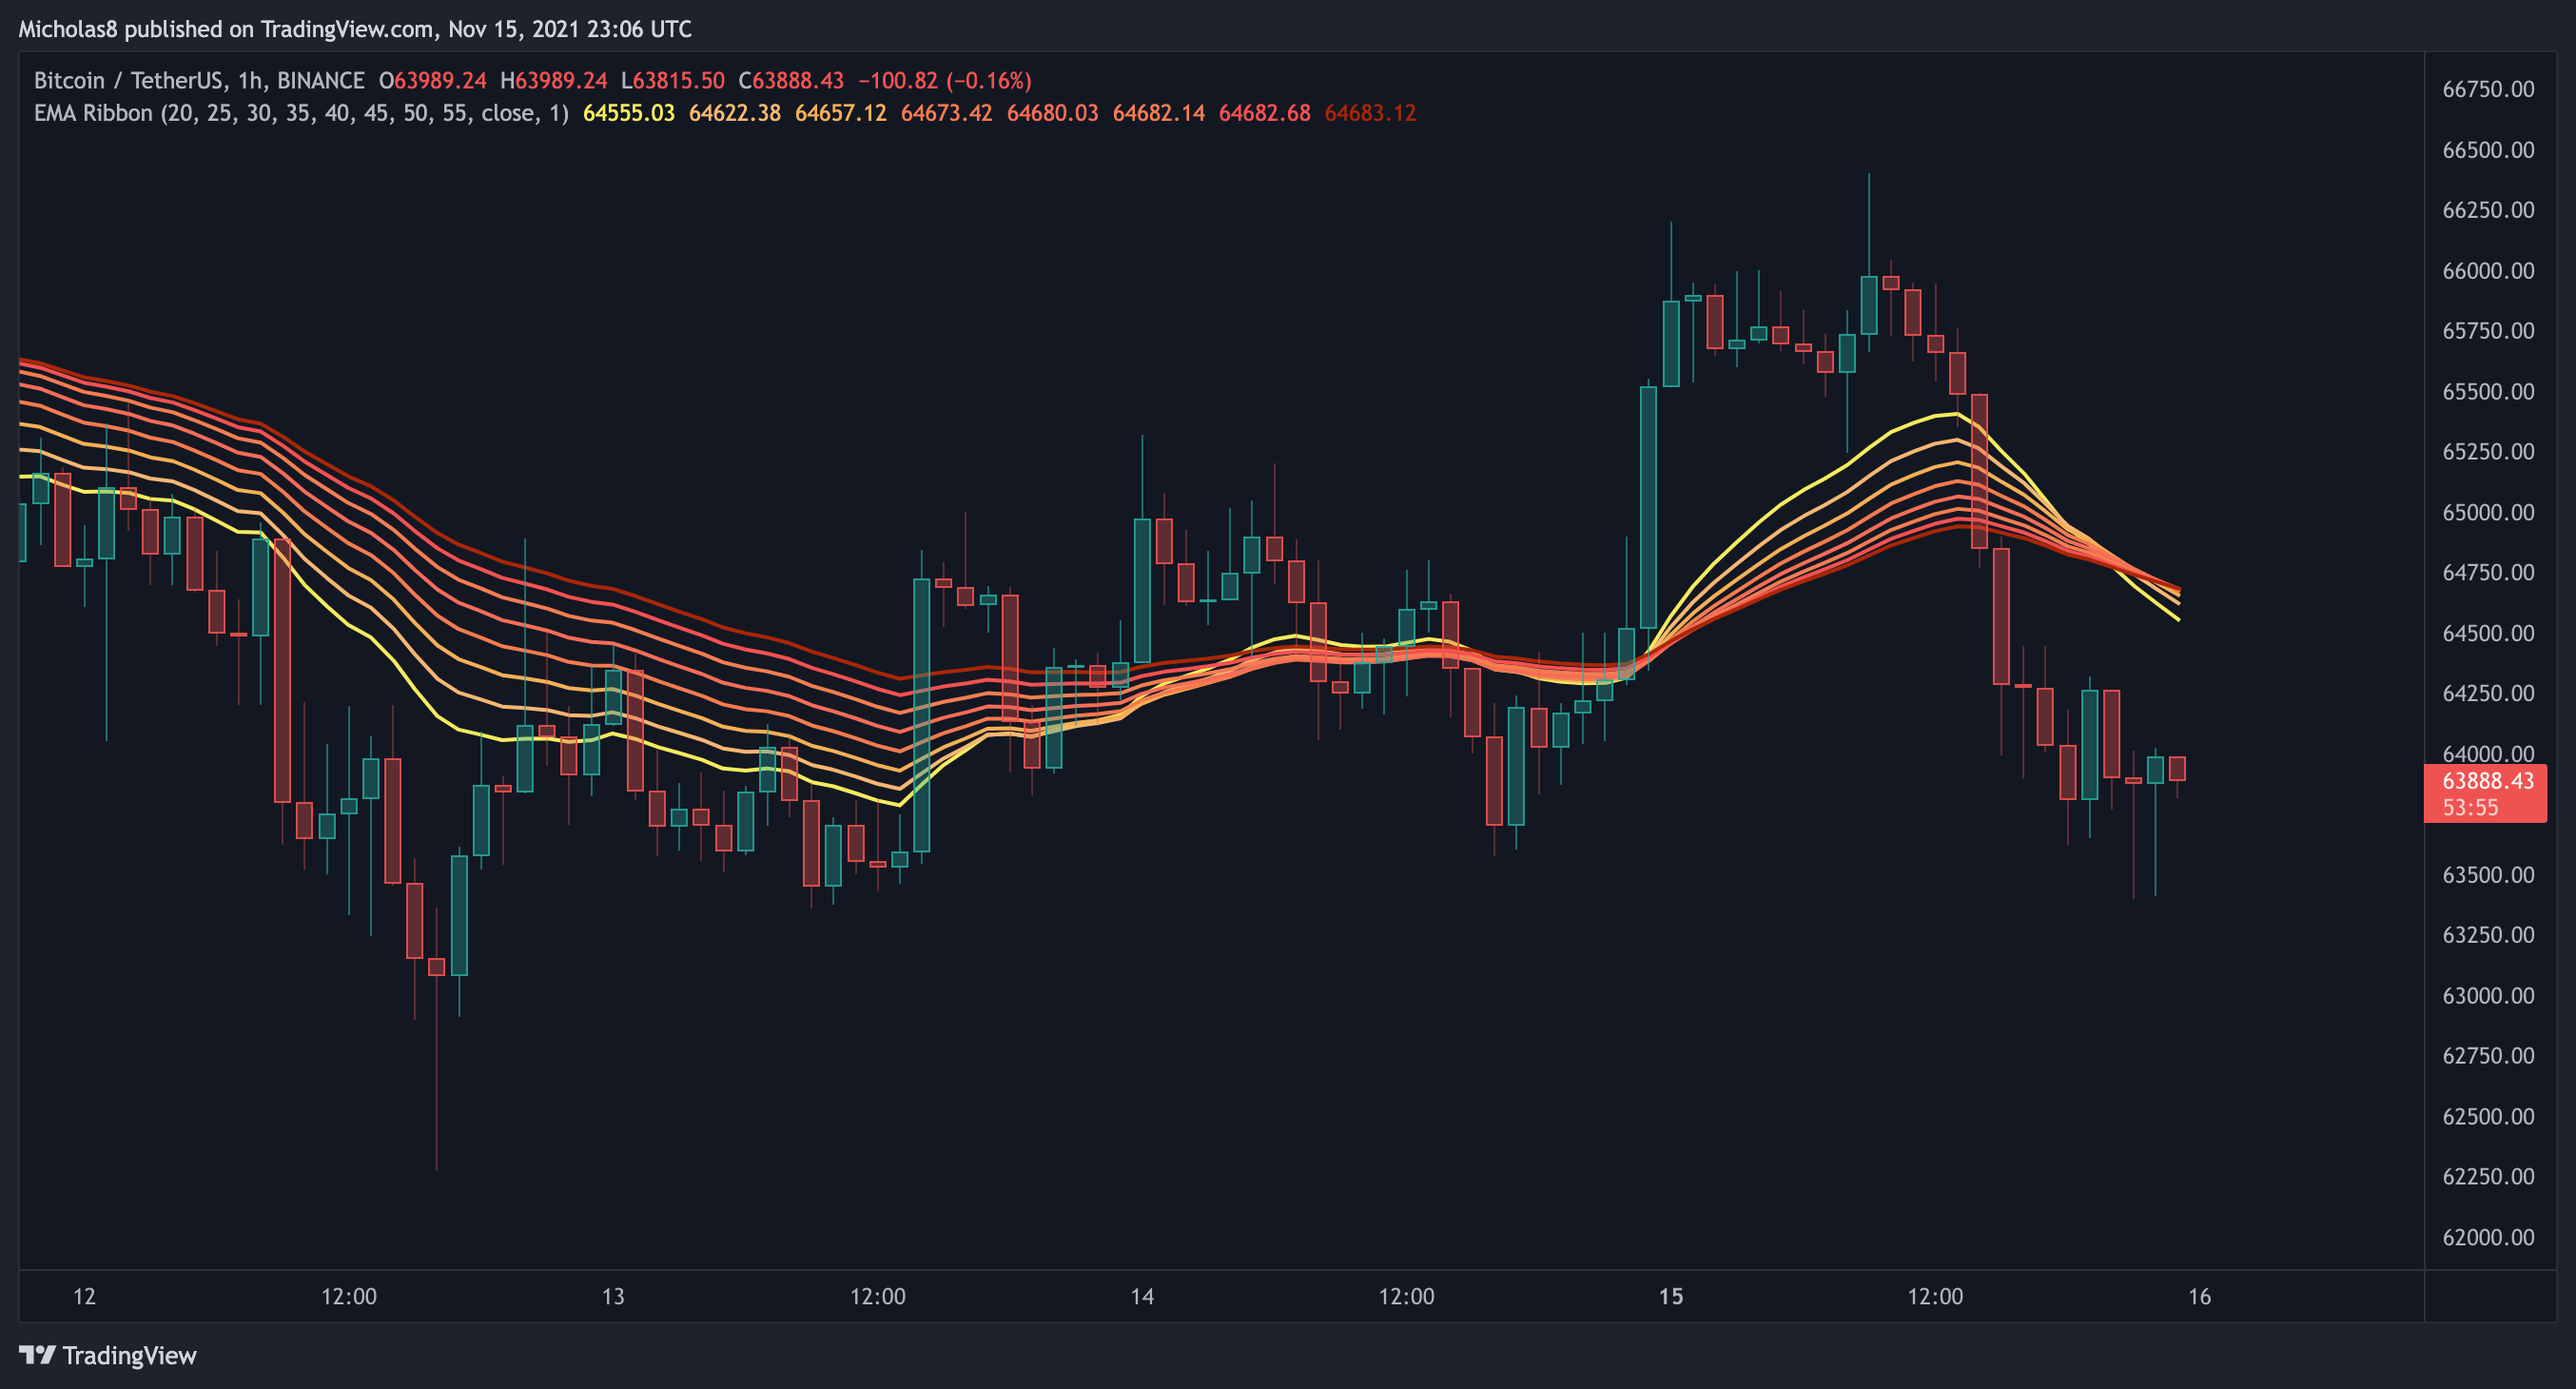
Bitcoin has fallen below the EMA ribbon.
Implication: Momentum is with the bears. Keep in mind, the narrower the ribbon the weaker it serves as support/resistance.
CME GAPS
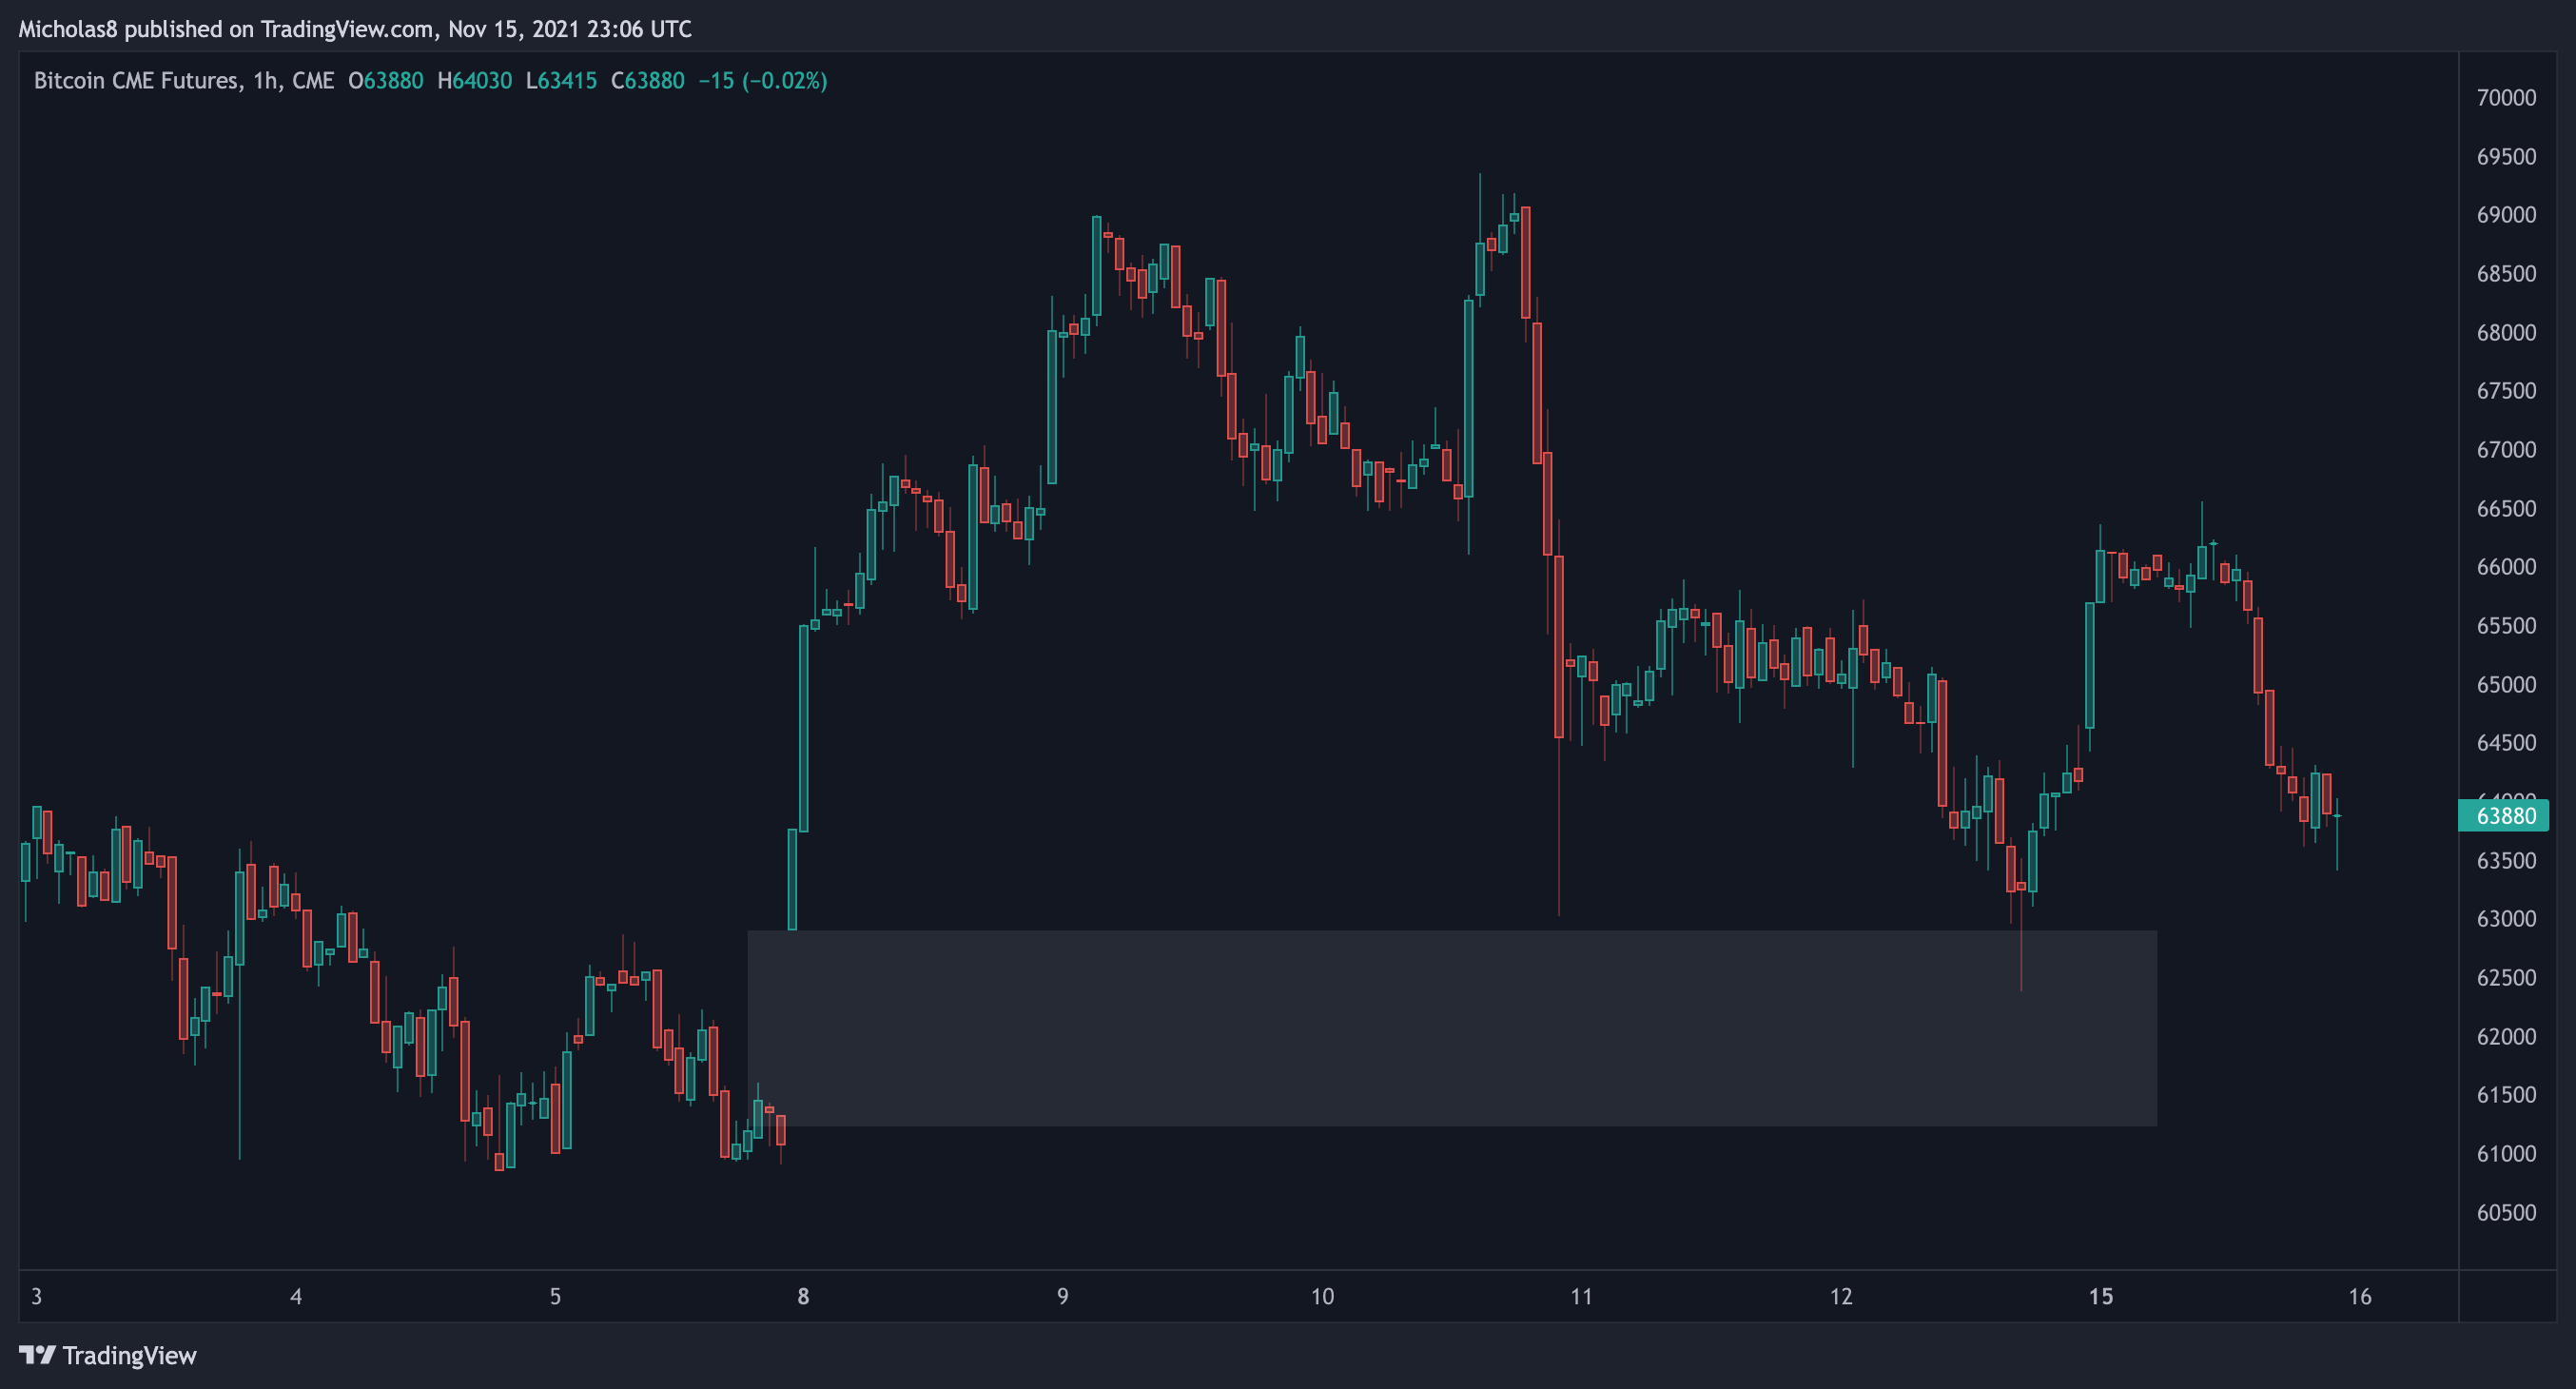
The gap below us at 32480 is still open. Although not all gaps fill, they do tend to, which is why I'm still including this gap as something to be aware of.
Gap at 61.2k.
Key Levels
Daily Timeframe
49490
51295
51755
52665
53950
54340
55315
55995
56670
57470
58415
58865
60330
60690
60940
61190
61285
61670
61860
62009
62250
63080
63220
63575
64125
64280
64885
65520
66000
67525
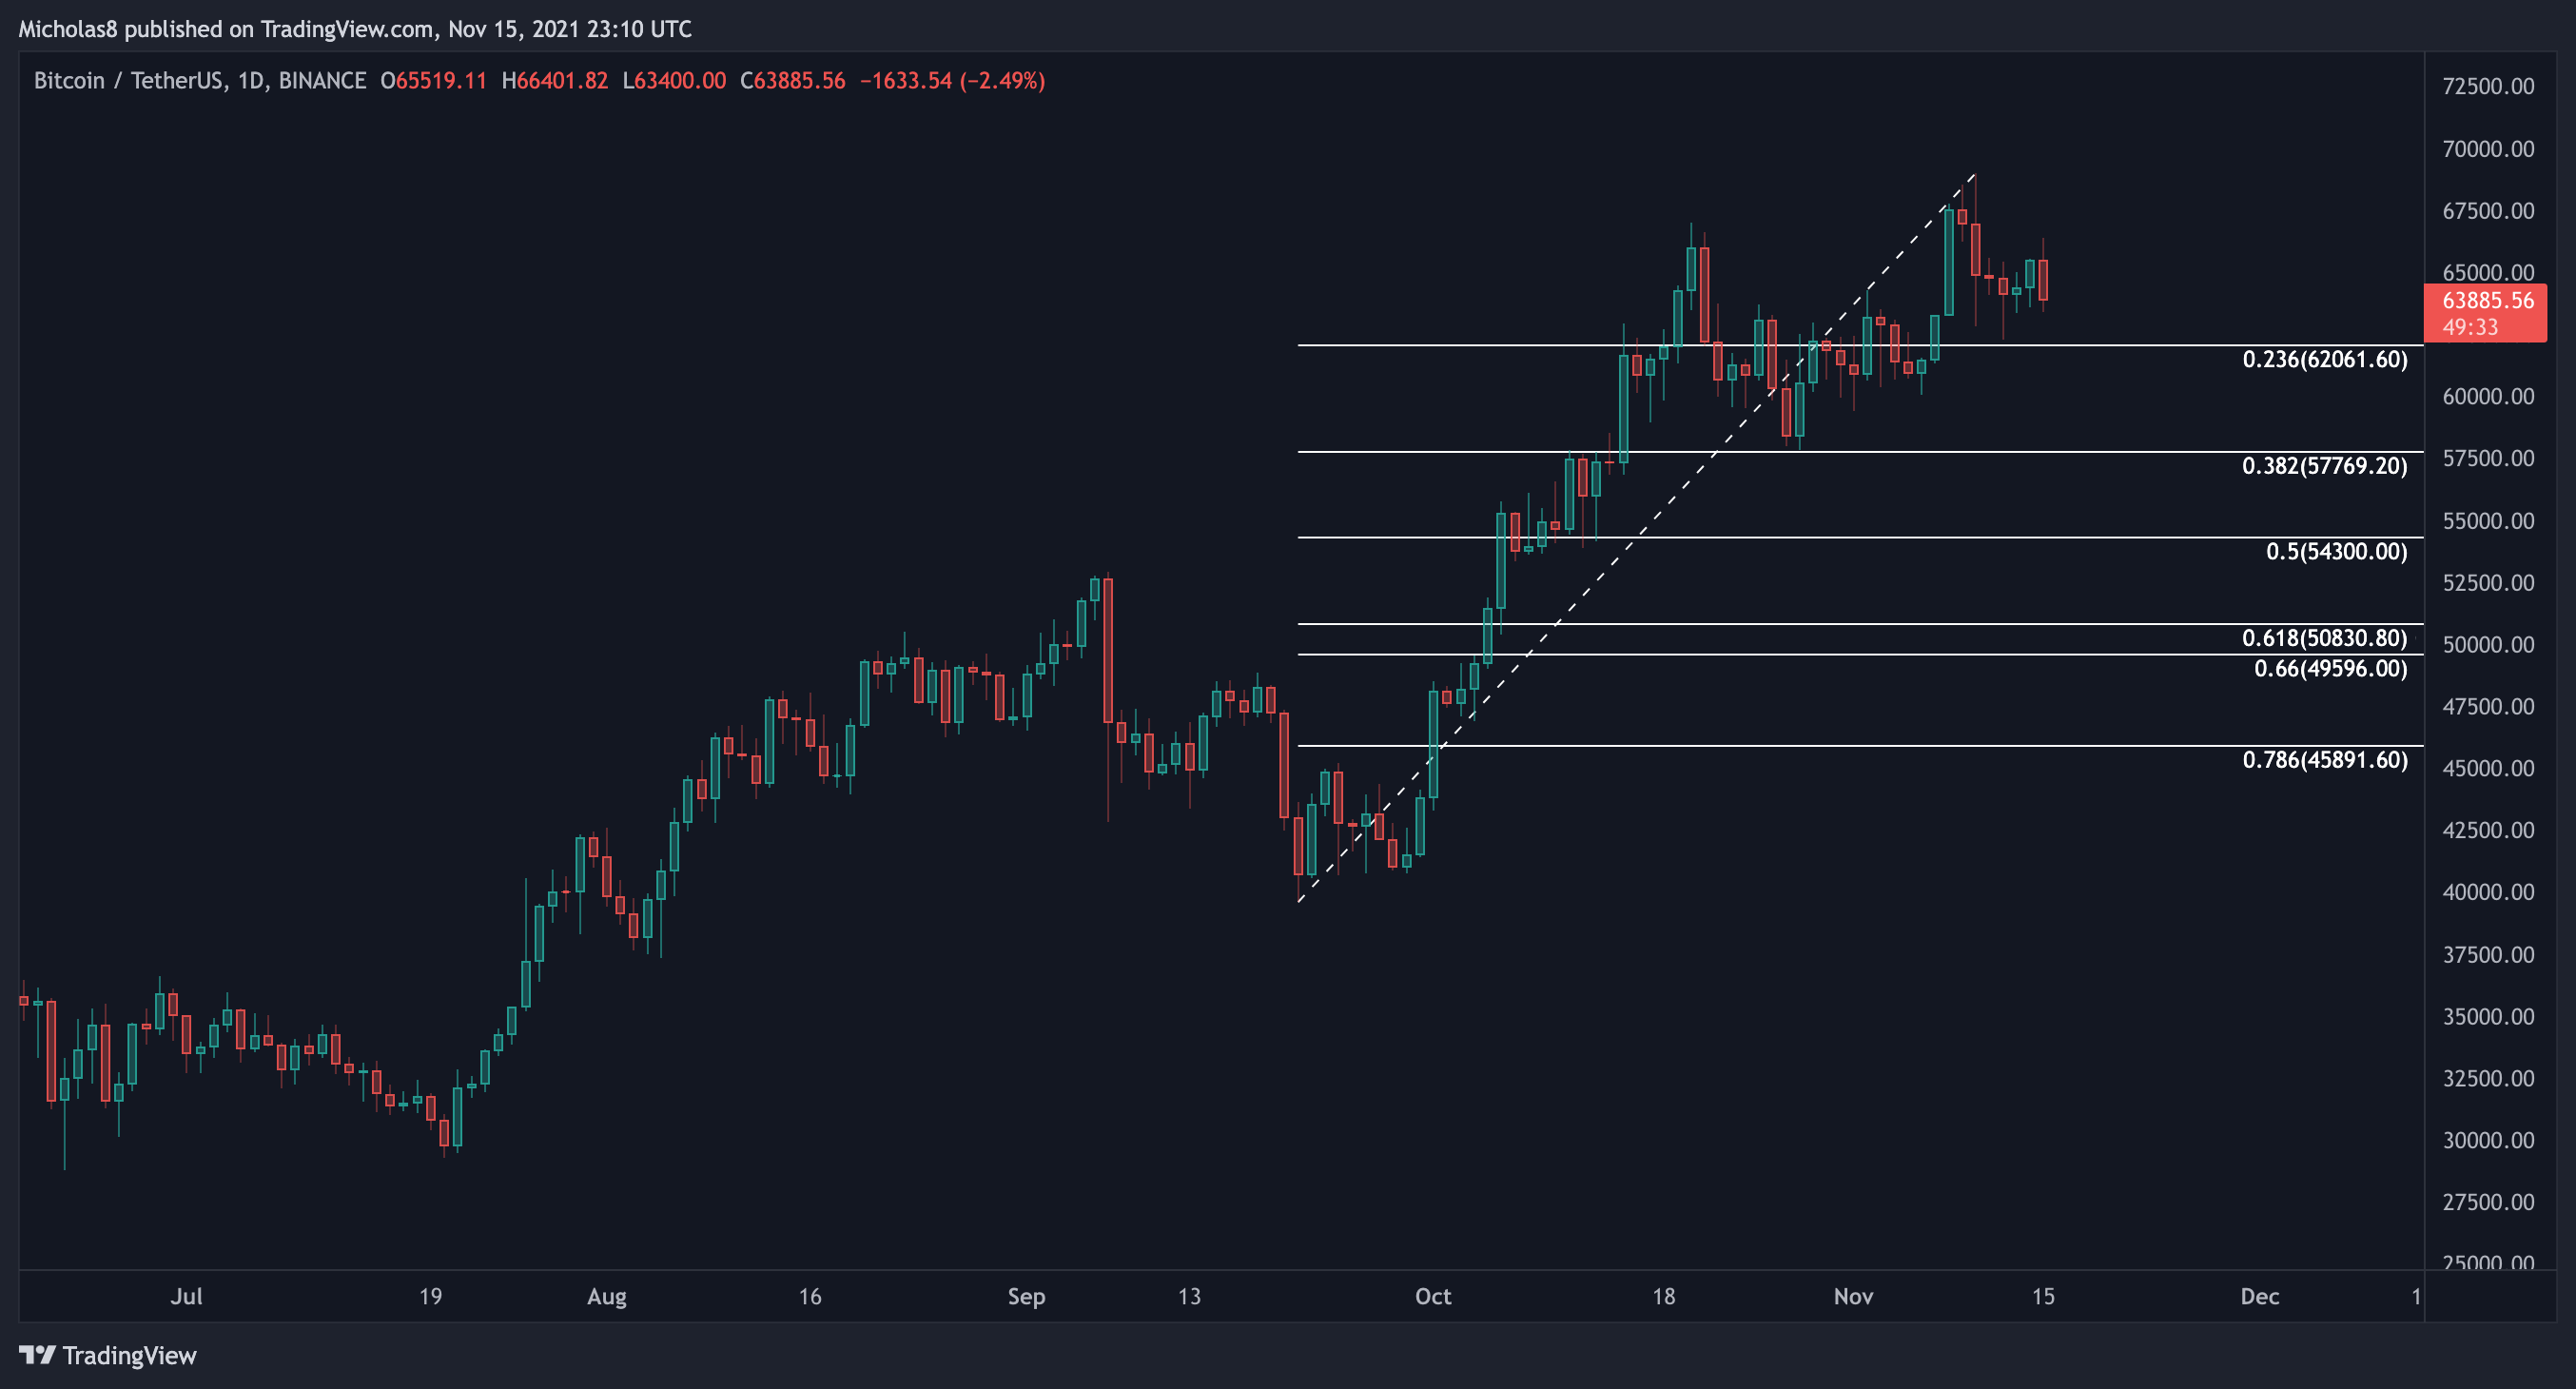
Fibonacci Levels
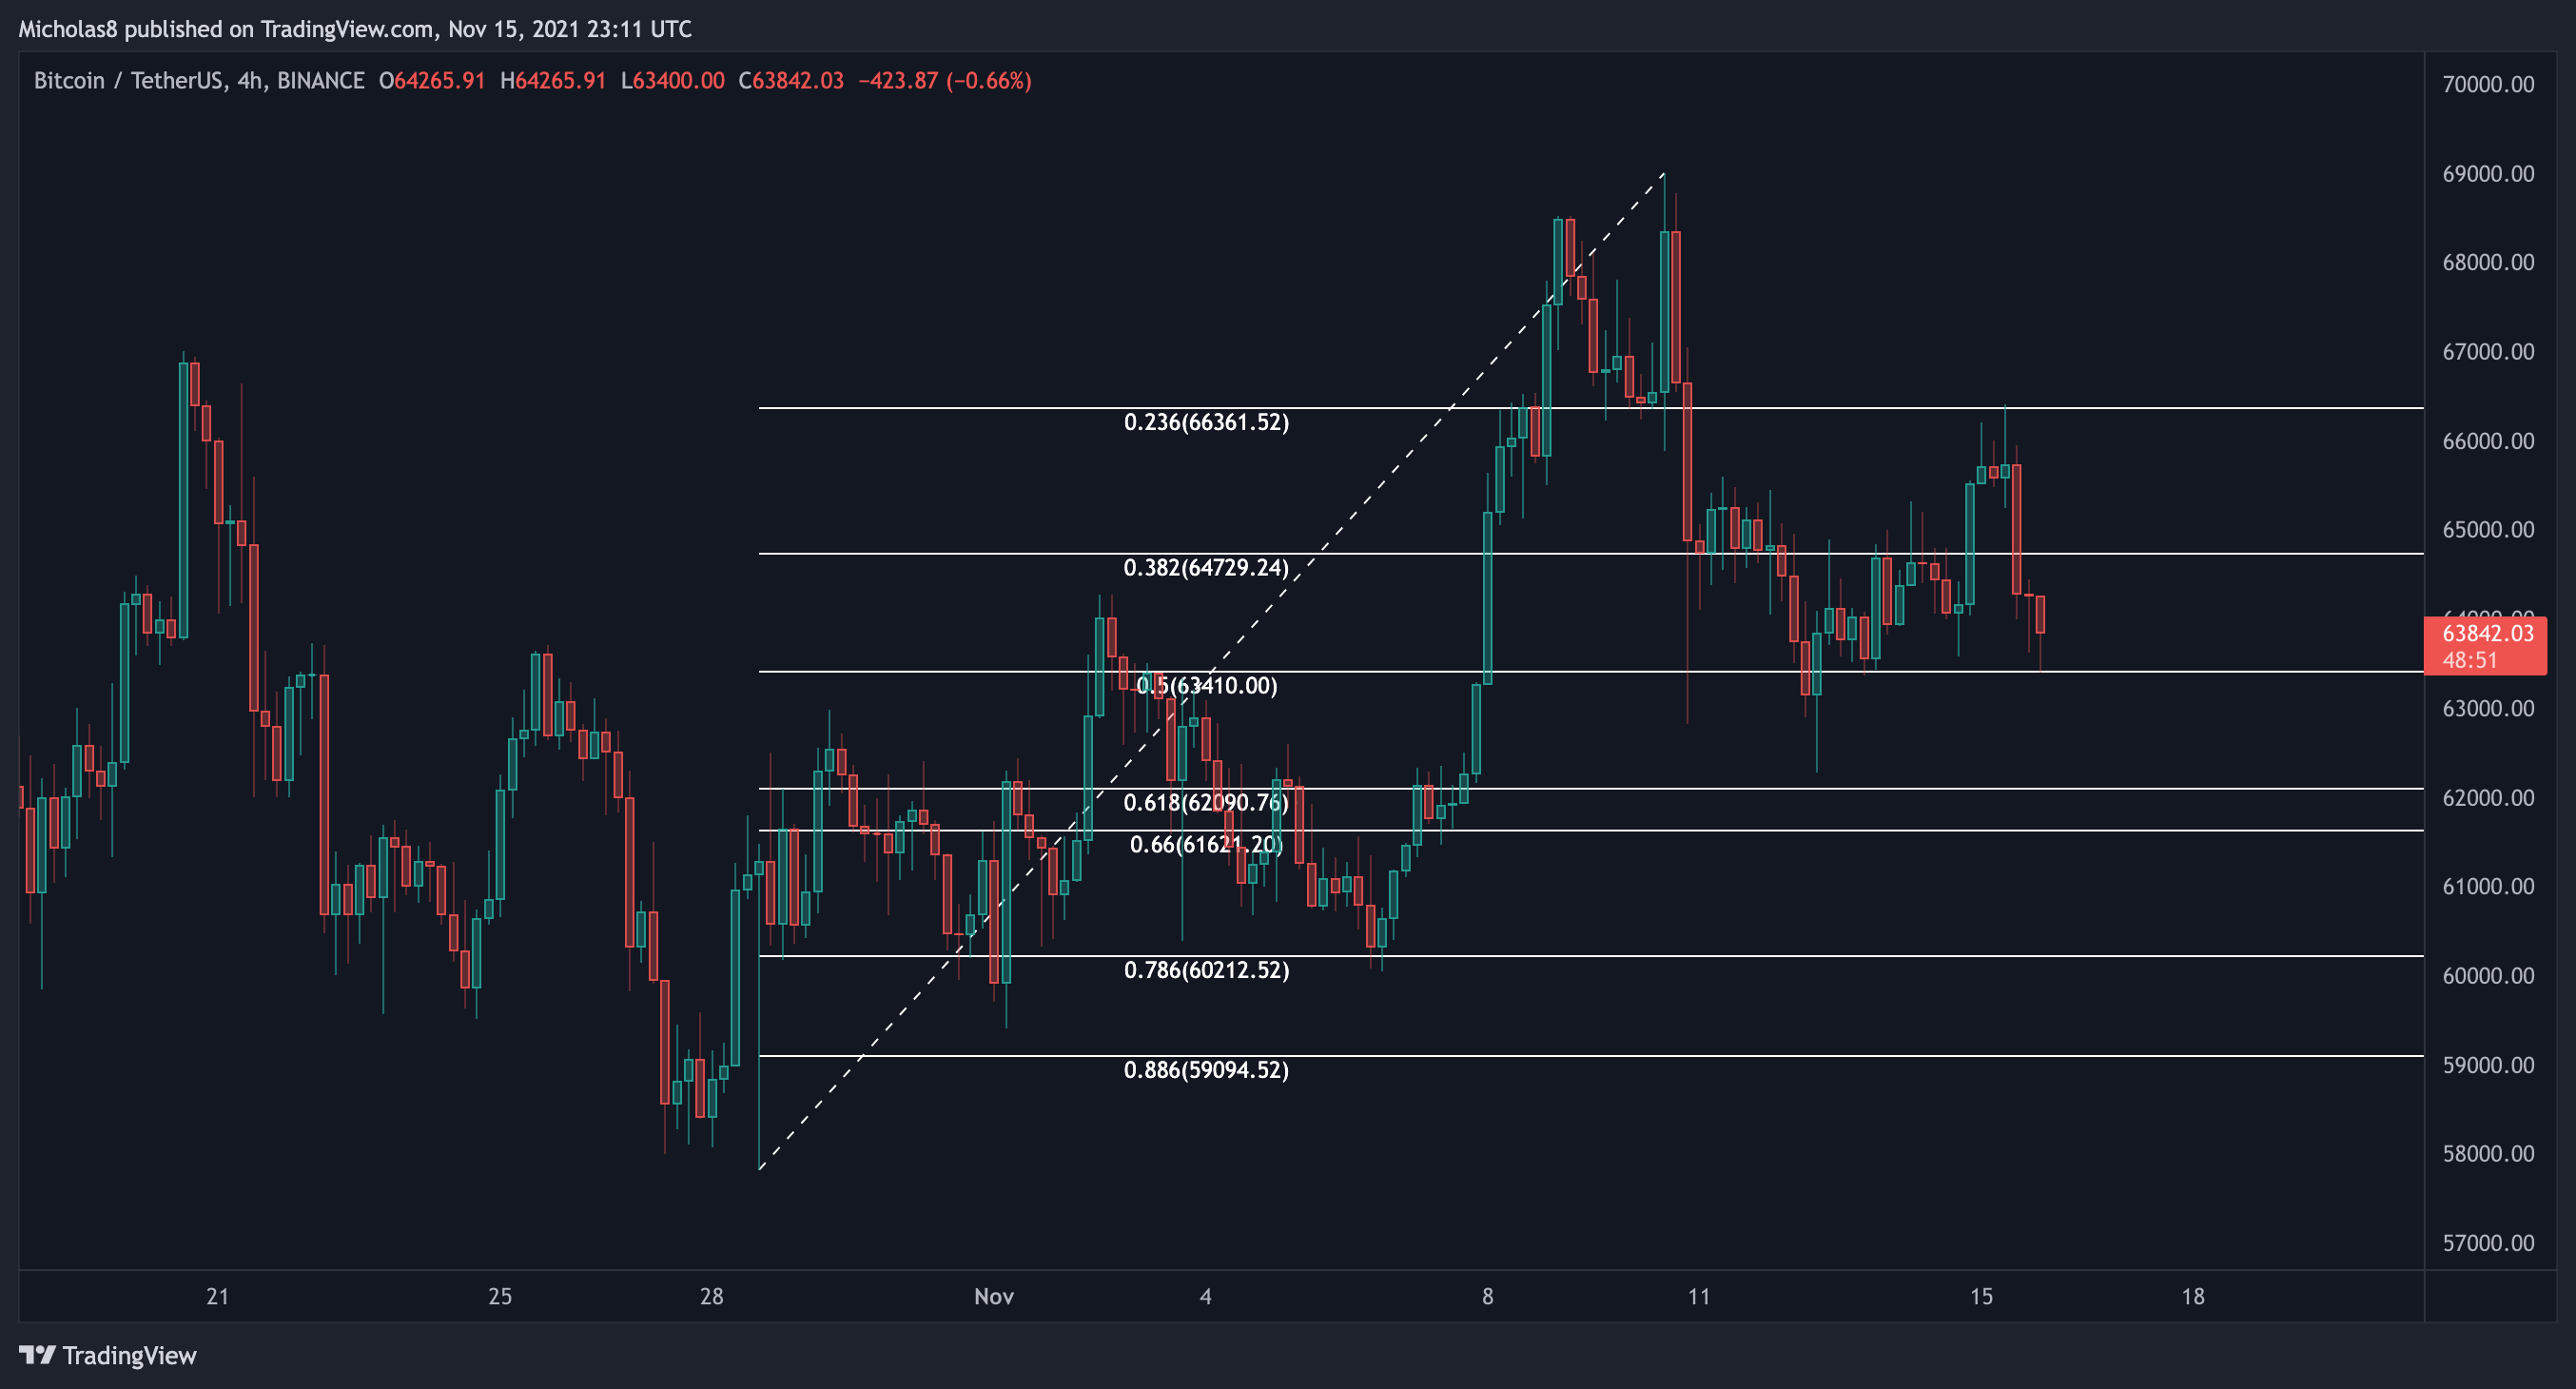
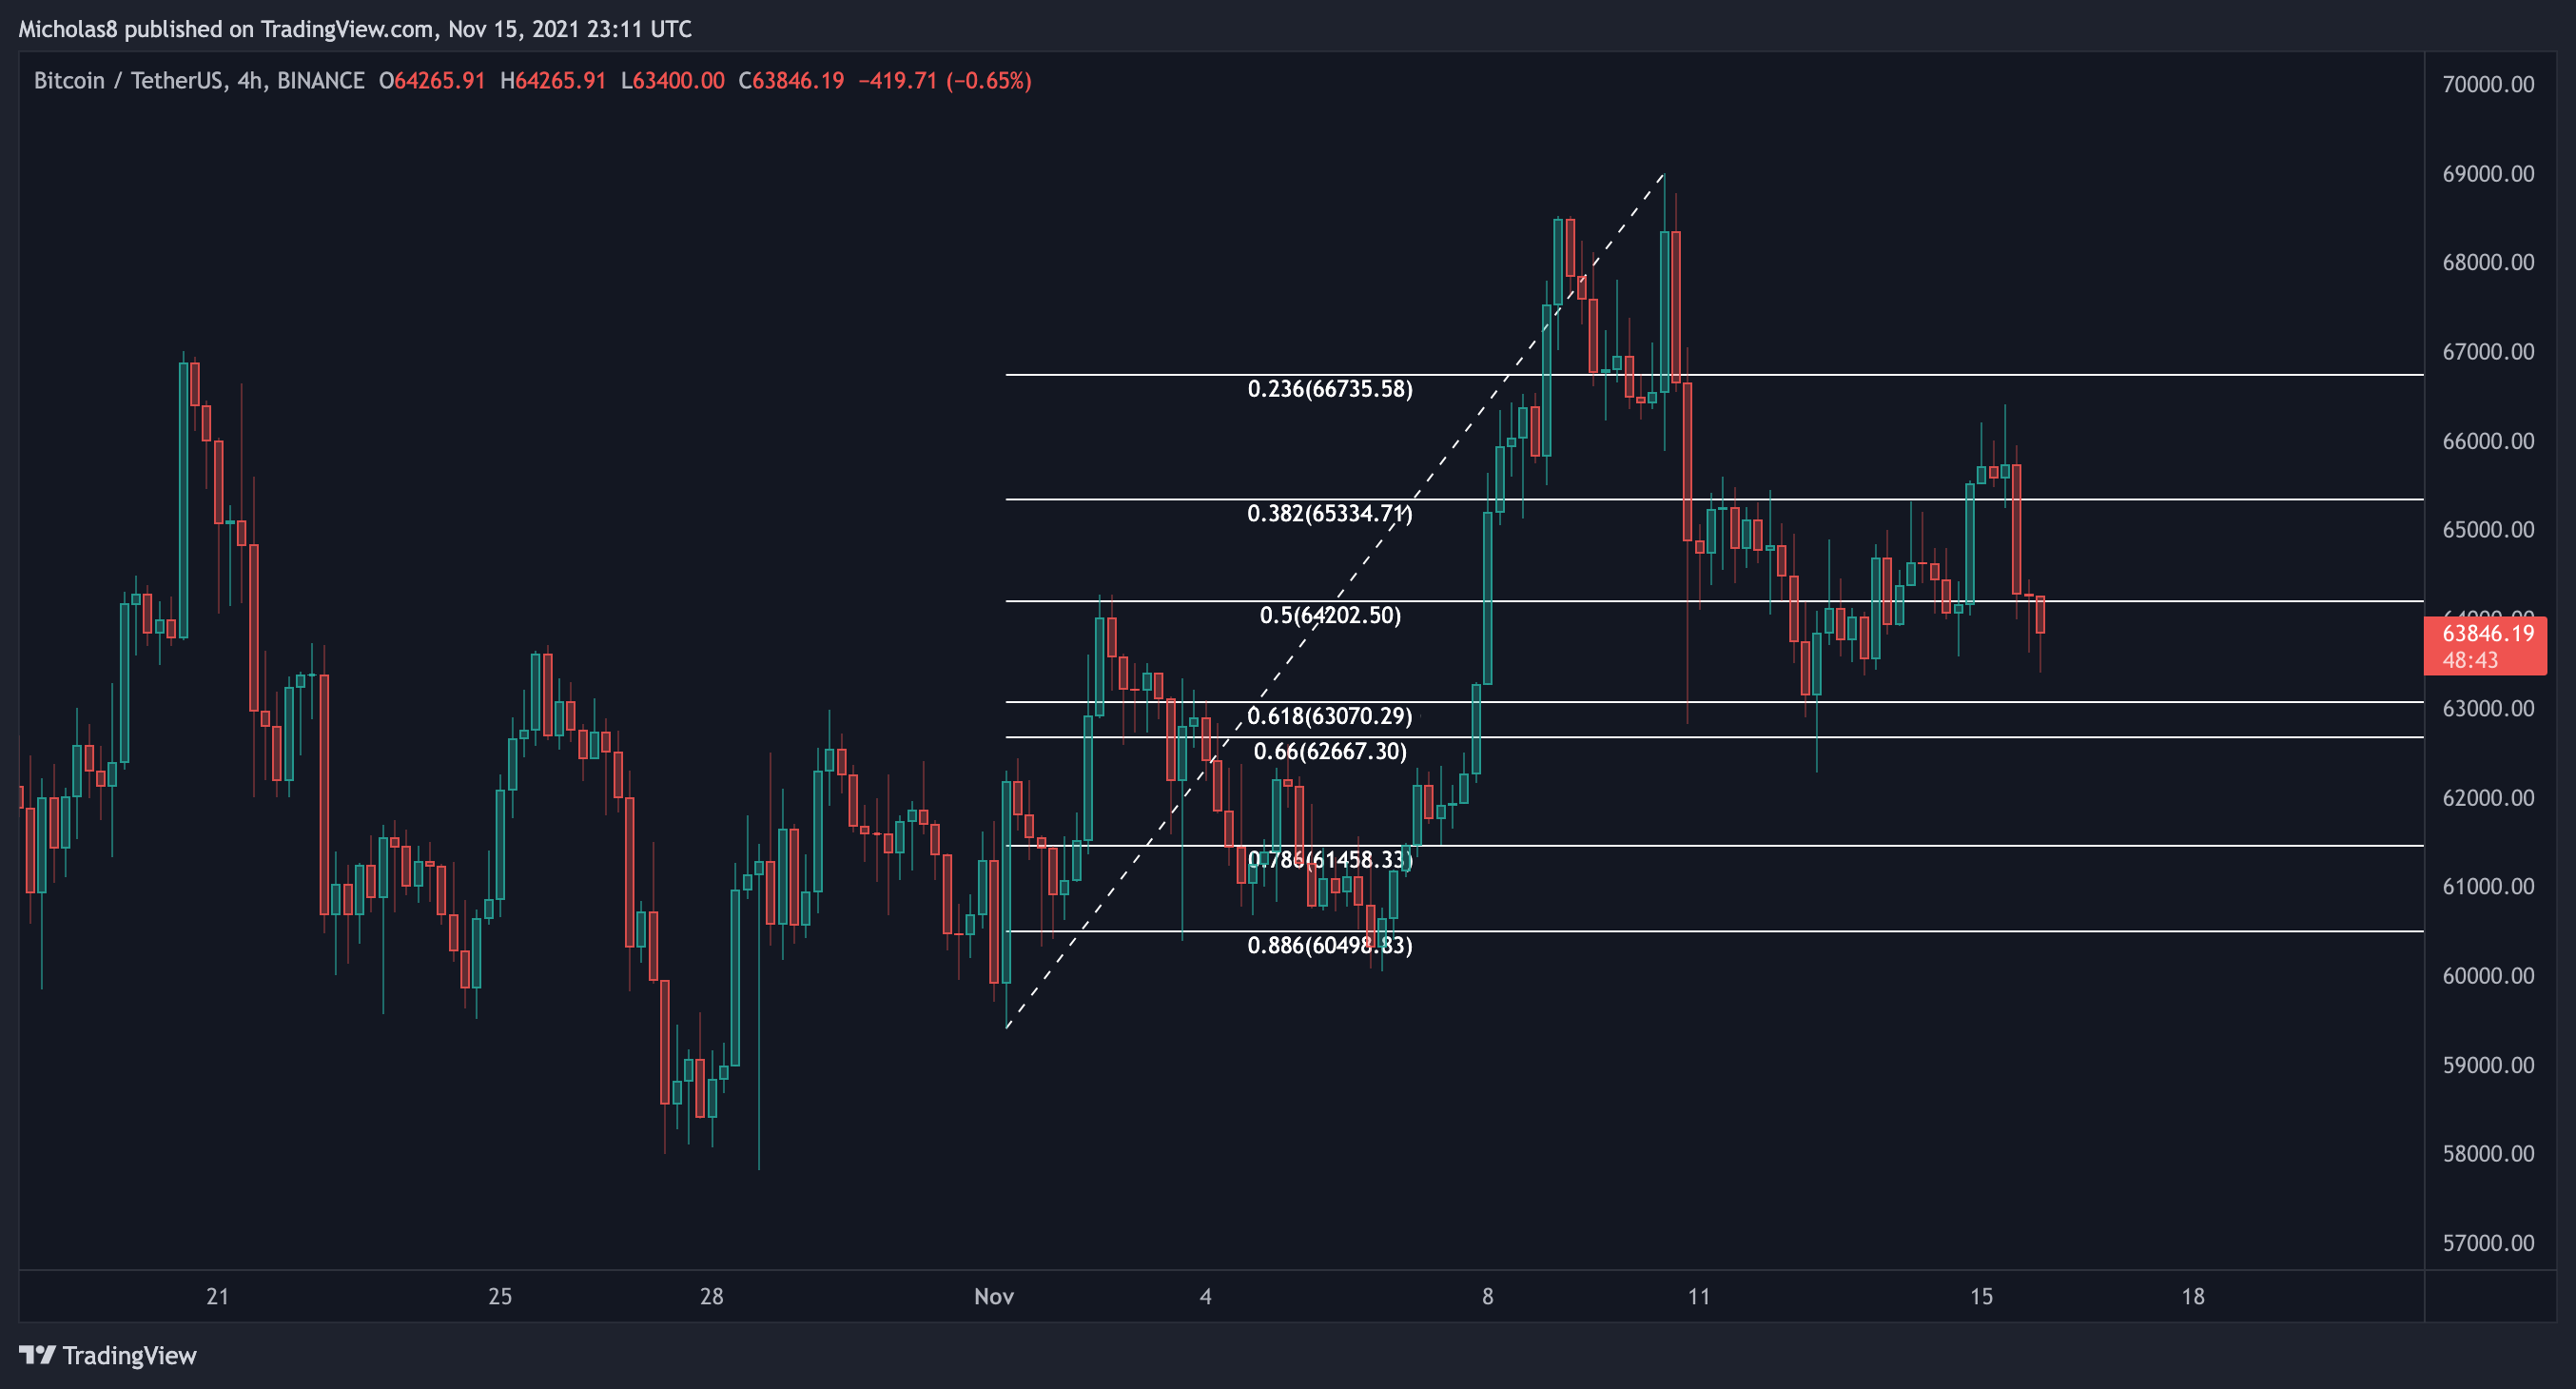
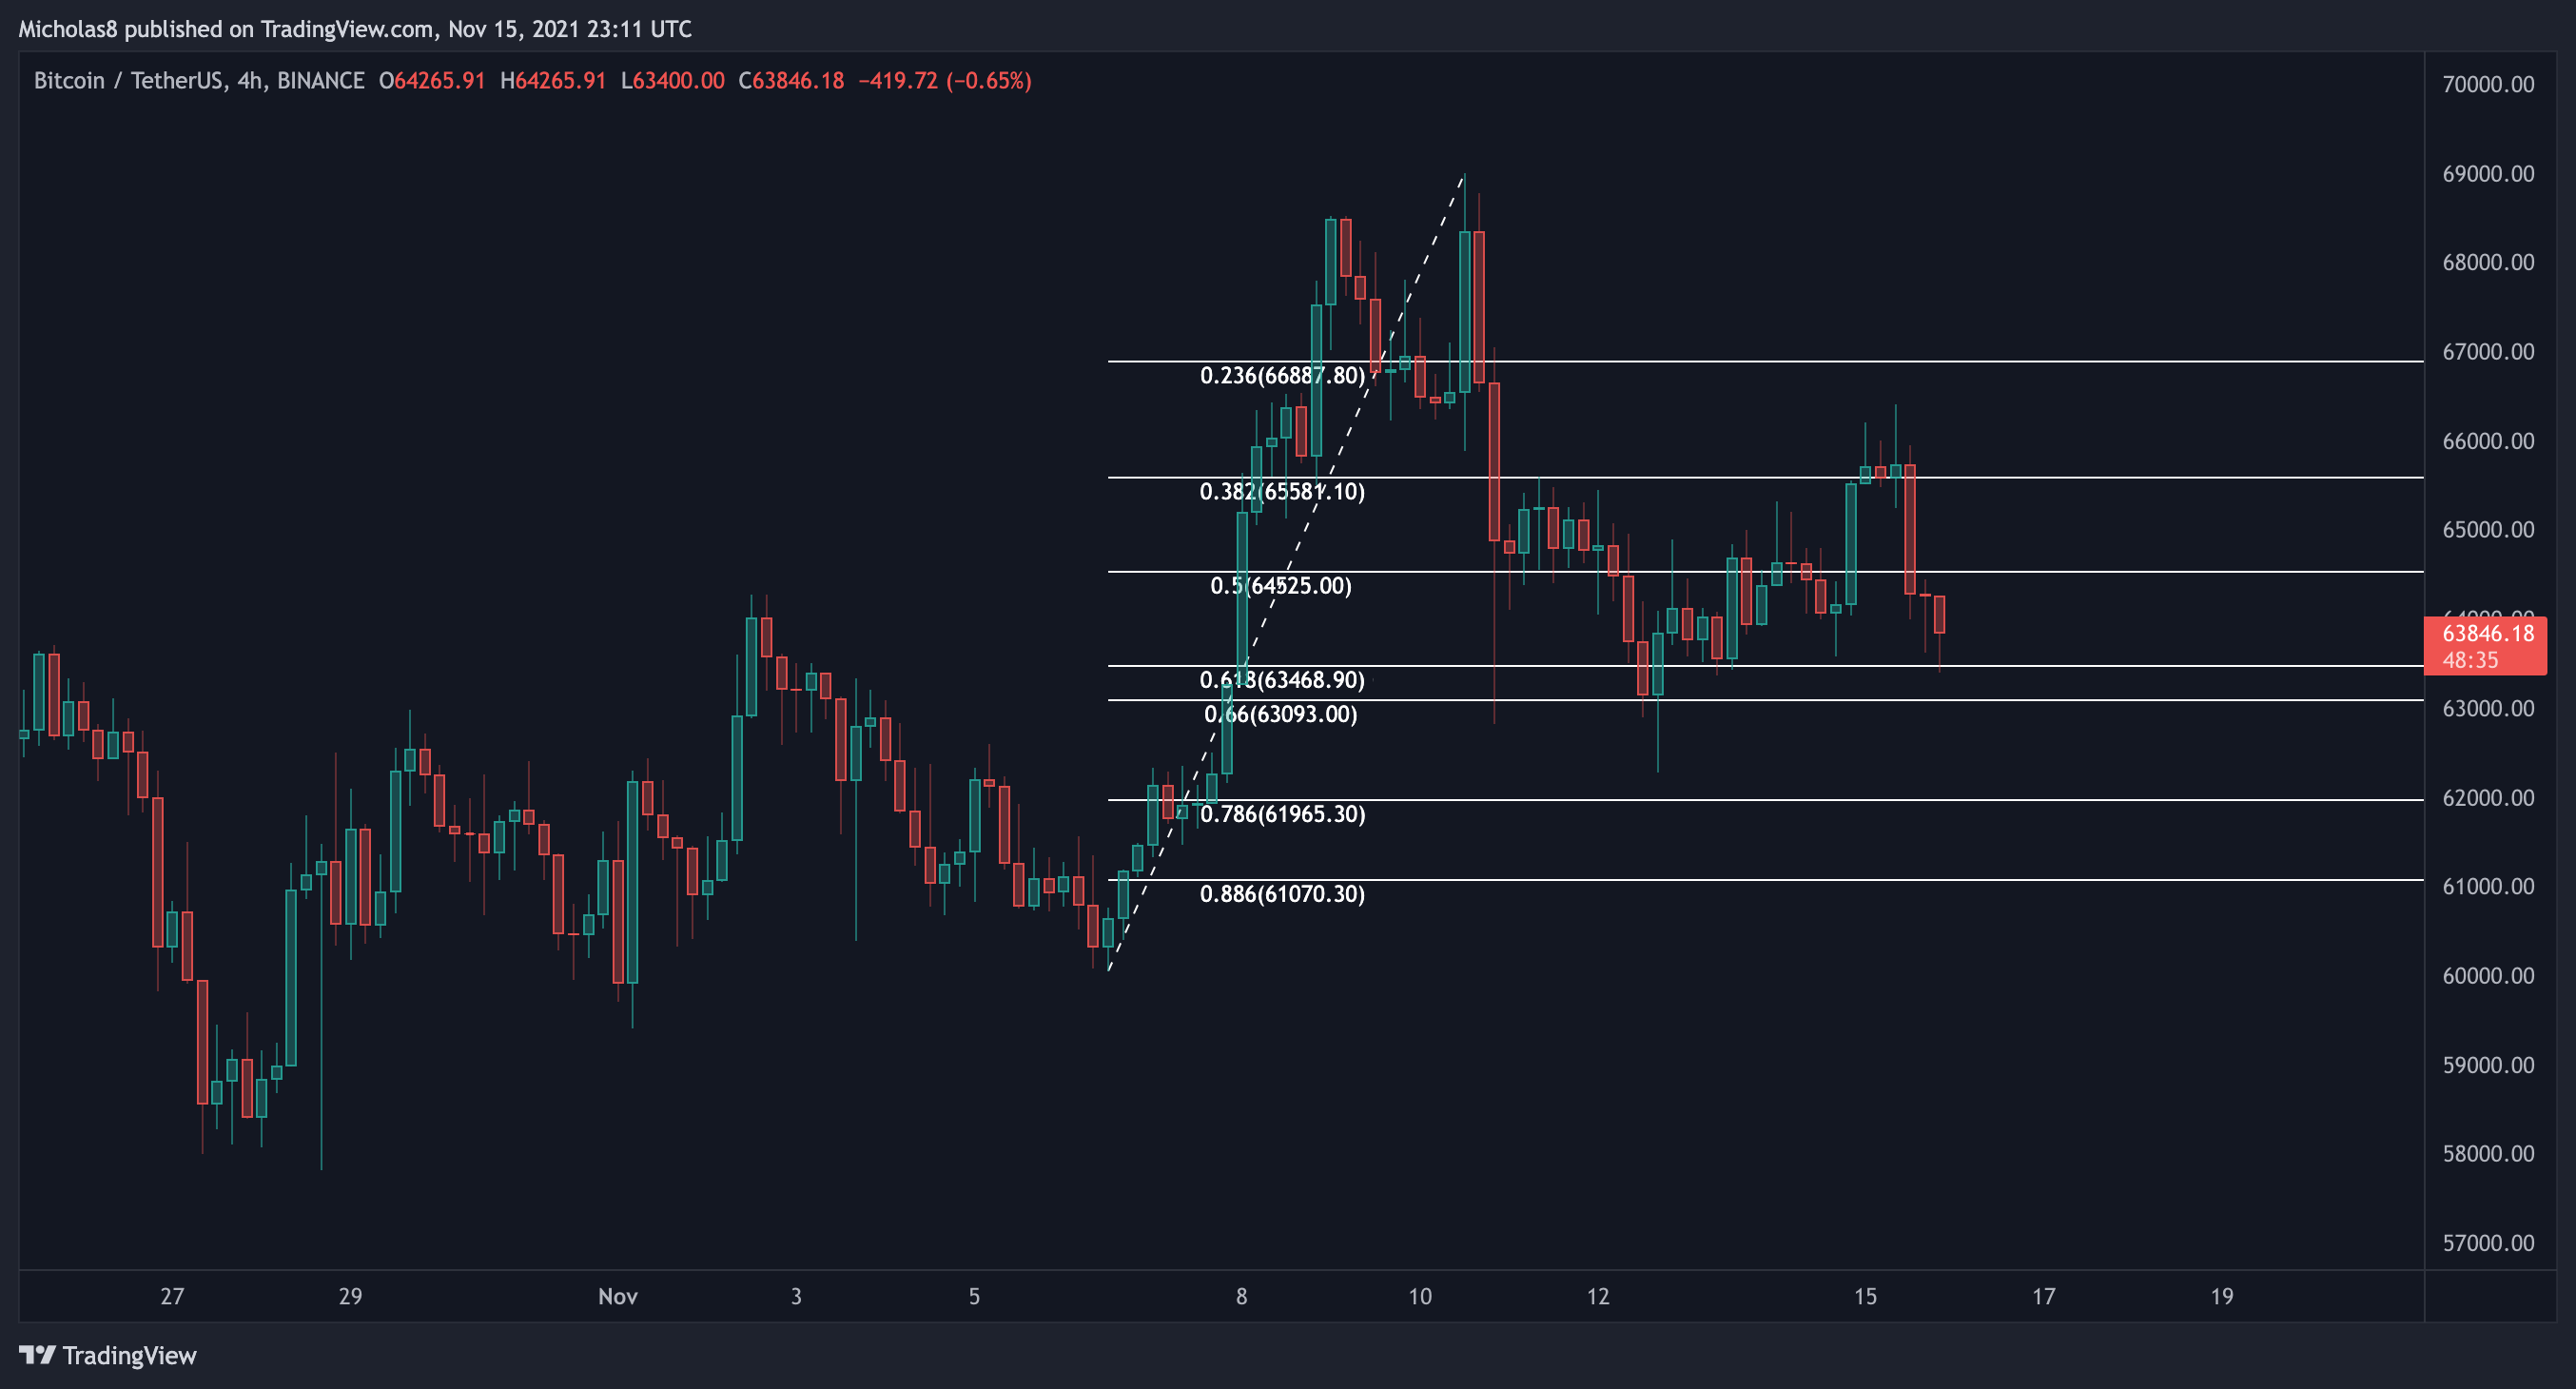
4-hour Timeframe
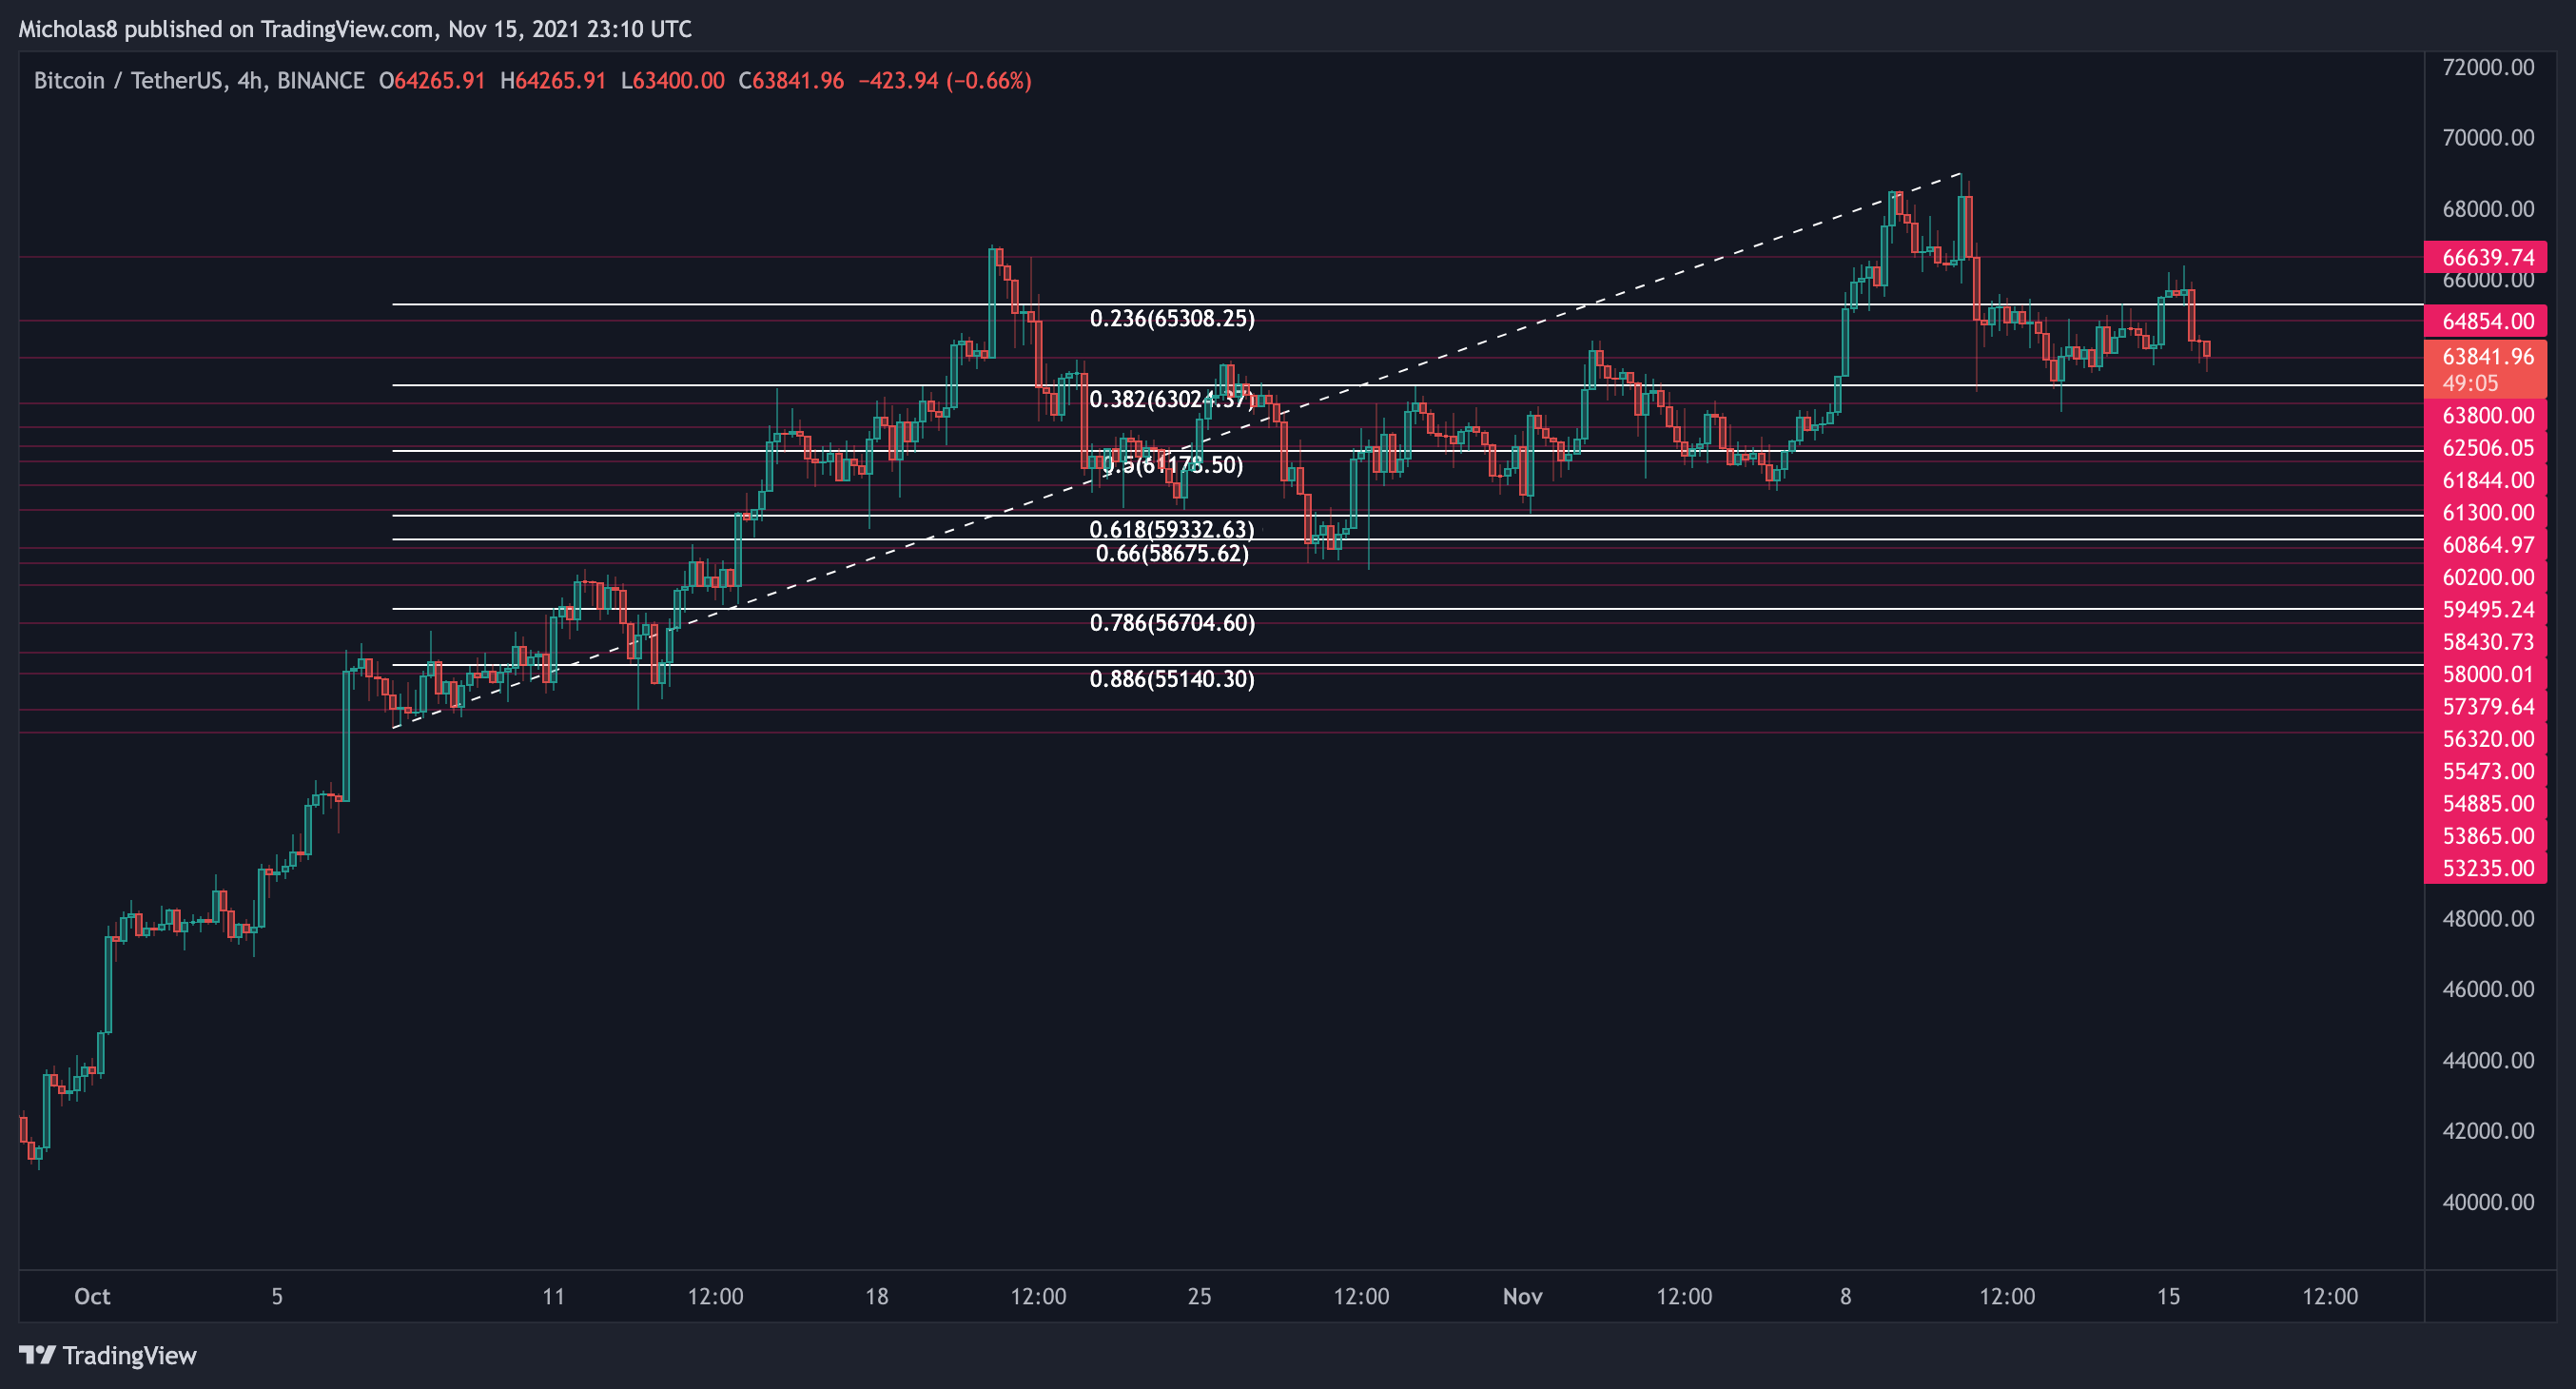
53235
53865
54885
55473
56320
57380
58000
58430
59495
60200
60865
61300
61844
62505
63800
64855
66640
Fibonacci levels
1-hour Timeframe
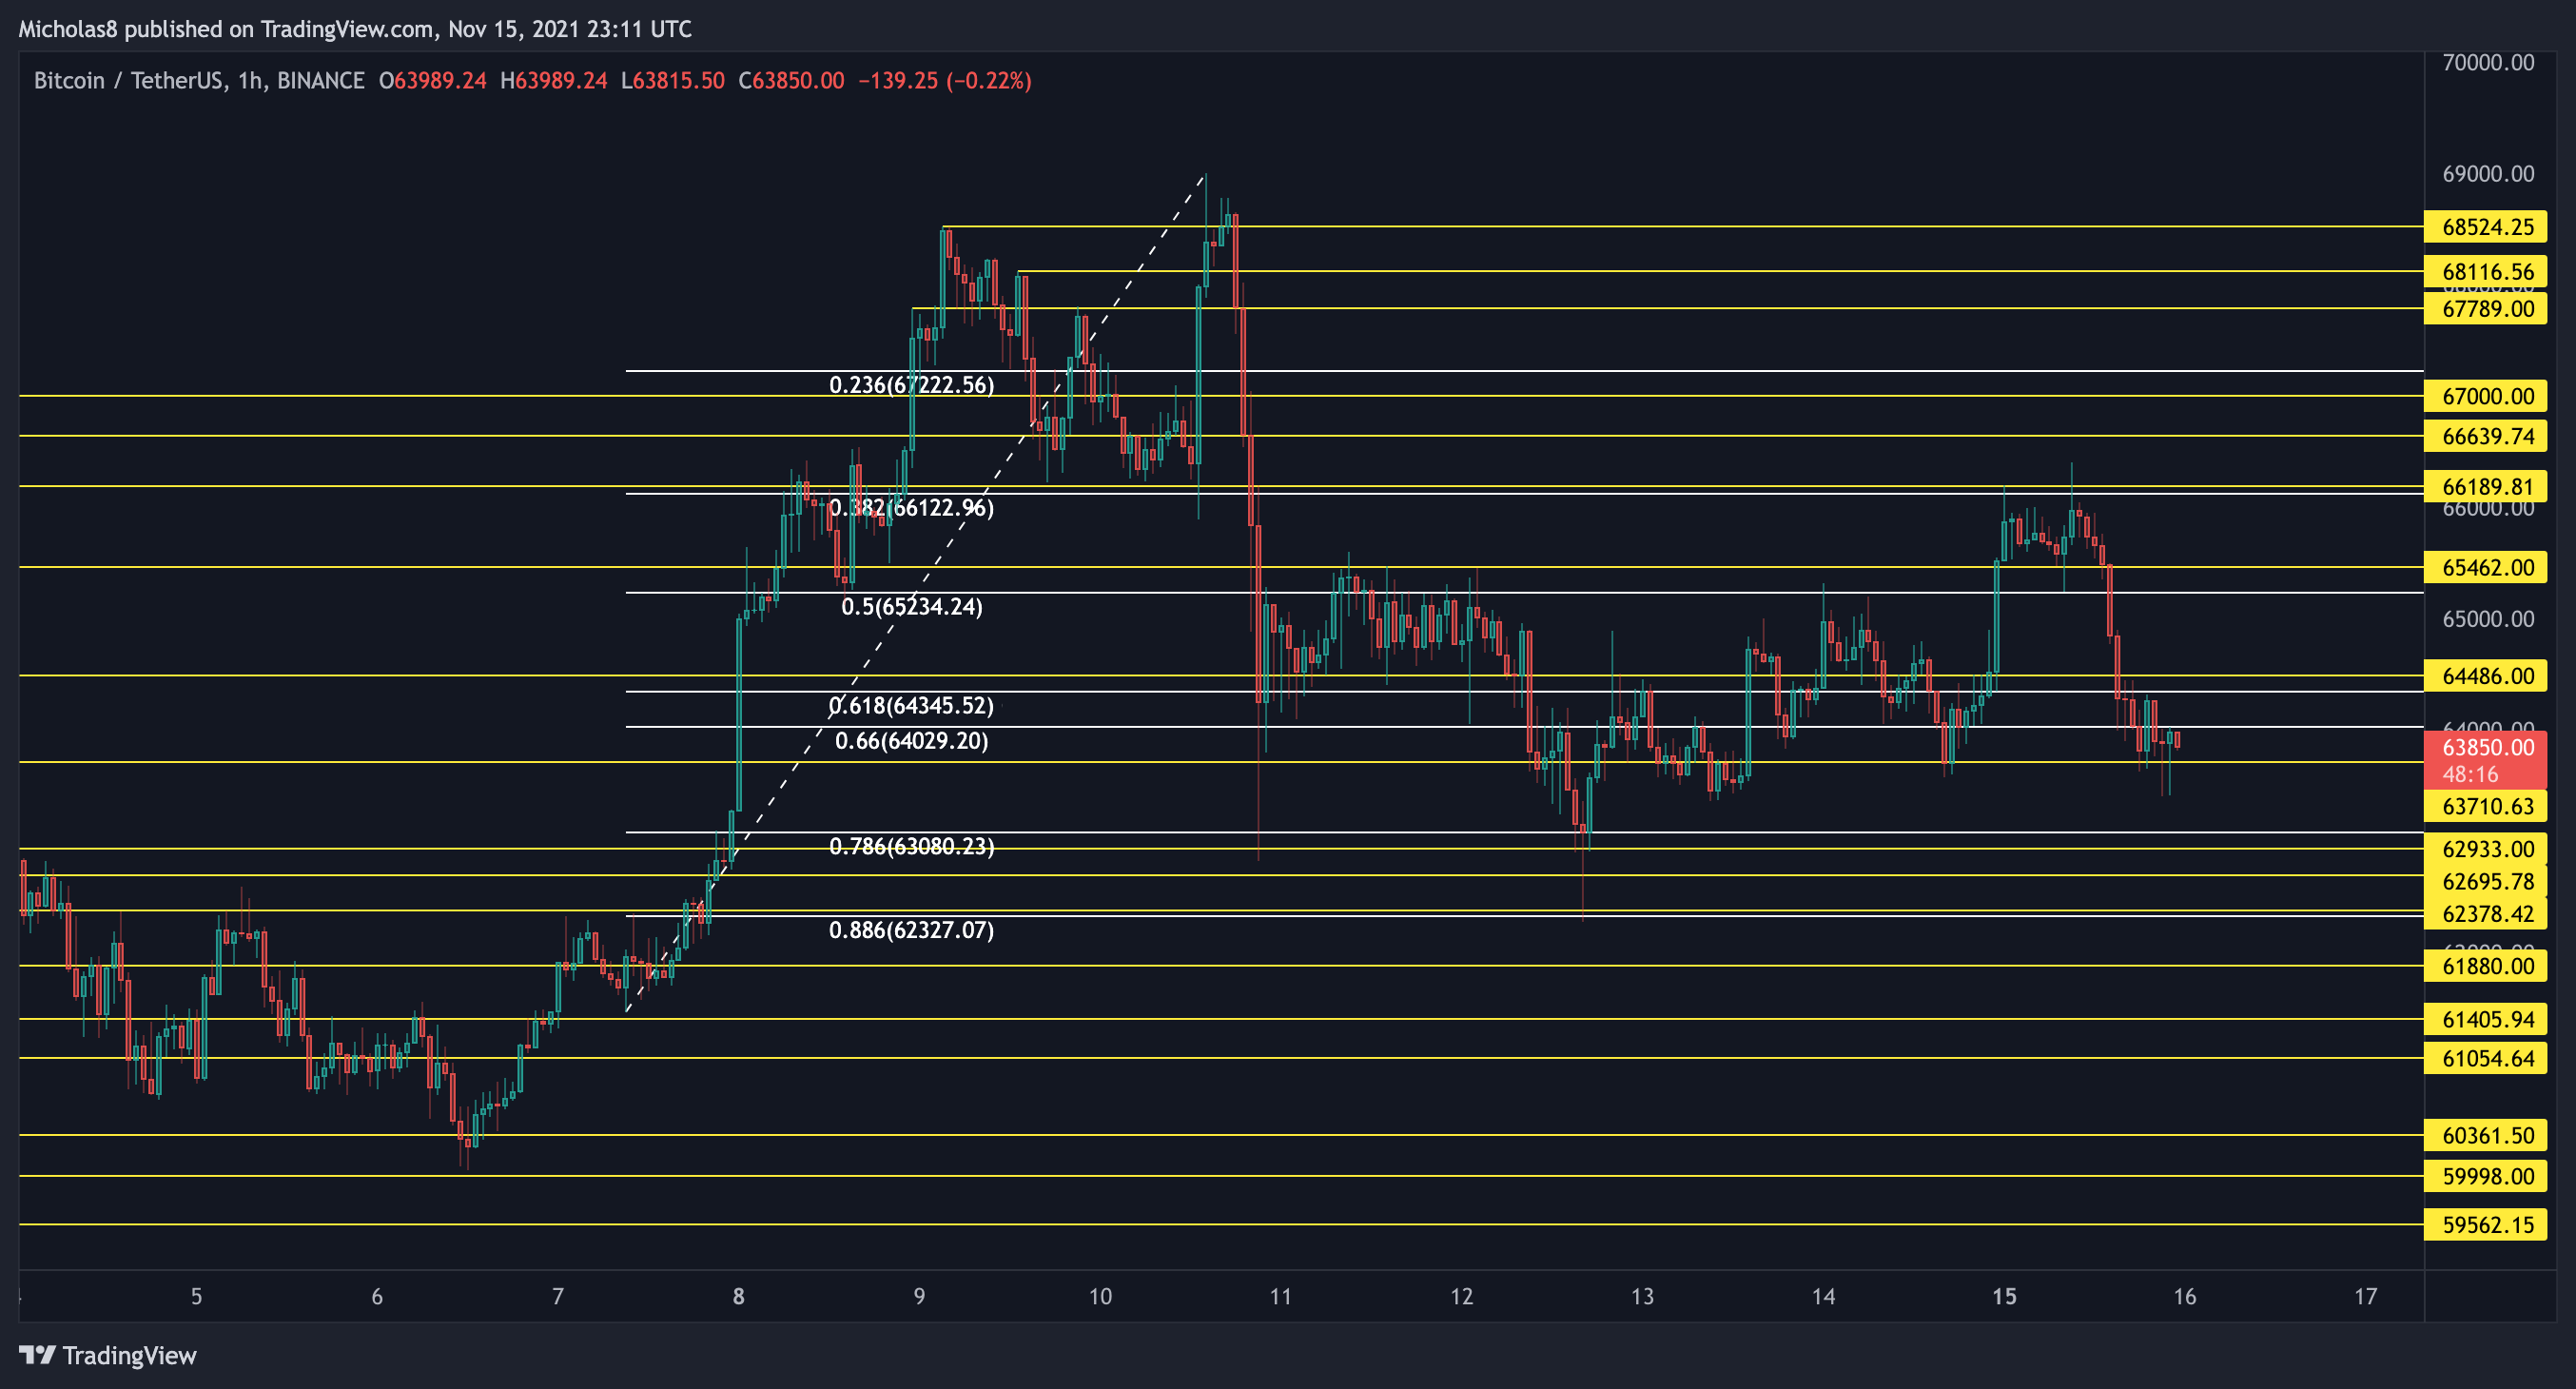
59560
60000
60360
61055
61405
61880
62375
62695
62930
63710
64485
65465
66190
66640
67000
67790
68115
68525
Fibonacci levels
FINAL THOUGHTS
RECAP FROM THIS MORNING
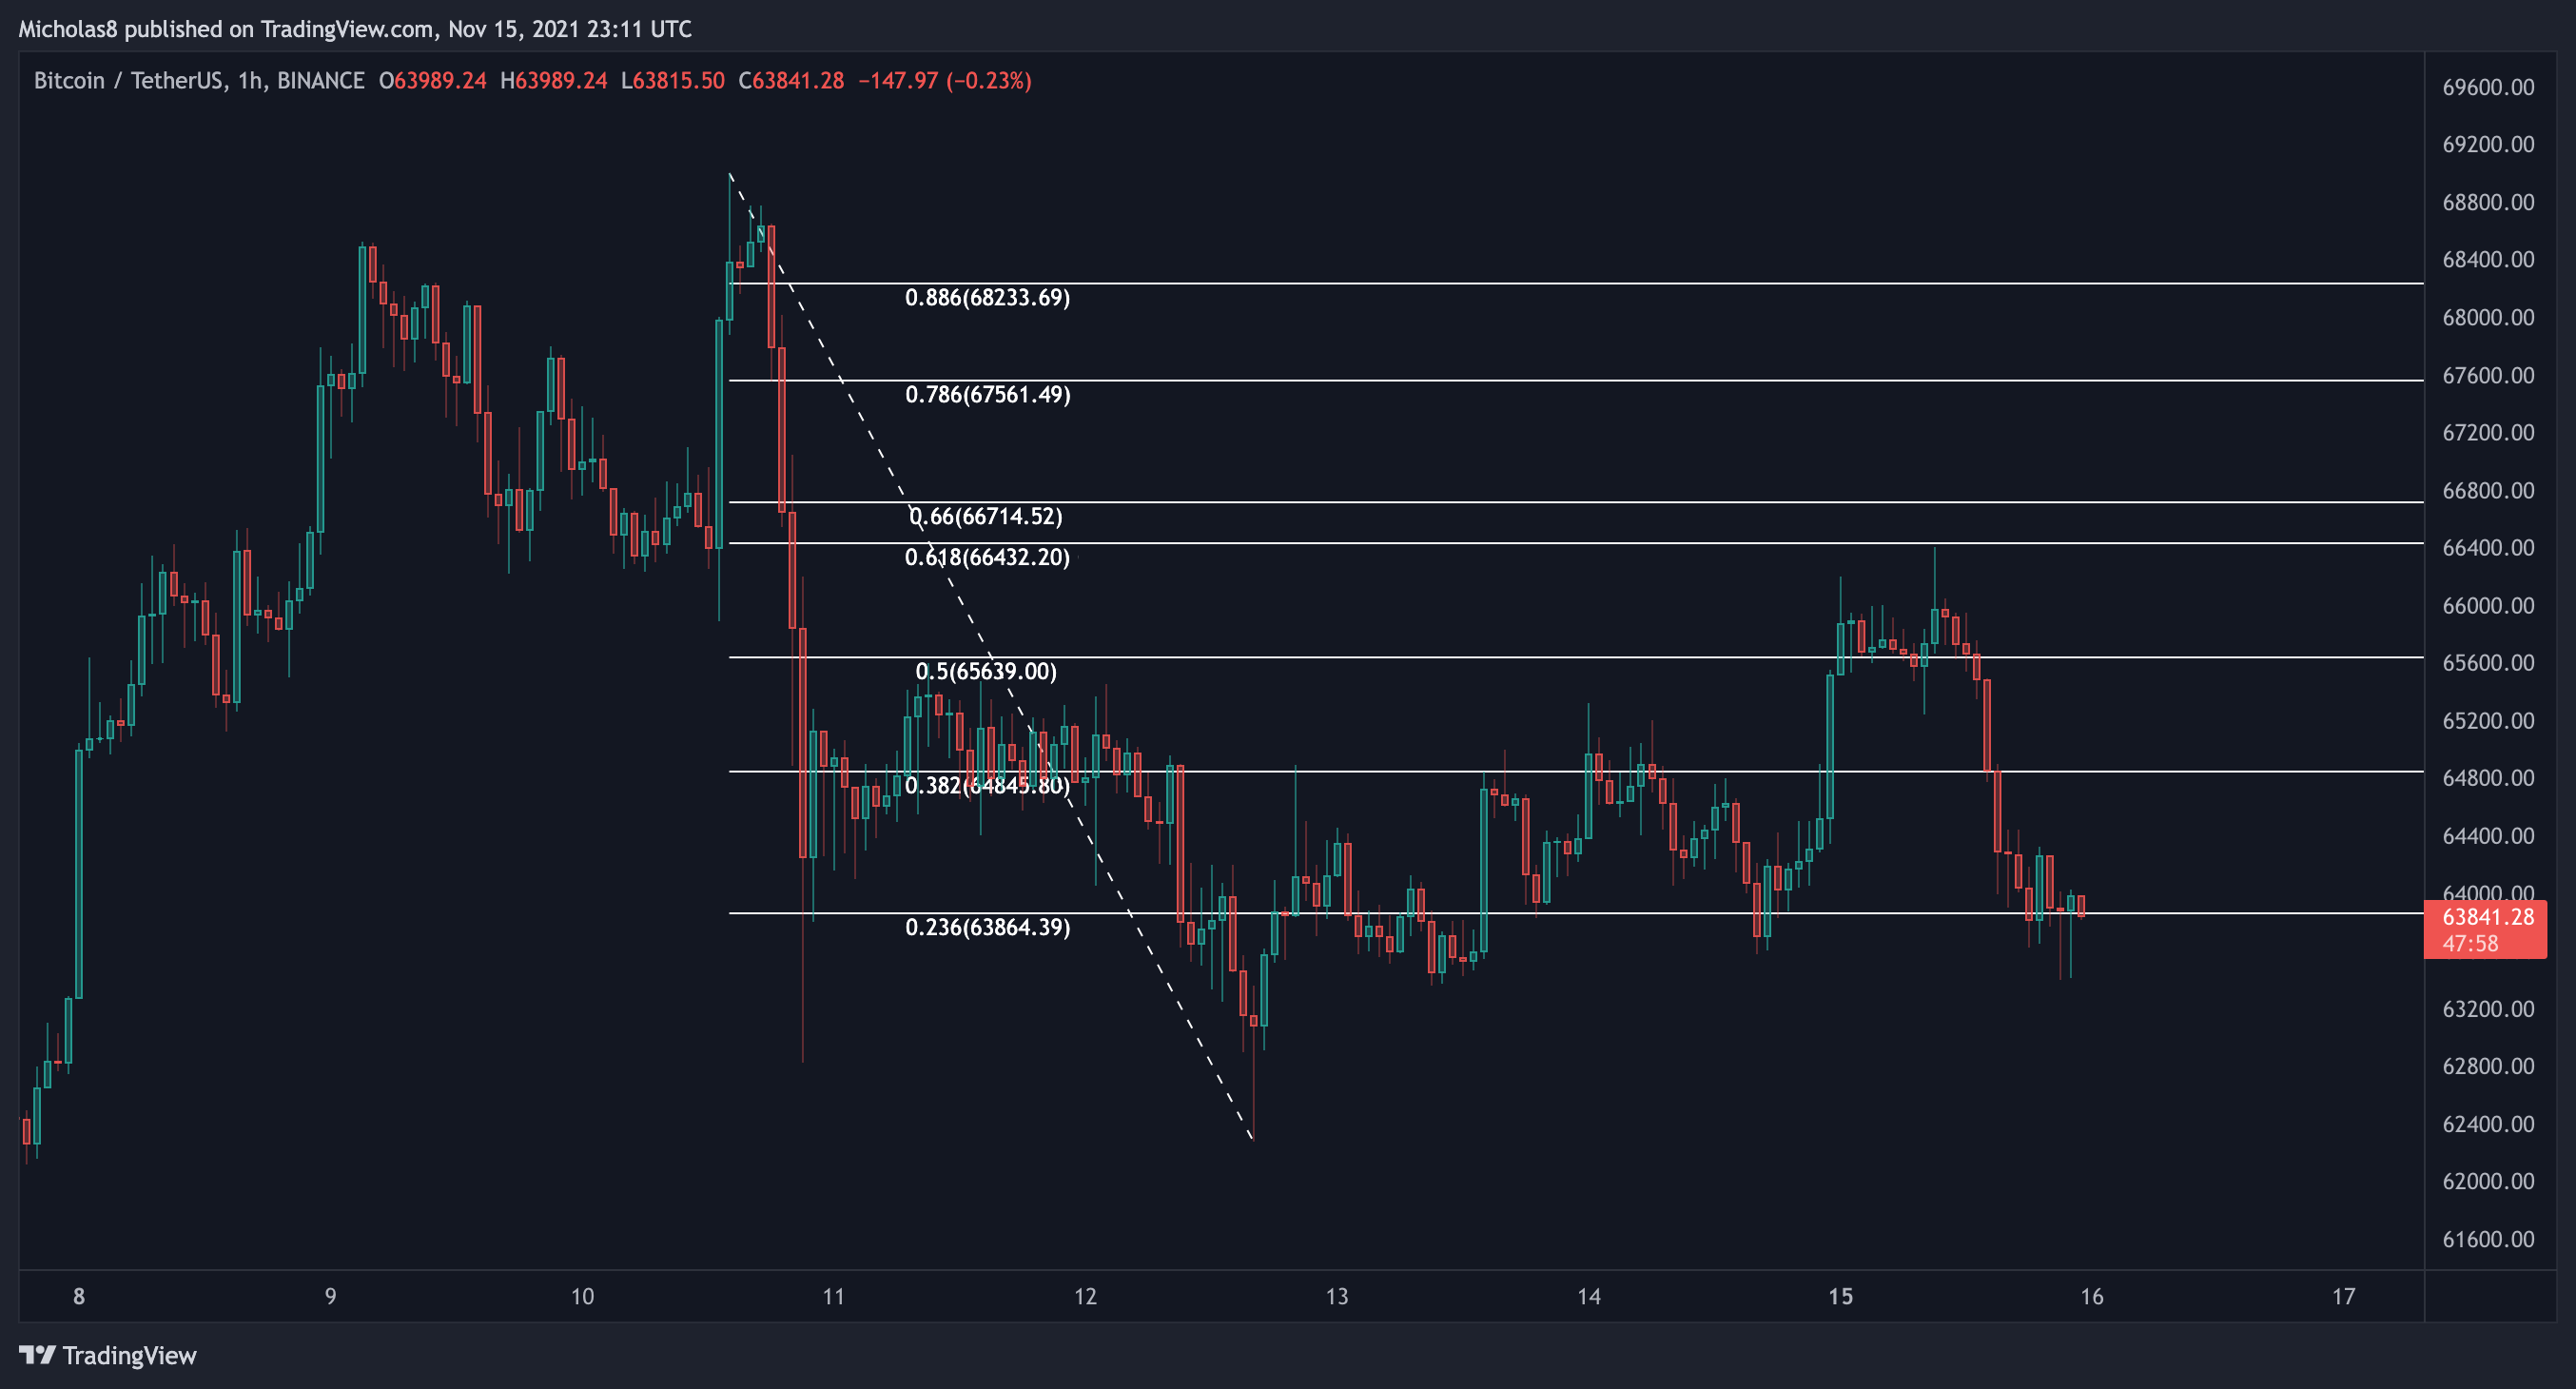
Last night, Bitcoin broke out of the Inverse Head & Shoulders (IHS) pattern only to be rejected by the Golden Pocket of this recent move down.
Right now, we are seeing a Bitcoin pullback after this failed attempt to realize the full IHS target at roughly 68.2k.
Everything mentioned in last night's Weekly Market Report still stands. I still do believe we will fill the CME Gap at 61.2k. Whether it's today, or tomorrow, or next week, my bias is leaning towards it getting filled for a few reasons:
Bearish technicals supporting a more sustained move down
Every single gap that has formed since August 2021 has been filled. If we're playing a game of statistics, that means there's a very high likelihood that this gap is also filled
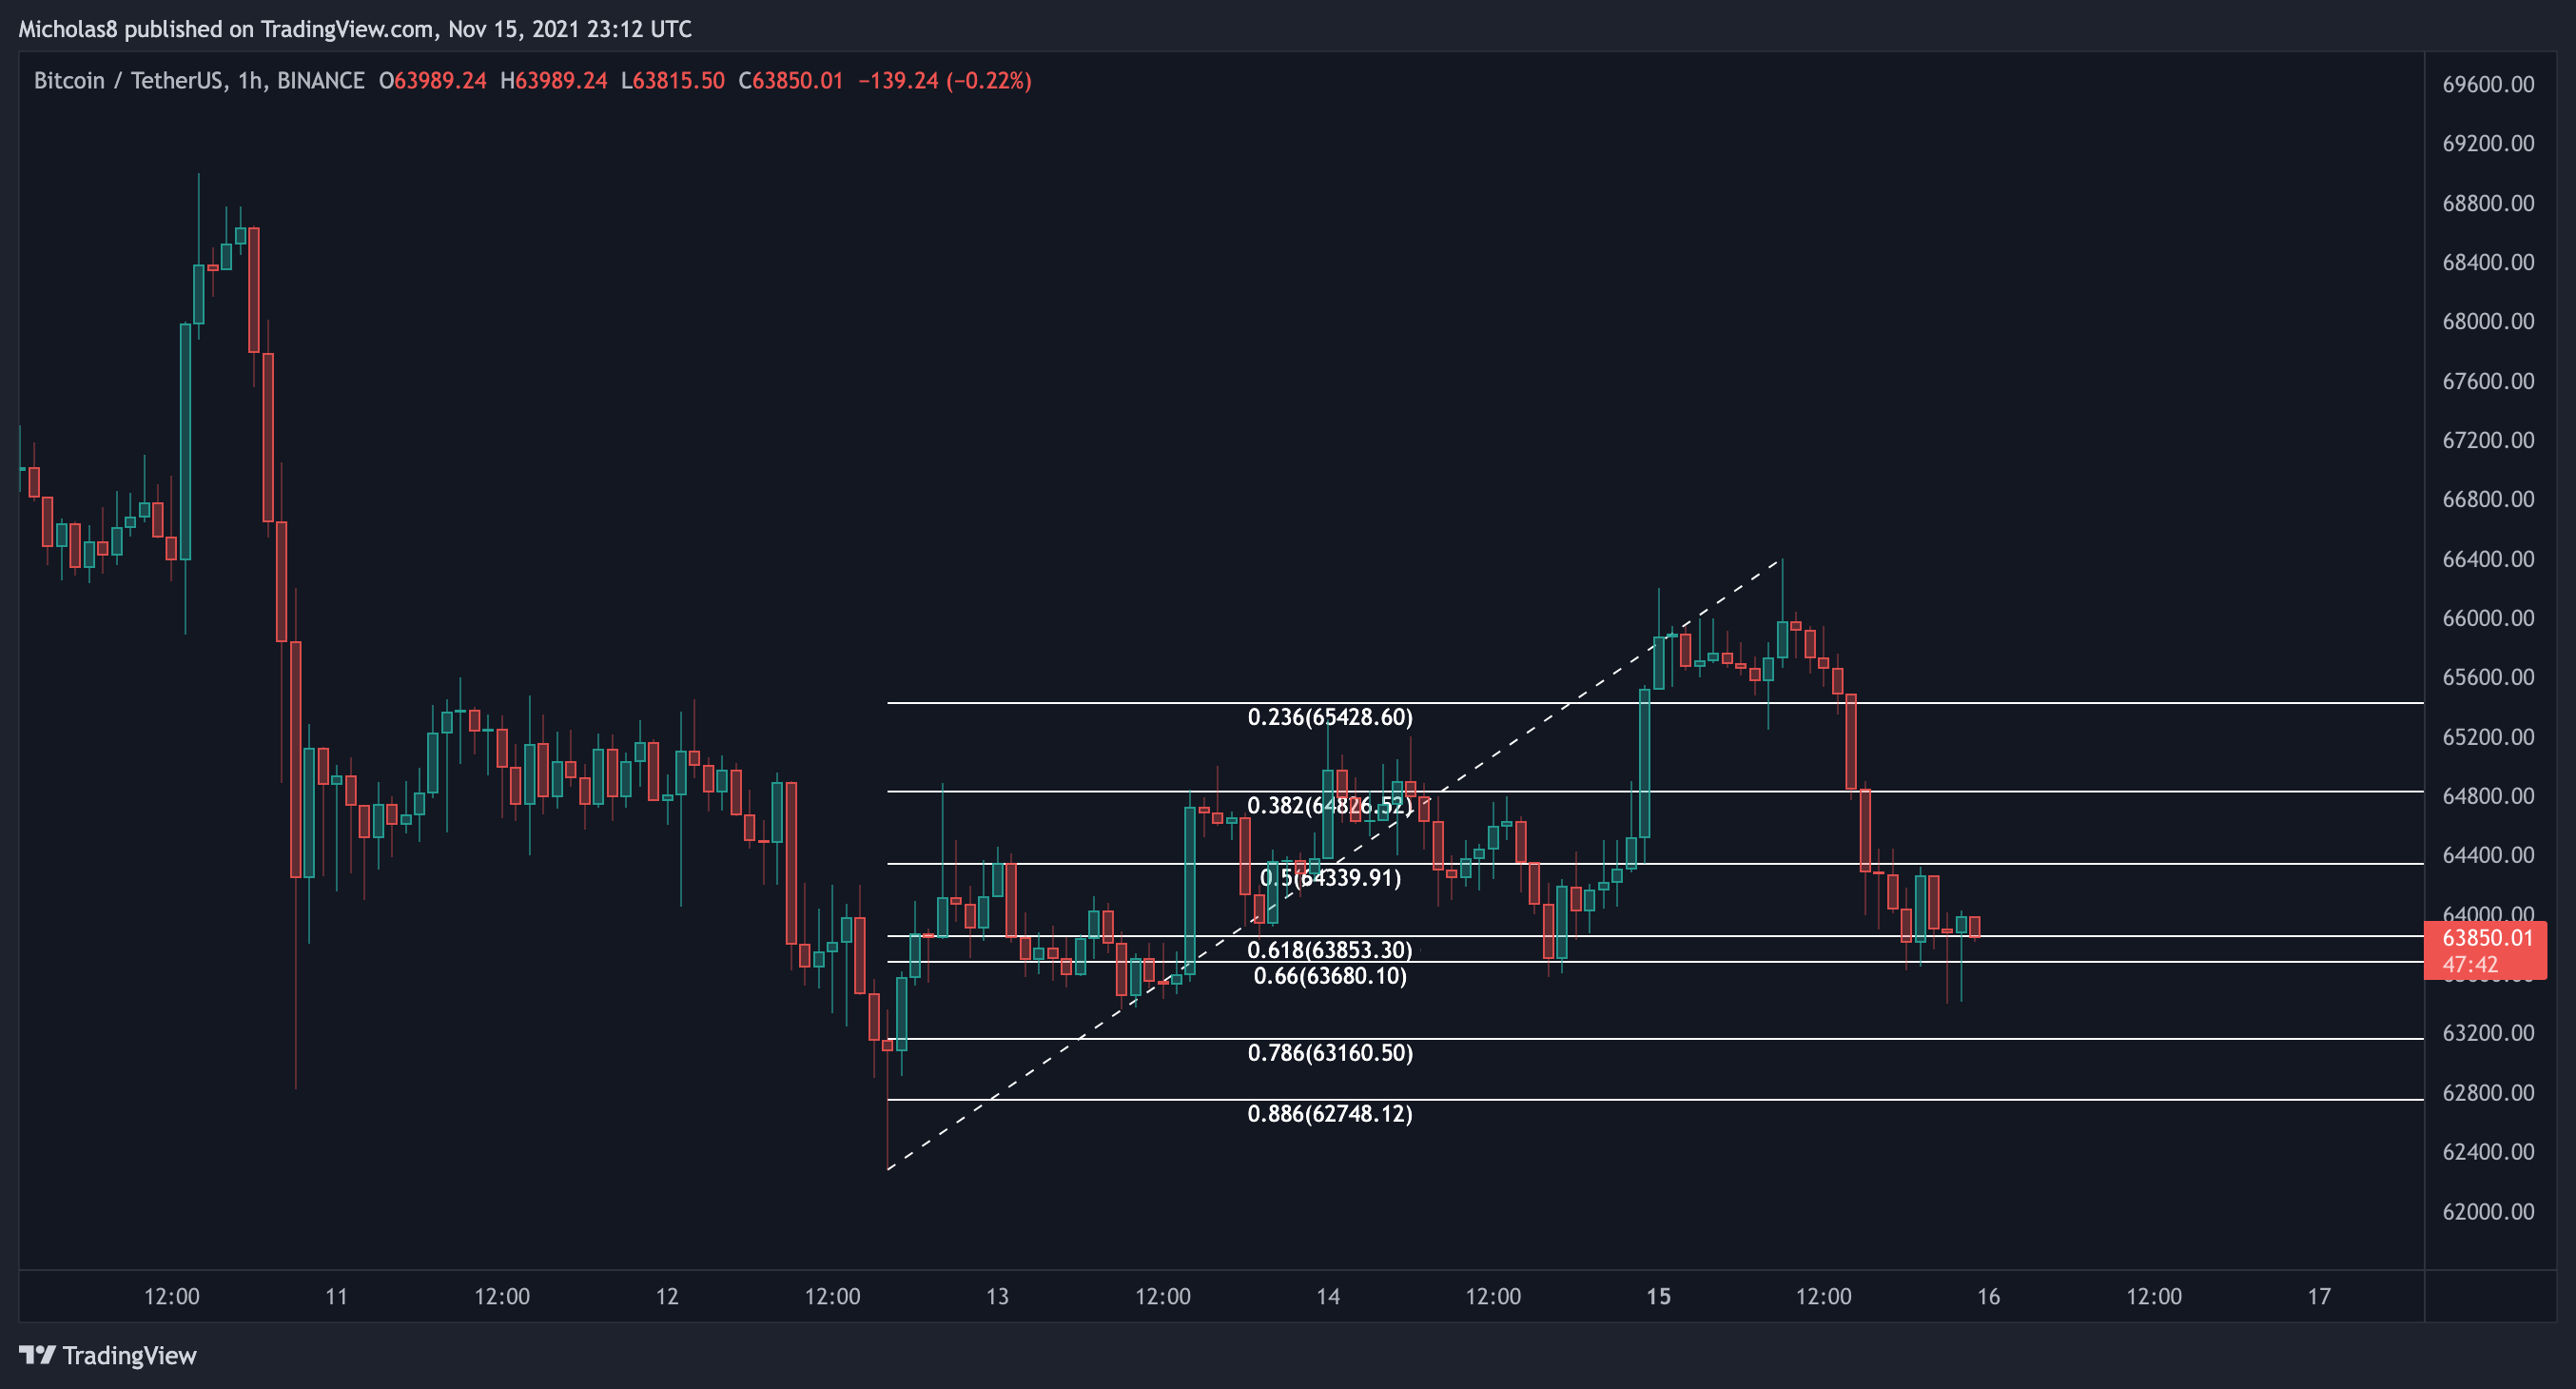
All in all, Bitcoin is still in an uptrend, so we can remain reasonably bullish. But, there is still caution to be had given the huge pullback we are seeing in confluence with the bearish technicals we've been looking at over the last few days/weeks. Keep in mind, we still may have more downside to go before any sort of meaningful continuation up. If/when the CME Gap fills (which I do believe it will), we will need to re-evaluate the market conditions then.
_
TONIGHT
The Good
Trading above all Daily LQZs
Trading above 1D EMA ribbons
Holding the 200 4H SMA as support
Hold the 8/21/50/200 1D EMAs as support
Holding the 20/50/100/200 1D SMAs as support
Trading above all 1W MAs
Bullish DMI
Trading above 4H LQZ 1
Risen above the Logarithmic Curve Median Line
Symmetrical Triangle breakout
Inverse Head & Shoulders
_
The Bad
Potential for the 1D Bearish Divergence to continue to influence PA
1W Bearish Divergence
Bullish Exhaustion
CME Gap at 61.2k
Bearish Fractal
Lost the 1H/4H EMA Ribbons
Rising Wedge
Volume Analysis
Bearish NVT
_
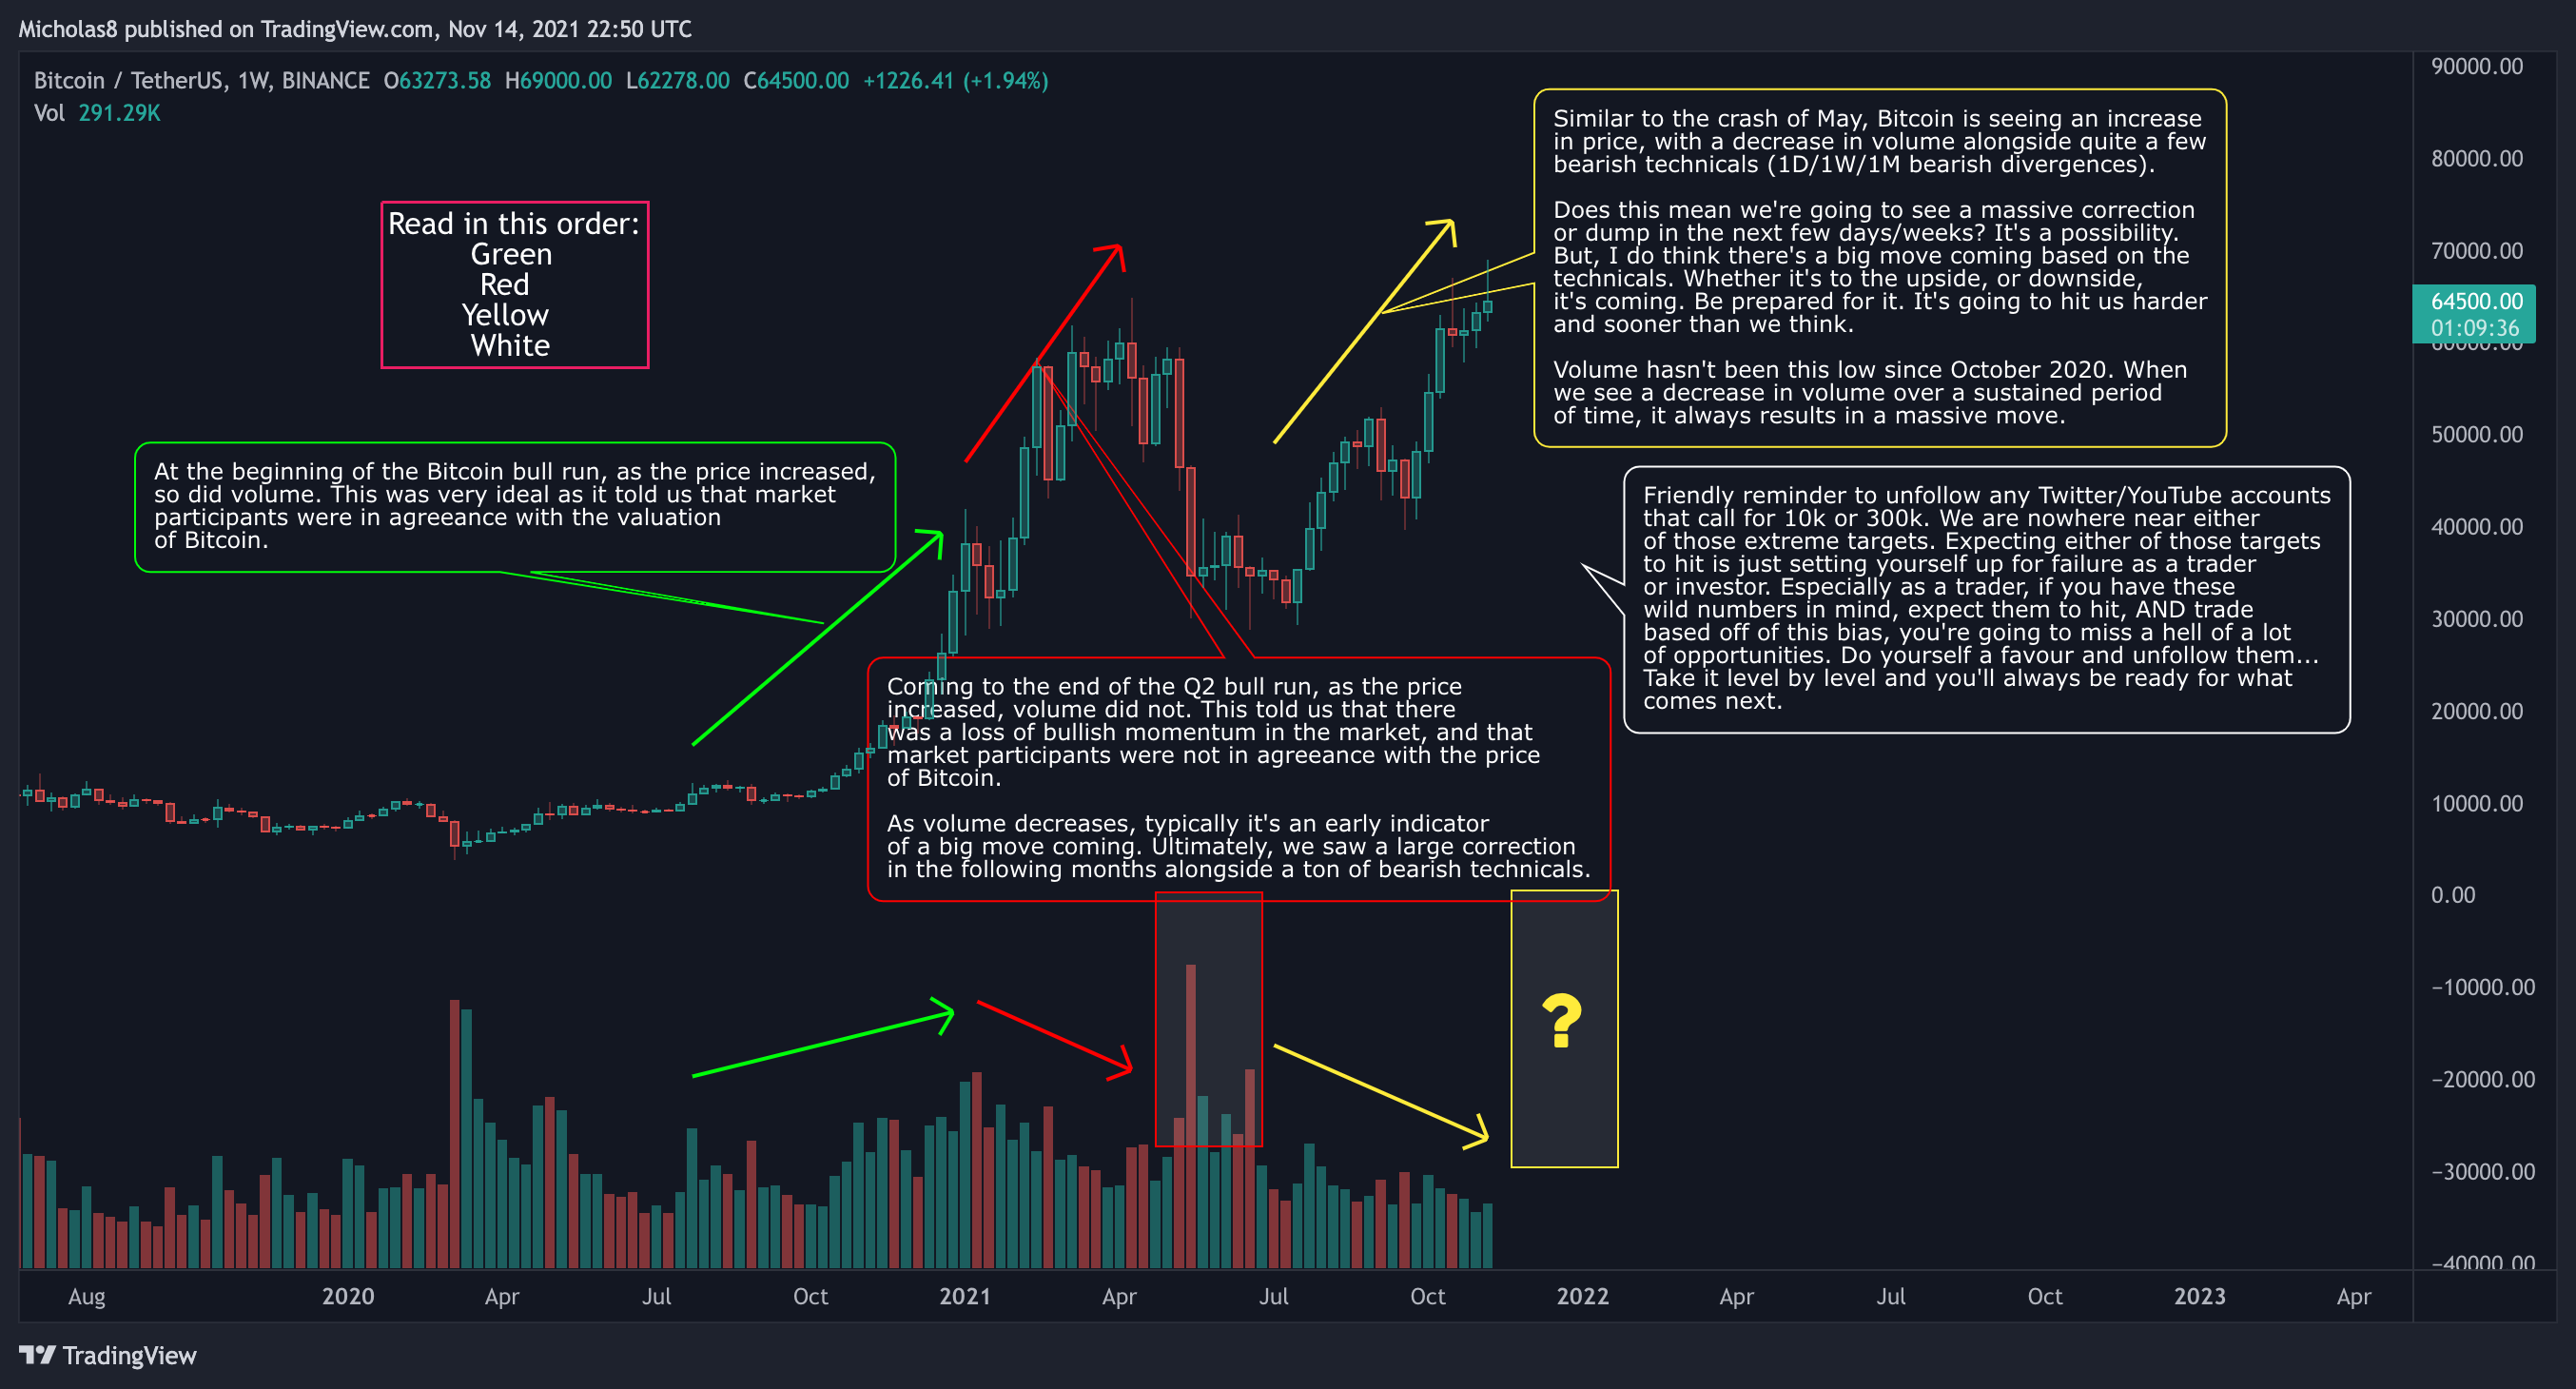
This Macro Volume Analysis still stands.
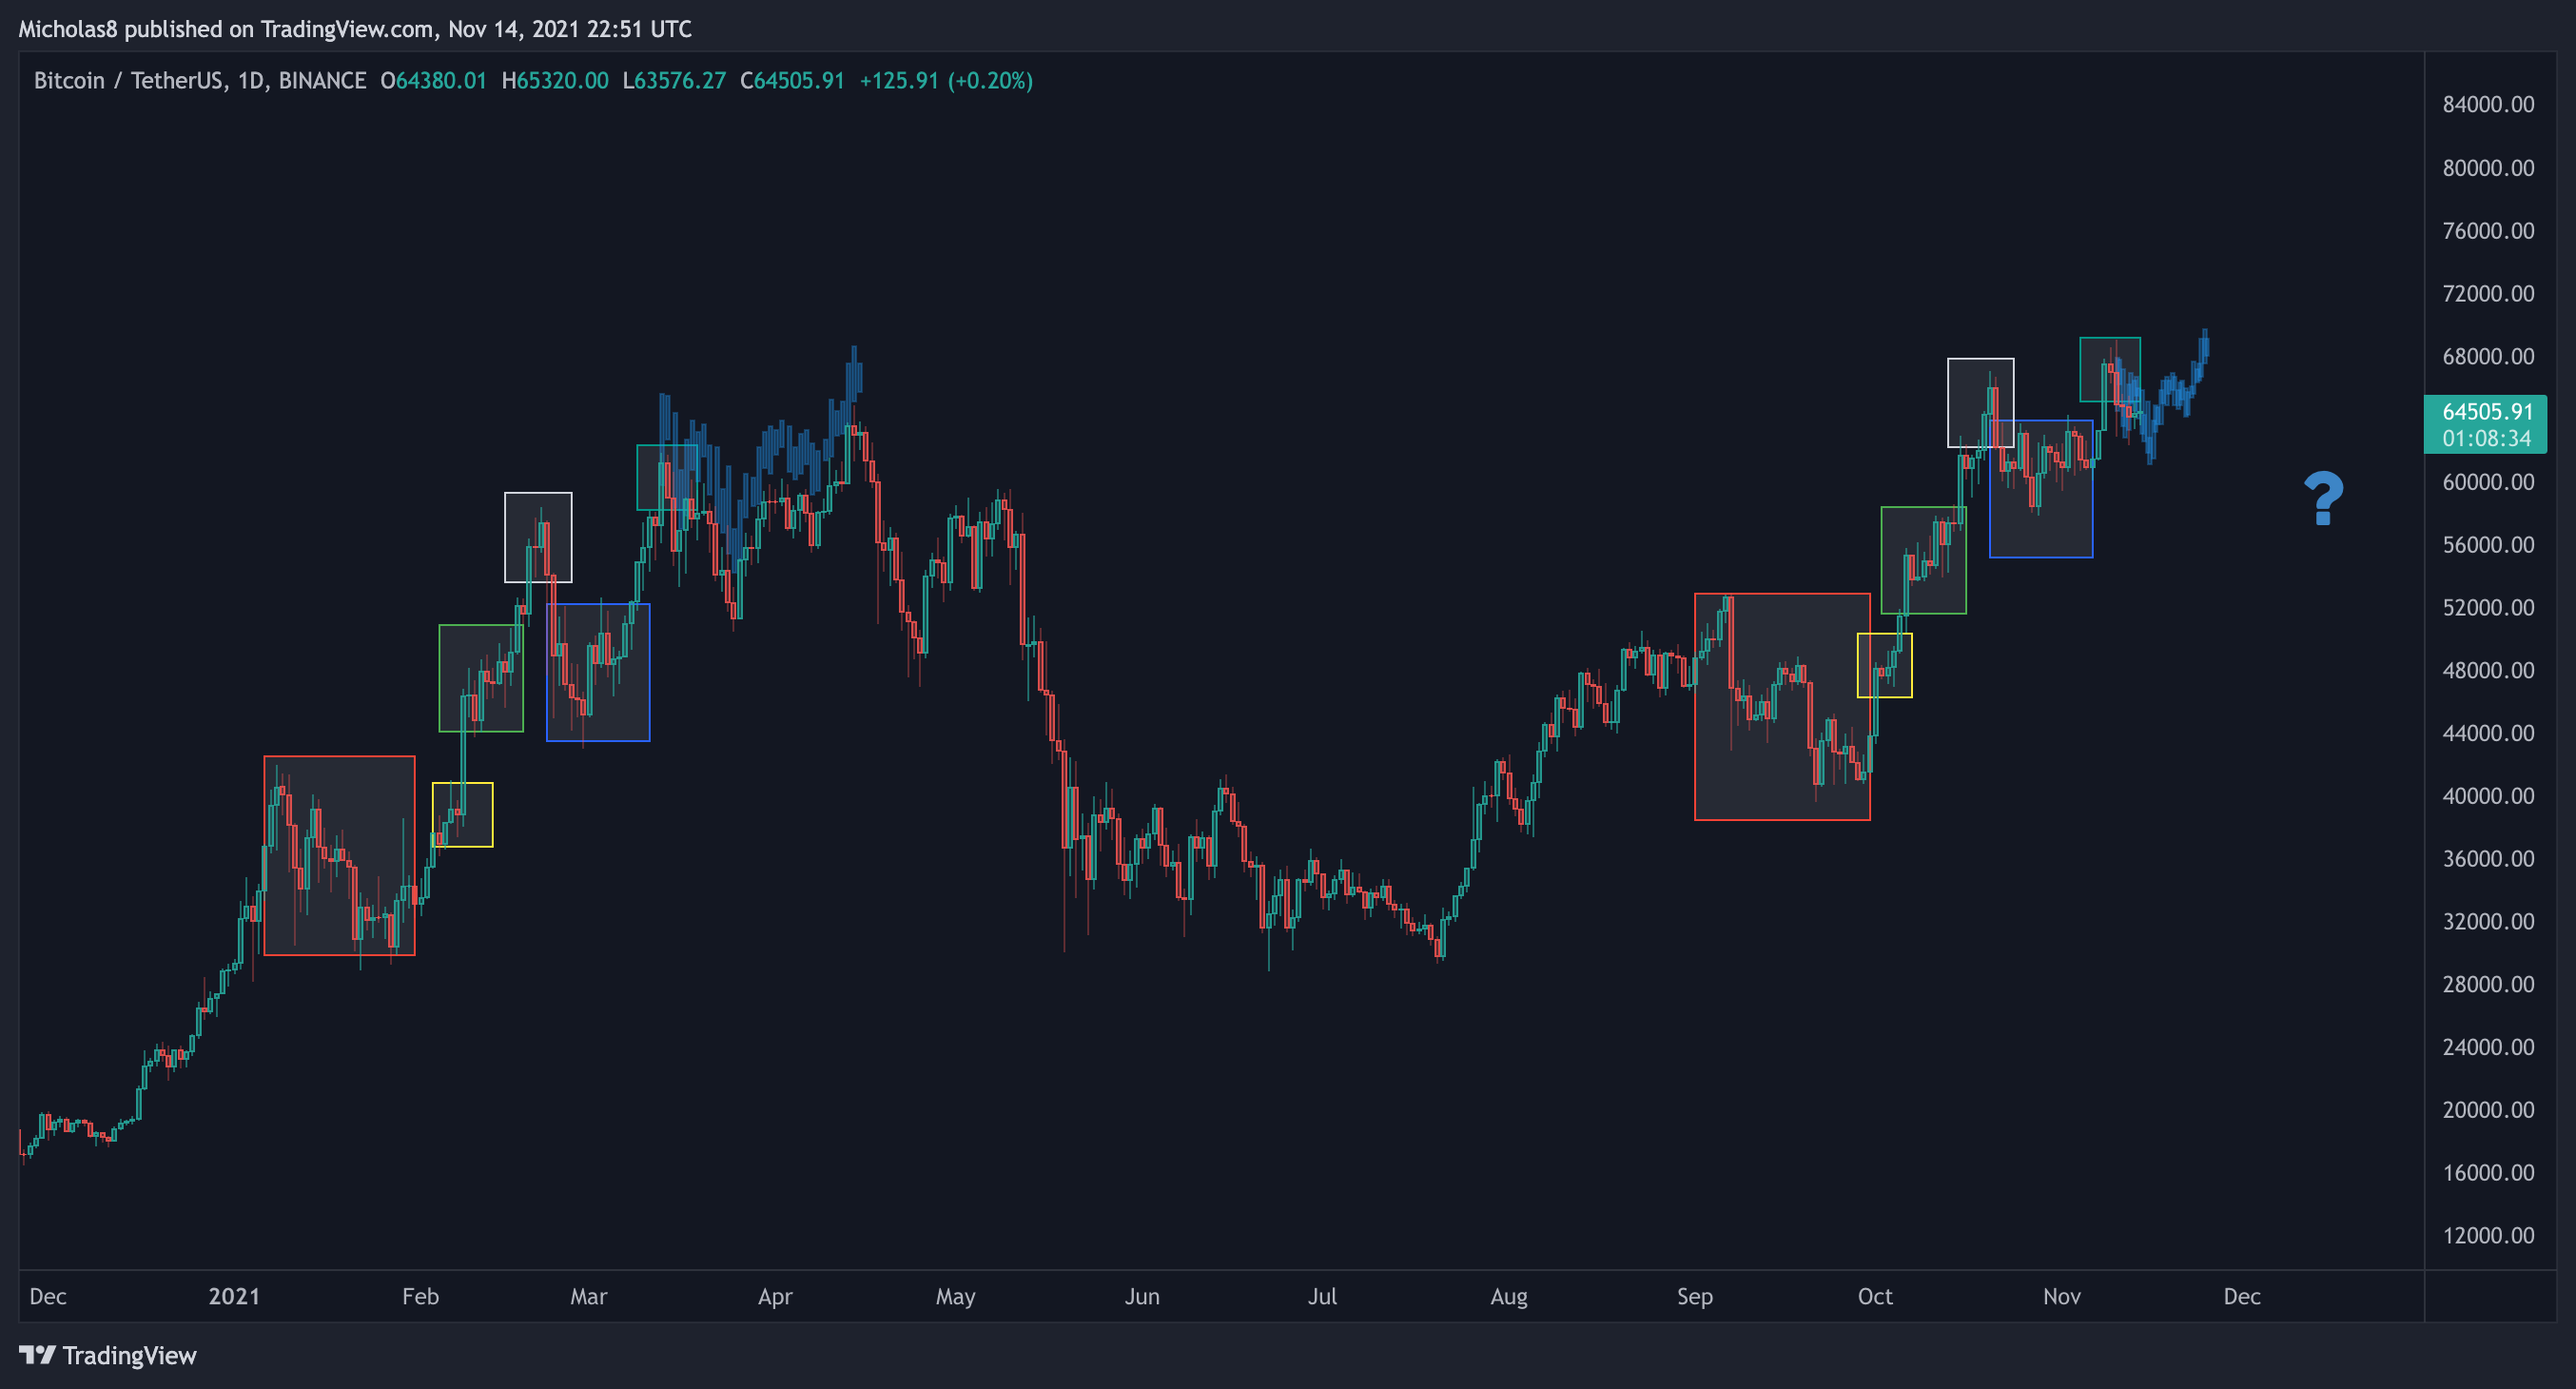
As does this Bearish Fractal.
_
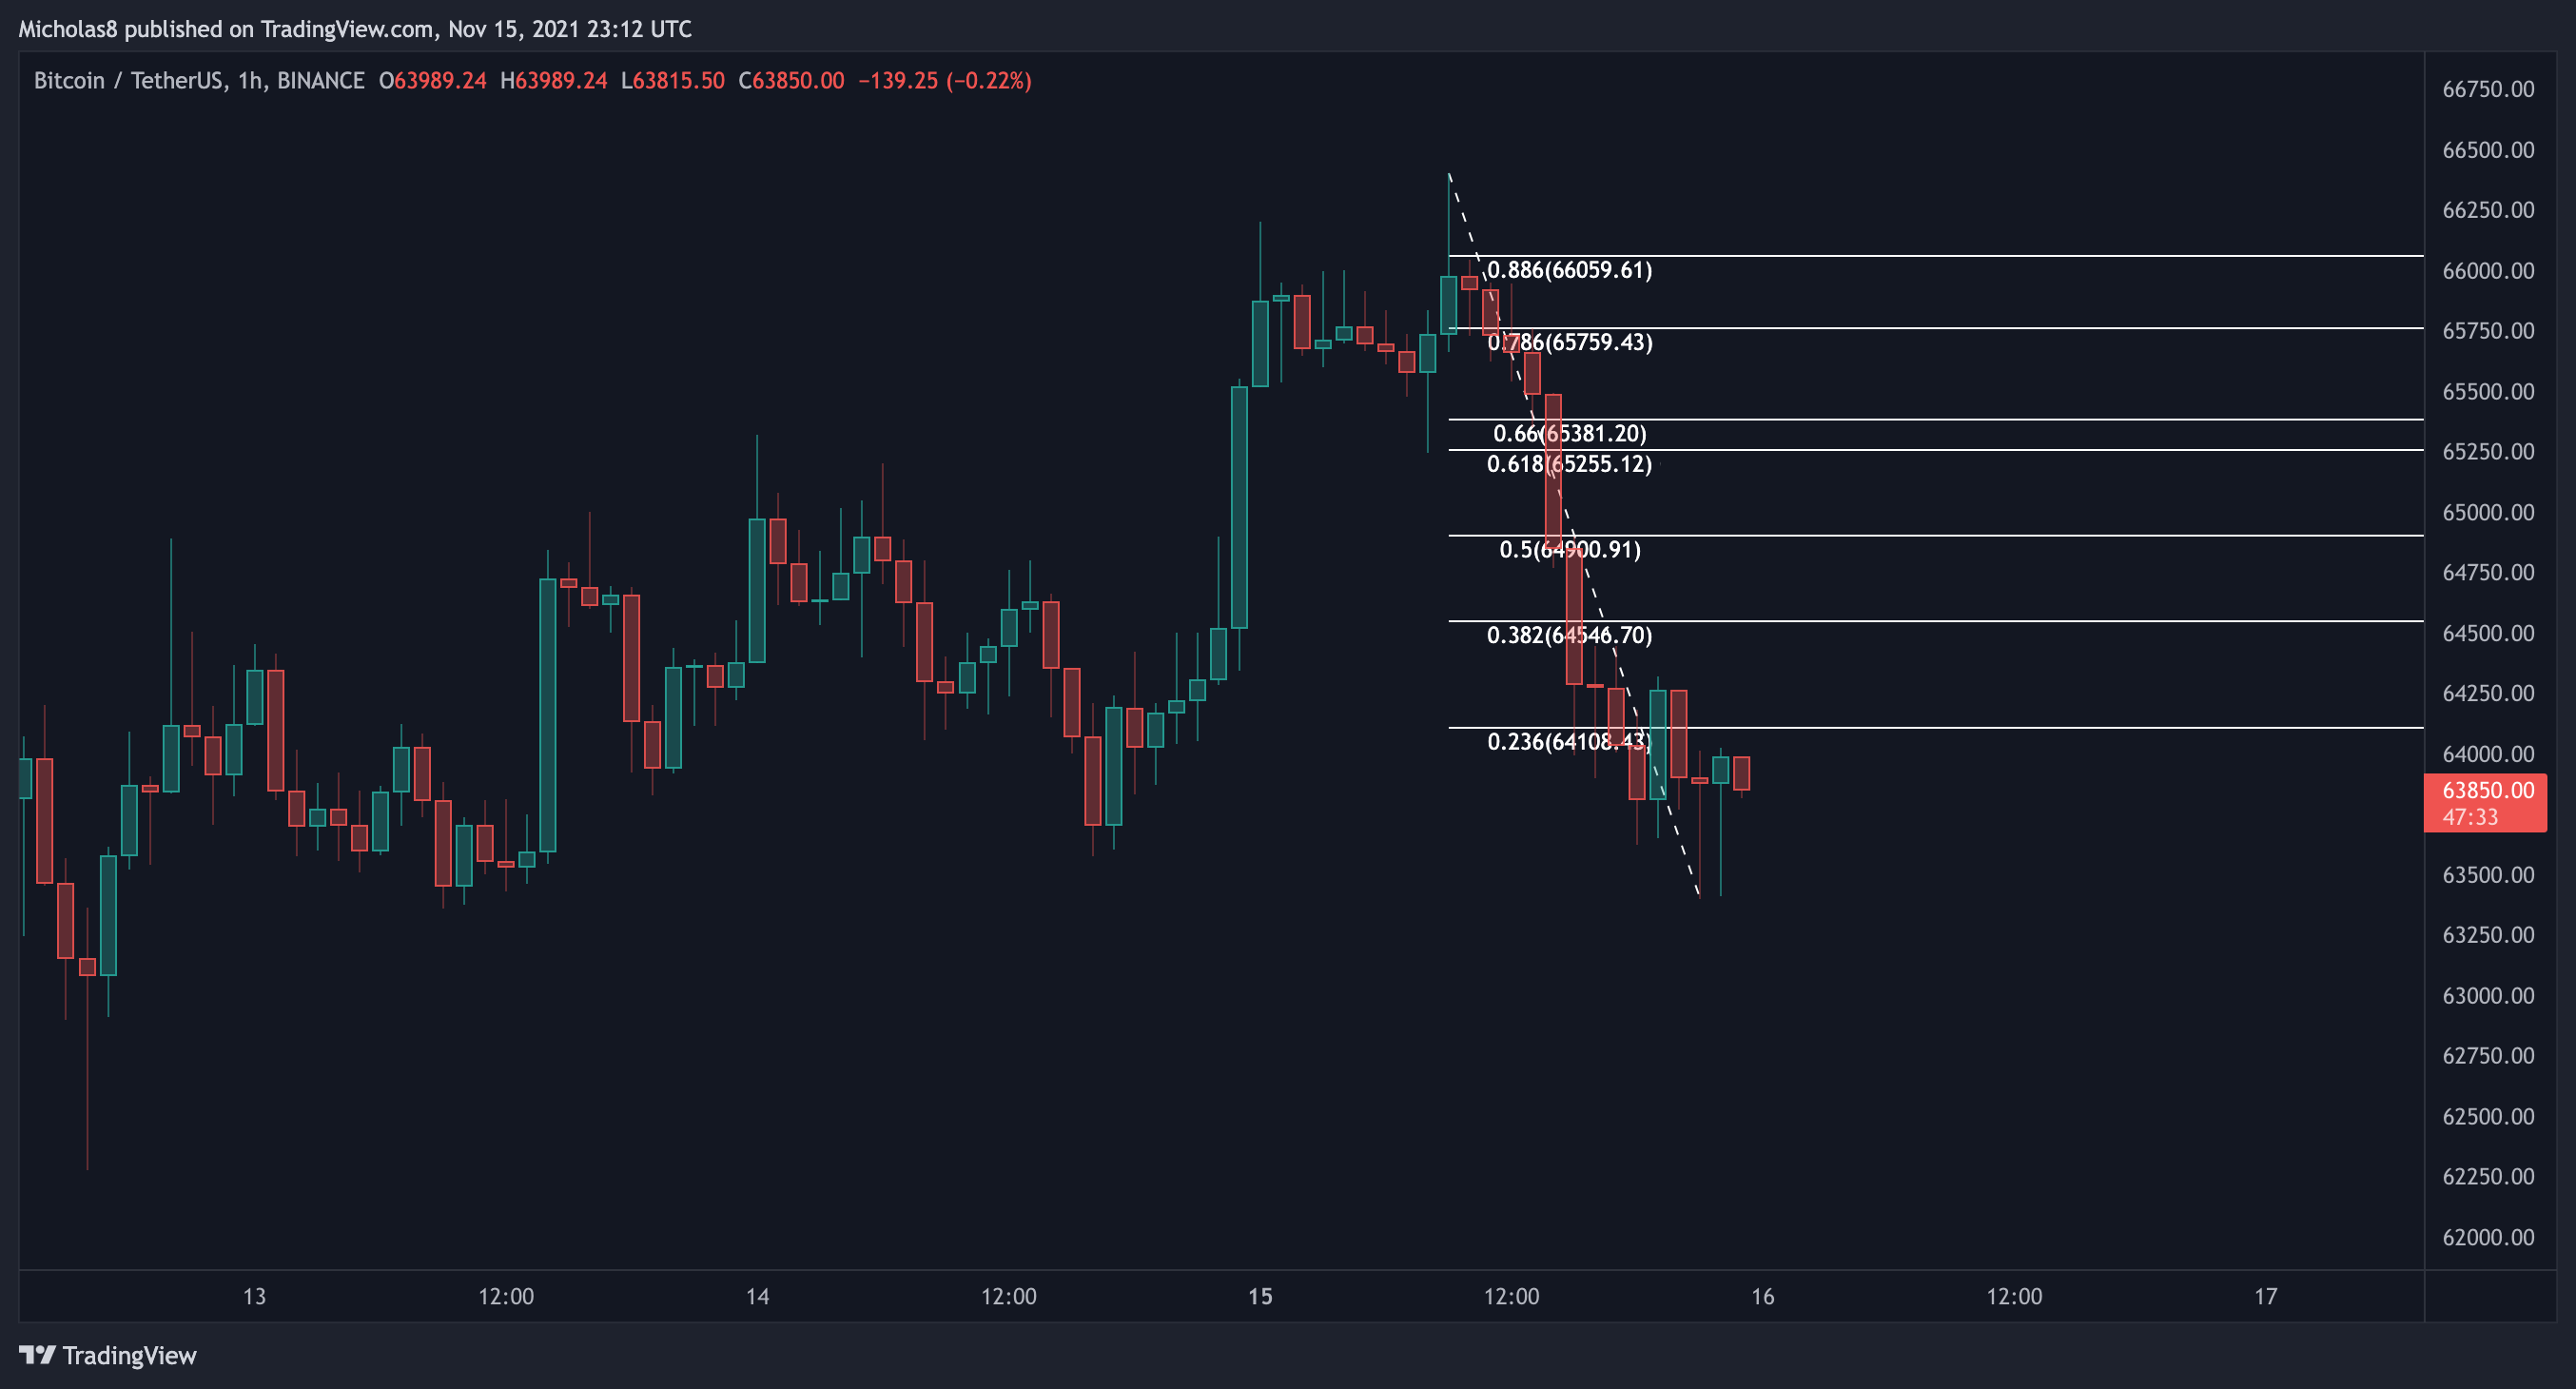
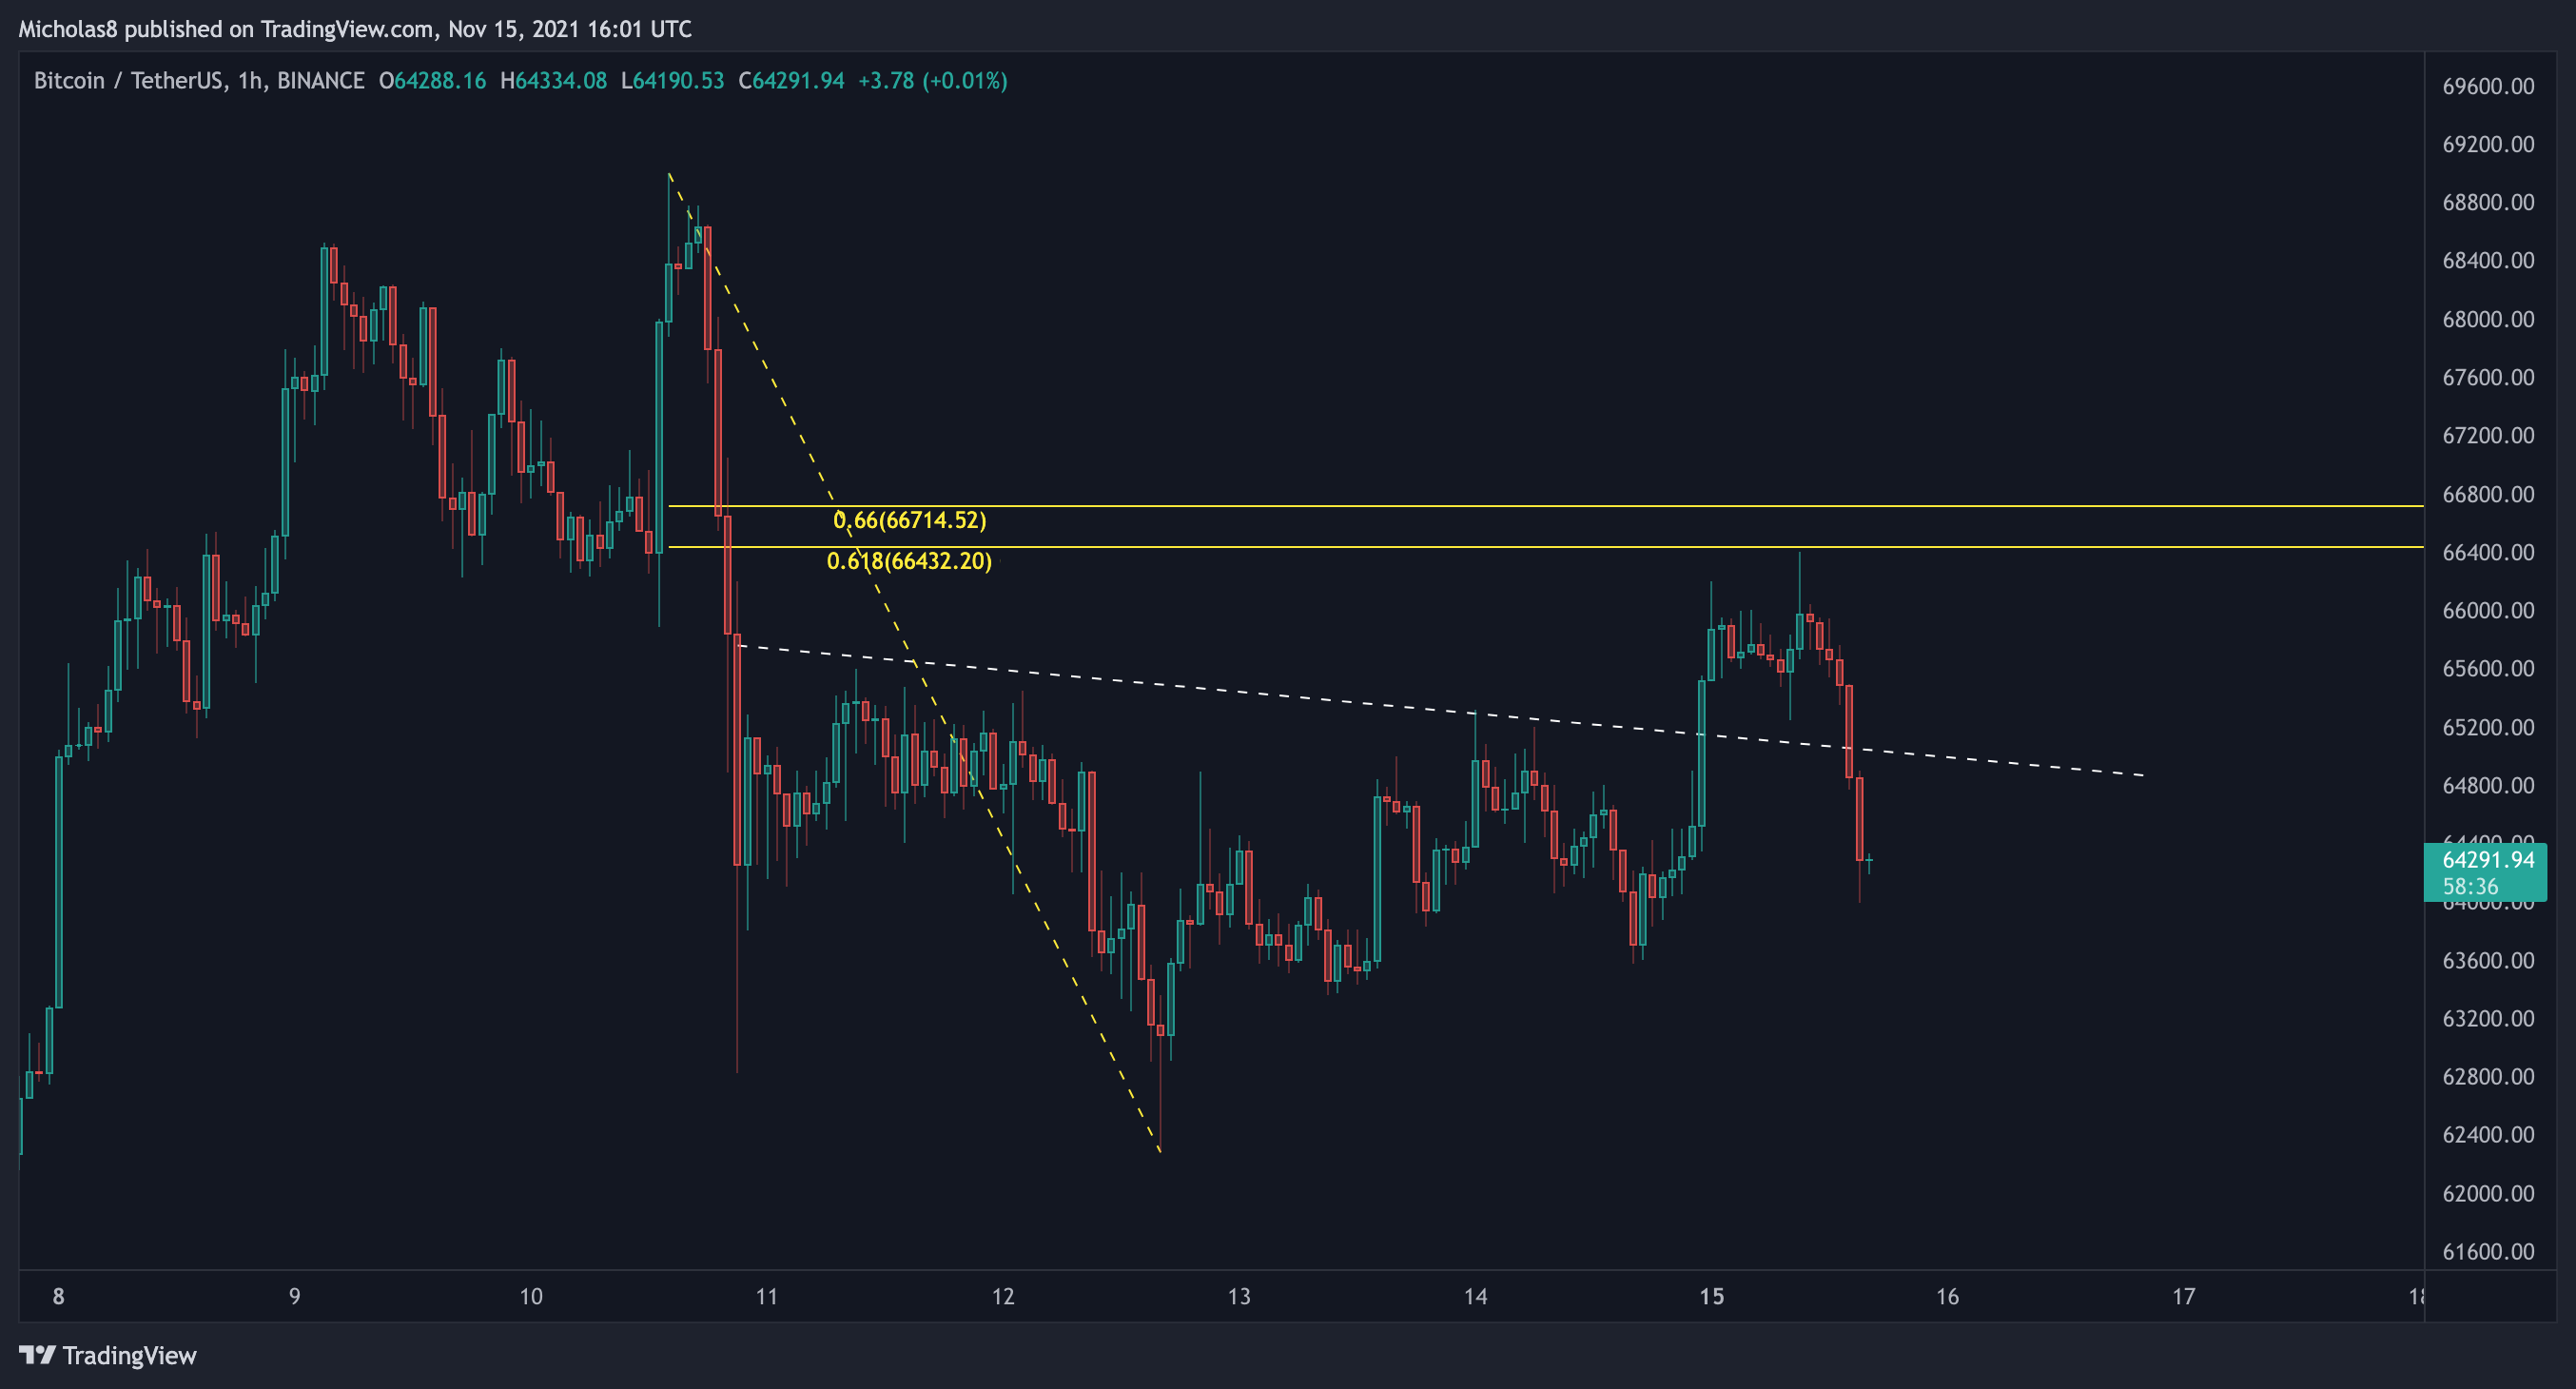
After Bitcoin was rejected by the Golden Pocket following the Inverse Head & Shoulders breakout, the price has fallen by as much as 5% today.
Momentum on the 1D MACD histogram remains negative, and the 4H MACD histogram has just printed its first negative momentum bar. These red negative histogram bars on the MACD indicate that the selling/bearish pressure in the market now outweighs the buying/bullish pressure.
The final thoughts from this morning and last night remain the same pretty much. I am still looking for a move to the downside first before a rise.
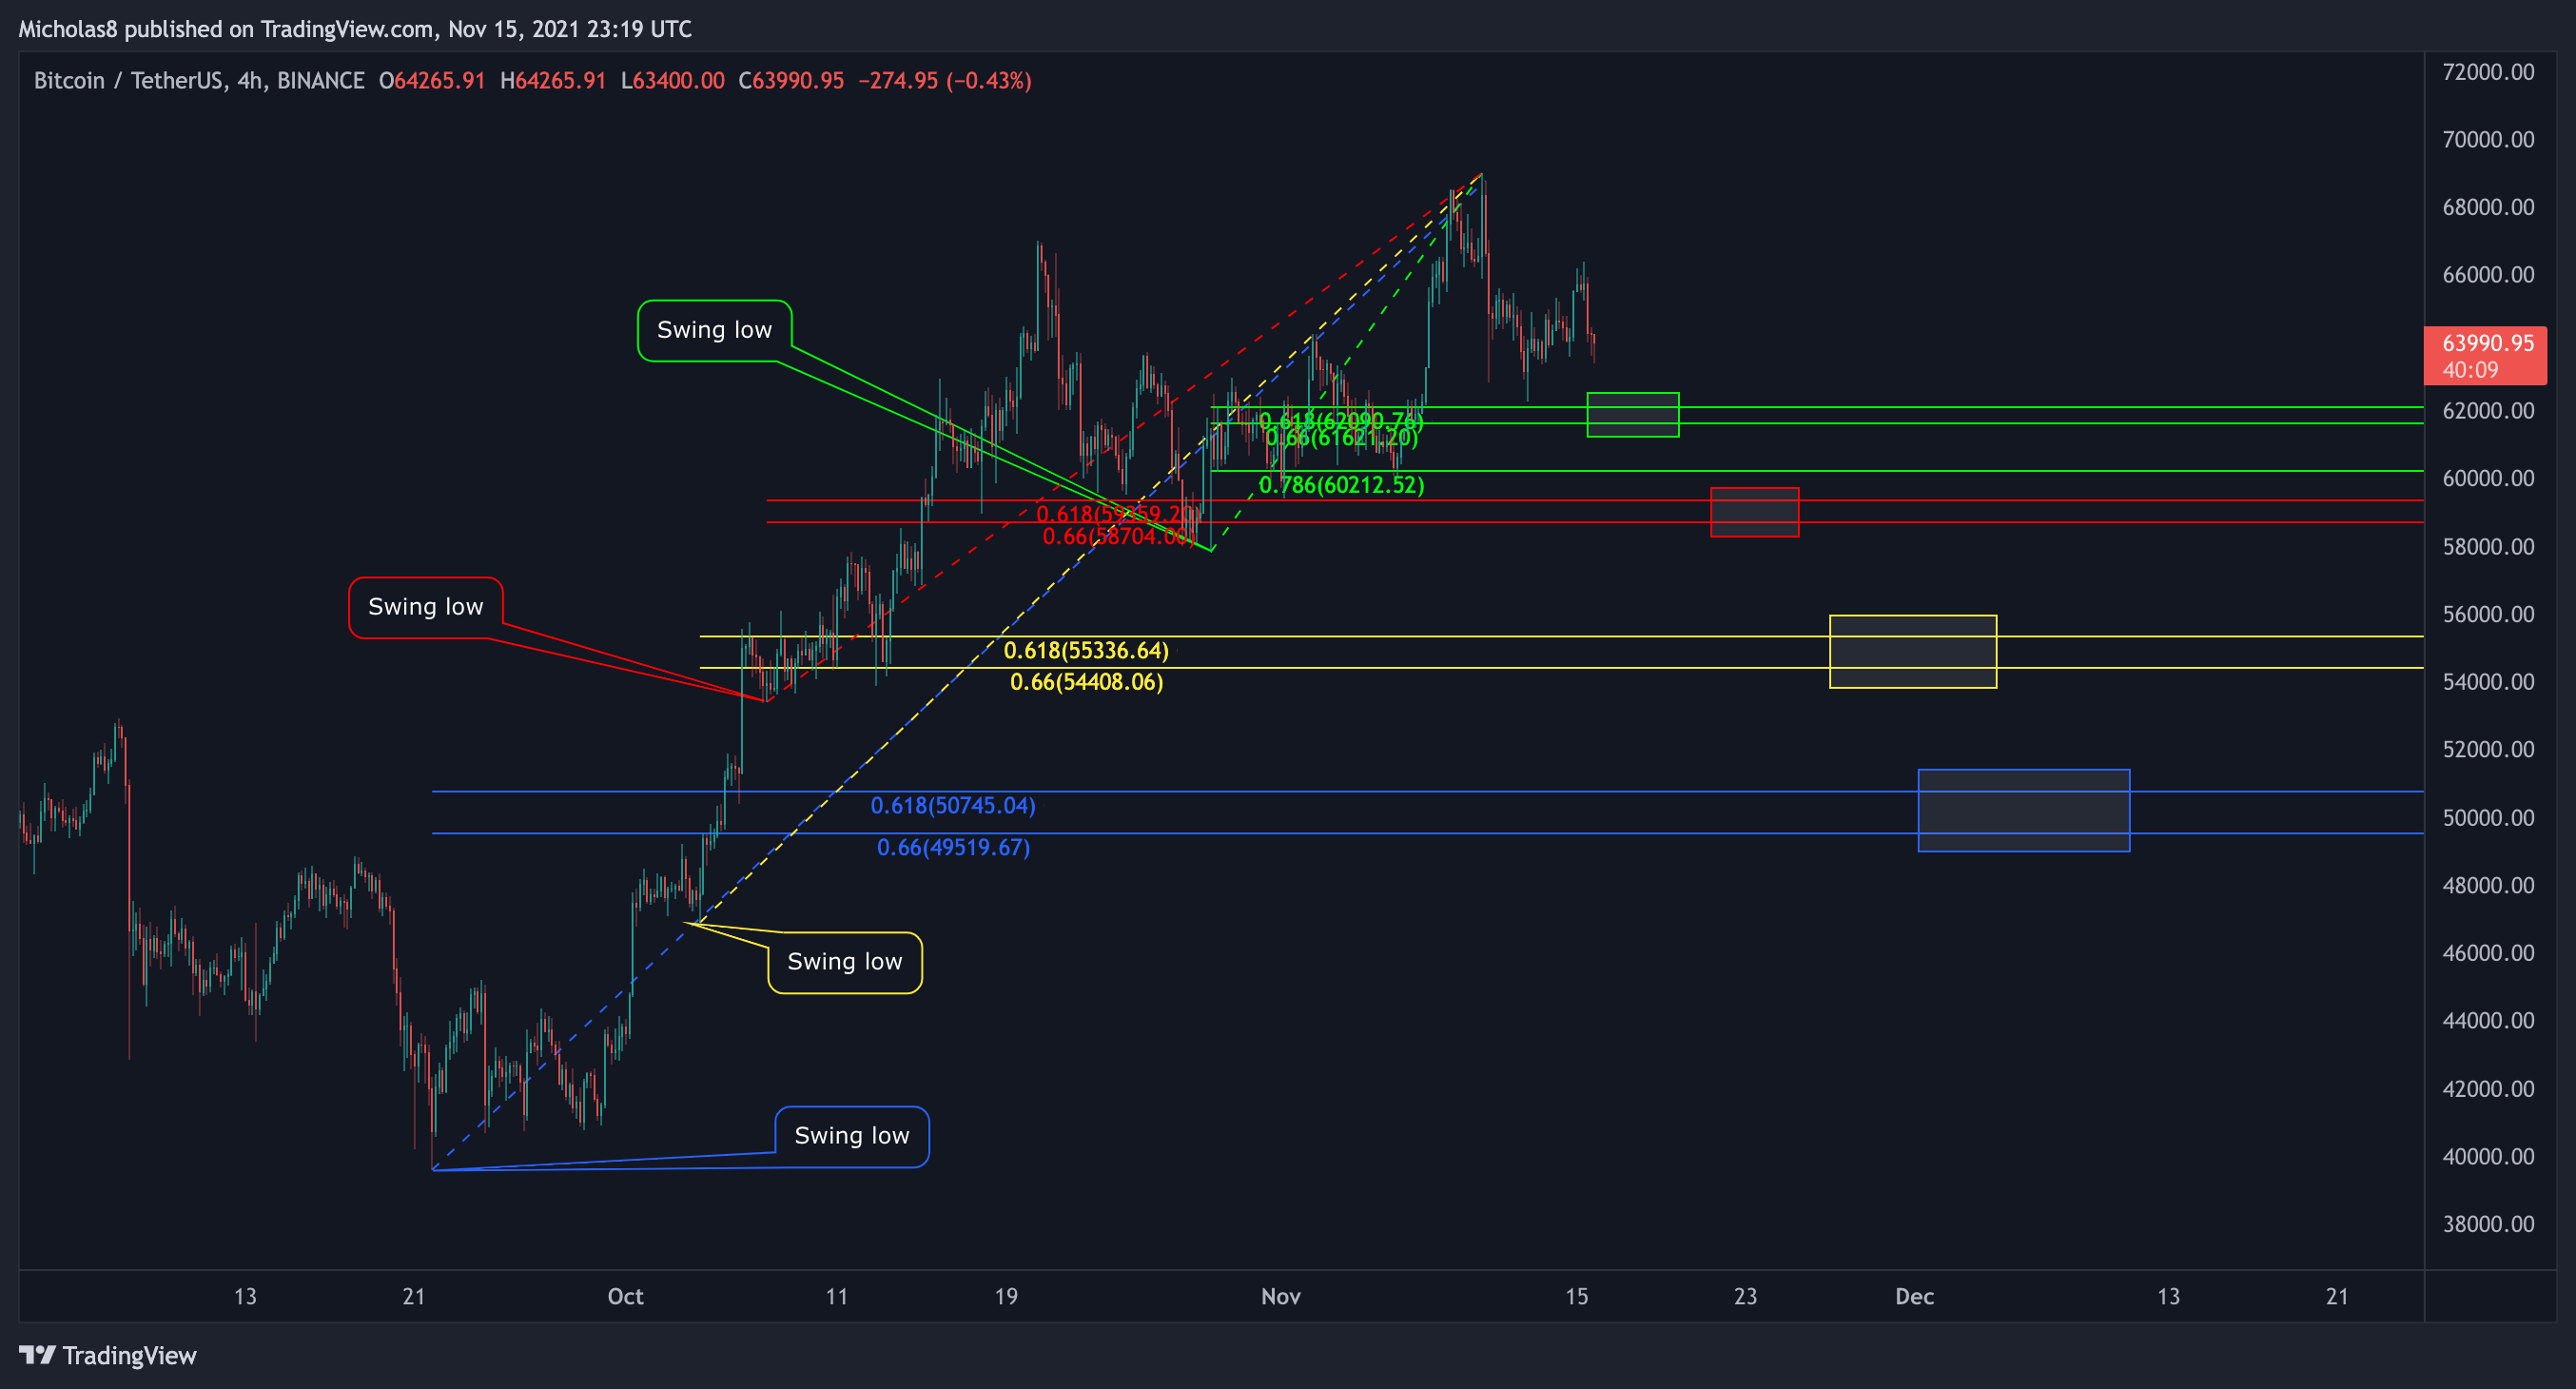
Depending on how far the price of Bitcoin falls, the Golden Pockets above are important levels I have my eye on for bounces.
If Bitcoin does continue up for a new ATH, these potential levels for a bounce will change.
All in all, Bitcoin is still in an uptrend, so we can remain reasonably bullish. But, there is still caution to be had given the huge pullback we are seeing in confluence with the bearish technicals we've been looking at over the last few days/weeks. Keep in mind, we still may have more downside to go before any sort of meaningful continuation up. If/when the CME Gap fills (which I do believe it will), we will need to re-evaluate the market conditions then.
Thank you for your continued support and I hope you have a great start to your week!
Cheers!
To become a Premium Member, follow the link below:
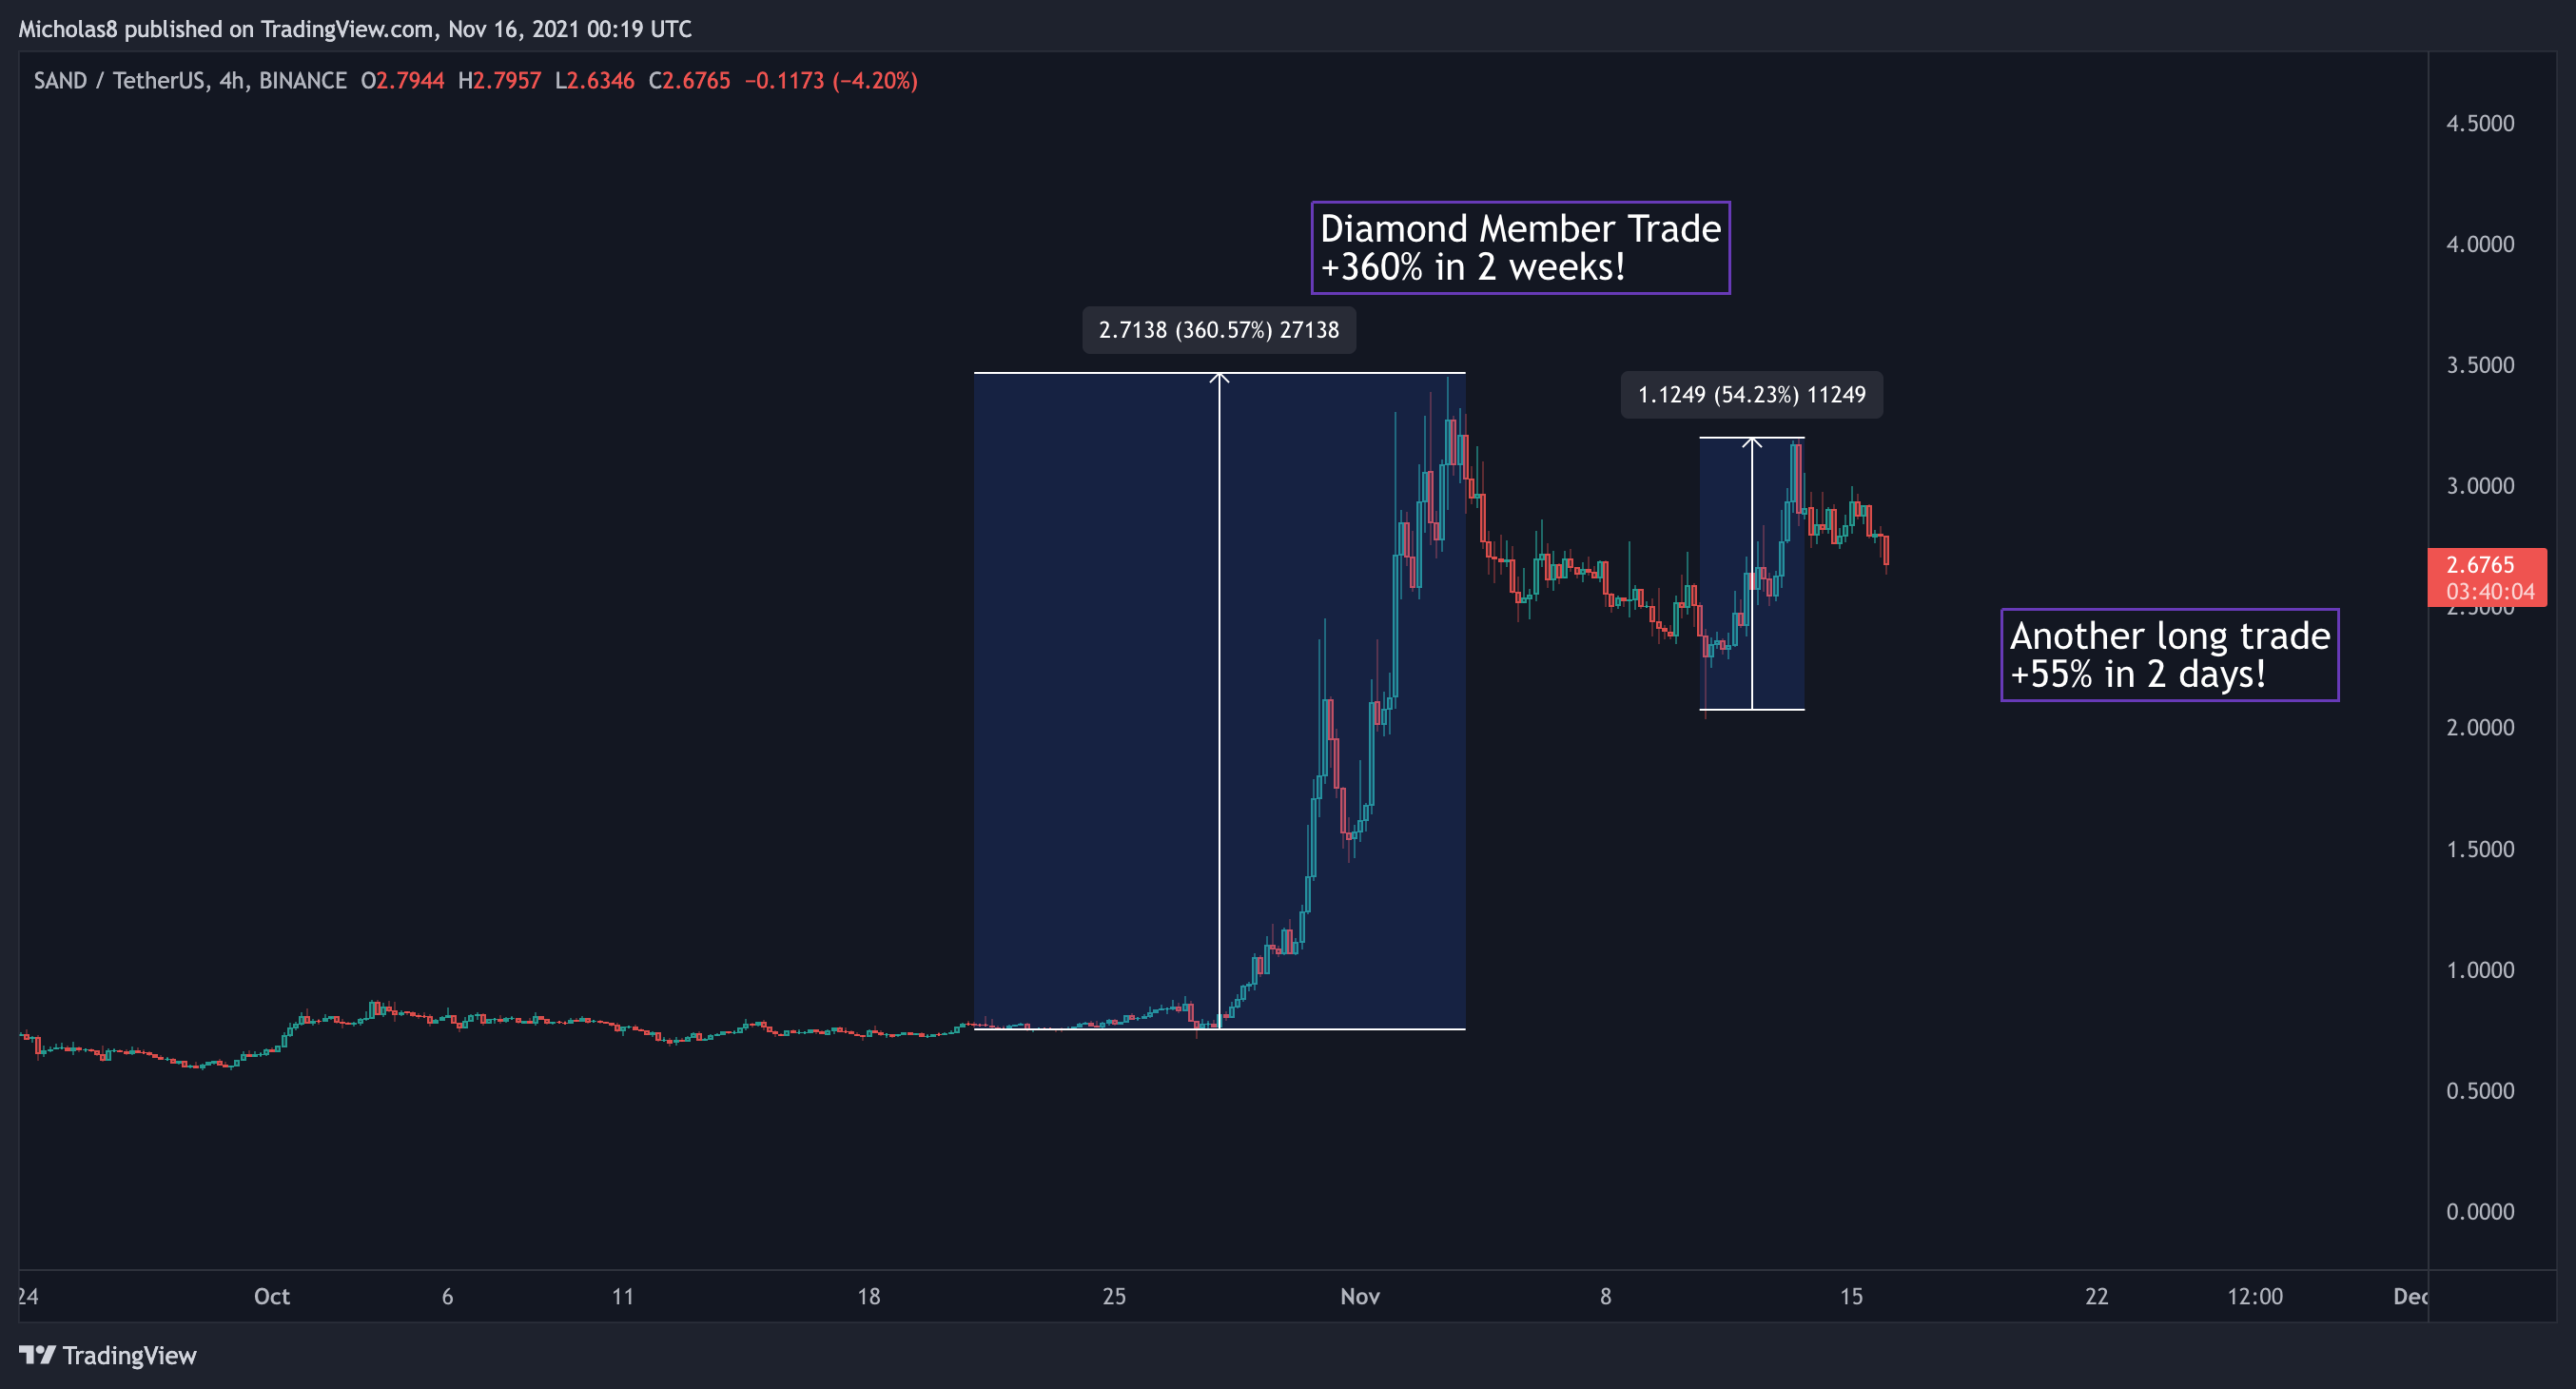
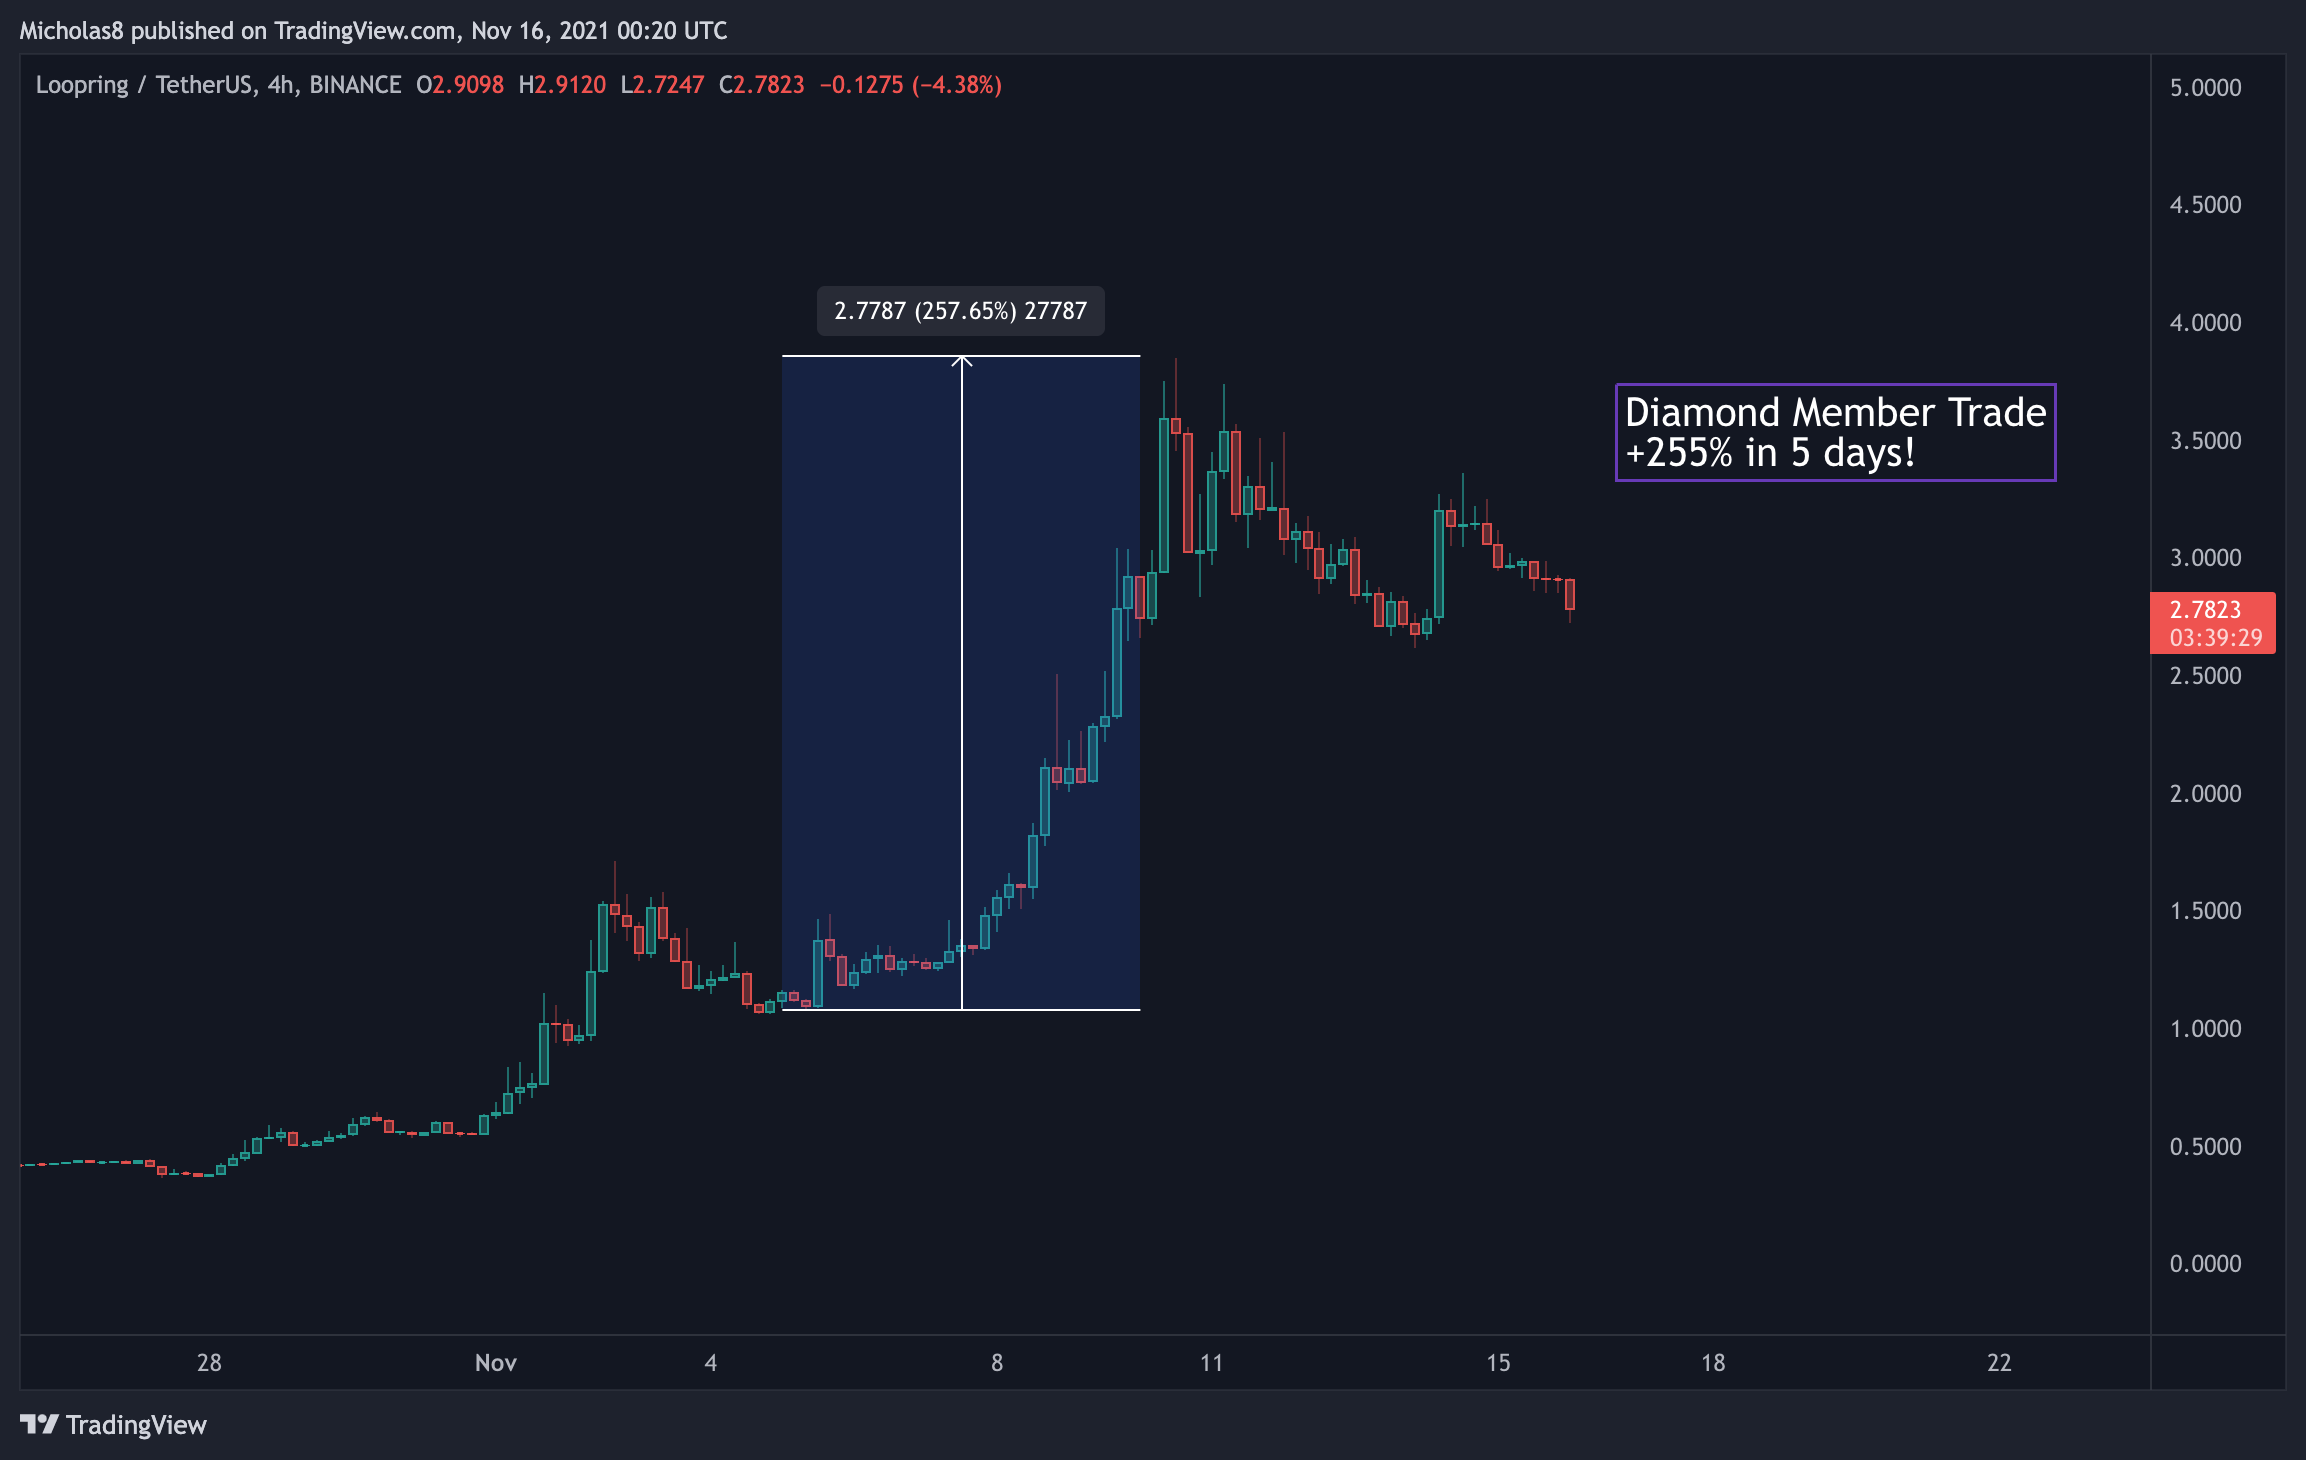
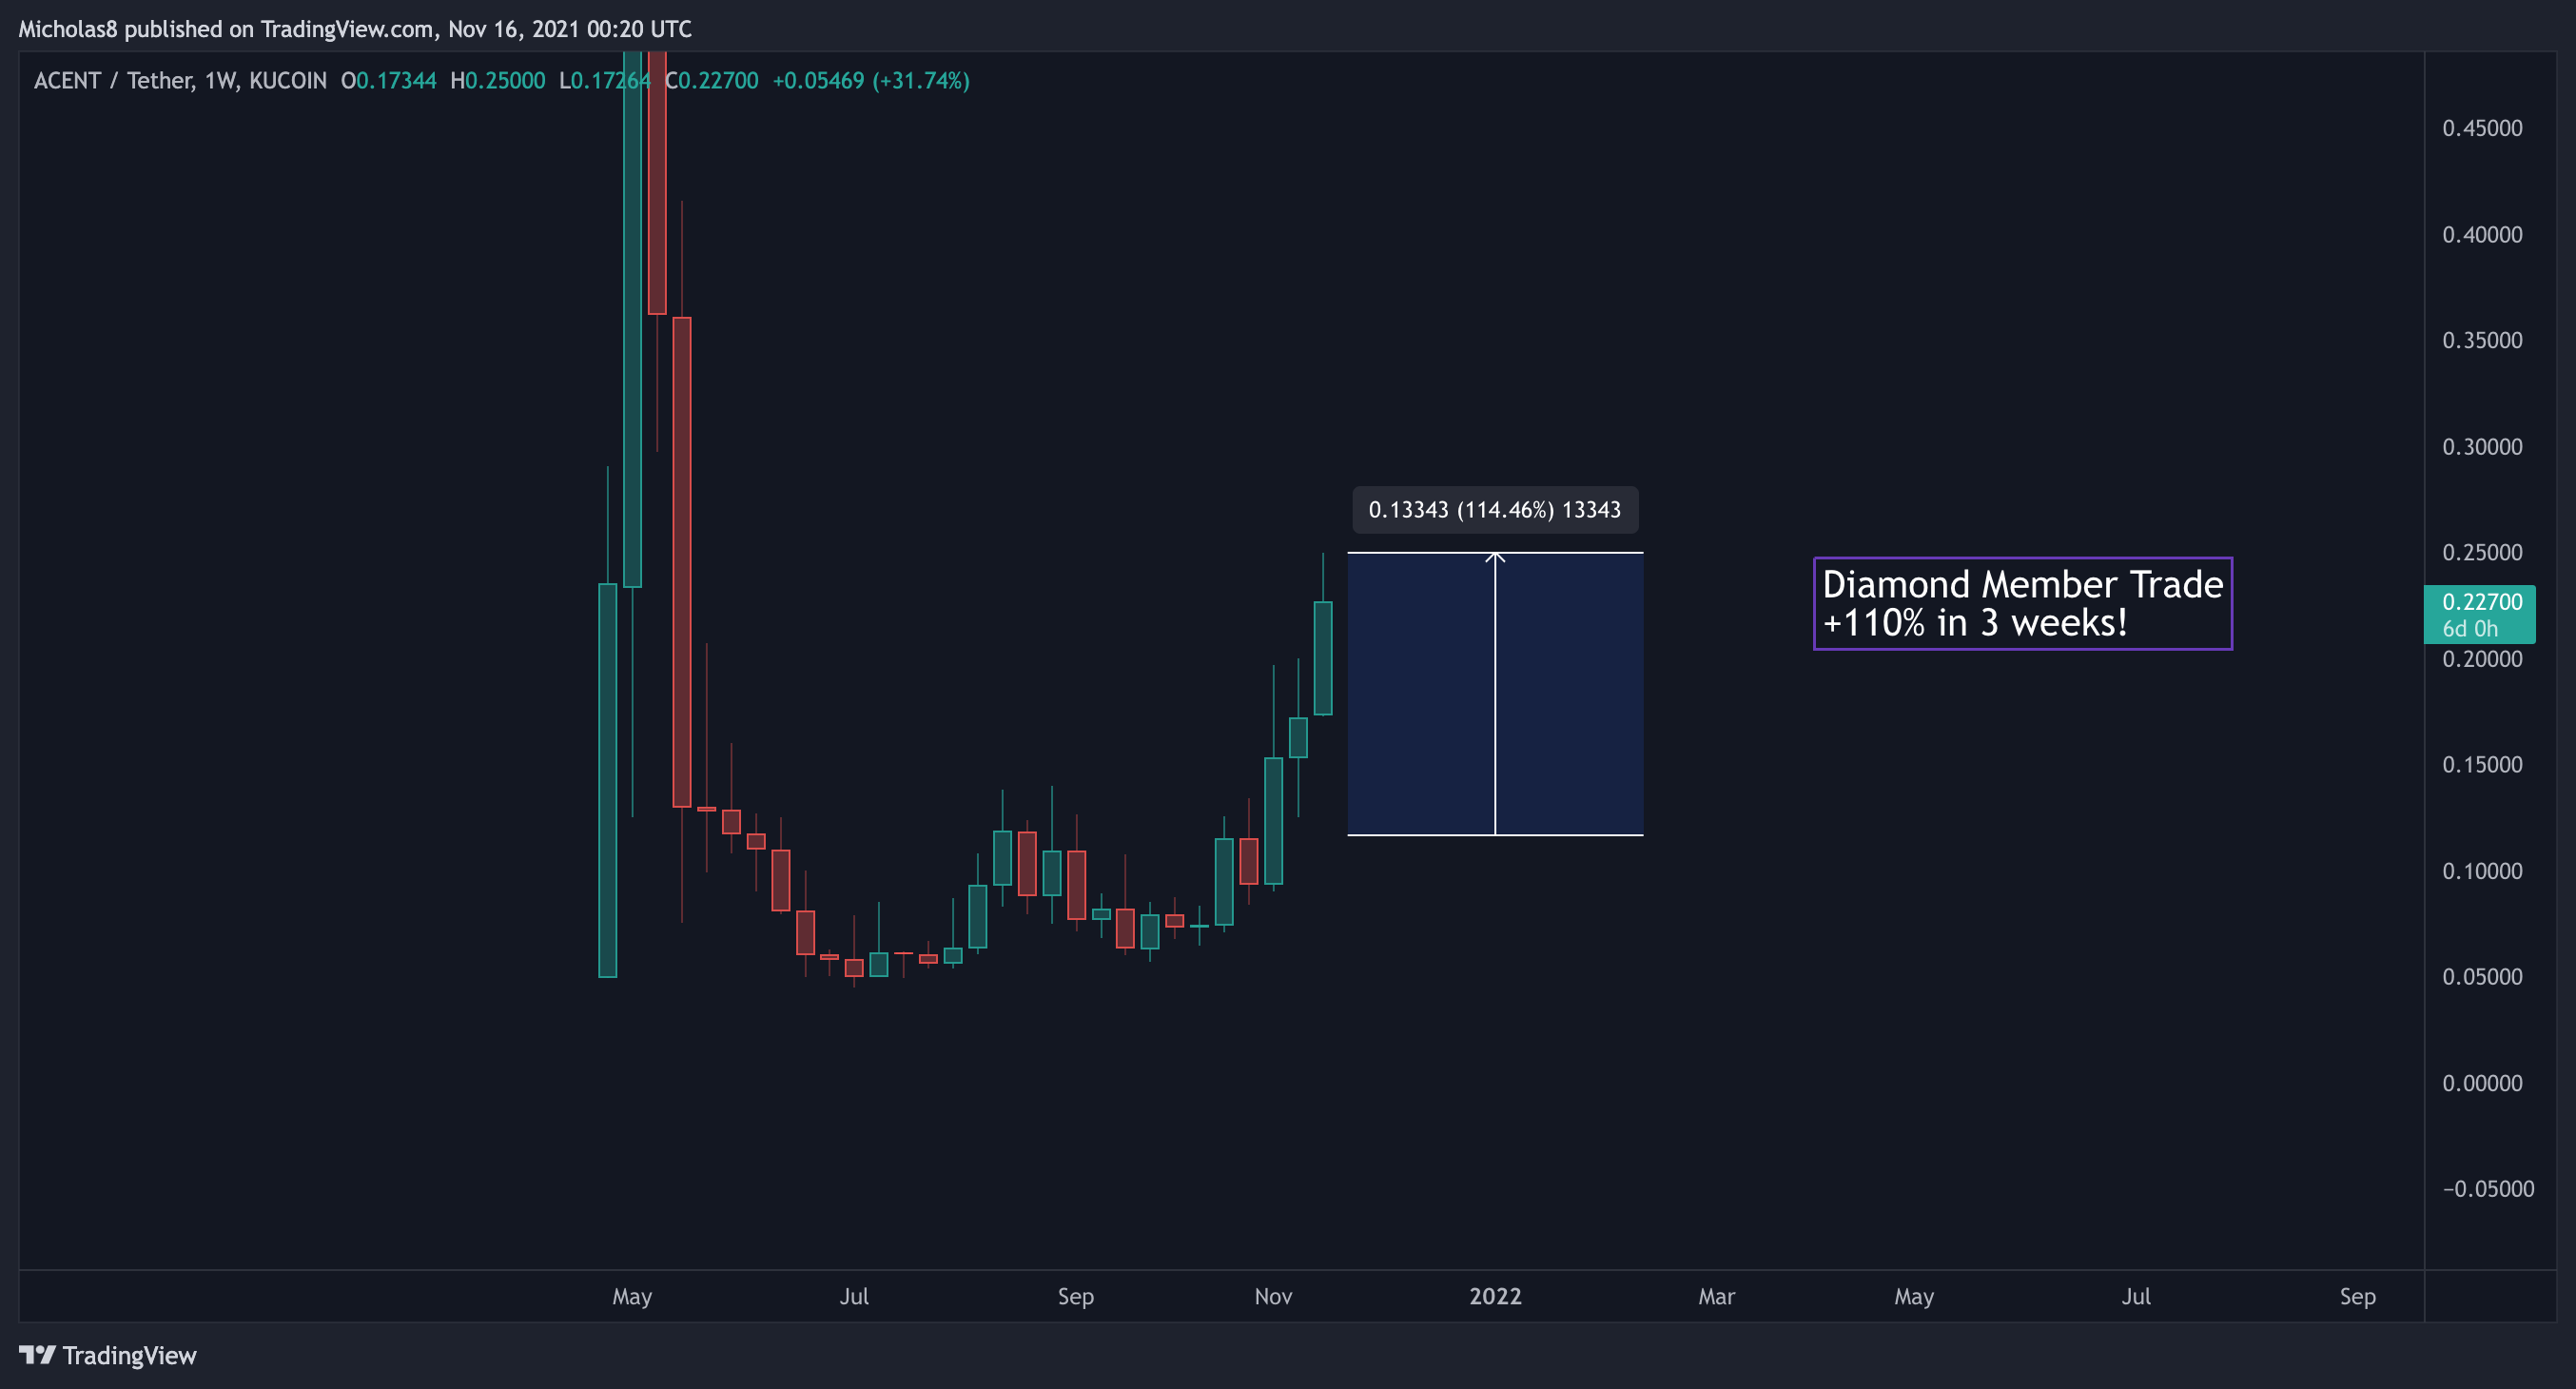
Diamond Member Trade Profits (these are just a few)