

To subscribe to this newsletter (44 reports per month), or take advantage of the other tiers offered, please visit the link below:
https://www.buymeacoffee.com/bitcoincharts
I recommend reading these reports on the Buy Me A Coffee platform for optimal formatting.
You will find the content below in this order:
1. Definitions
2. The Good
3. The Bad
4. CME Gaps
5. Key Levels
6. Final Thoughts
DEFINITIONS
Liquidity zones are high volume levels that offer support and resistance
Hidden bearish divergence: creating a lower high in price, with a higher high on the oscillators. This signals a possible trend continuation down.
Bearish divergence: higher high in price, lower high on the oscillators. This signals a possible trend reversal down.
Hidden bullish divergence: creating a higher low in price, with a lower low on the oscillators. This signals a possible trend continuation up.
Bullish divergence: creating a lower low in price, with a higher low on the oscillators. This signals a possible trend reversal up.
SR flip: turning old resistance into support, and vice-versa.
Fractal: recurring geometric pattern.
THE GOOD
Daily Timeframe
Bullish Market Structure
Bitcoin continues to print higher highs and higher lows. This is known as a bullish market structure. As long as Bitcoin continues to print higher highs and higher lows, we are technically bullish.
Key Liquidity Zone (LQZ)
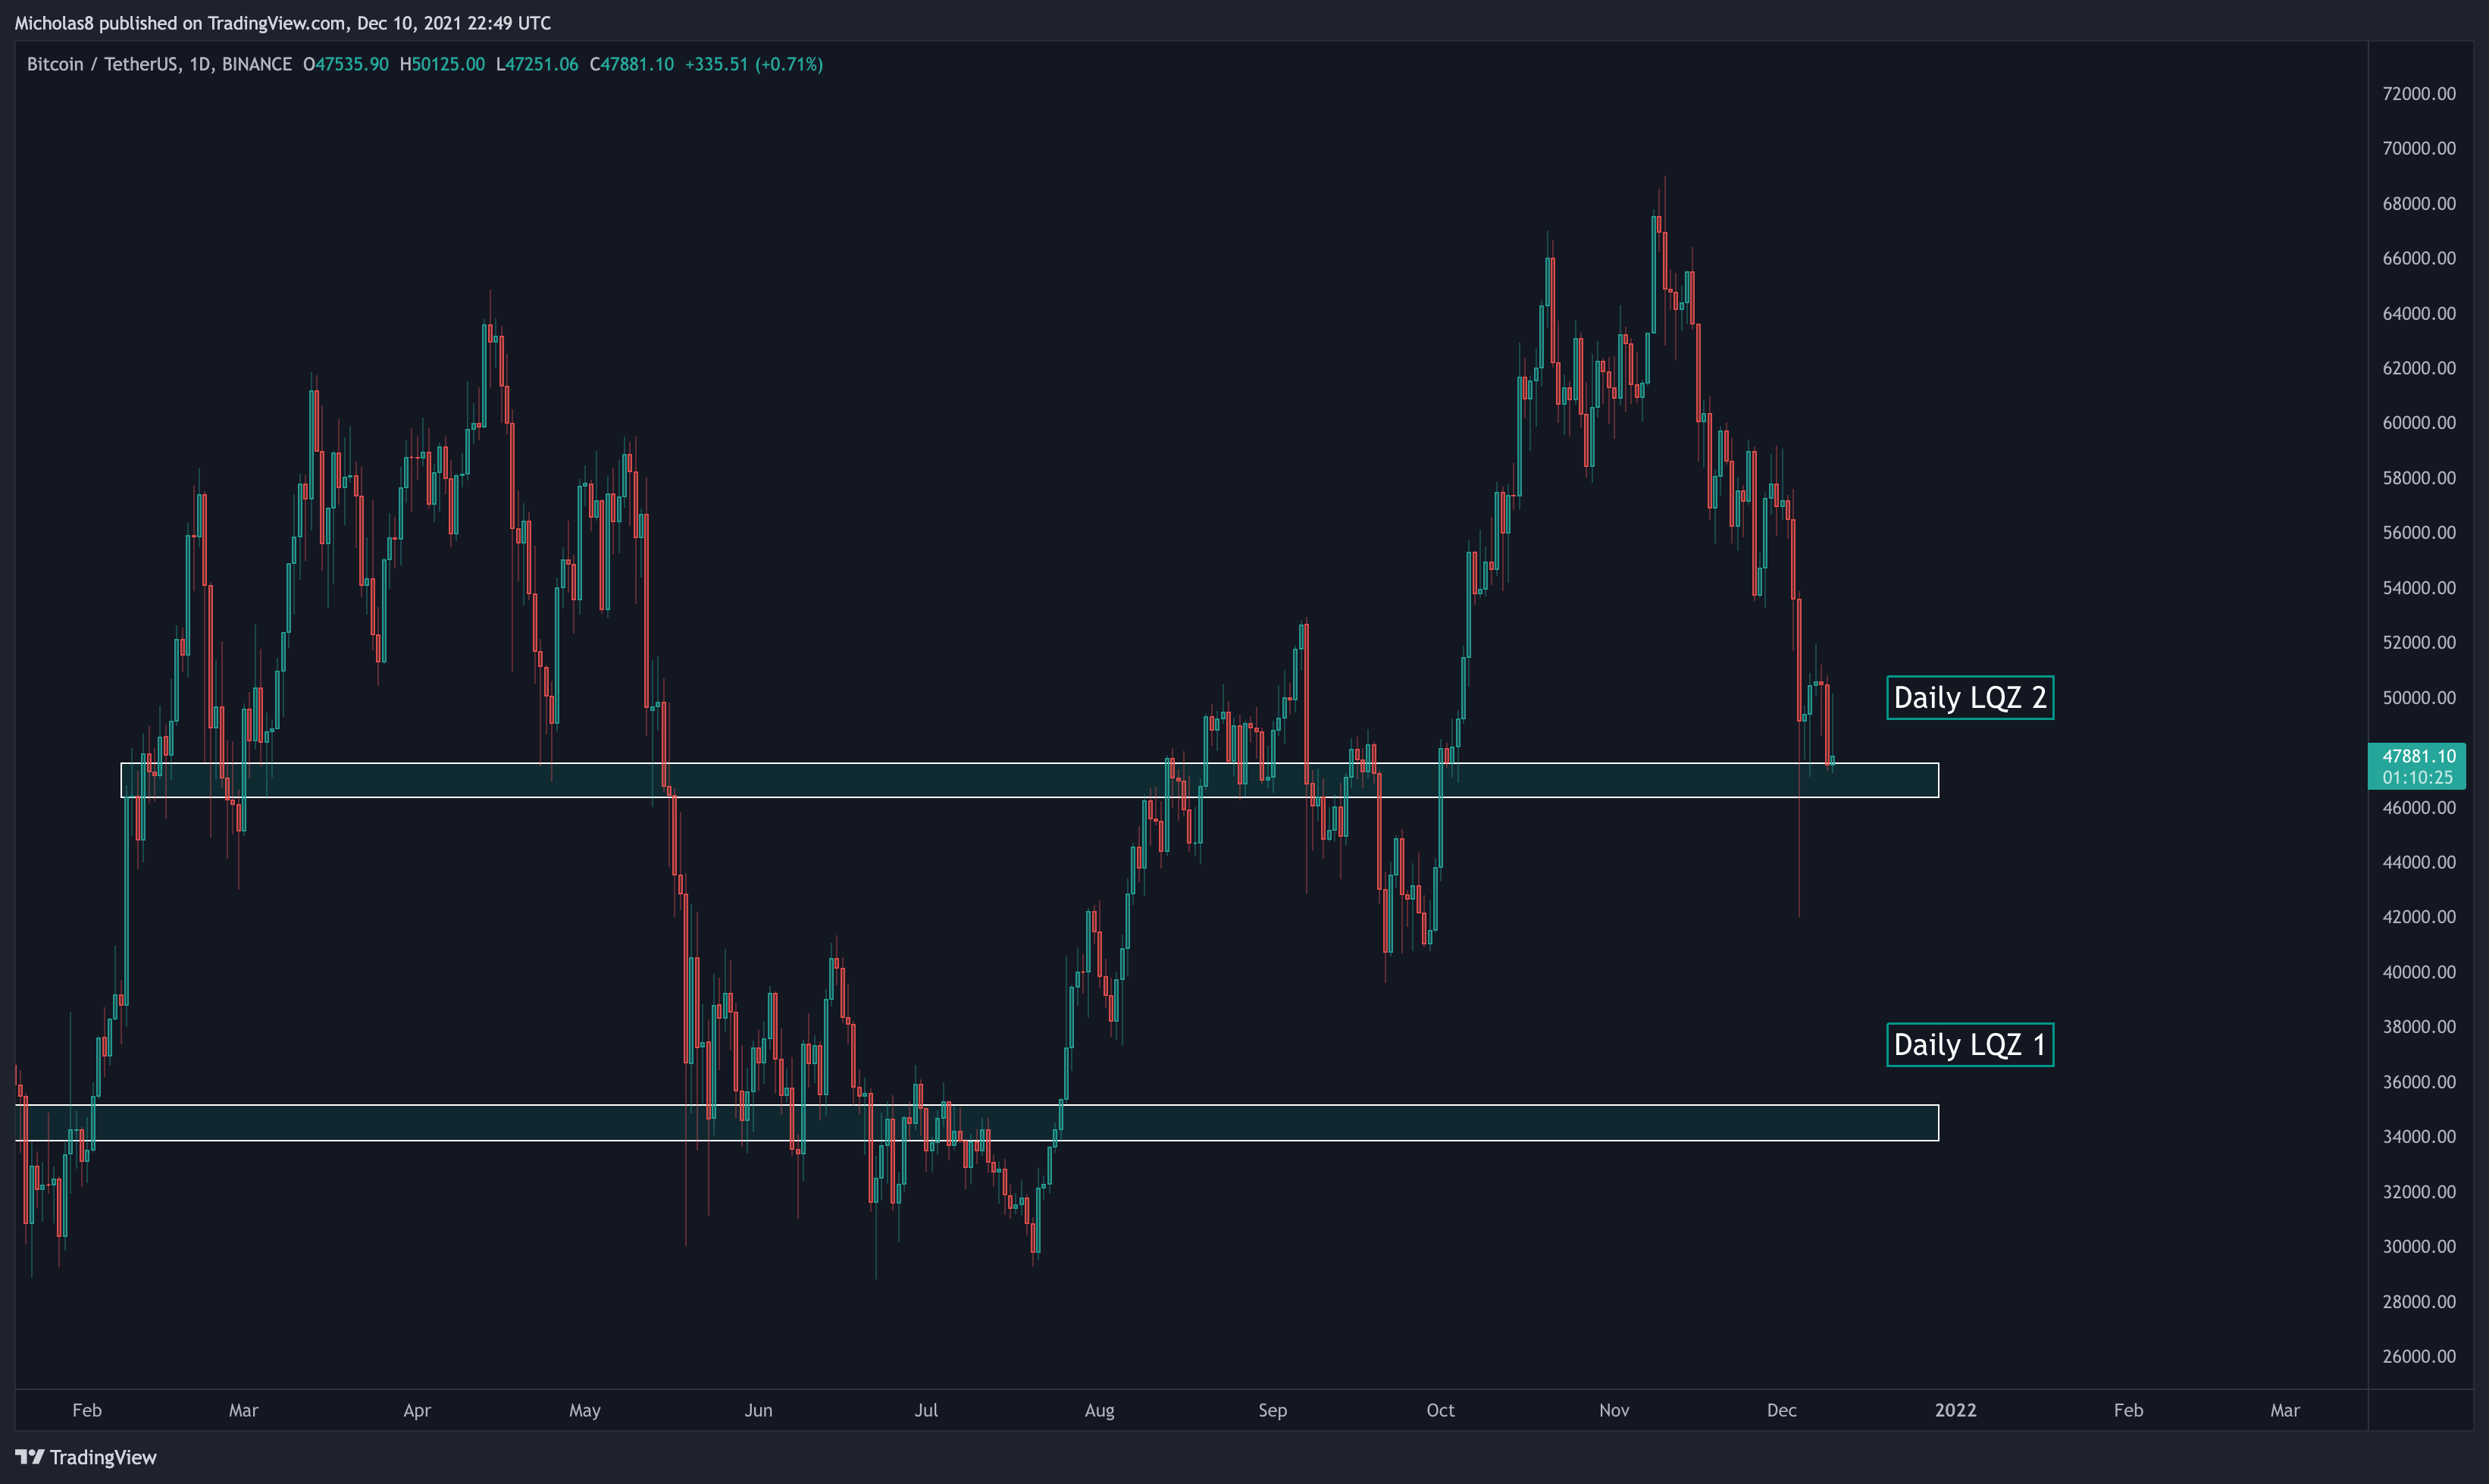
Zone 1: Sitting between 33.9k and 35.2k, Bitcoin is still trading above this Key Daily Liquidity Zone. As long Bitcoin remains above this zone, we can expect it to act as support.
Zone 2: The second LQZ sits at 46.4k - 47.6k.
Simple Moving Average (SMA): 200
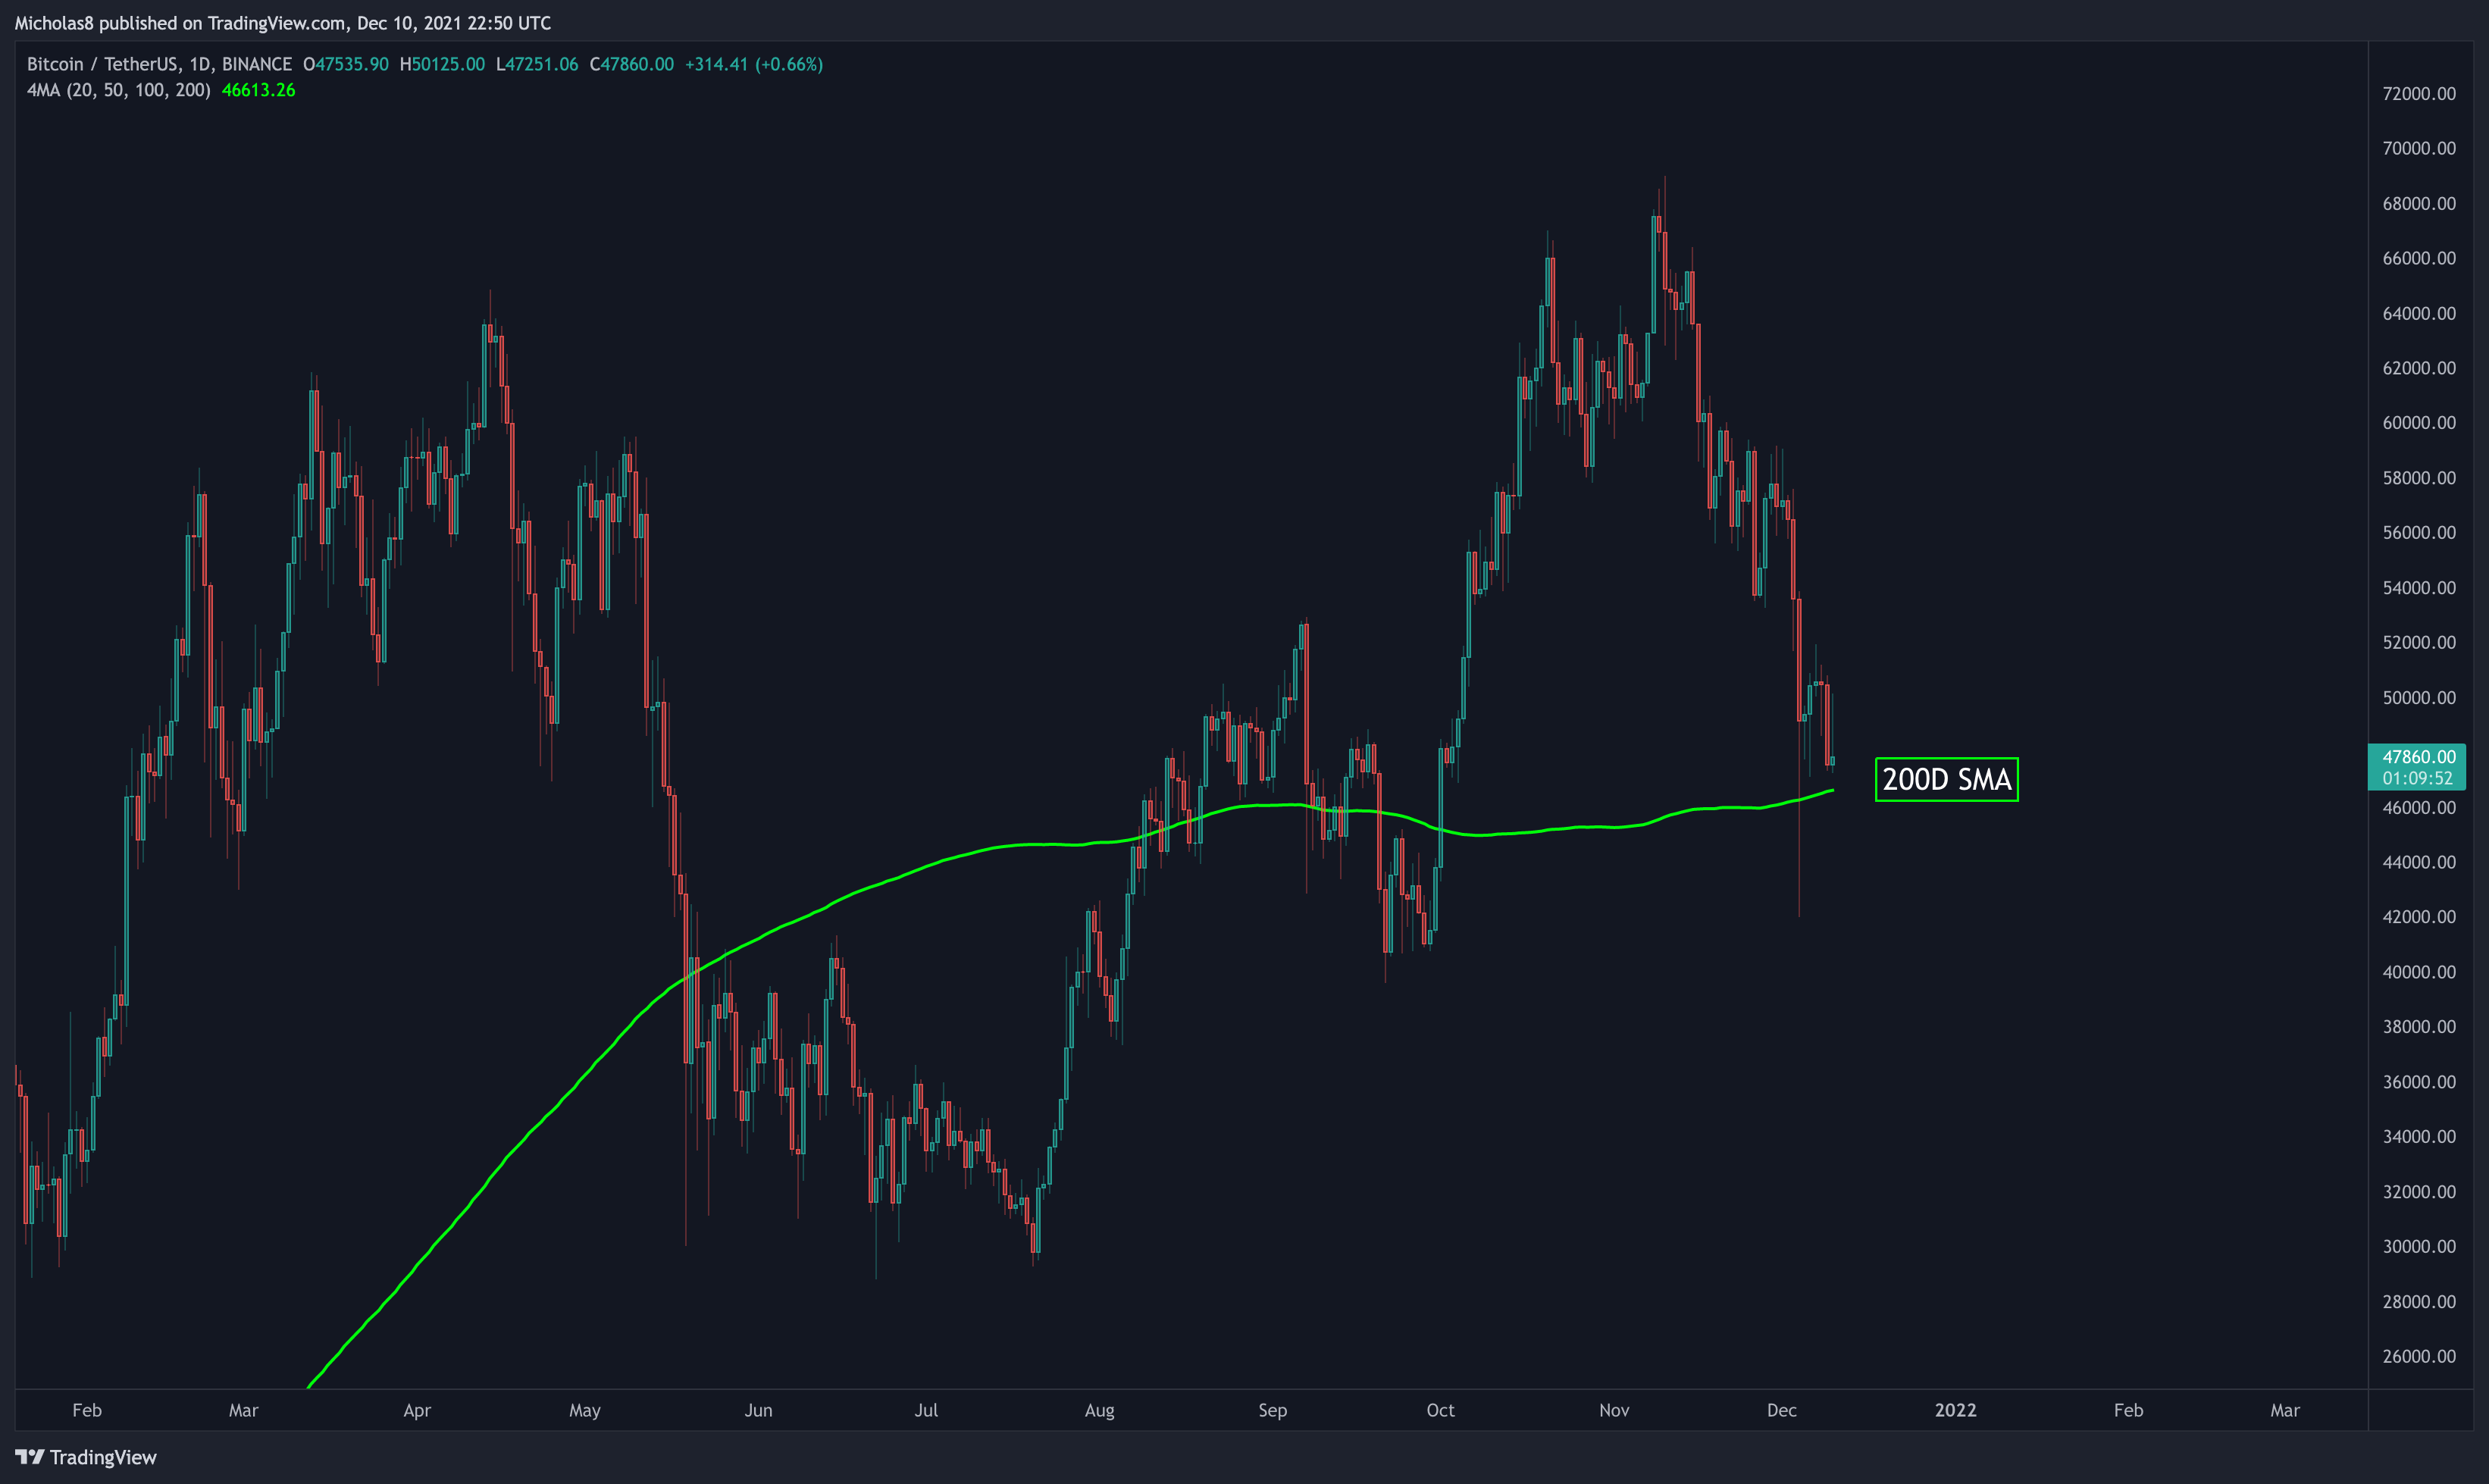
Bitcoin continues to trade above the 200-day SMA.
Implications: This will ideally serve as a level of support.
Divergences
Hidden Bullish Divergence
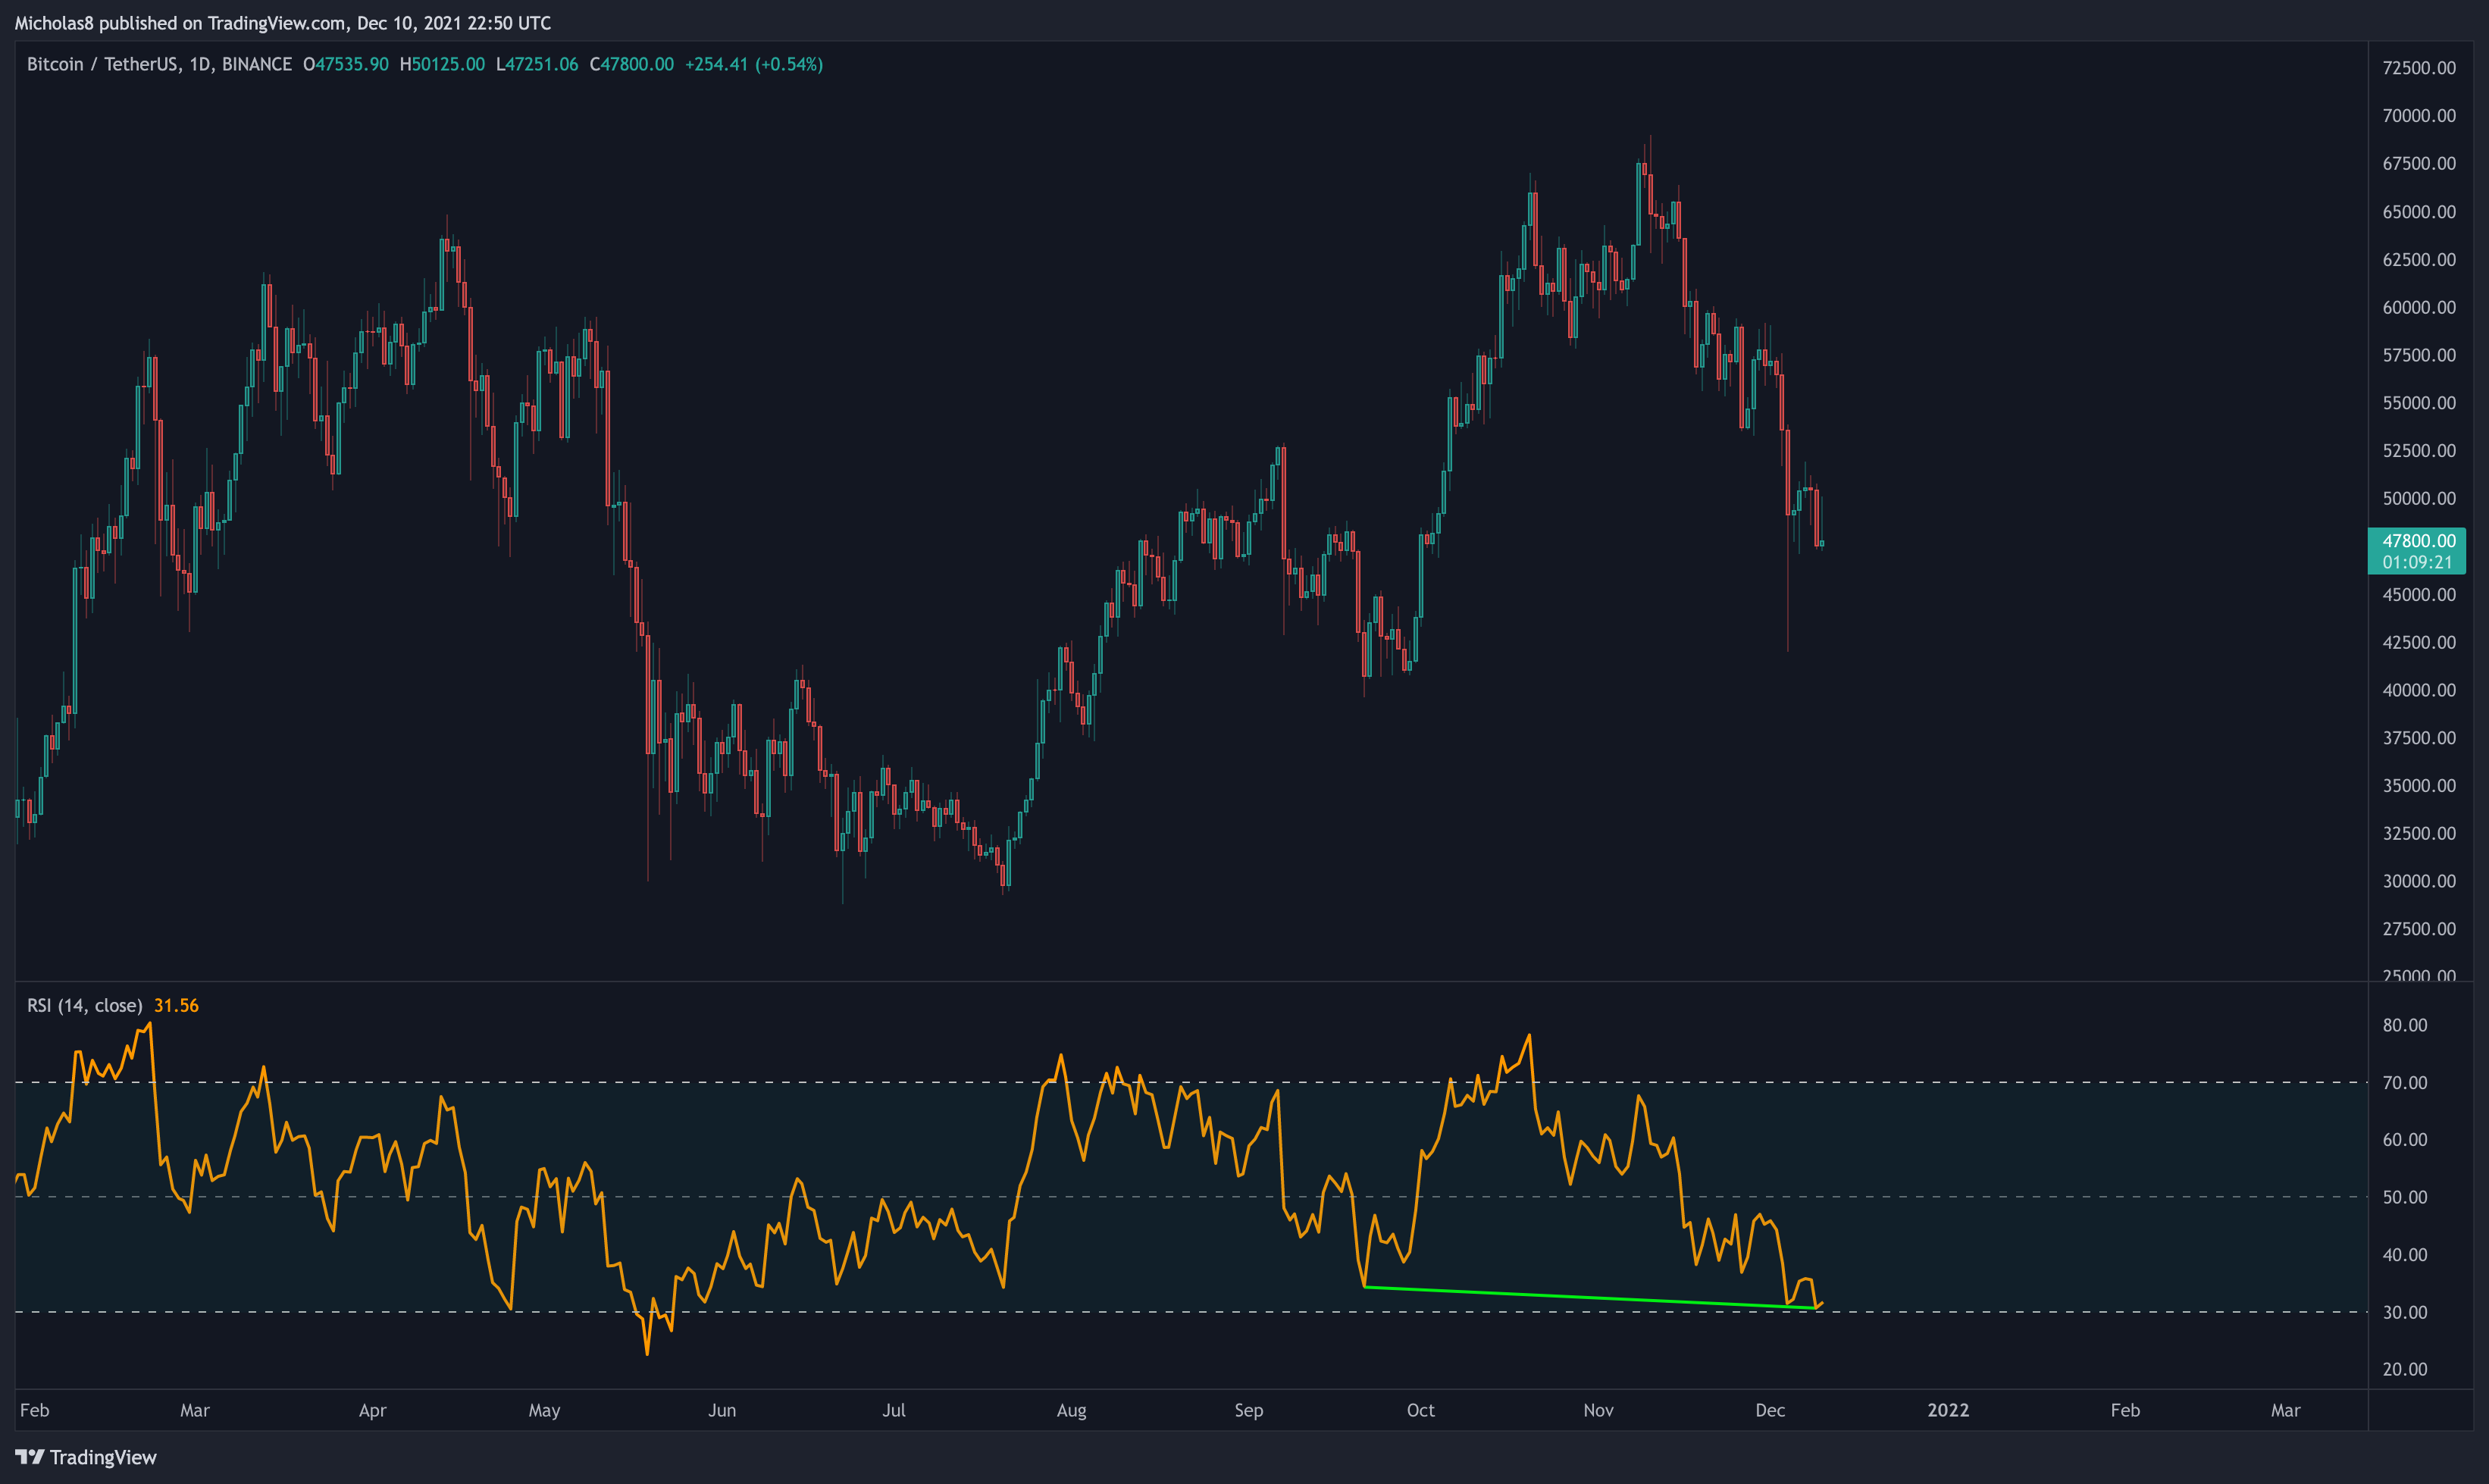
Bitcoin has a higher low in price, with a lower low on the RSI. This is a hidden bullish divergence, which signals a possible trend continuation up.
Invalidation: Lower low in price and the RSI.
Bullish Divergence
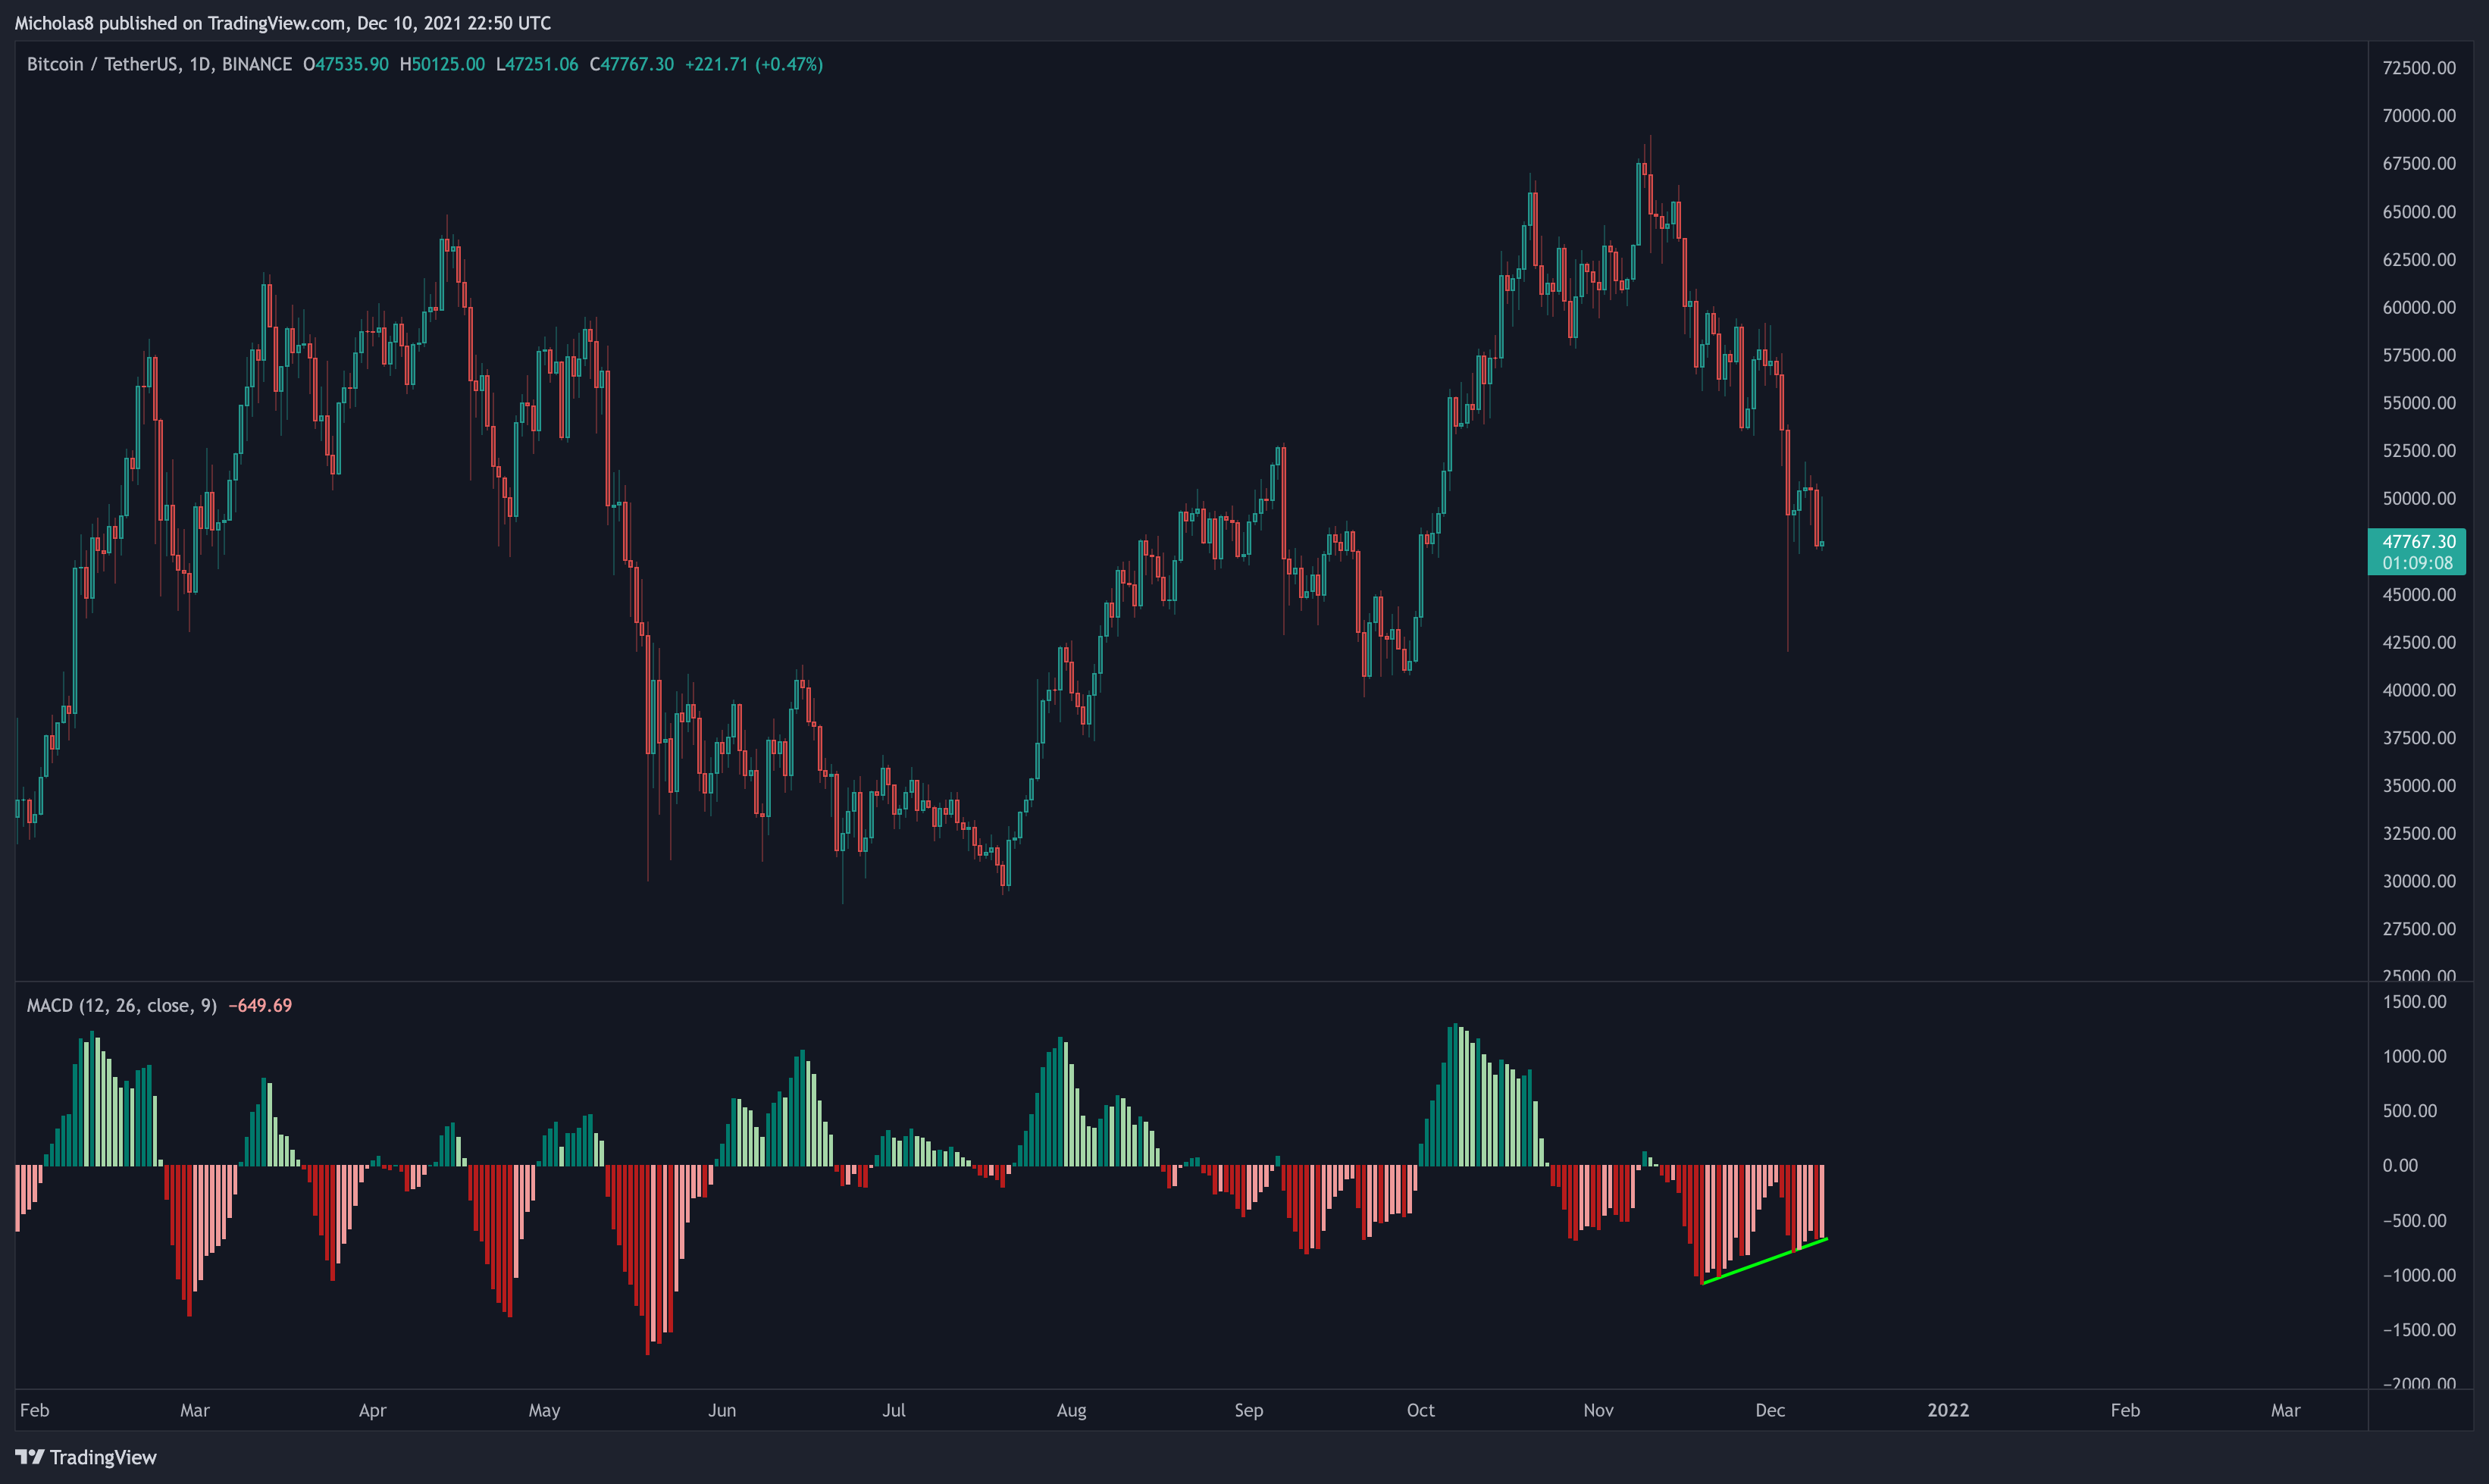
Bitcoin has a lower low in price, with a higher low on the MACD. This is a bullish divergence, which signals a possible trend reversal up.
Invalidation: Lower low in price and the RSI.
1H Timeframe
Divergences
Bullish Divergence
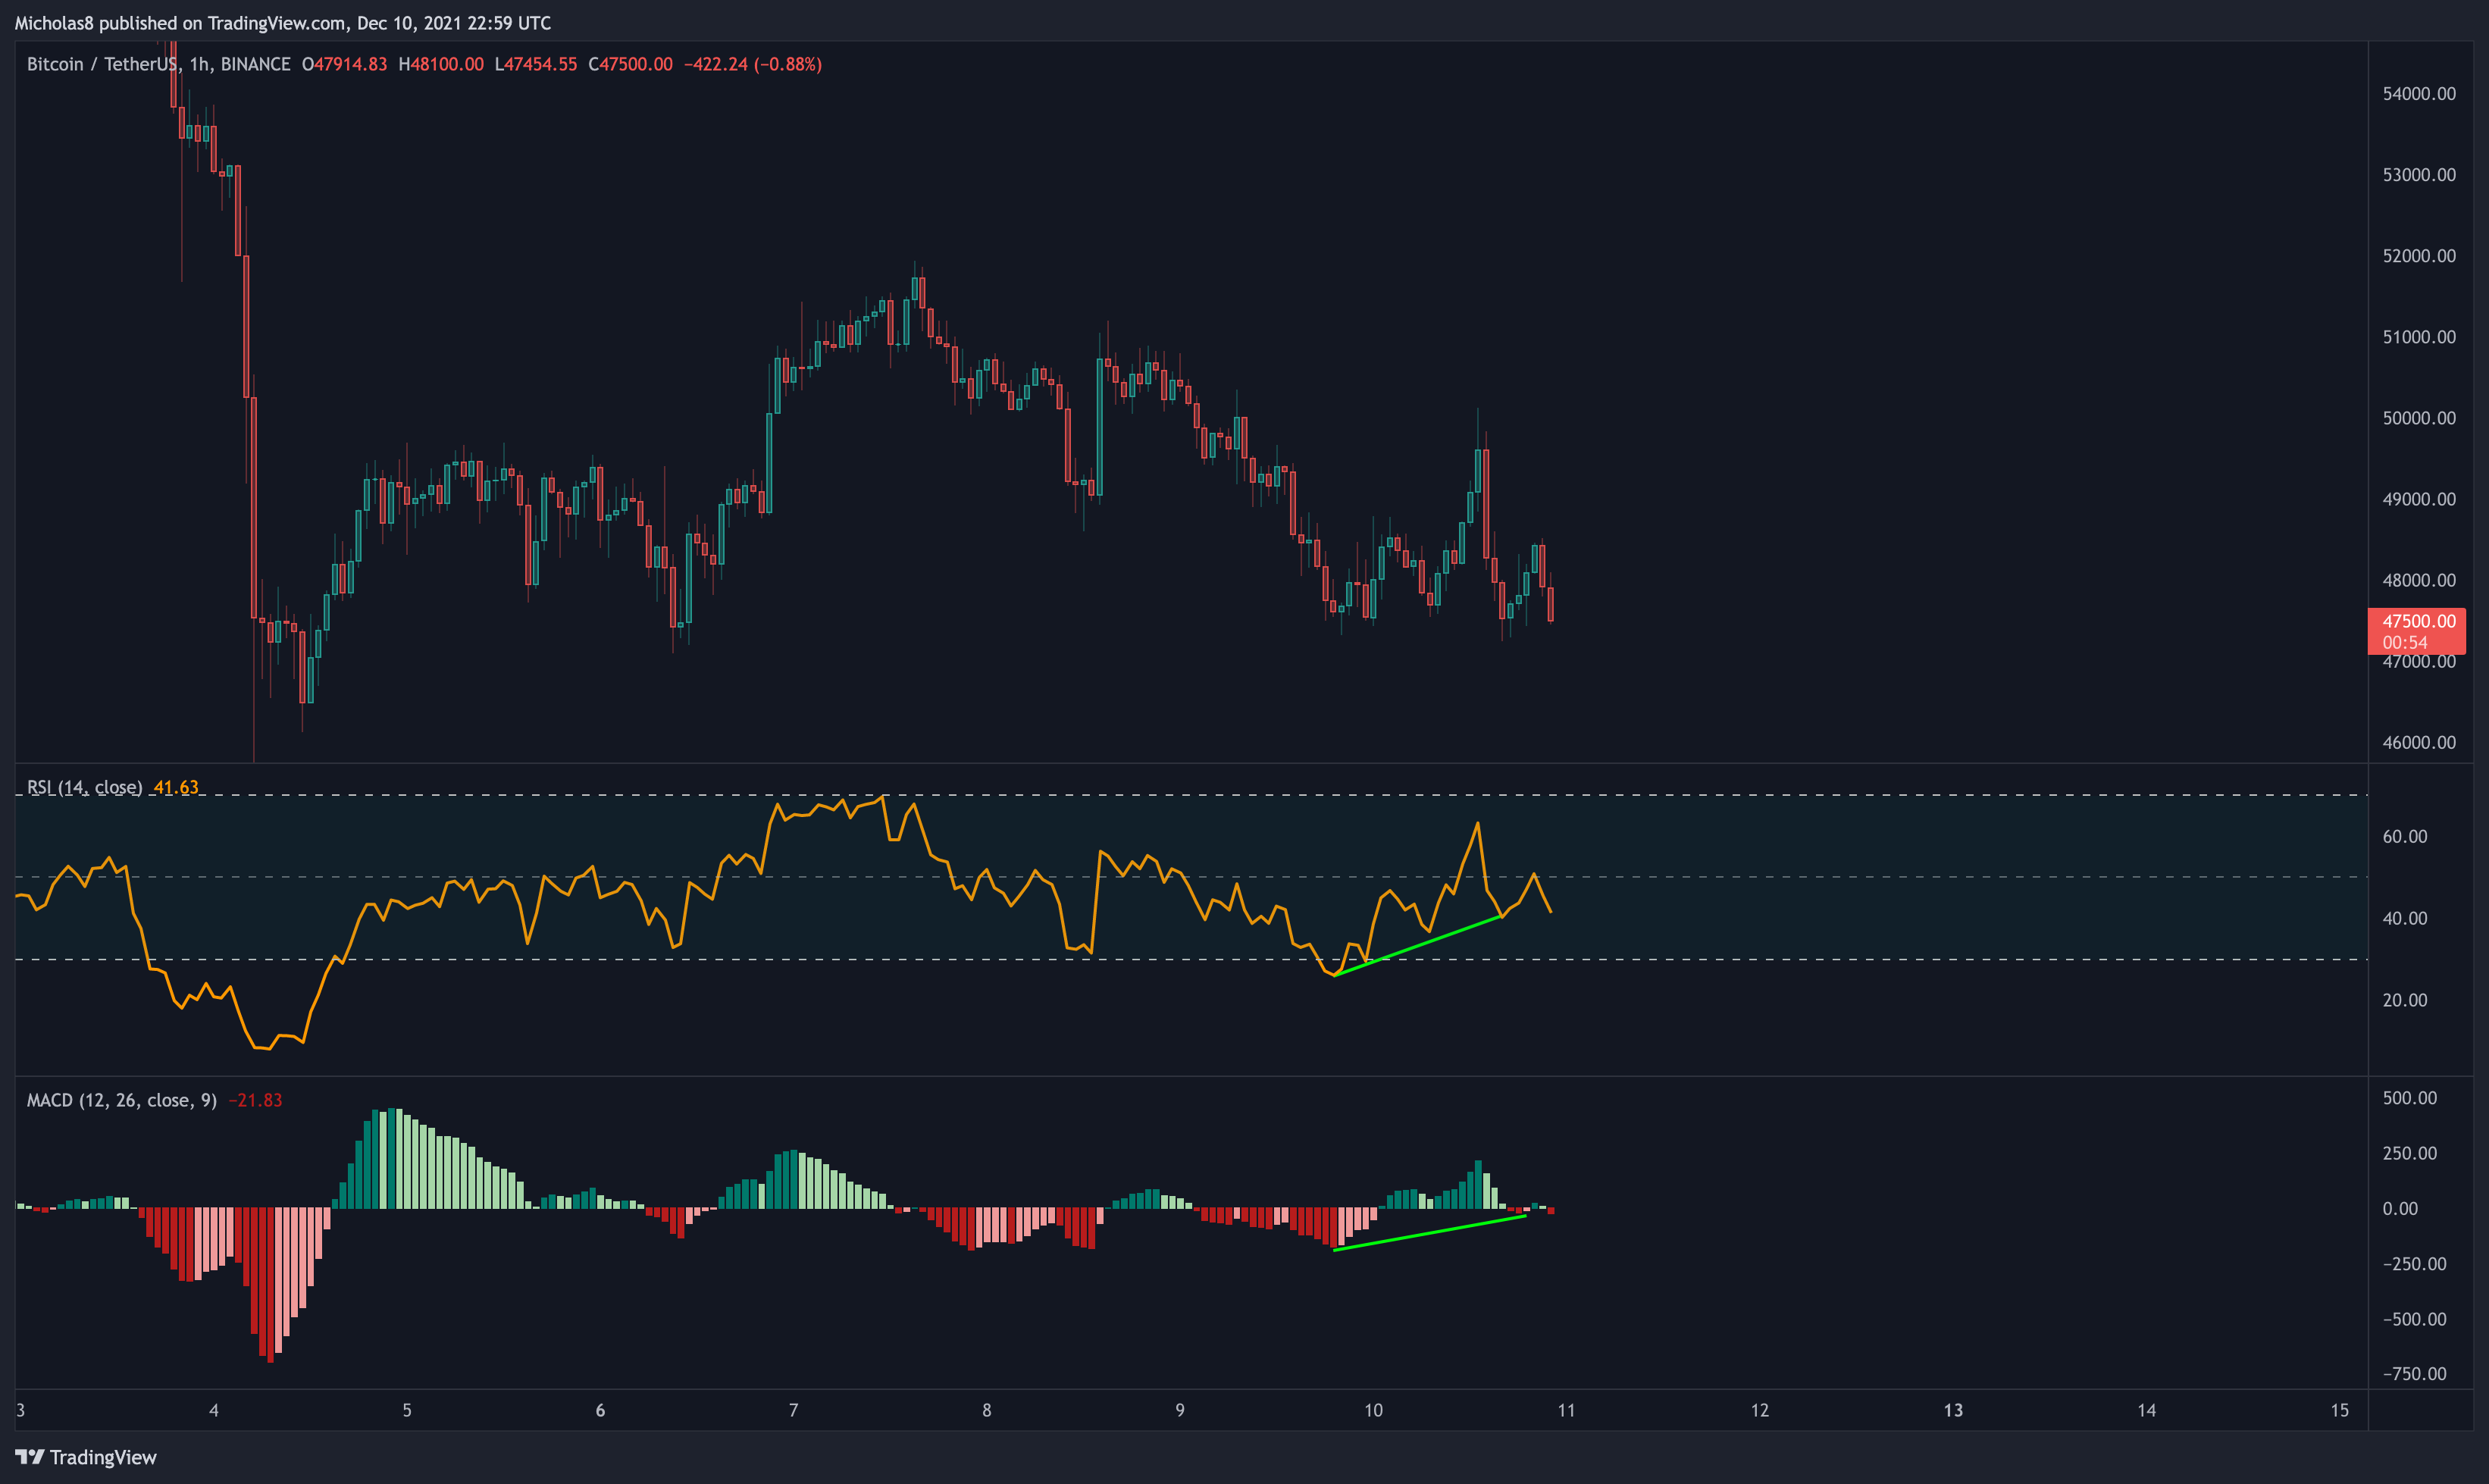
Bitcoin has a lower low in price, with a higher low on the RSI/MACD. This is a bullish divergence, which signals a possible trend reversal up.
Invalidation: Lower low in price and the RSI/MACD.
THE BAD
Daily Timeframe
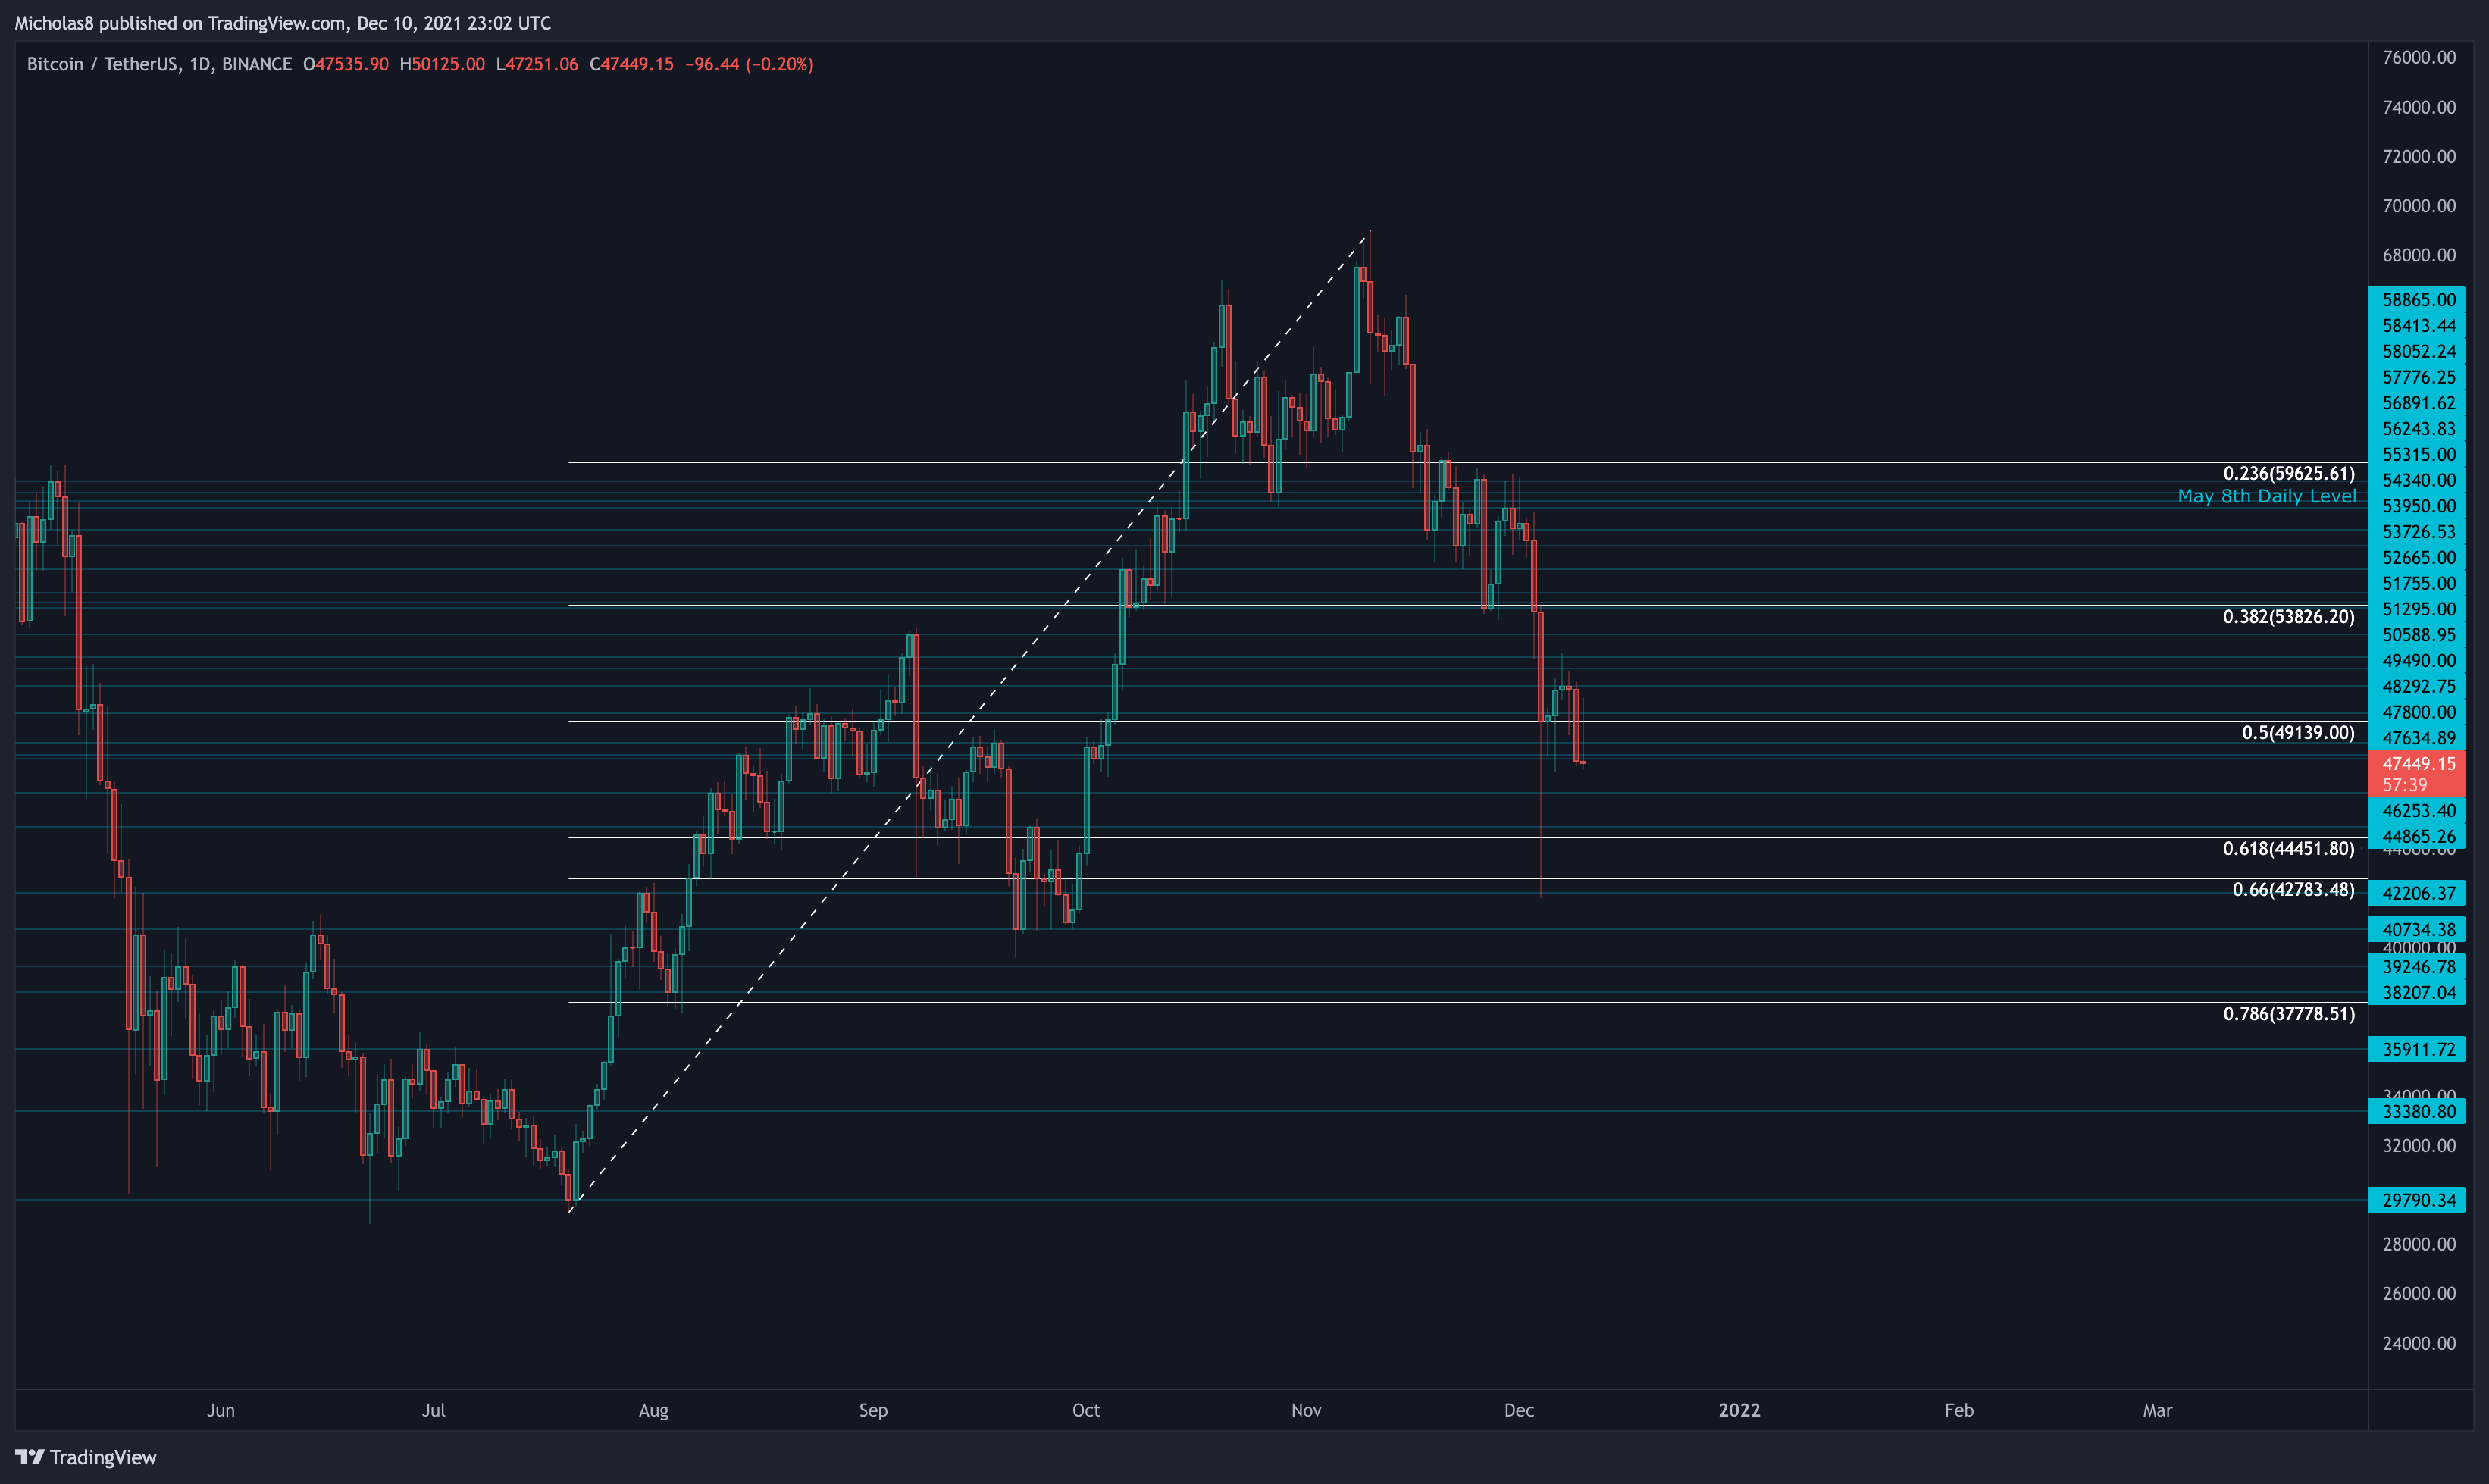
Logarithmic Curve
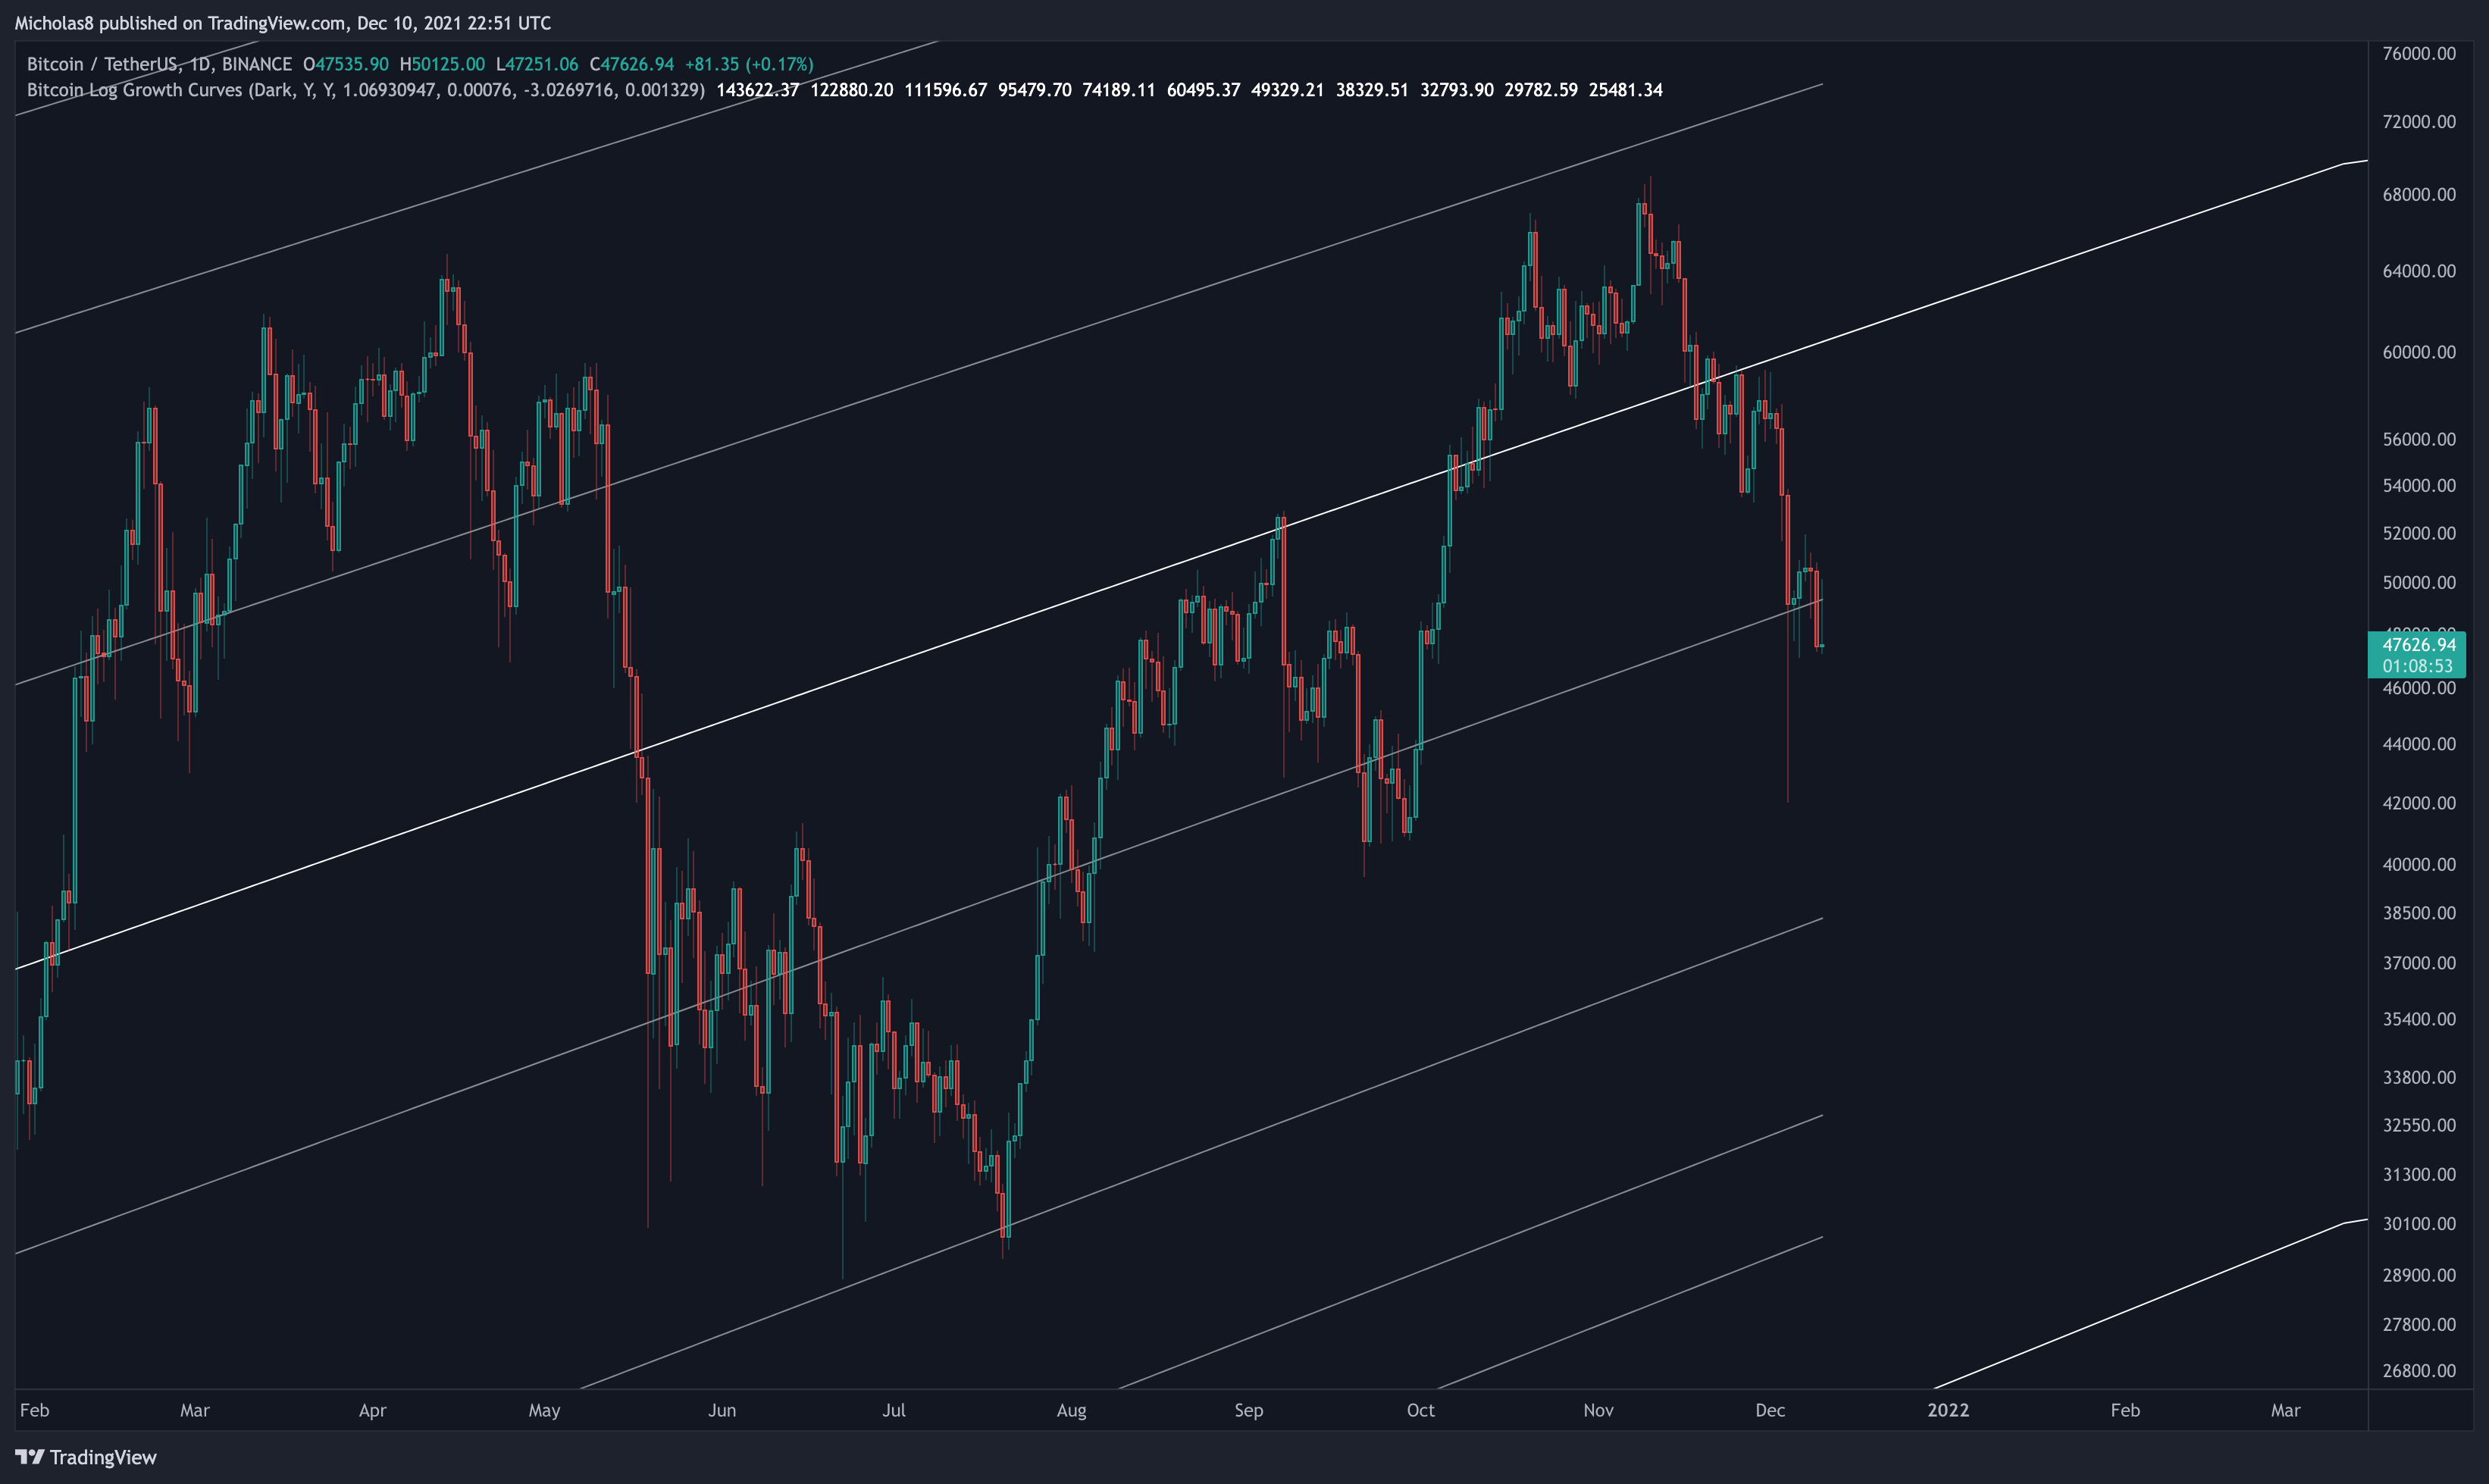
Bitcoin has lost the median as support and may now be losing the 0.382 Fibonacci Level as support. Continuing to lose level after level is not ideal one bit.
Key Liquidity Zone (LQZ)
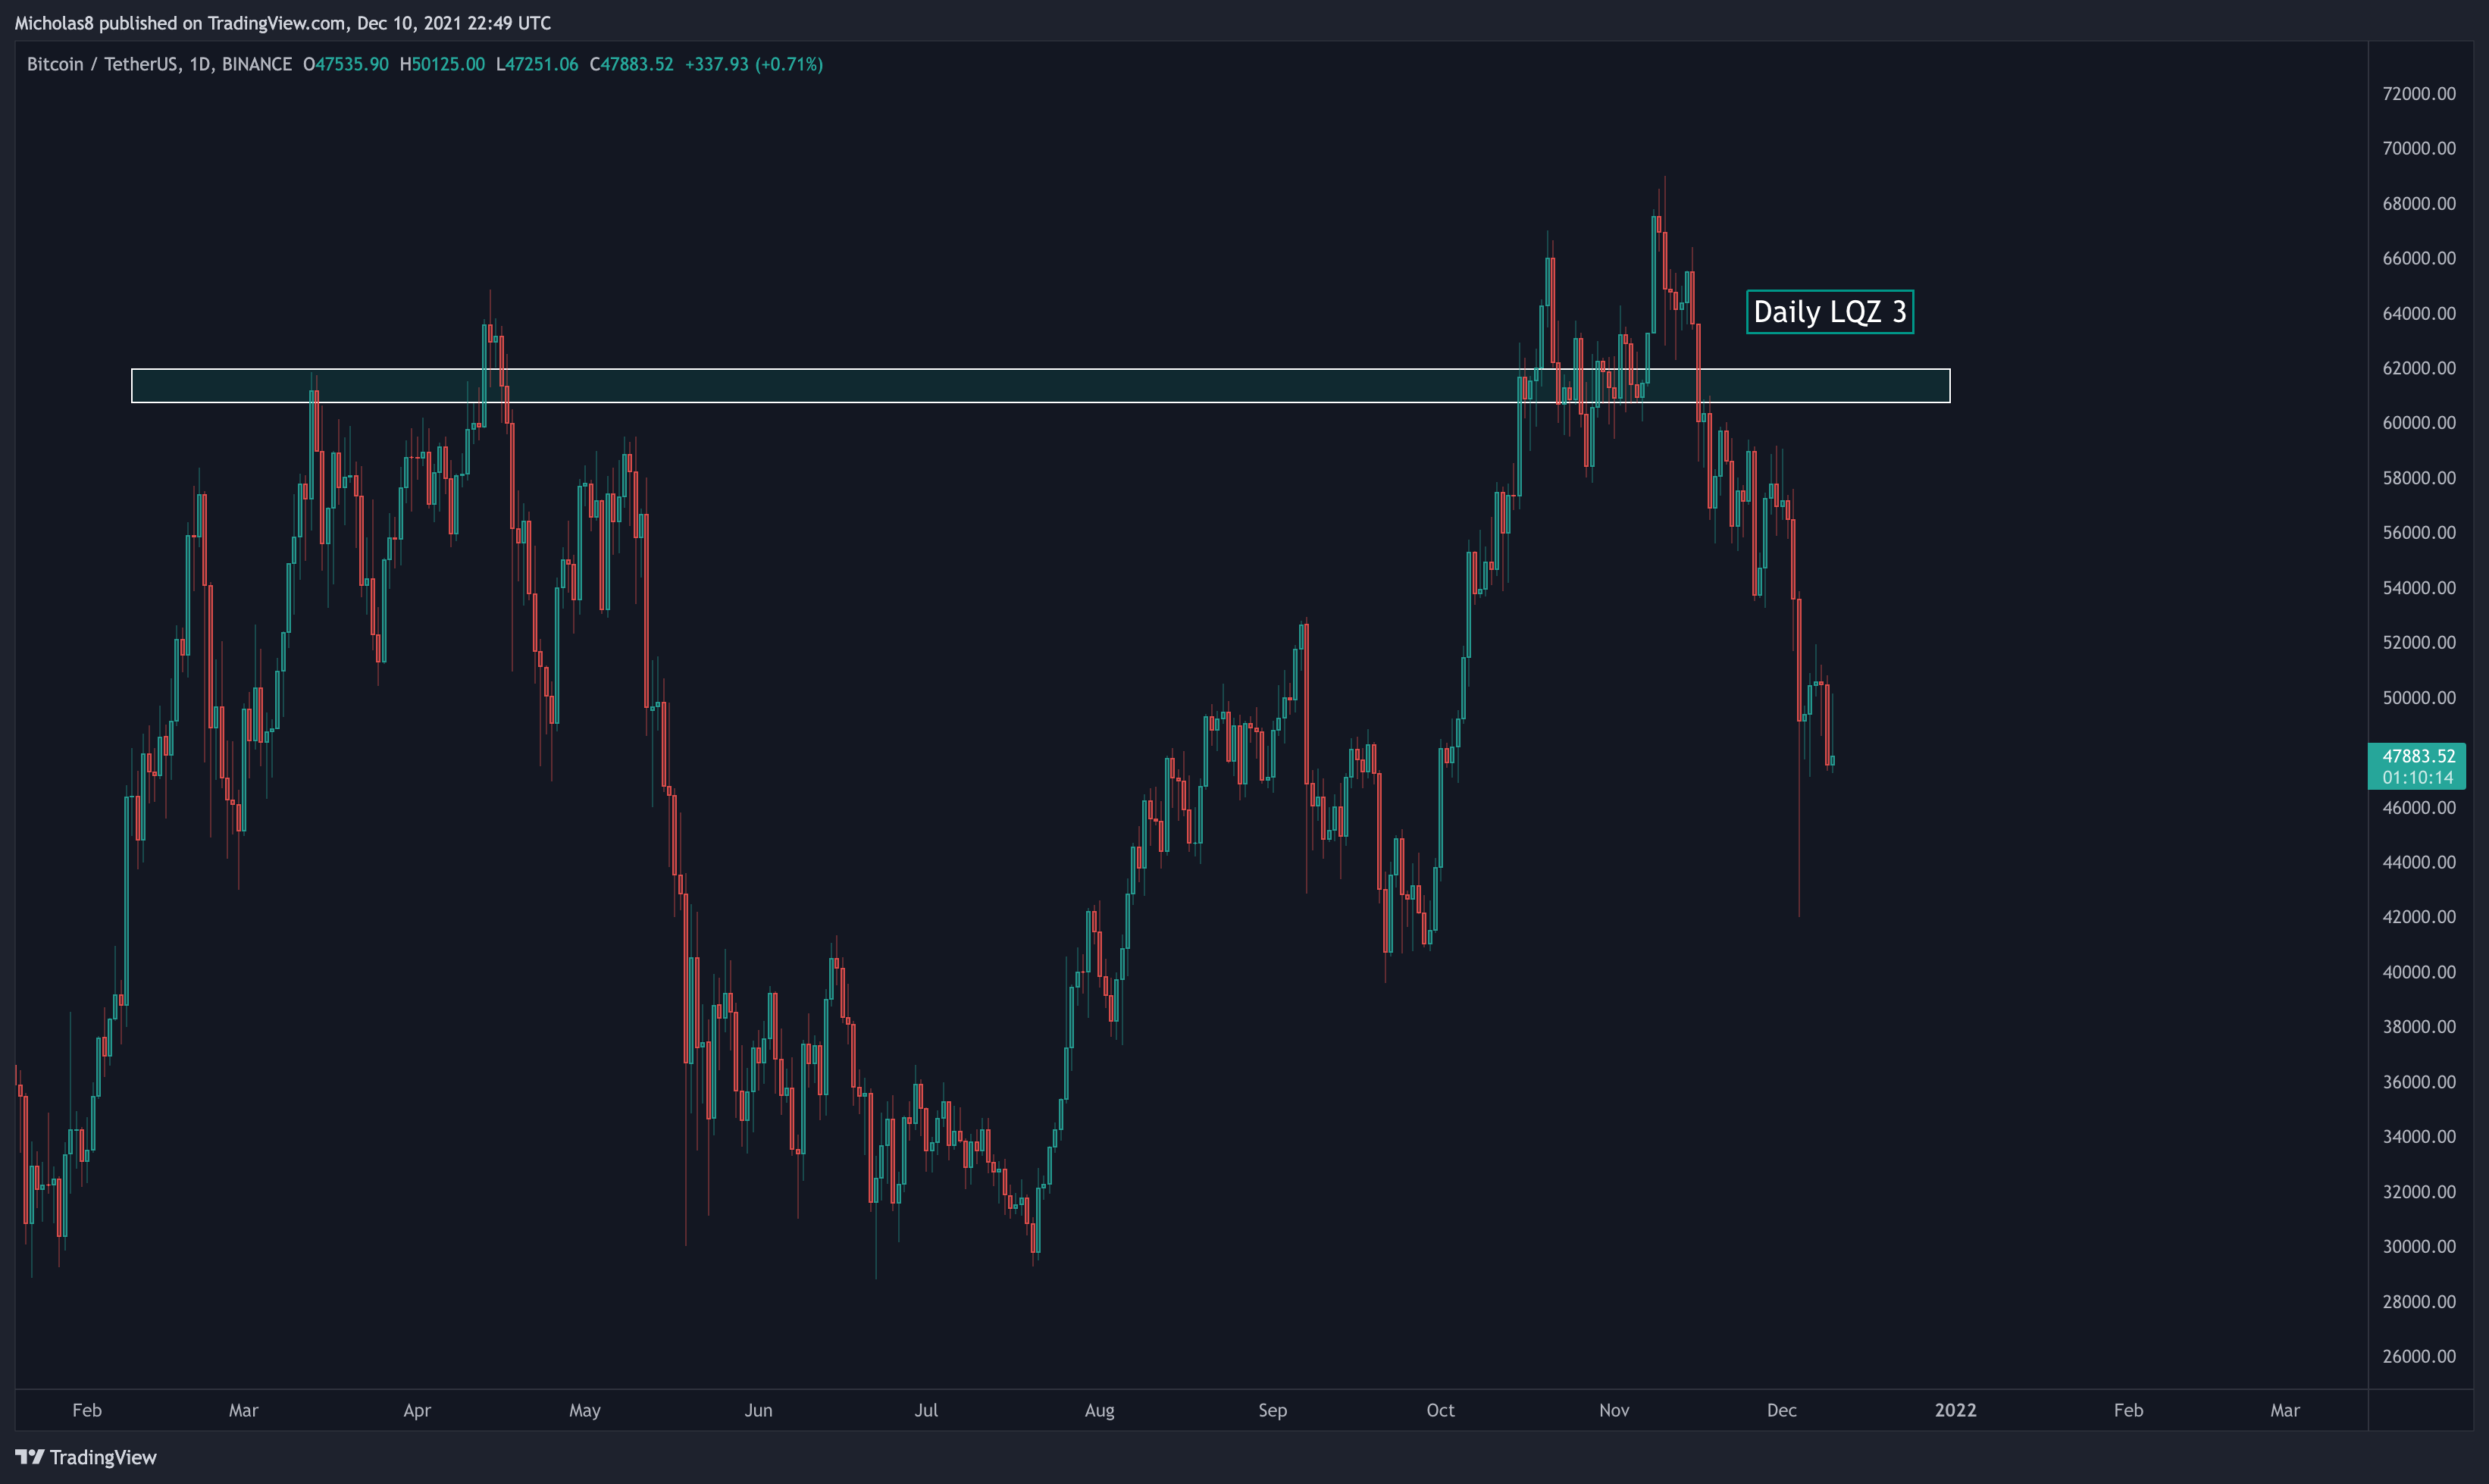
Zone 3: The final daily liquidity zone sits at 60.7k-61.9k, which Bitcoin has lost as support. We may see it serve as resistance moving forward.
Bullish Exhaustion
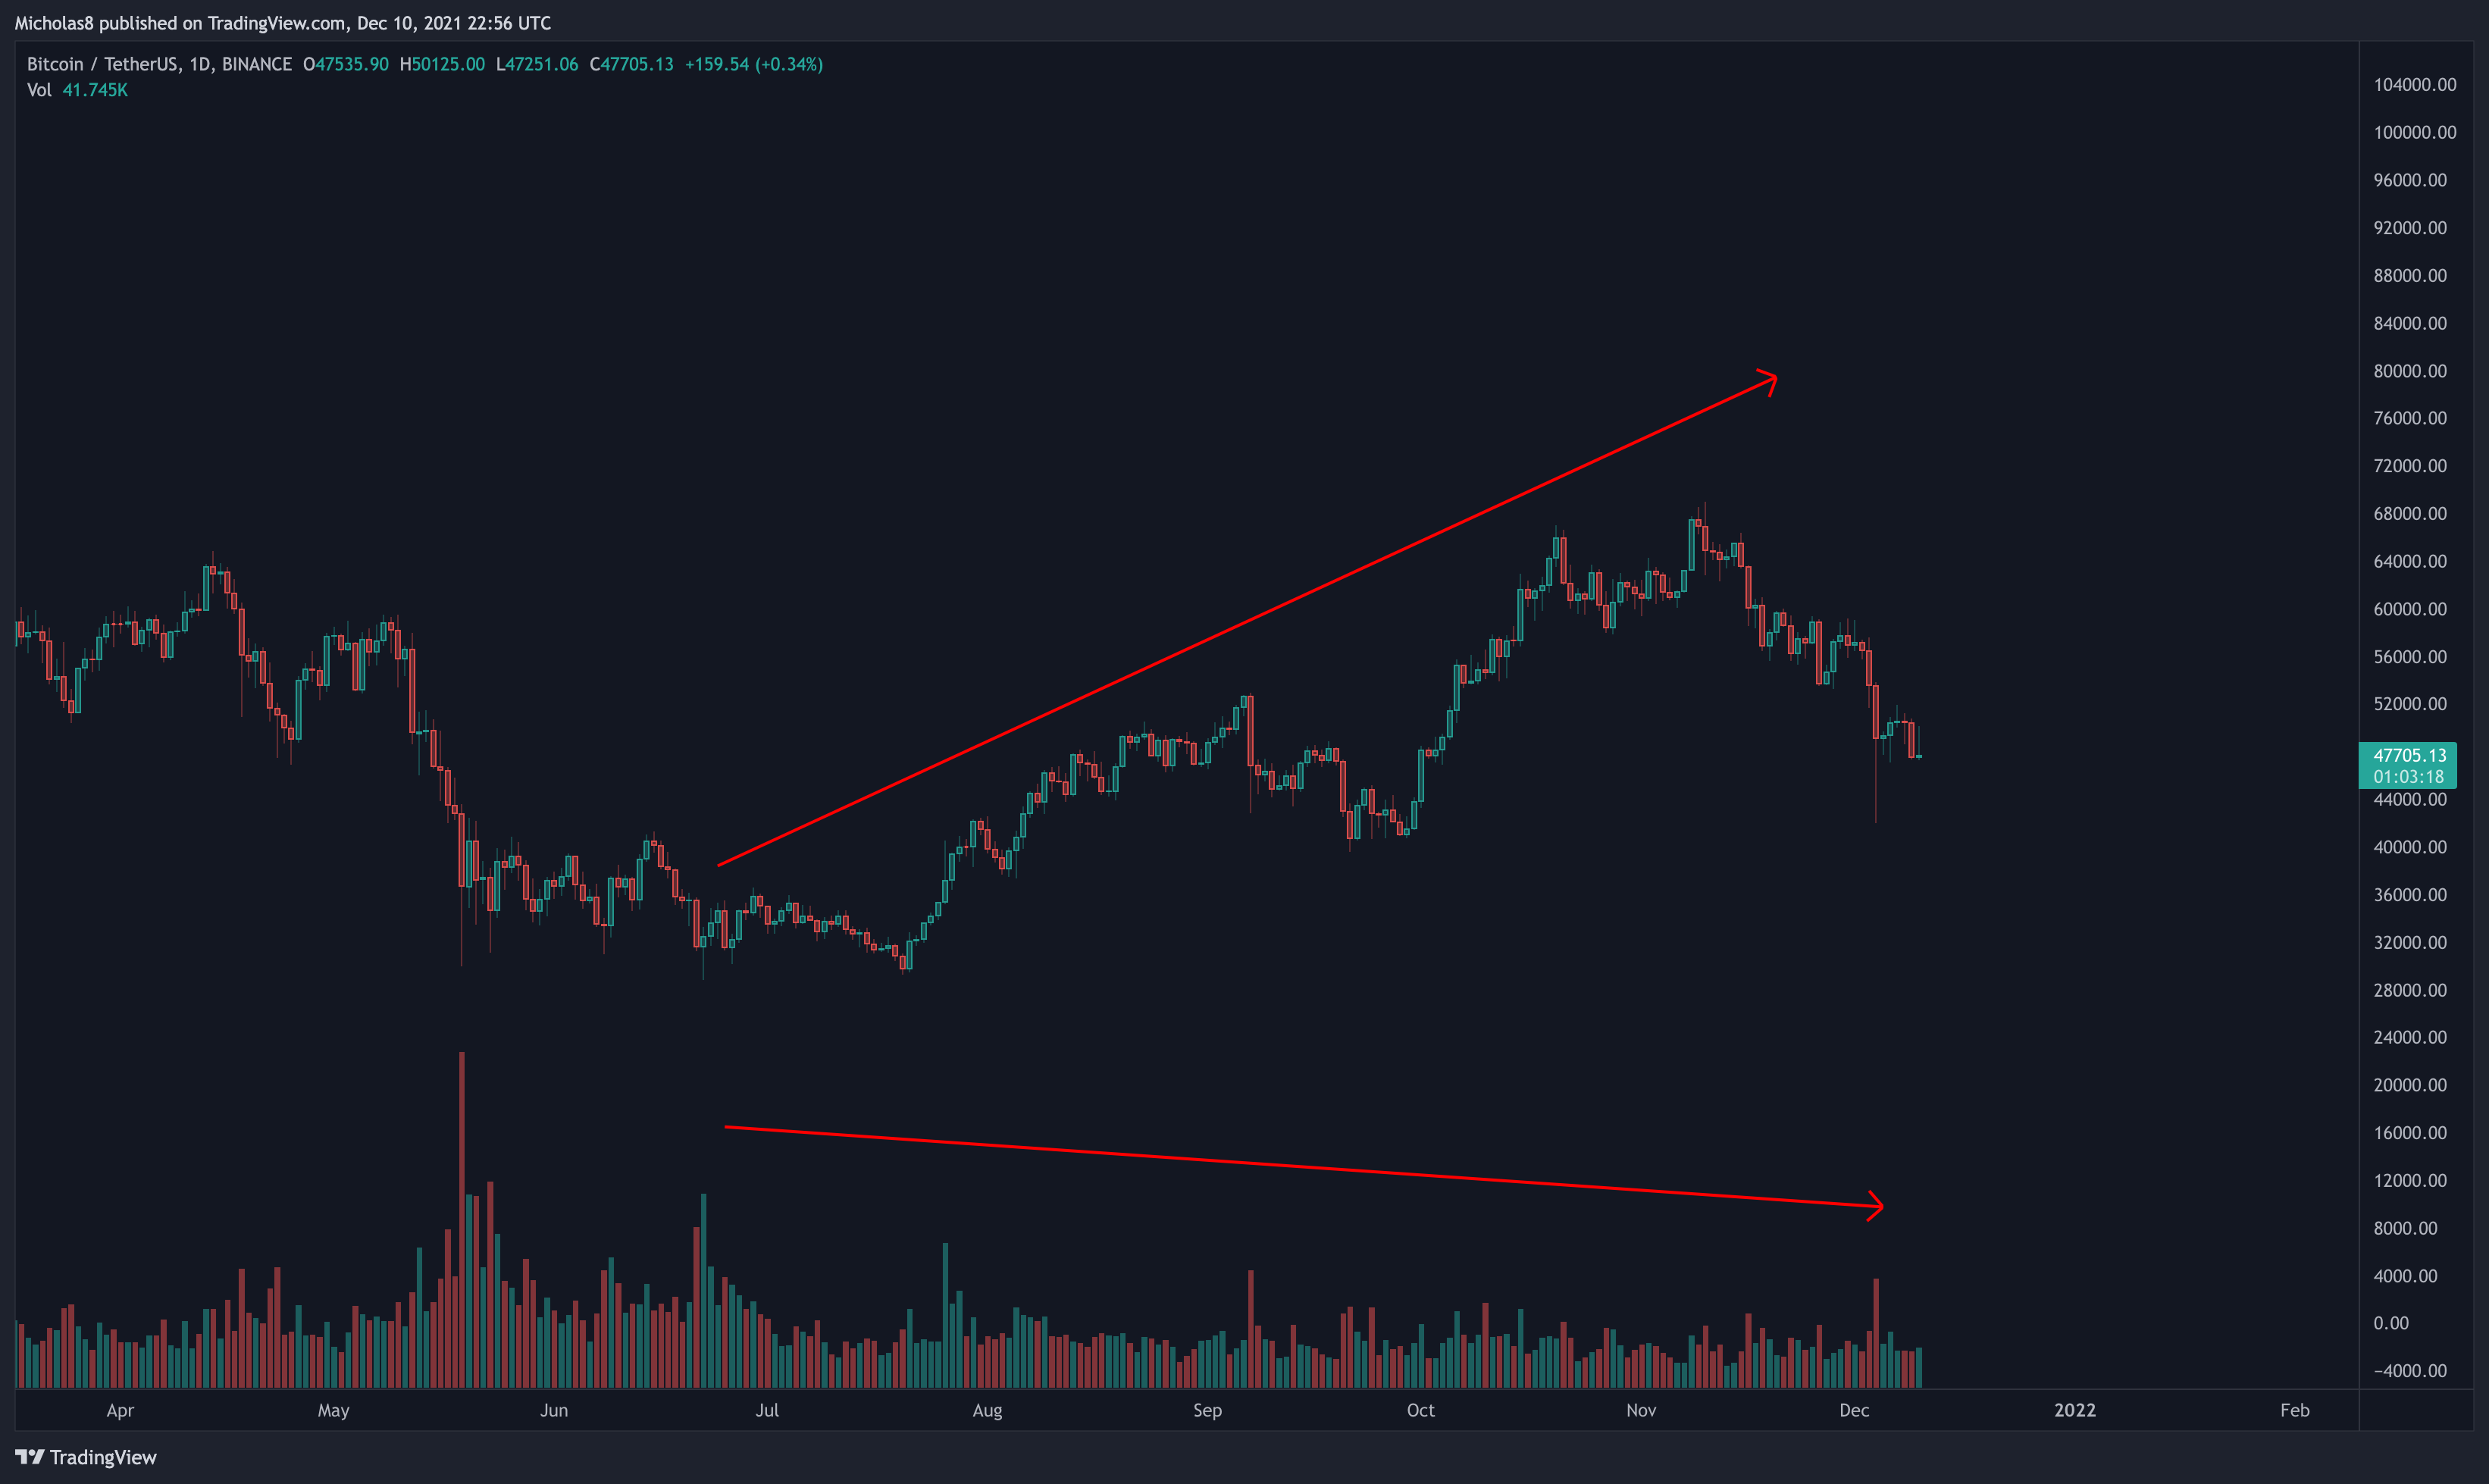
We have an increase in price with a decline in volume, possibly signalling a loss of bullish momentum in the market.
Directional Movement Index (DMI)
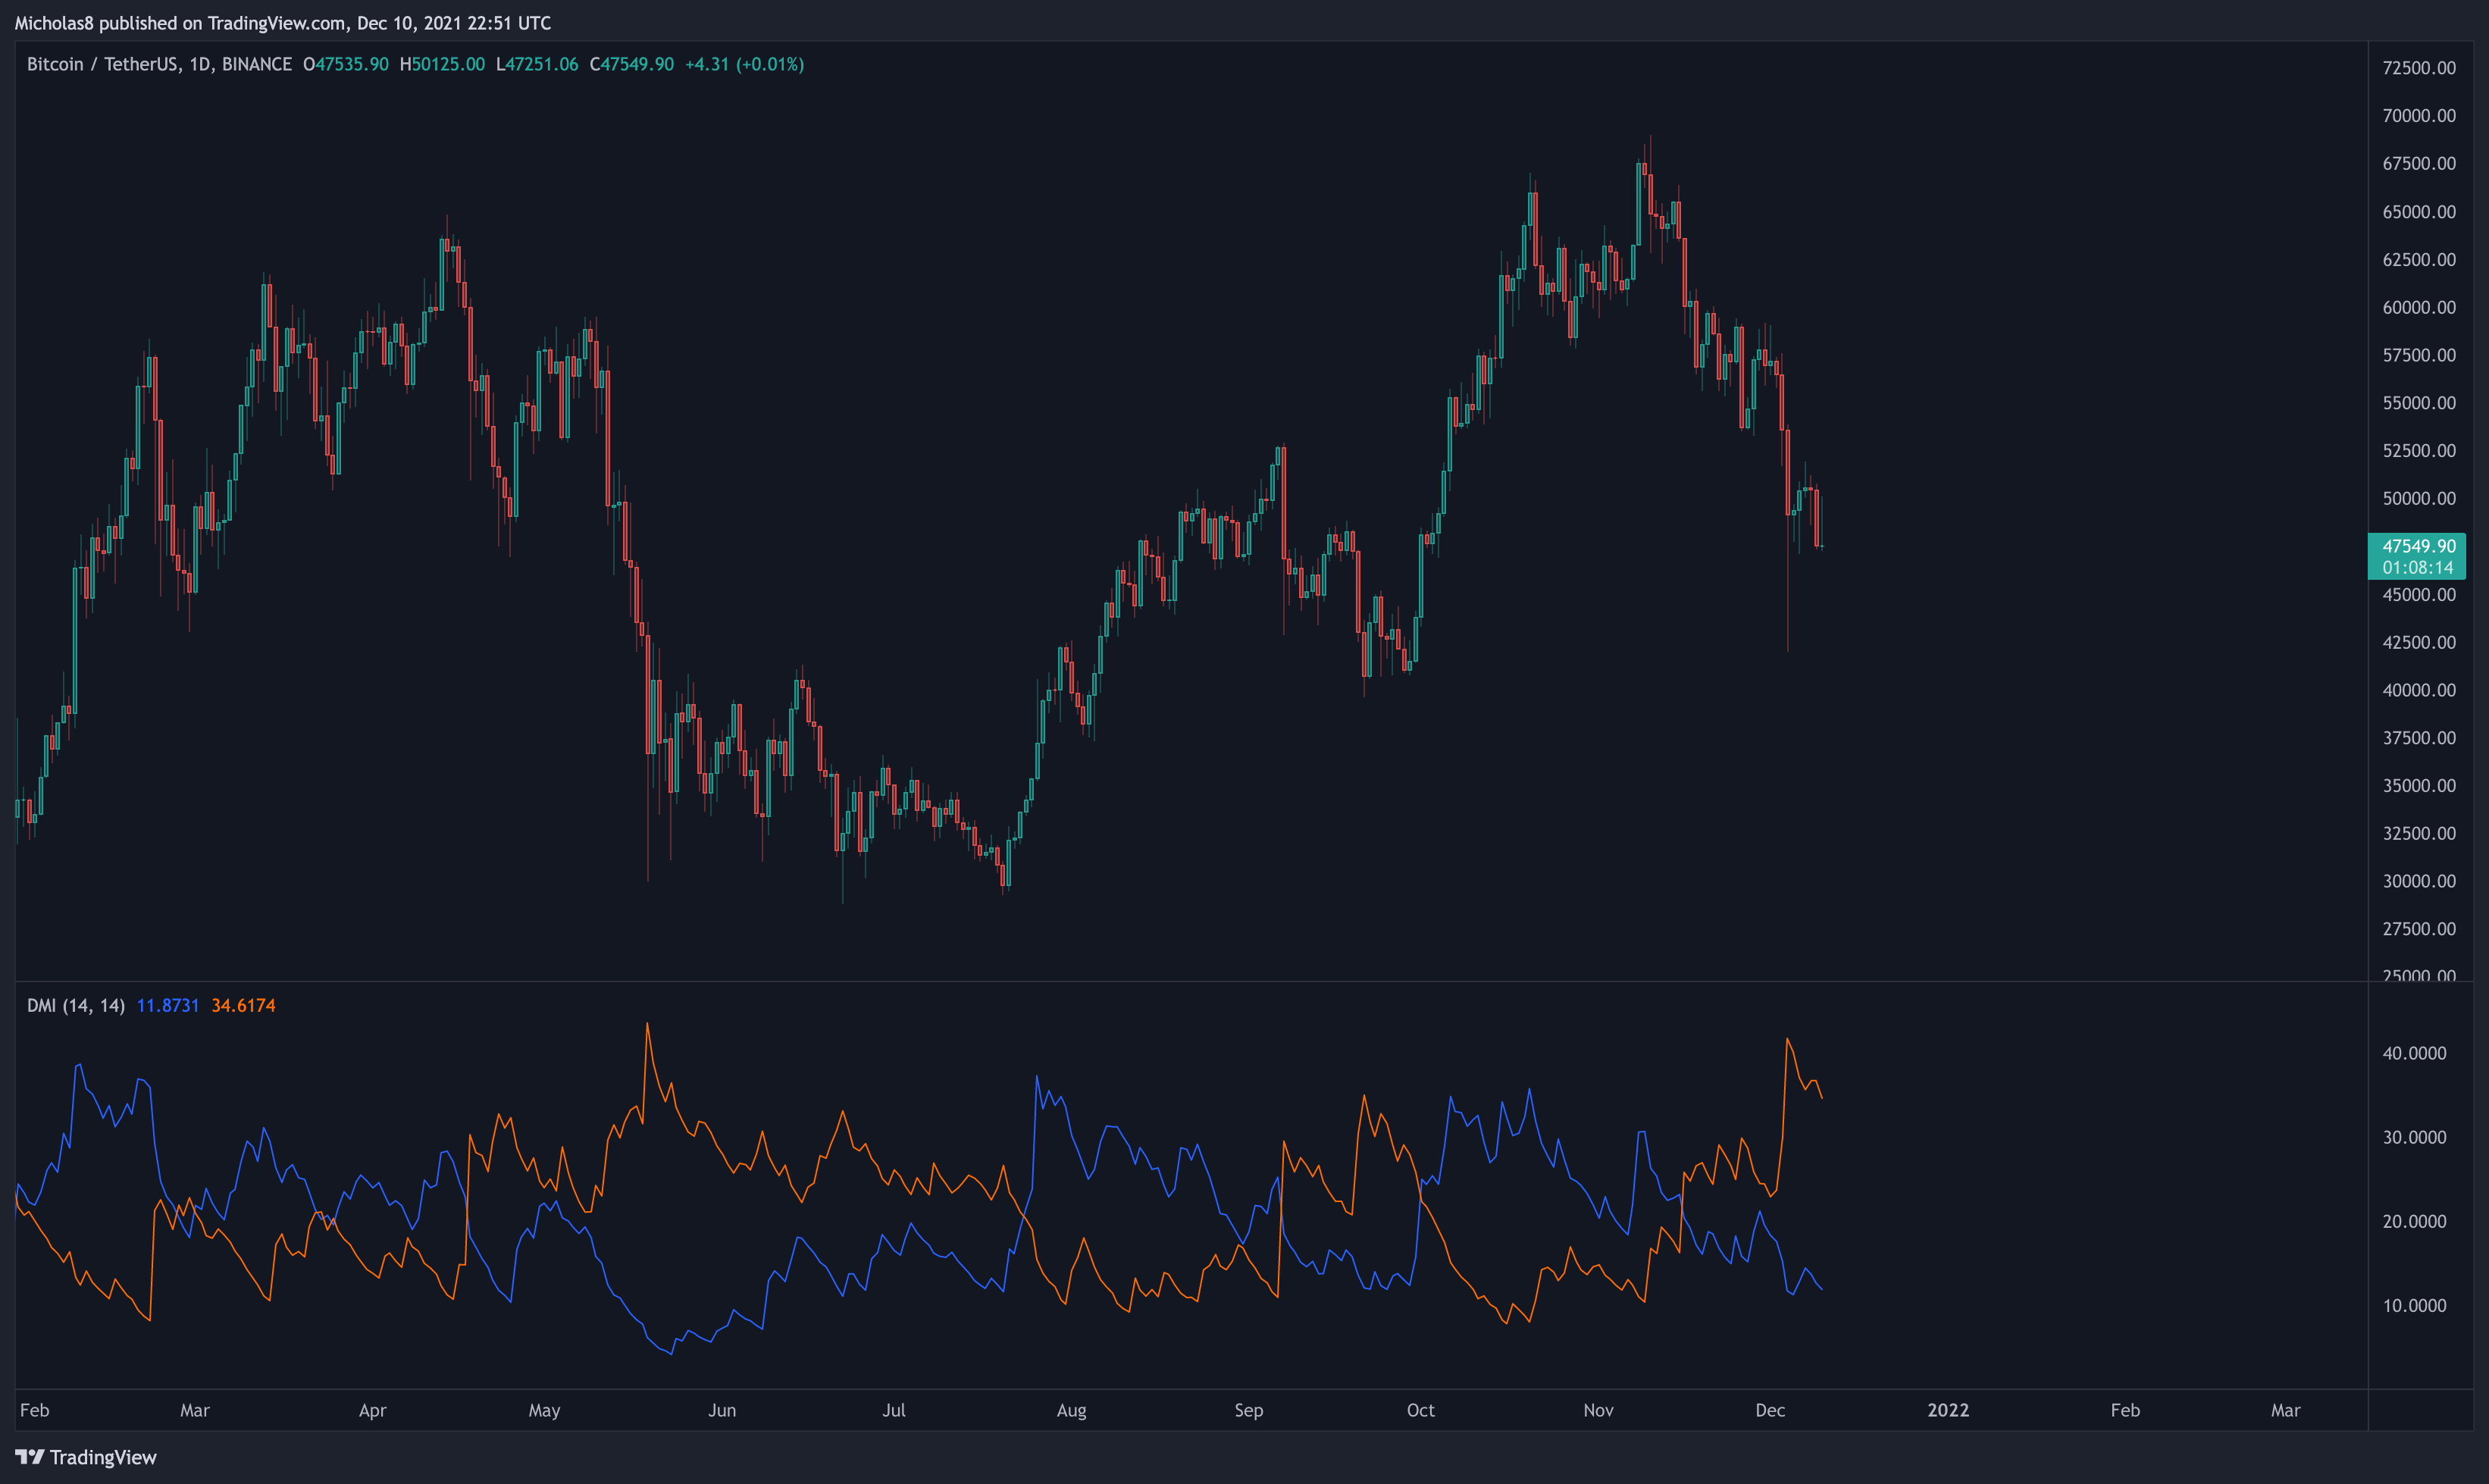
*This is another momentum indicator.
Generally speaking, when the blue line (bullish) crosses below the orange line (bearish), it signals a potential shift in momentum to the bears.
Network Value to Transaction (NVT)
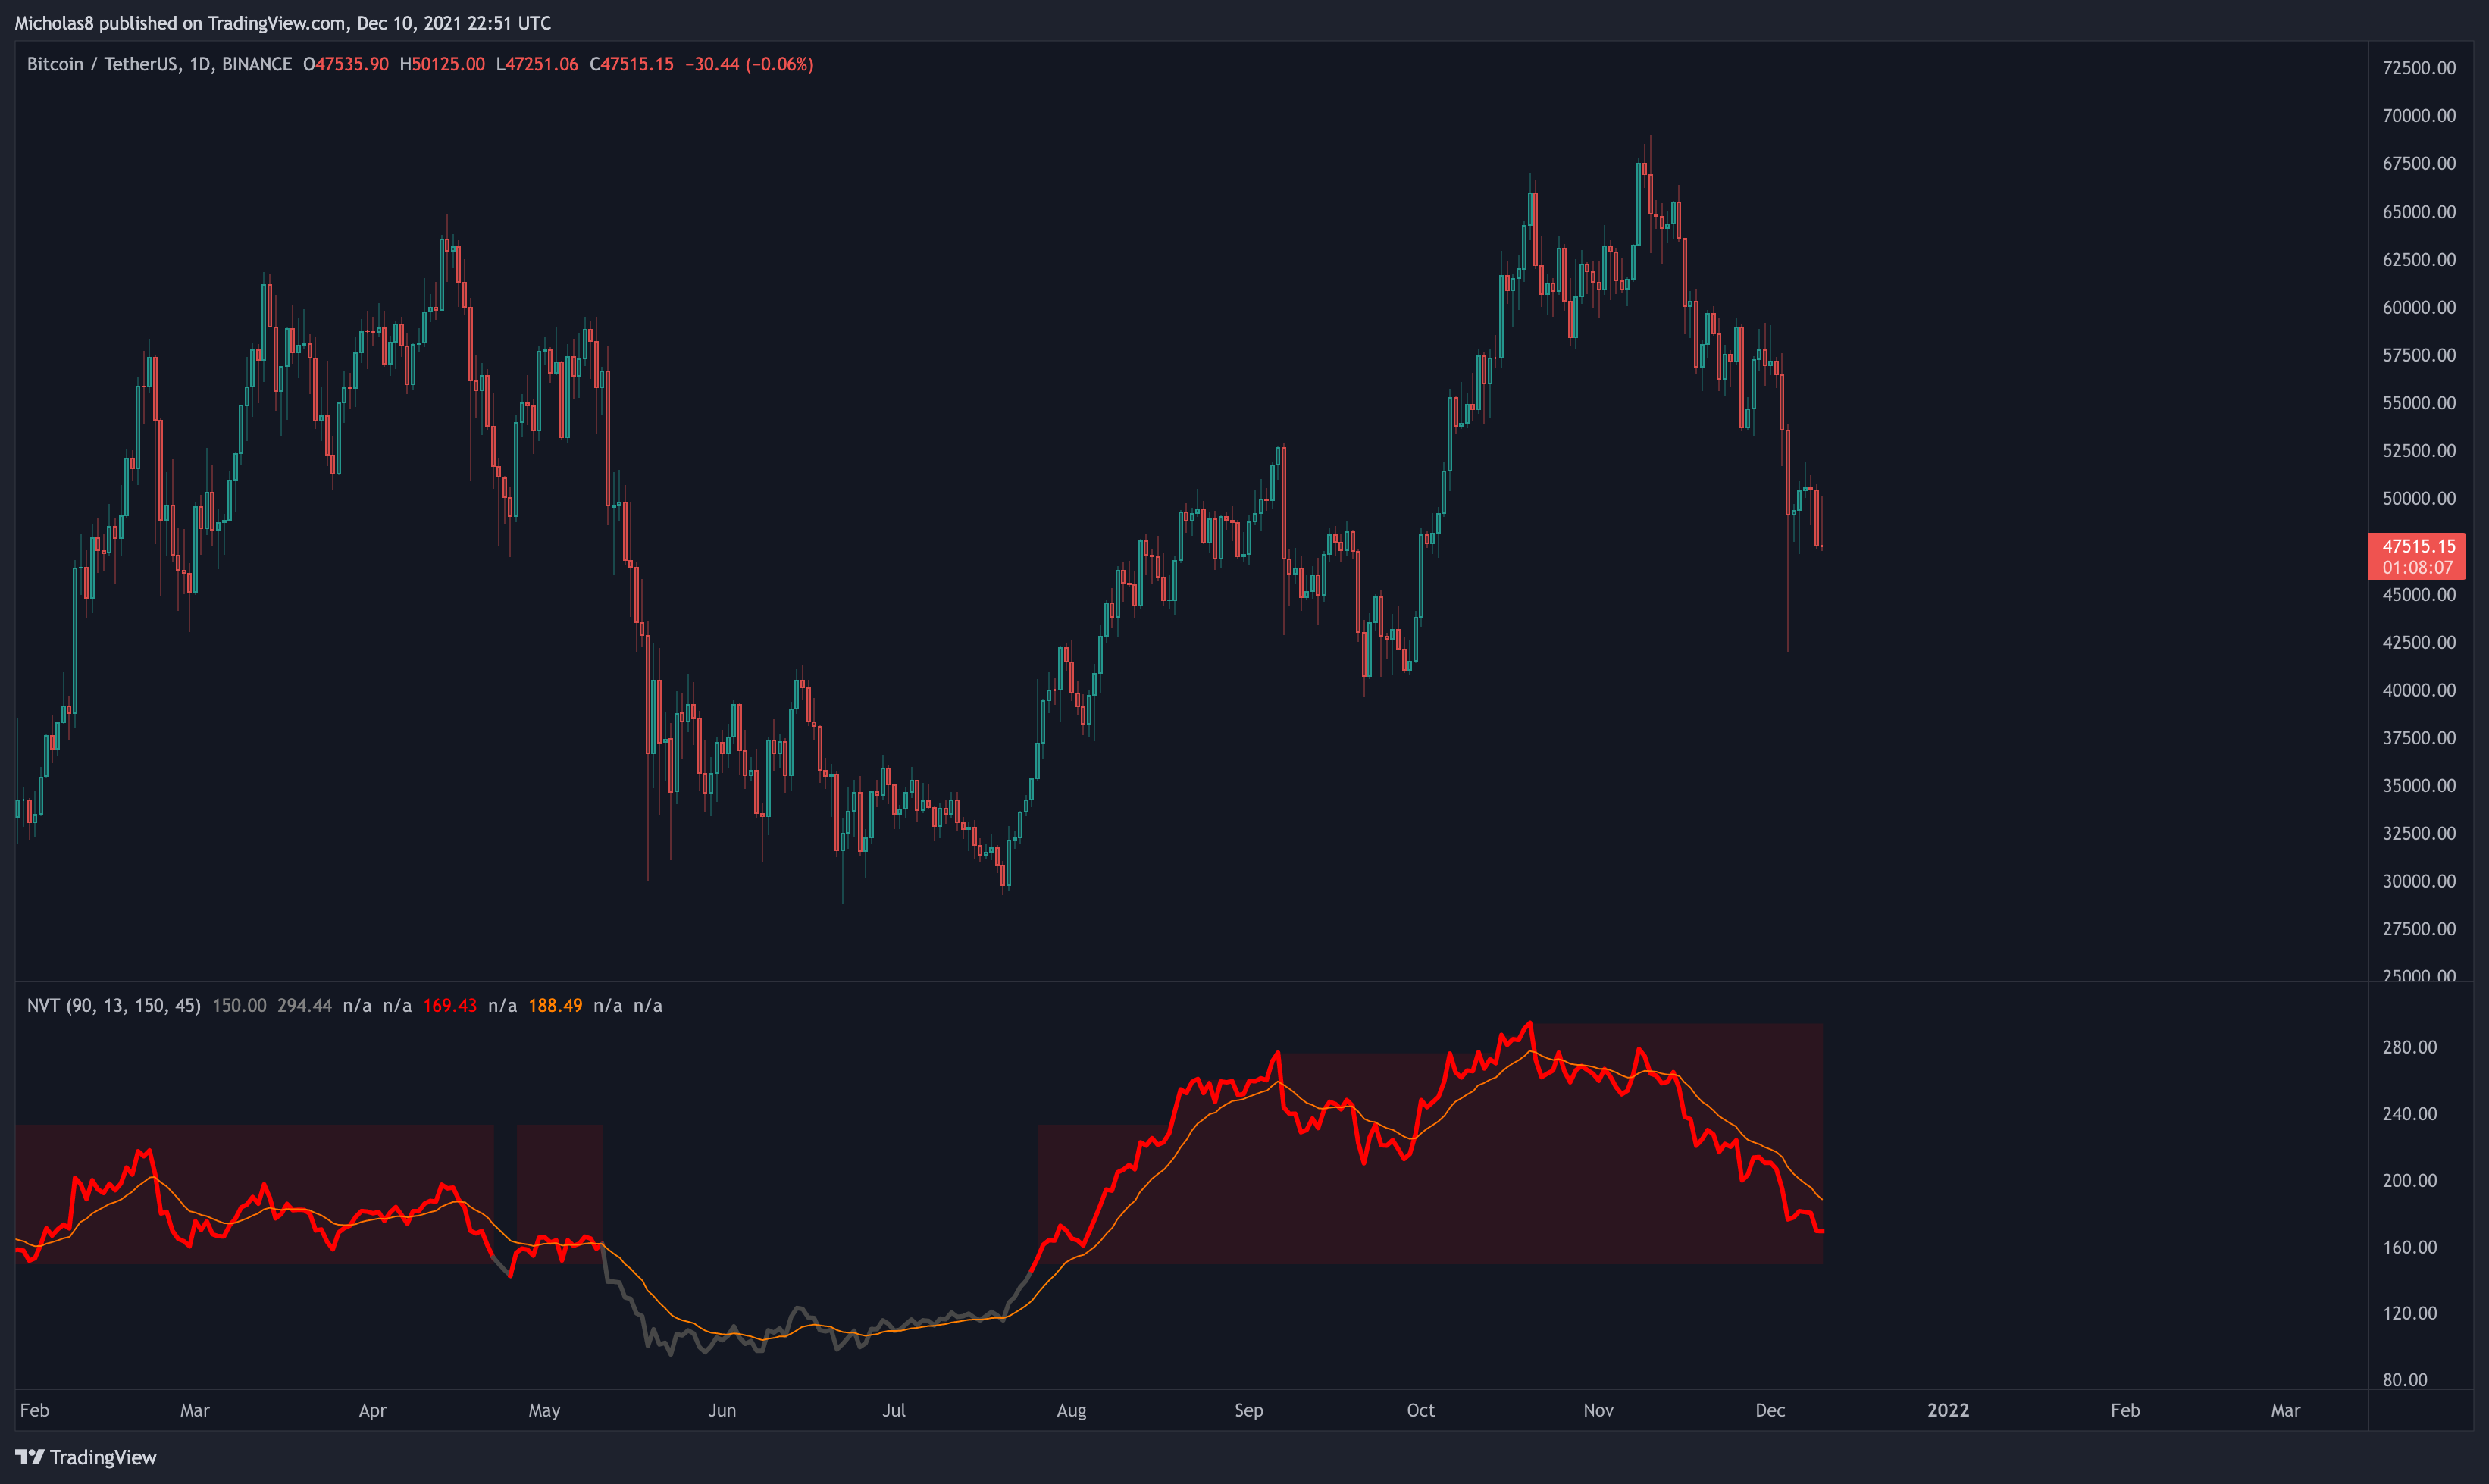
*This indicator describes the relationship between market cap and transfer volumes.
Bitcoin has lost the NVT Signal Line as support. Typically when this happens, Bitcoin sees a more sustained correction.
EMA Ribbon
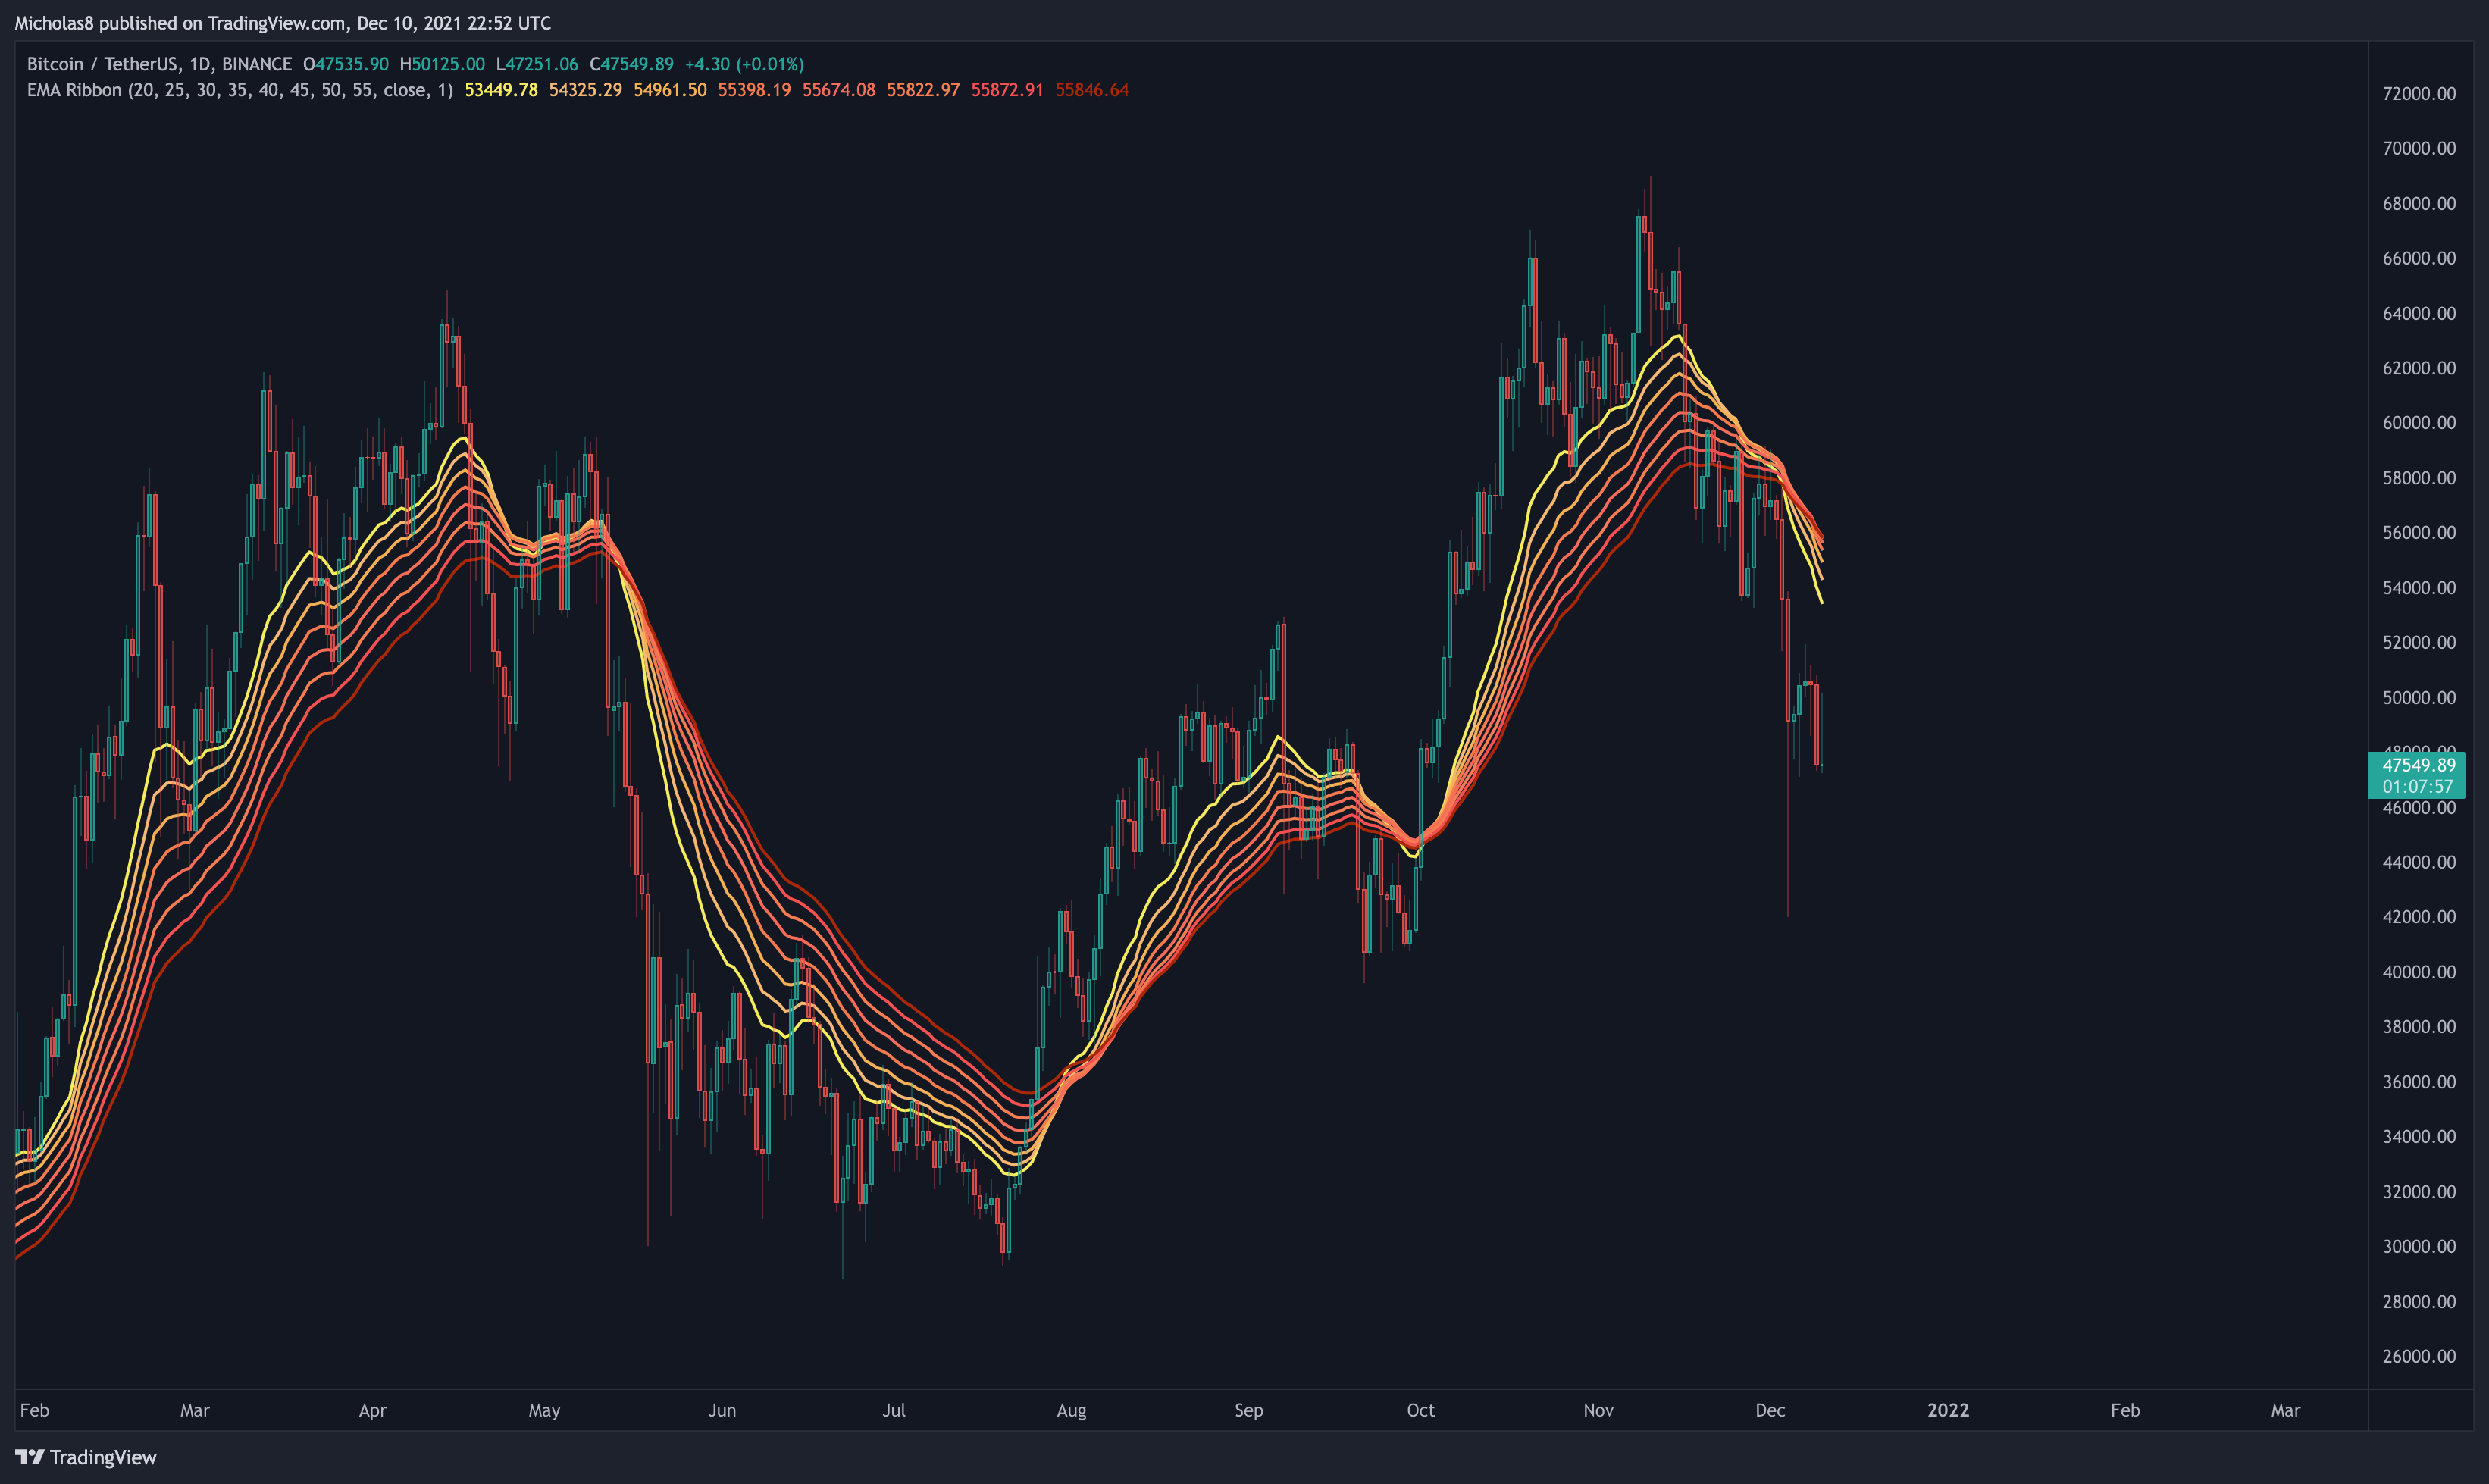
Bitcoin has lost the EMA ribbon as support in this timeframe.
Implication: It may end up serving as strong resistance.
Exponential Moving Average (EMA): 8, 21, 50 and 200
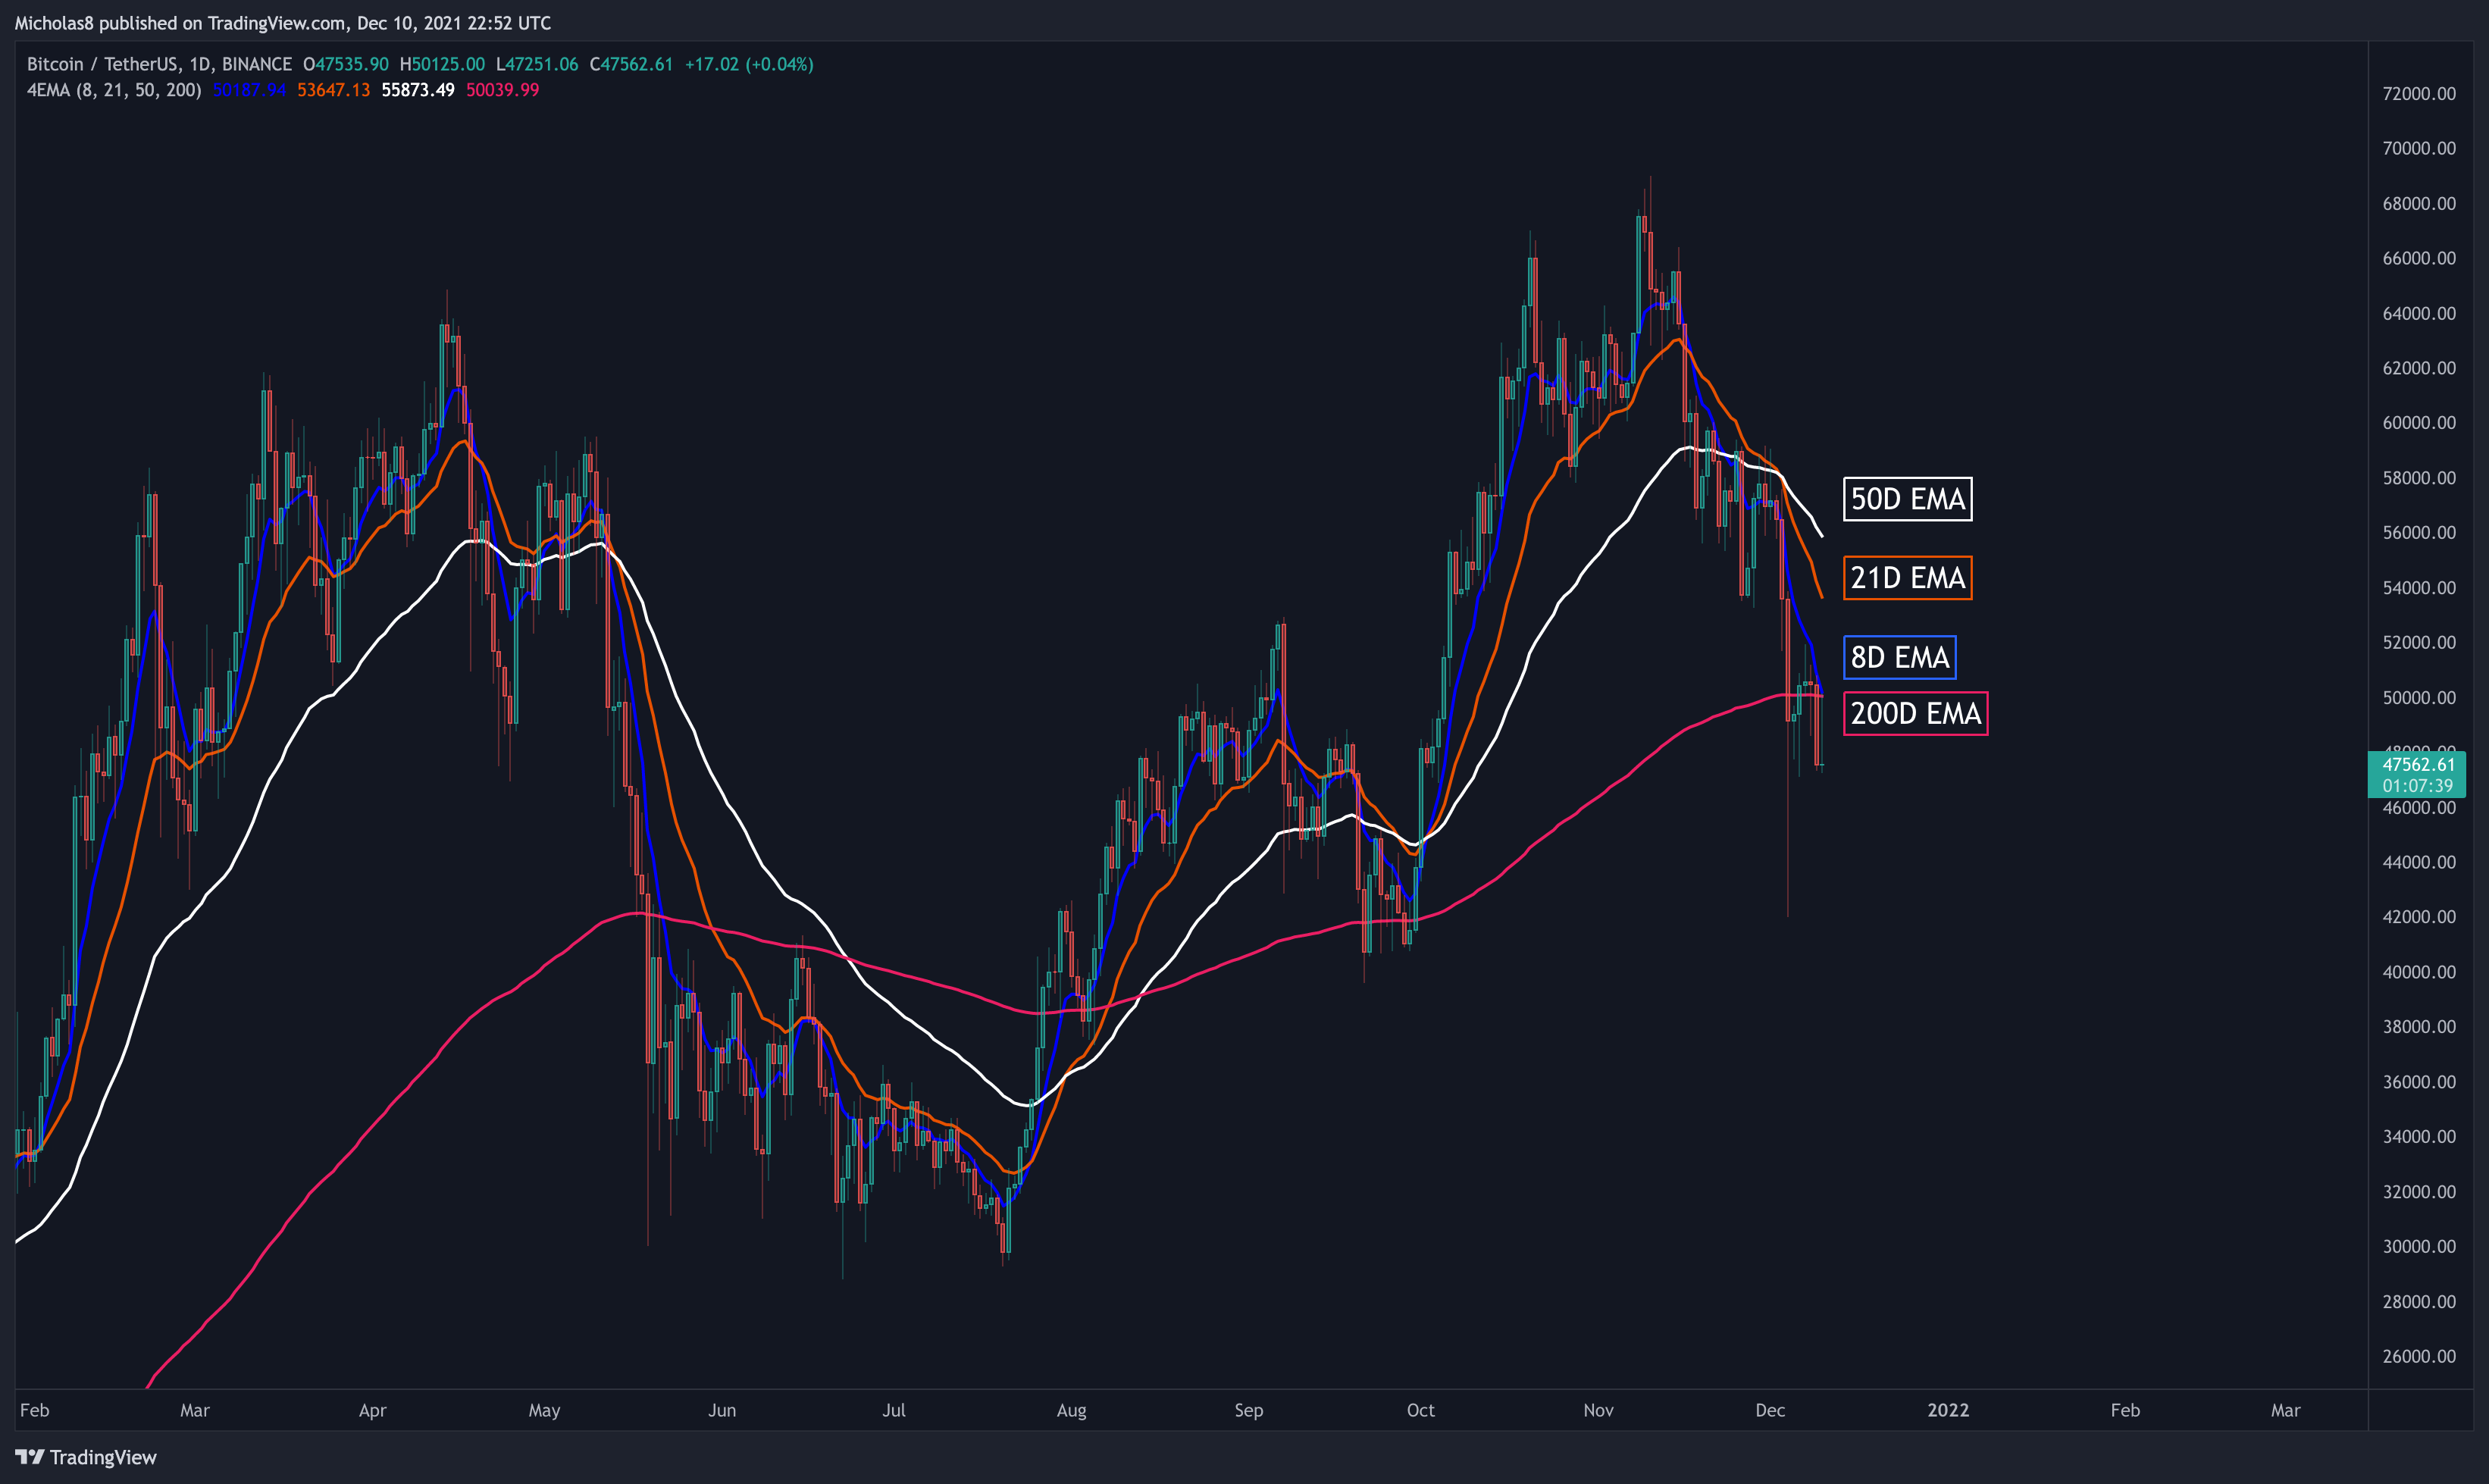
Bitcoin has lost these SMAs as support, and we have seen a Death Cross between the 21/50-day EMAs. It is possible we see a Death Cross between the 8/200-day EMAs.
Implications: These may serve as resistance moving forward. Death Crosses signal a potential bearish continuation. Keep in mind, however, the most important EMA Death Cross is between the 50/200-day EMAs.
Simple Moving Average (SMA): 20, 50 and 100
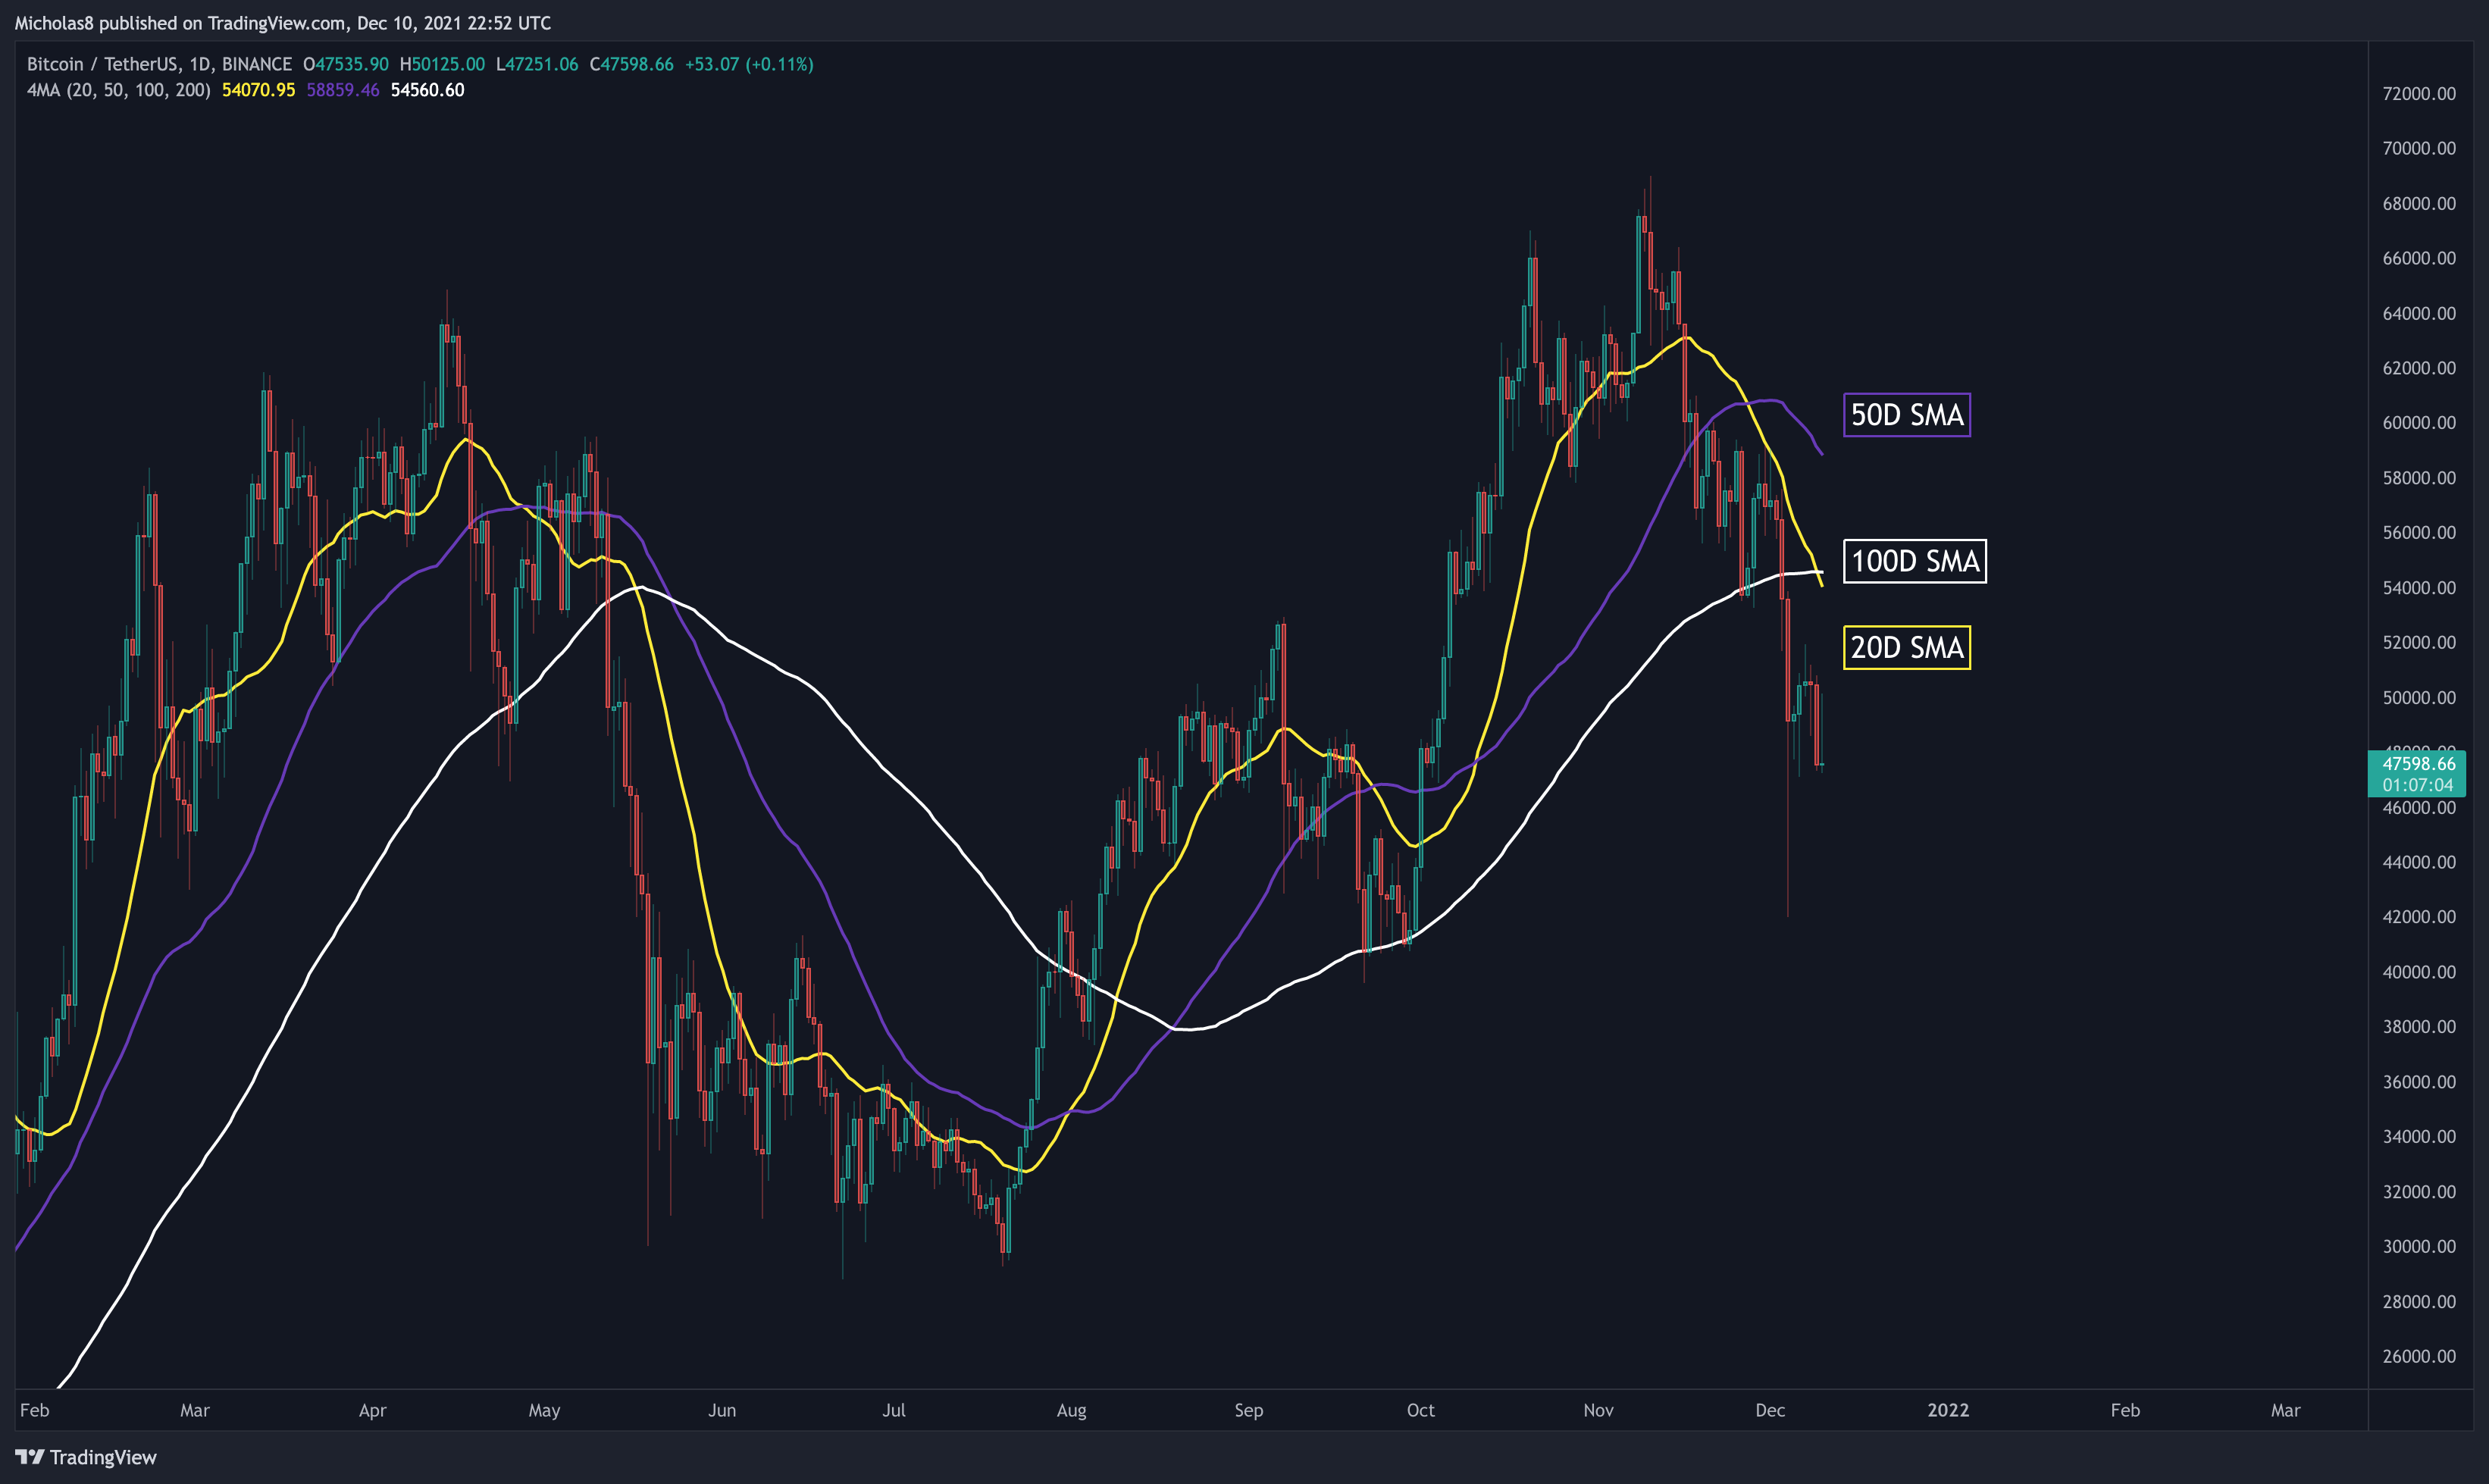
Bitcoin has lost these SMAs as support, and will also see a Death Cross between the 20/100-day SMAs.
Implications: They may serve as a level of resistance moving forward.
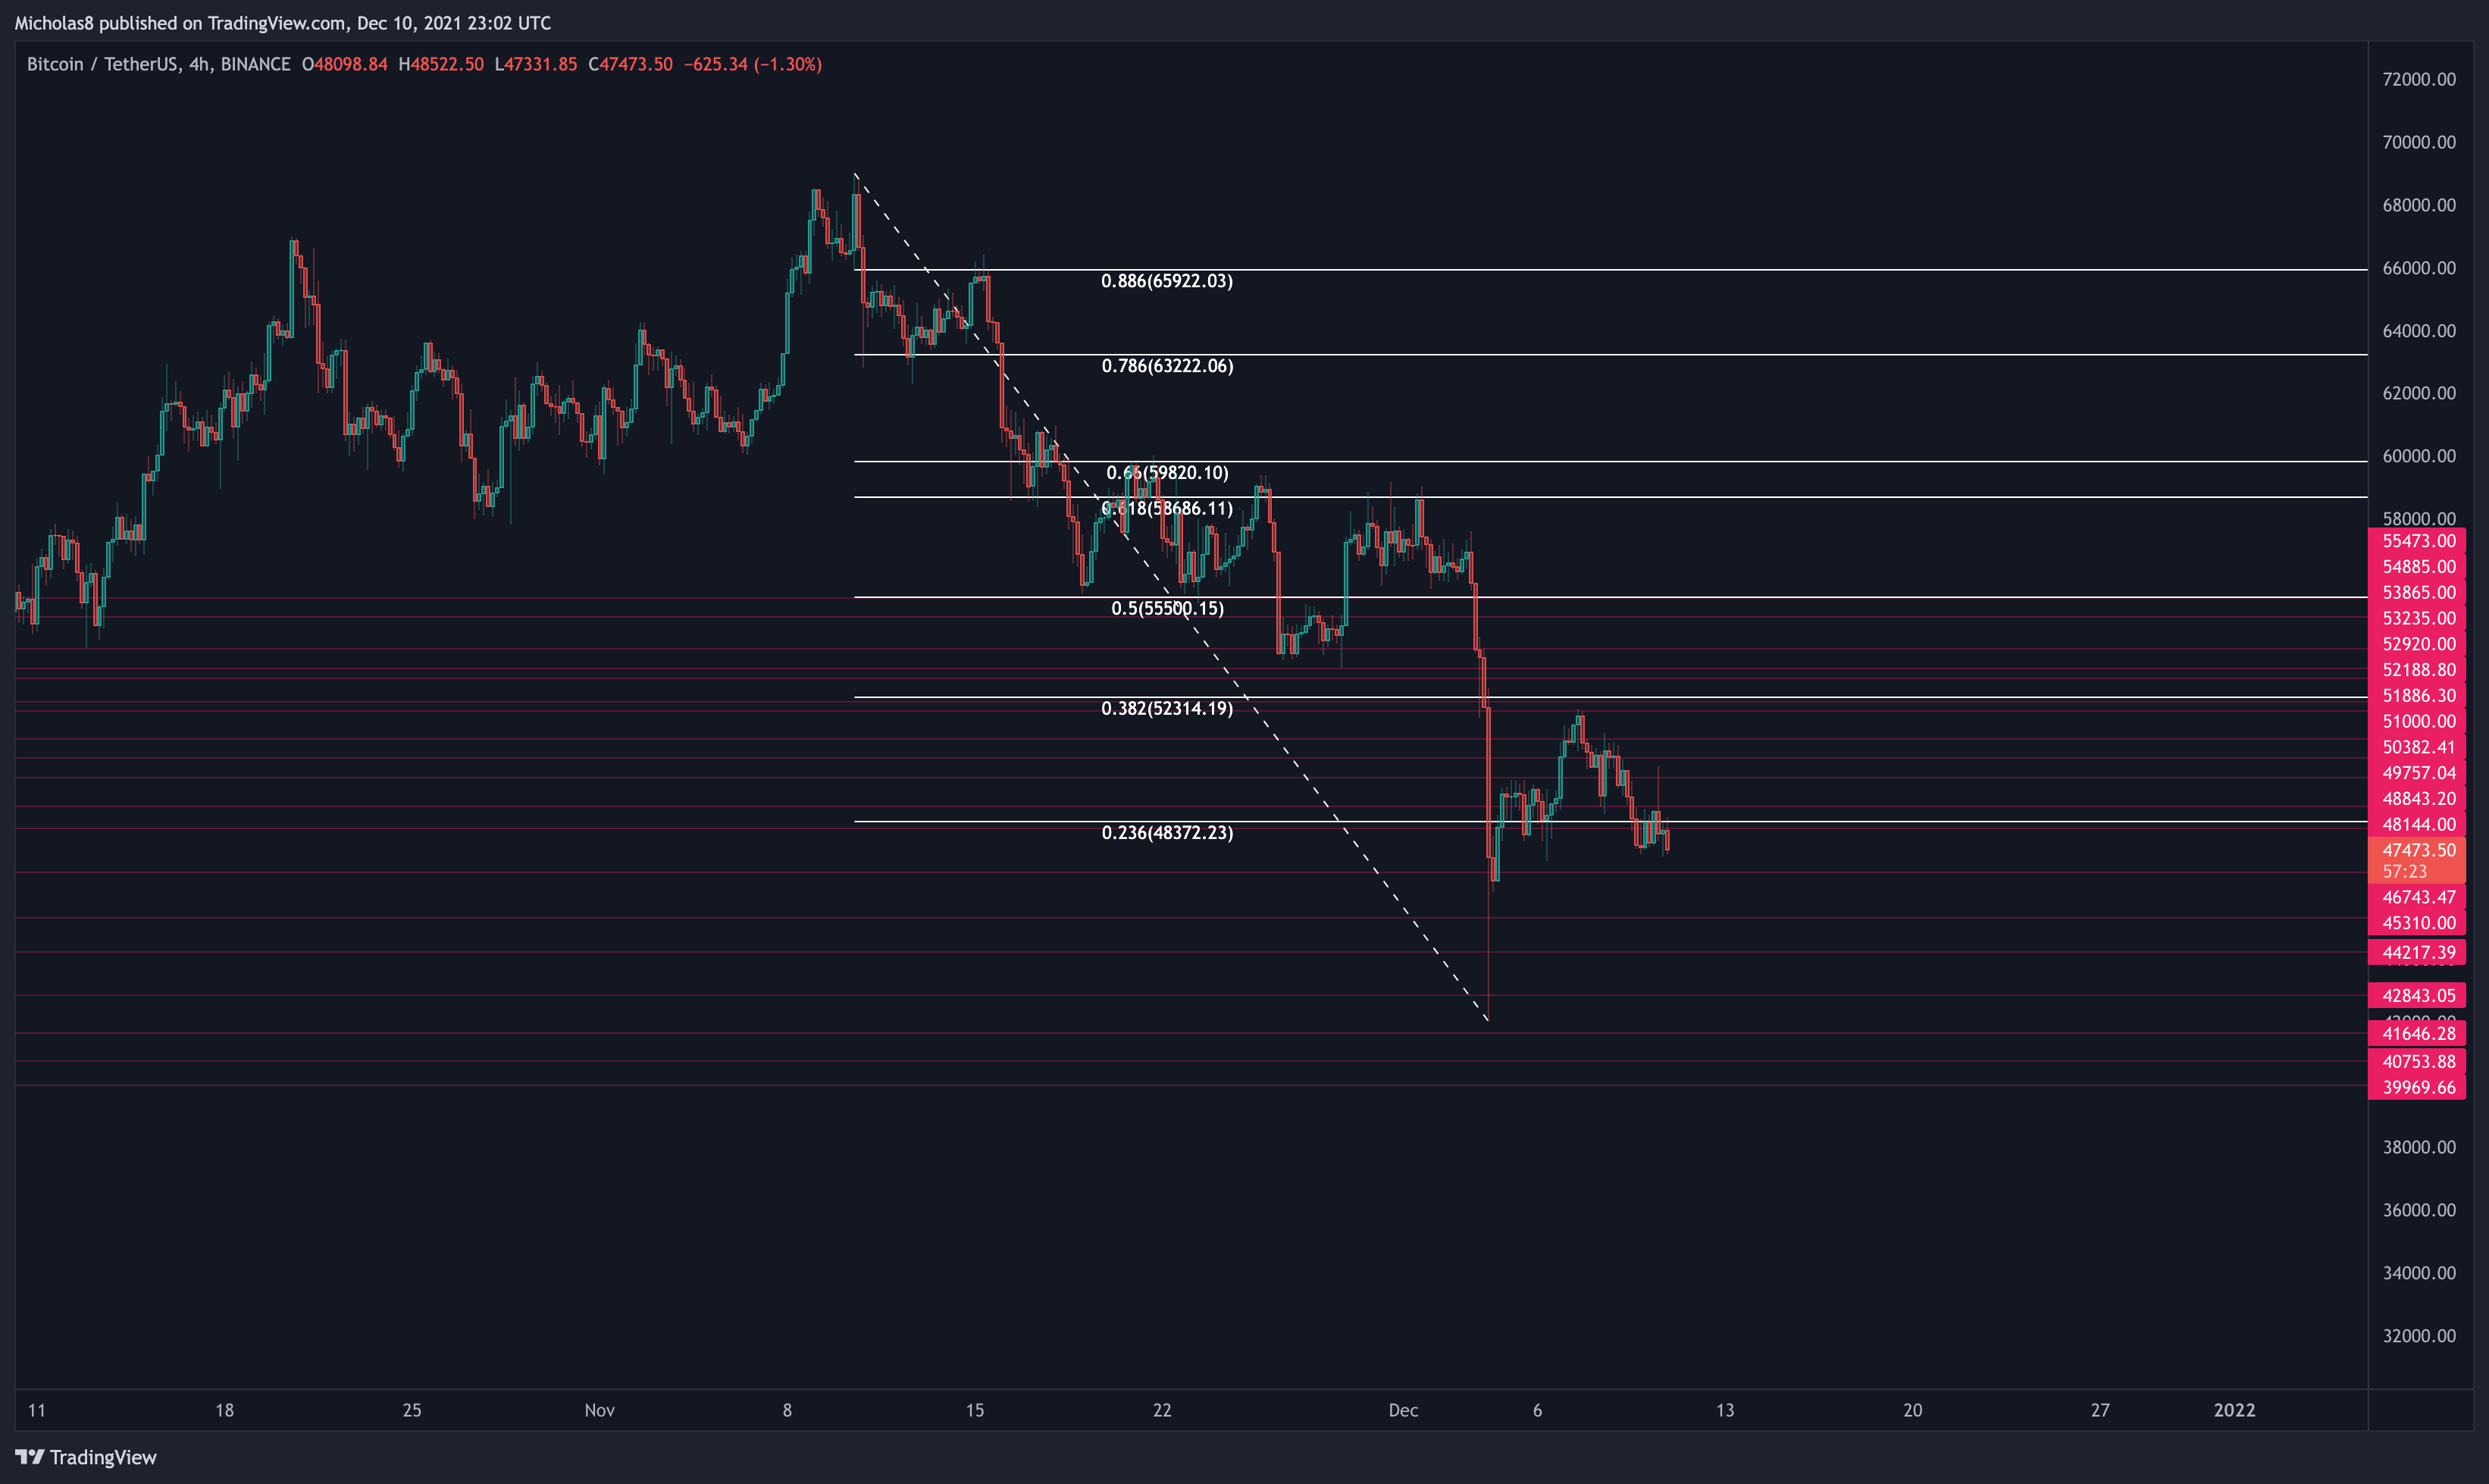
4H Timeframe
Bearish Market Structure
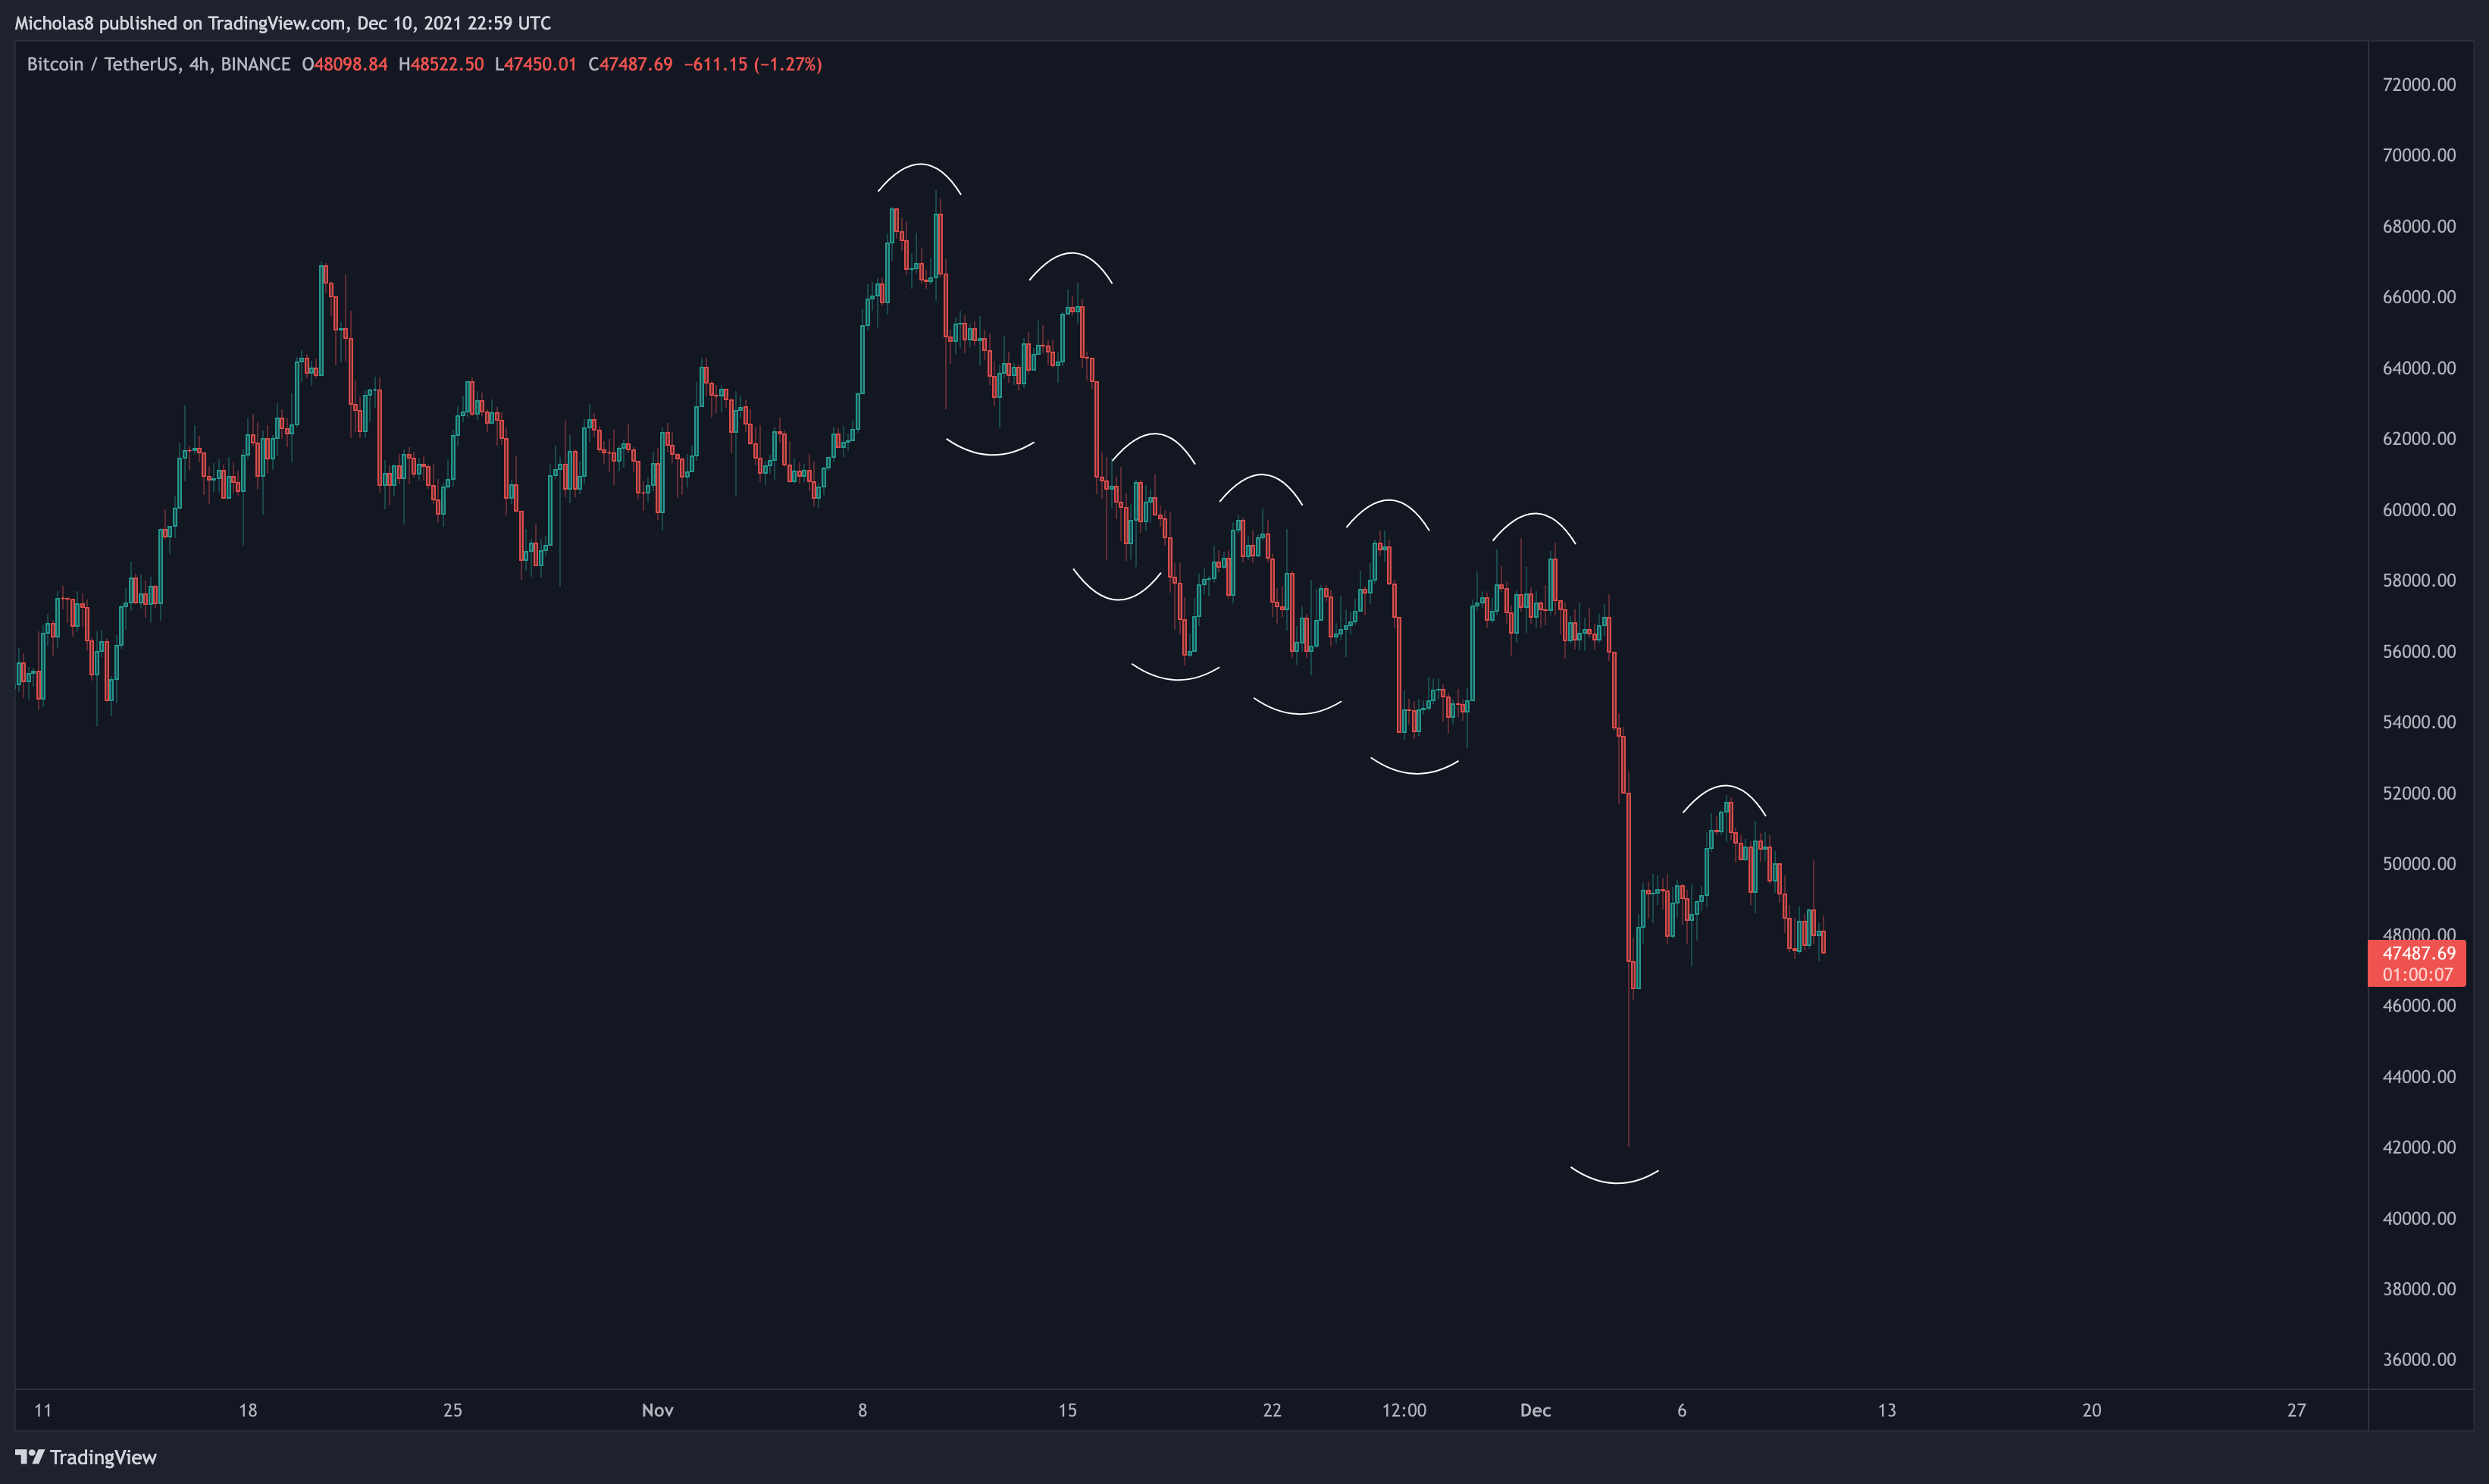
Bitcoin continues to print lower highs and lower lows. This is known as a bearish market structure. Until Bitcoin can create a meaningful new higher high, the medium-term outlook for Bitcoin is bearish.
Key Liquidity Zone (LQZ)
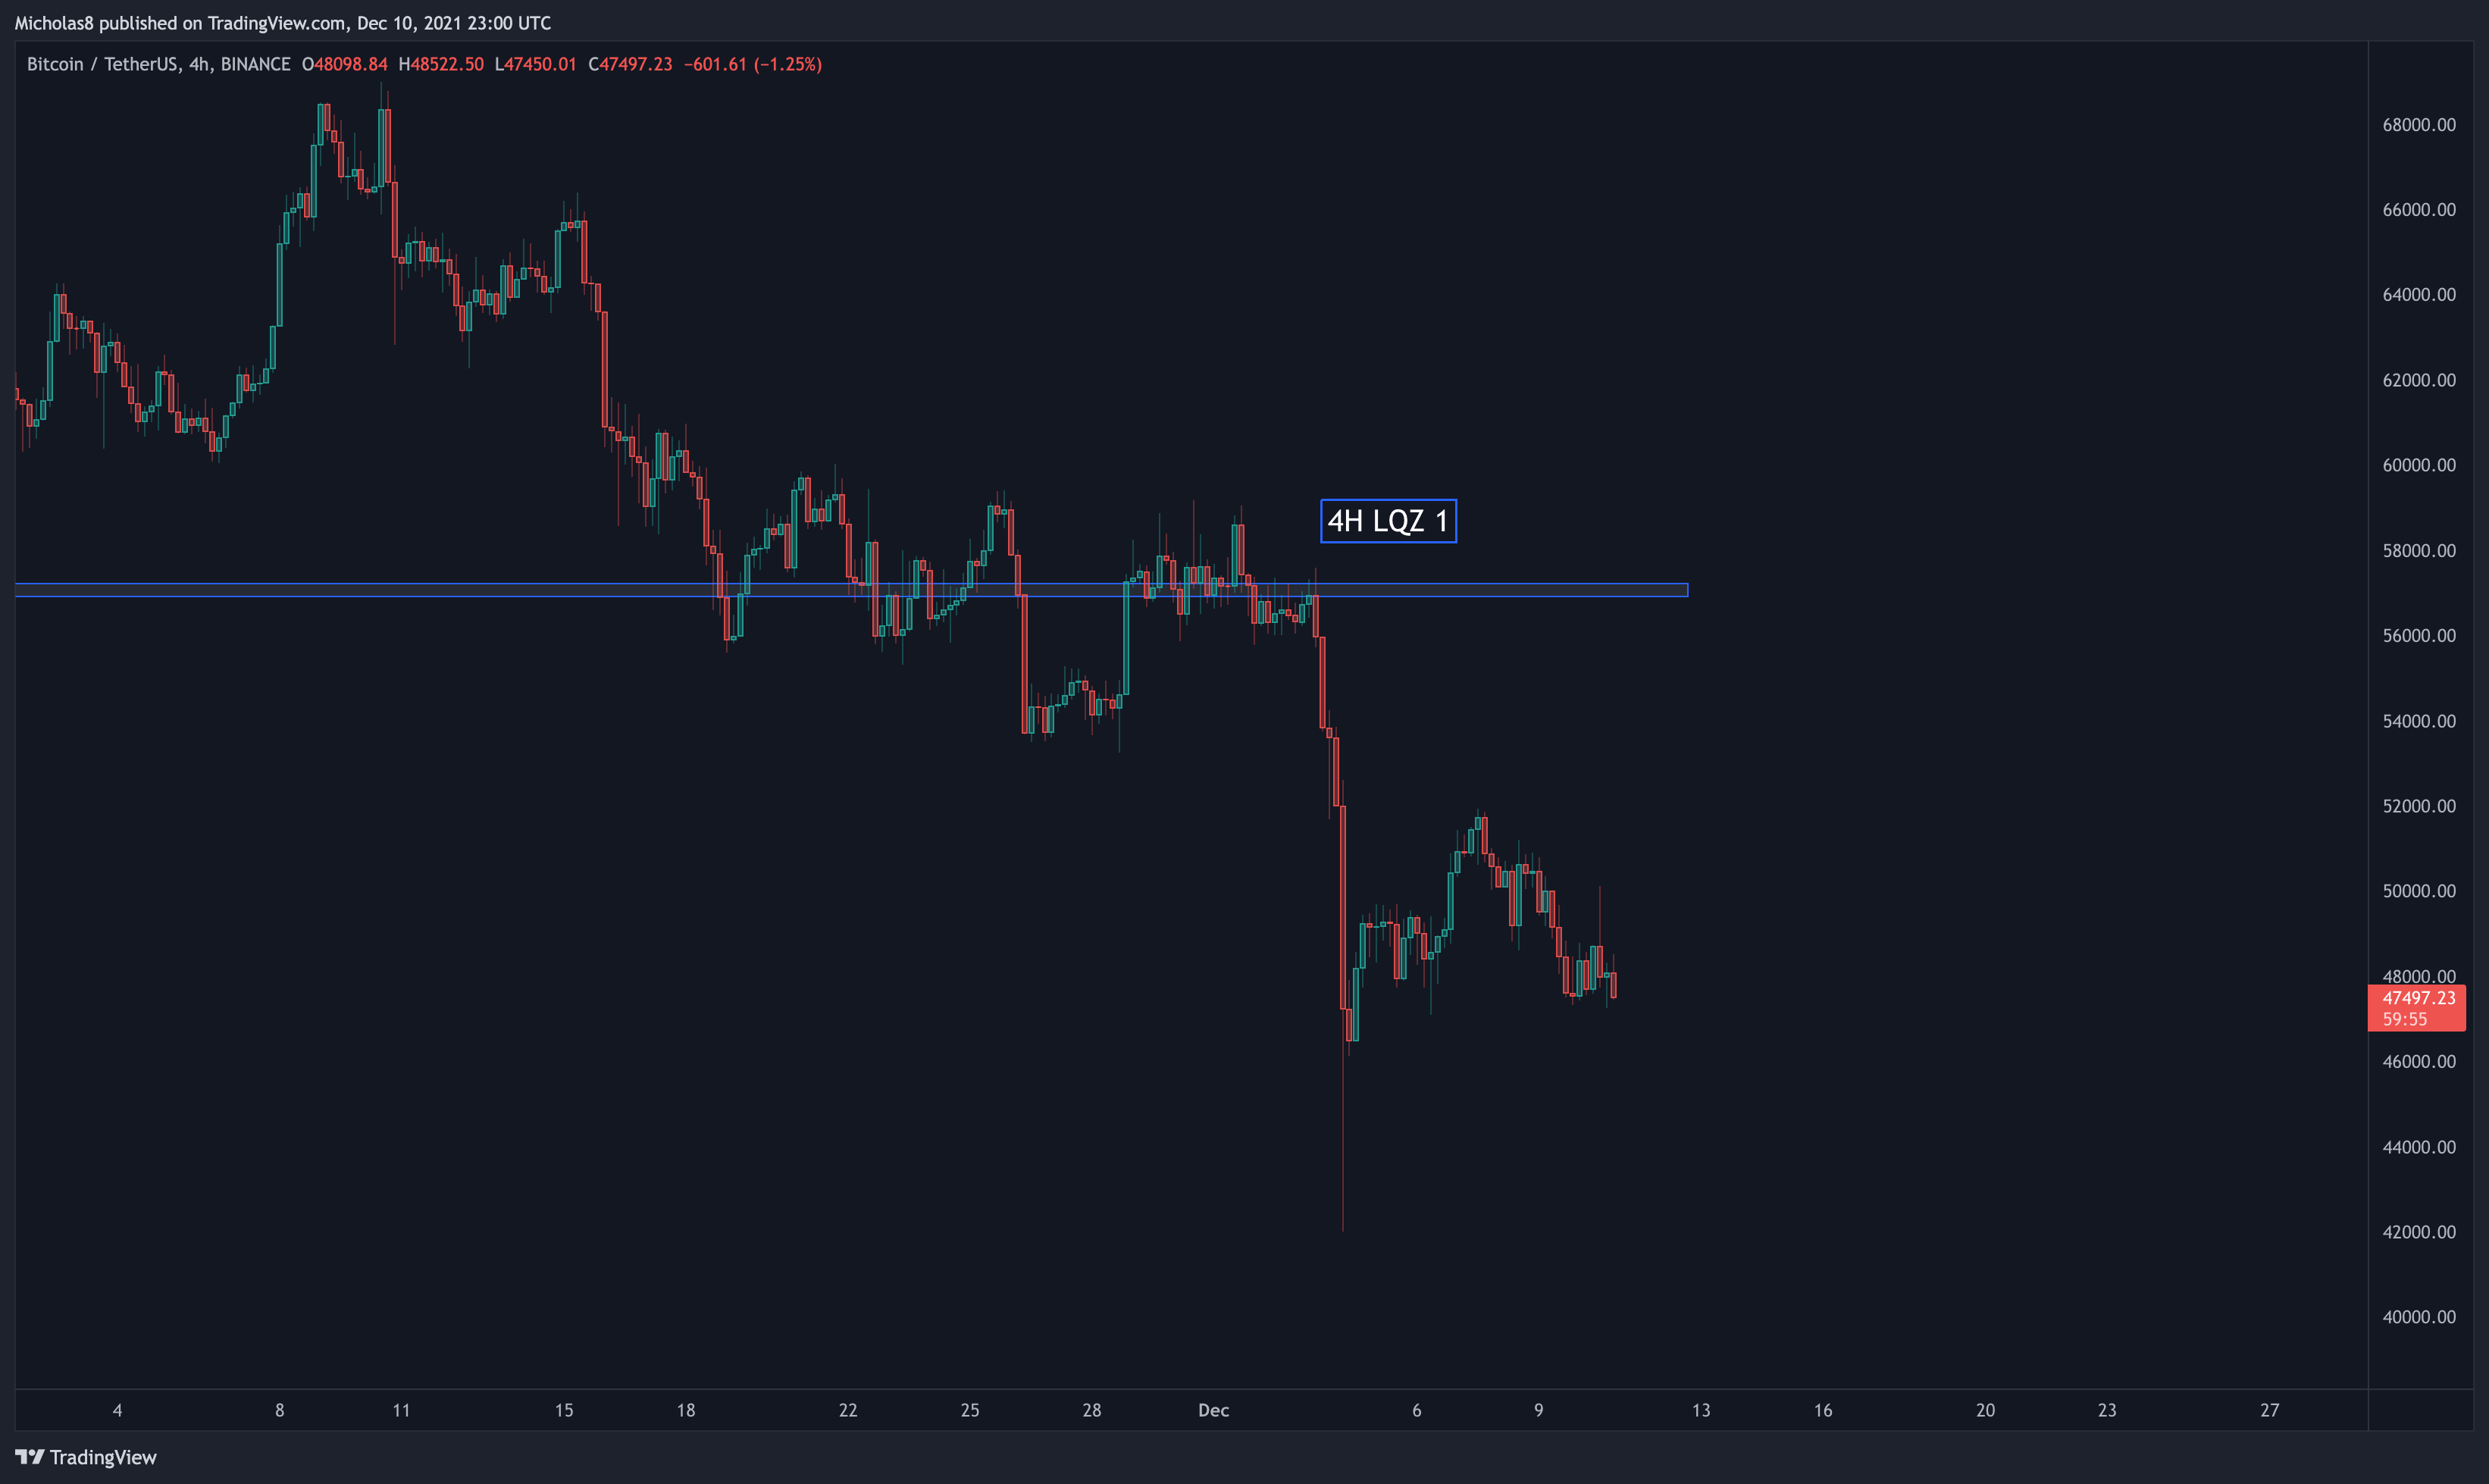
Zone 1: Bitcoin has lost this LQZ as support, which sits at 56.9k - 57.4k.
Implications: A lot of the liquidity in this timeframe rests above the current price of Bitcoin. We may see this serve as resistance moving forward.
EMA Ribbon
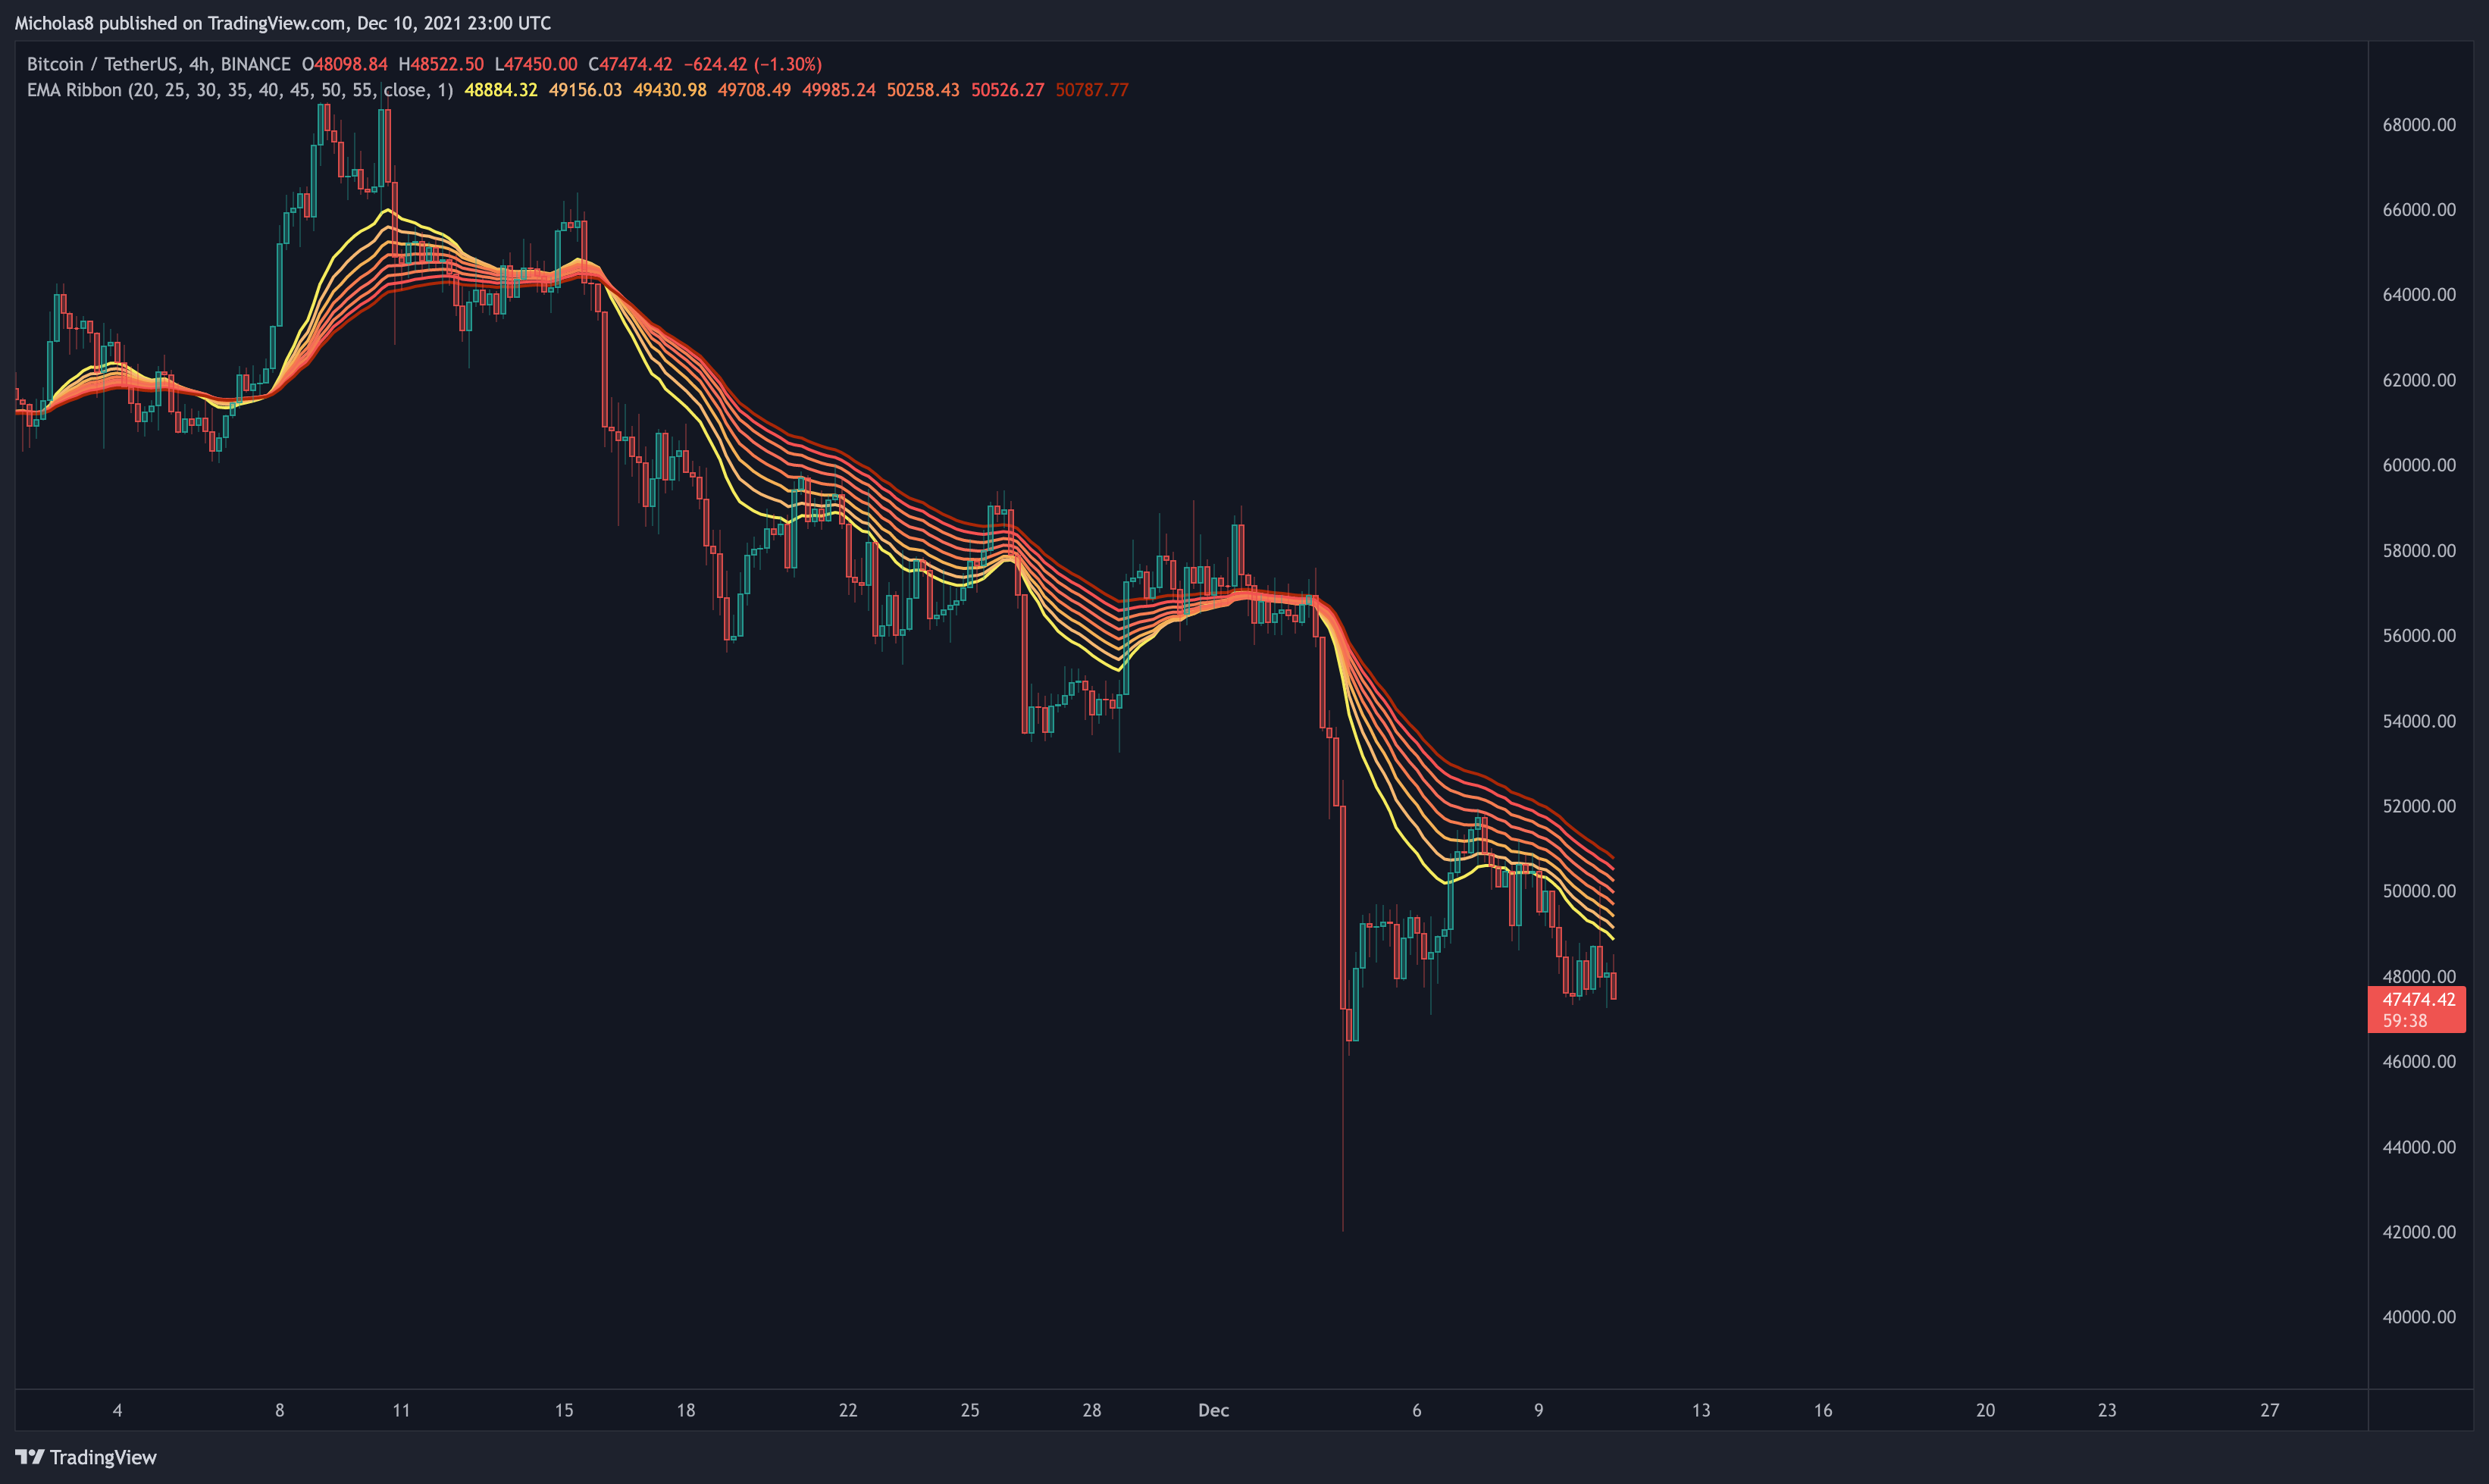
Bitcoin has fallen below the EMA ribbon in this timeframe.
Implication: Momentum may be shifting back to the bears. This may serve as resistance moving forward.
Note: The narrower the ribbon, the weaker it serves as support/resistance.
Simple Moving Average (SMA): 20, 50 and 200
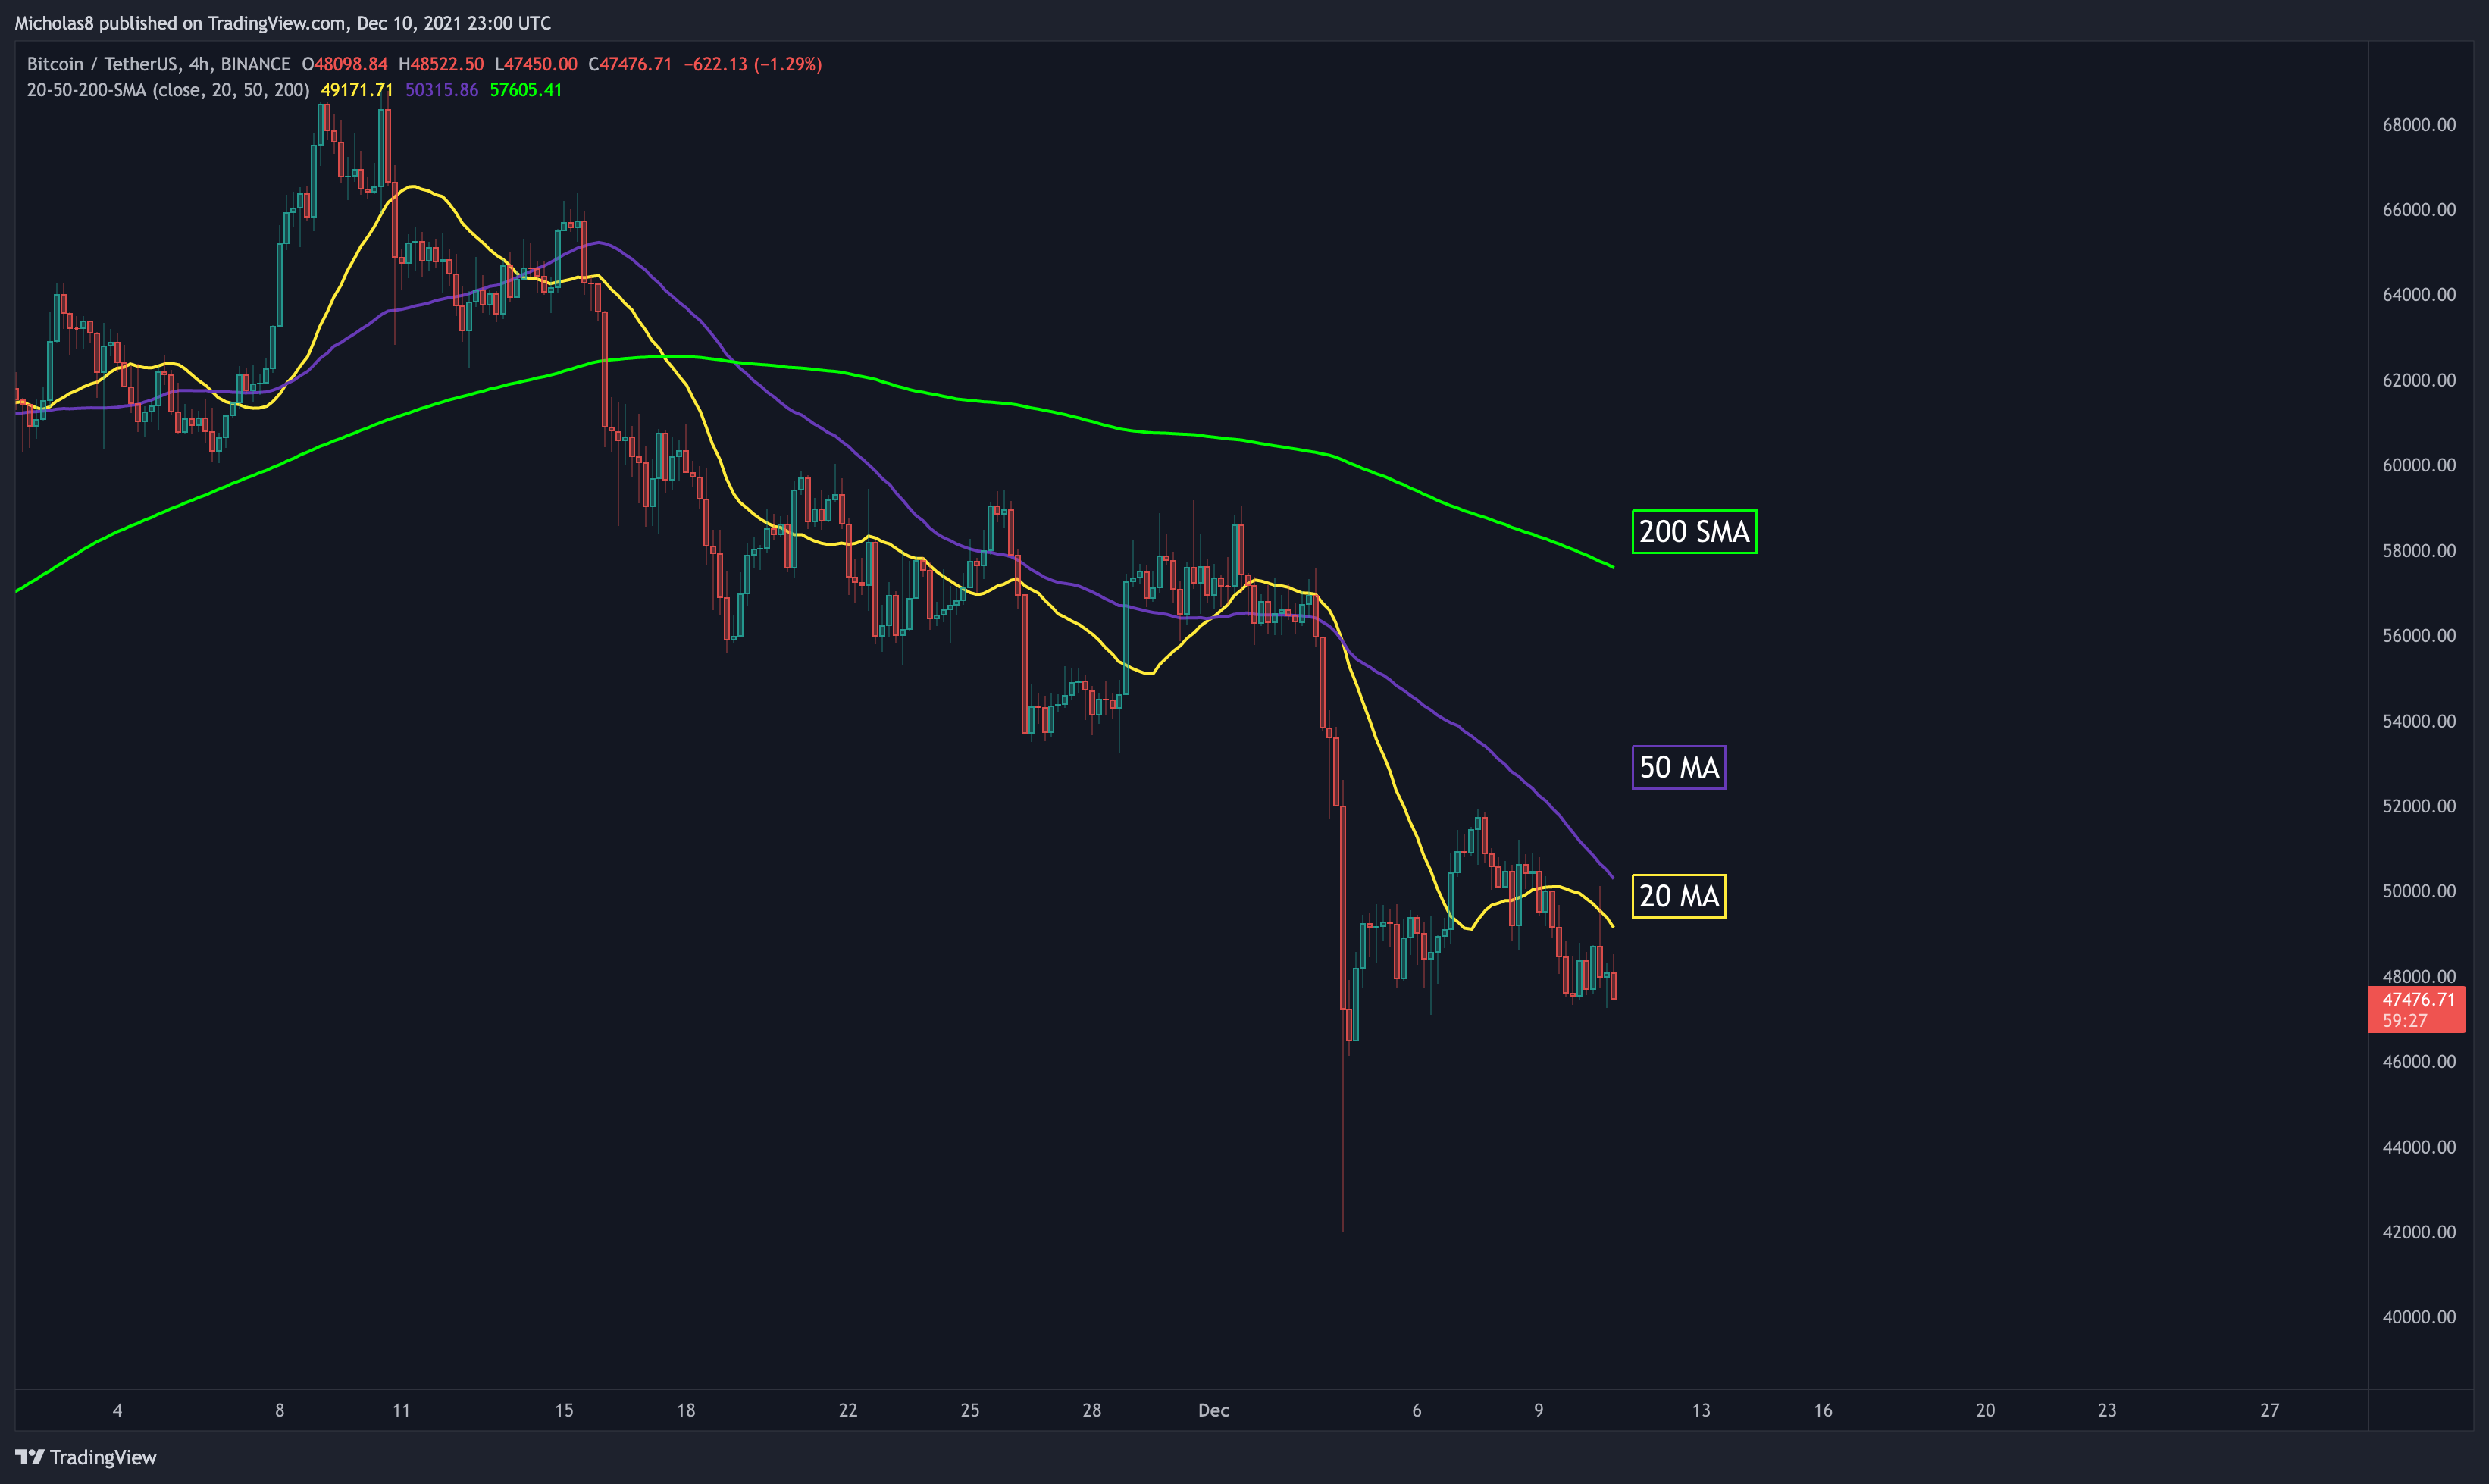
Bitcoin has lost these SMAs as support.
Implications: They may act as resistance moving forward.
Divergences
Hidden Bearish Divergence
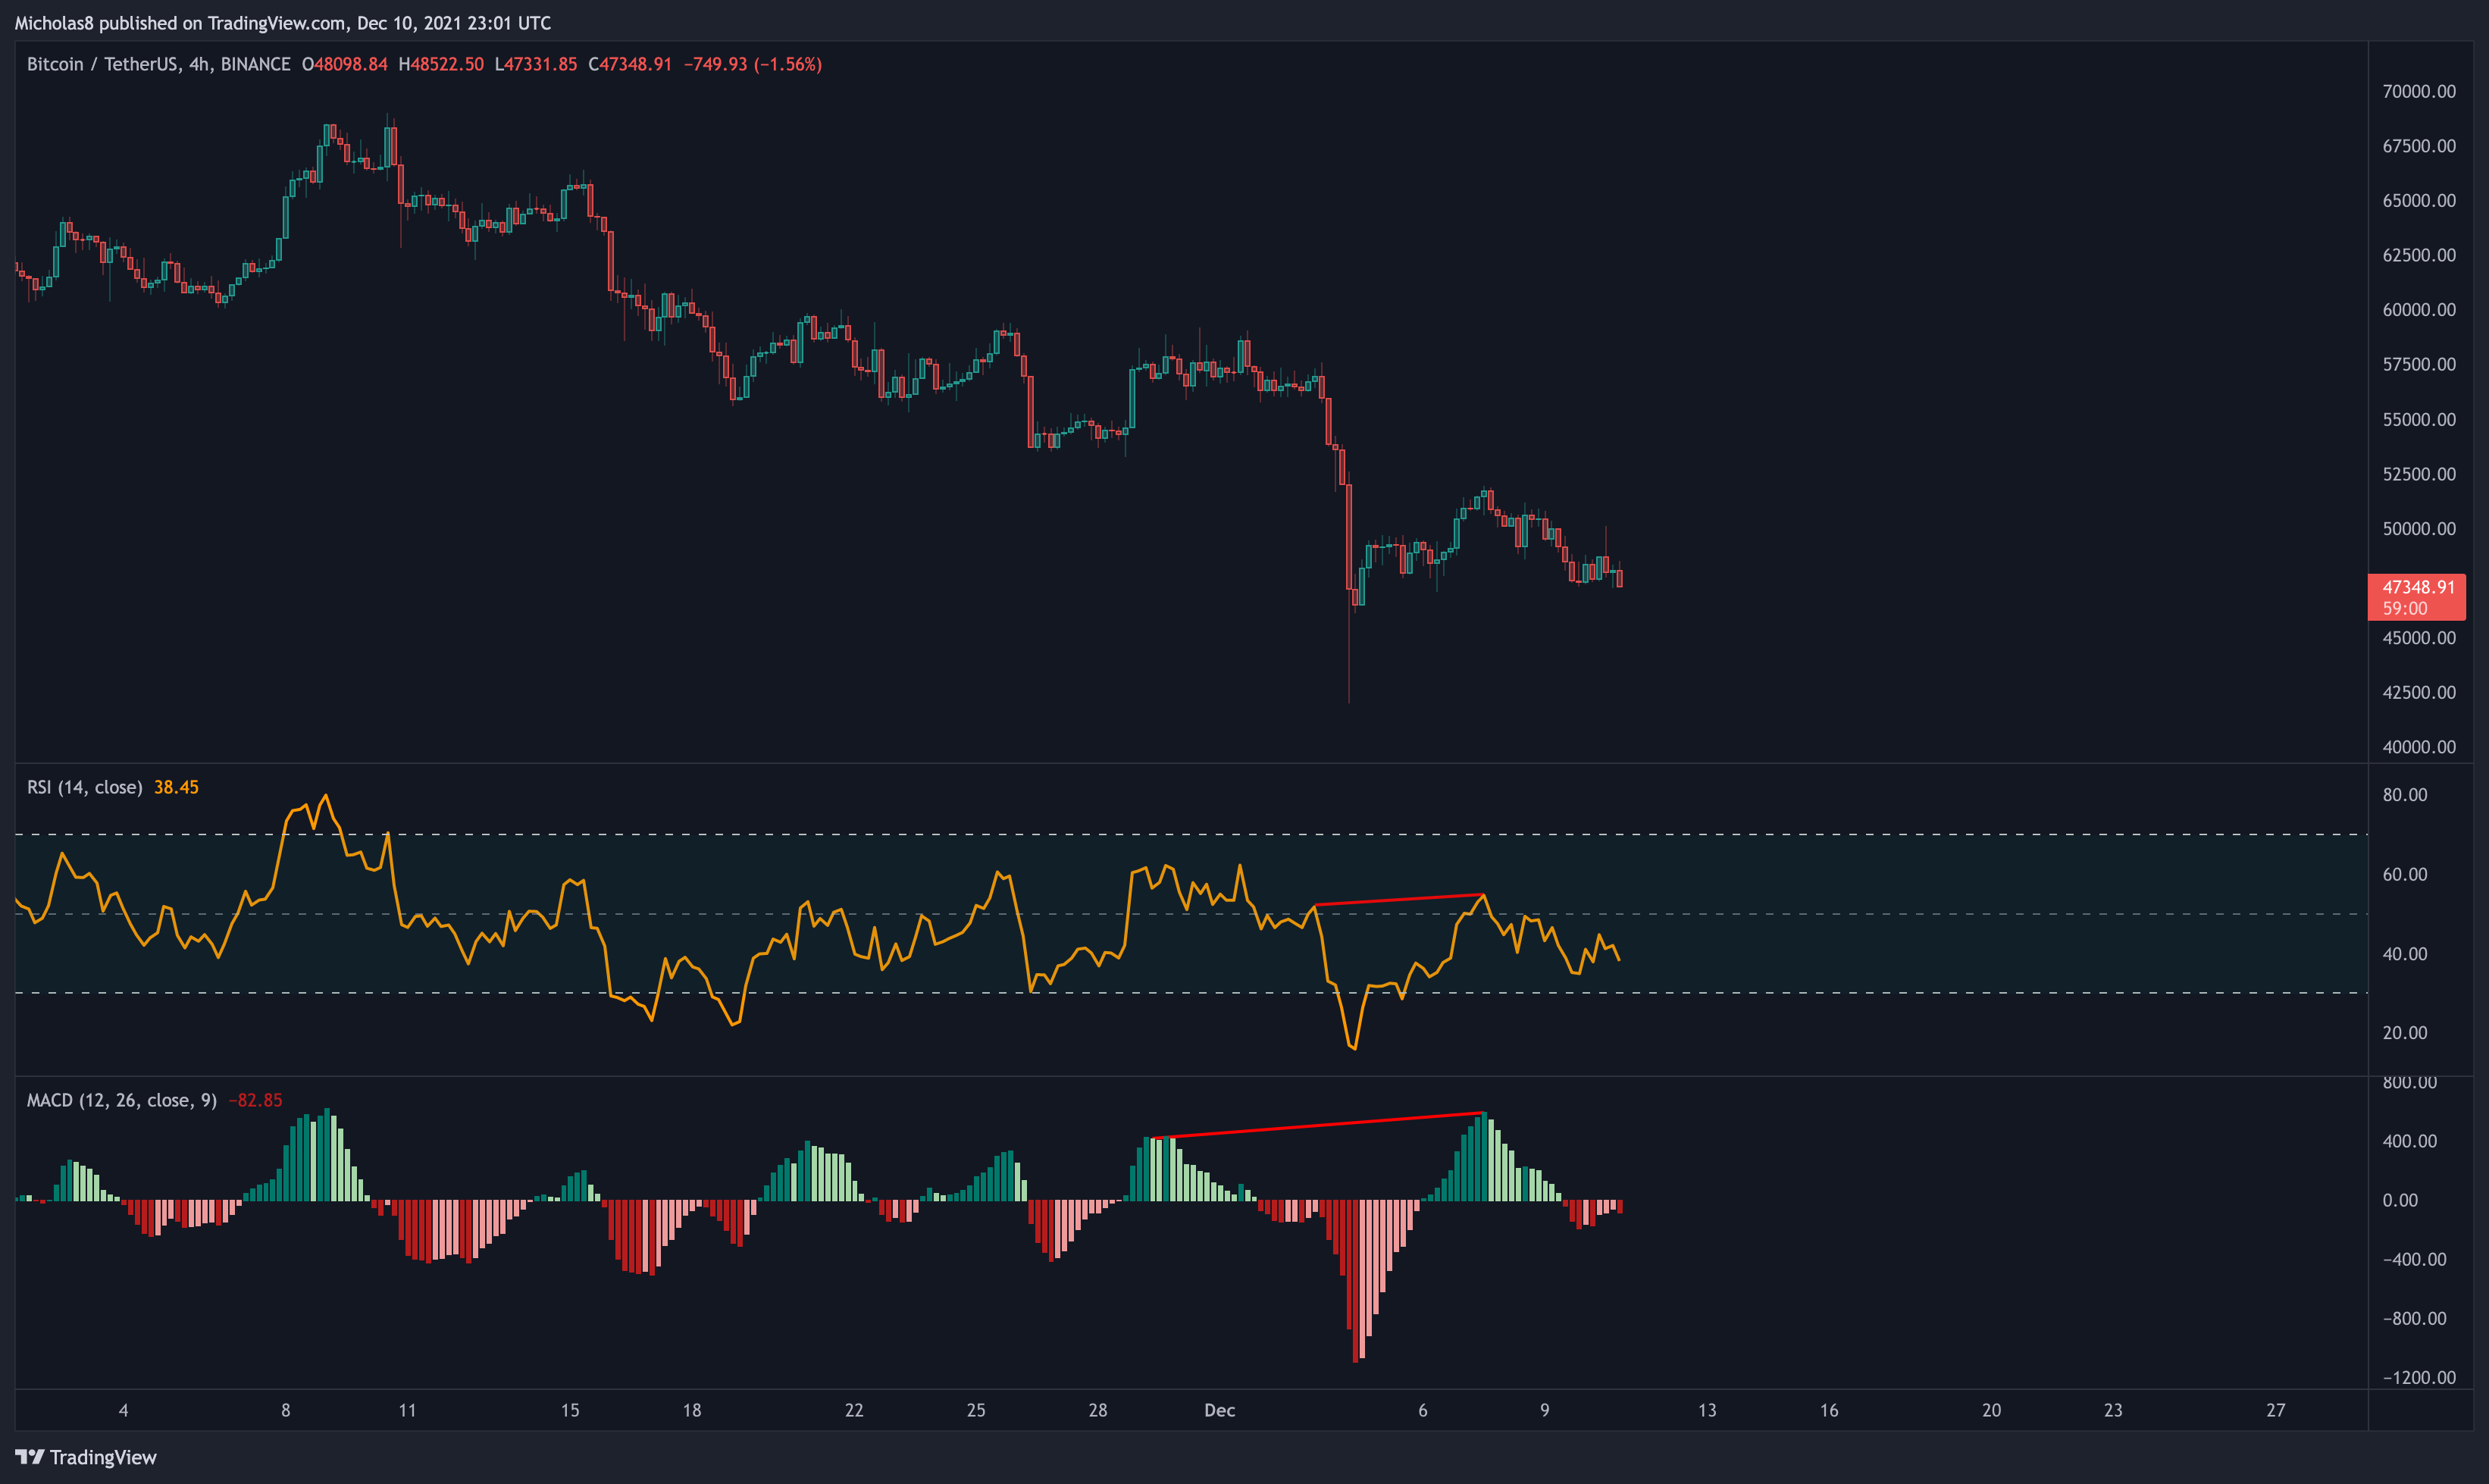
Bitcoin has a lower high in price, with a higher high on the RSI/MACD. This is a hidden bearish divergence, which signals a possible trend continuation down.
Invalidation: Higher high in price and in the oscillators.
1H Timeframe
EMA Ribbon
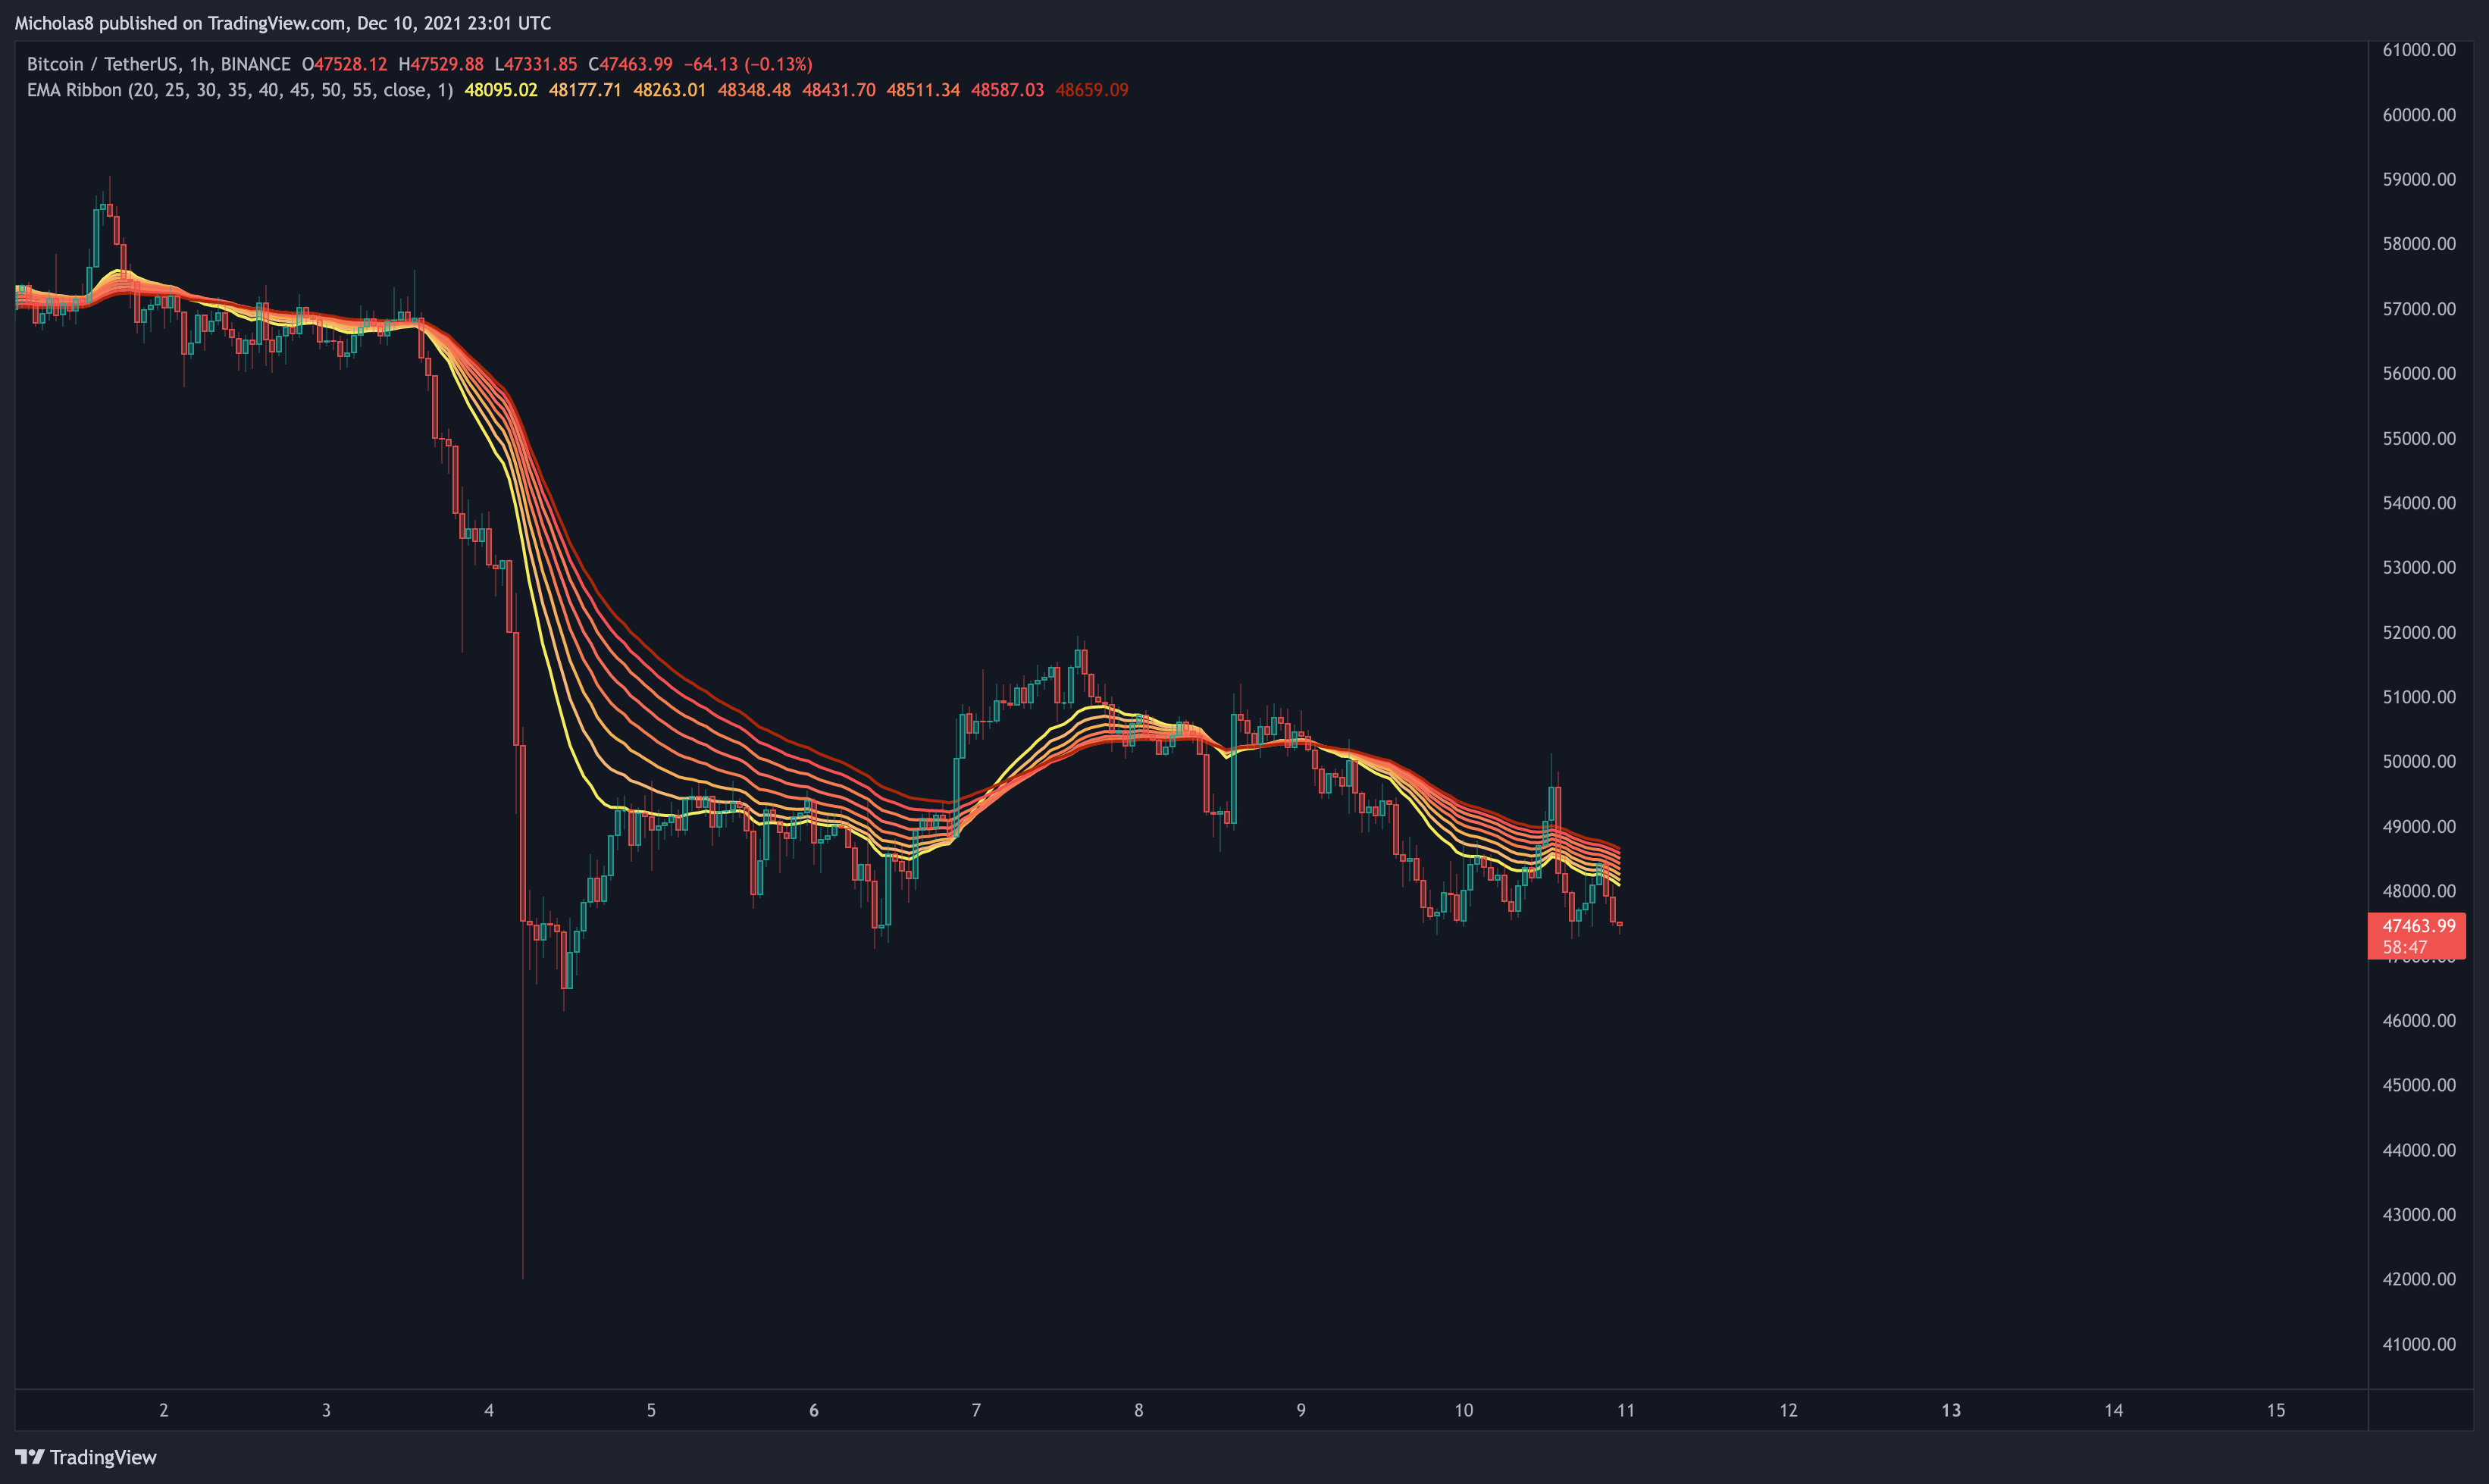
Bitcoin has fallen below the EMA ribbon in this timeframe.
Implication: Momentum may be shifting back to the bears. This may serve as resistance moving forward.
Note: The narrower the ribbon, the weaker it serves as support/resistance.
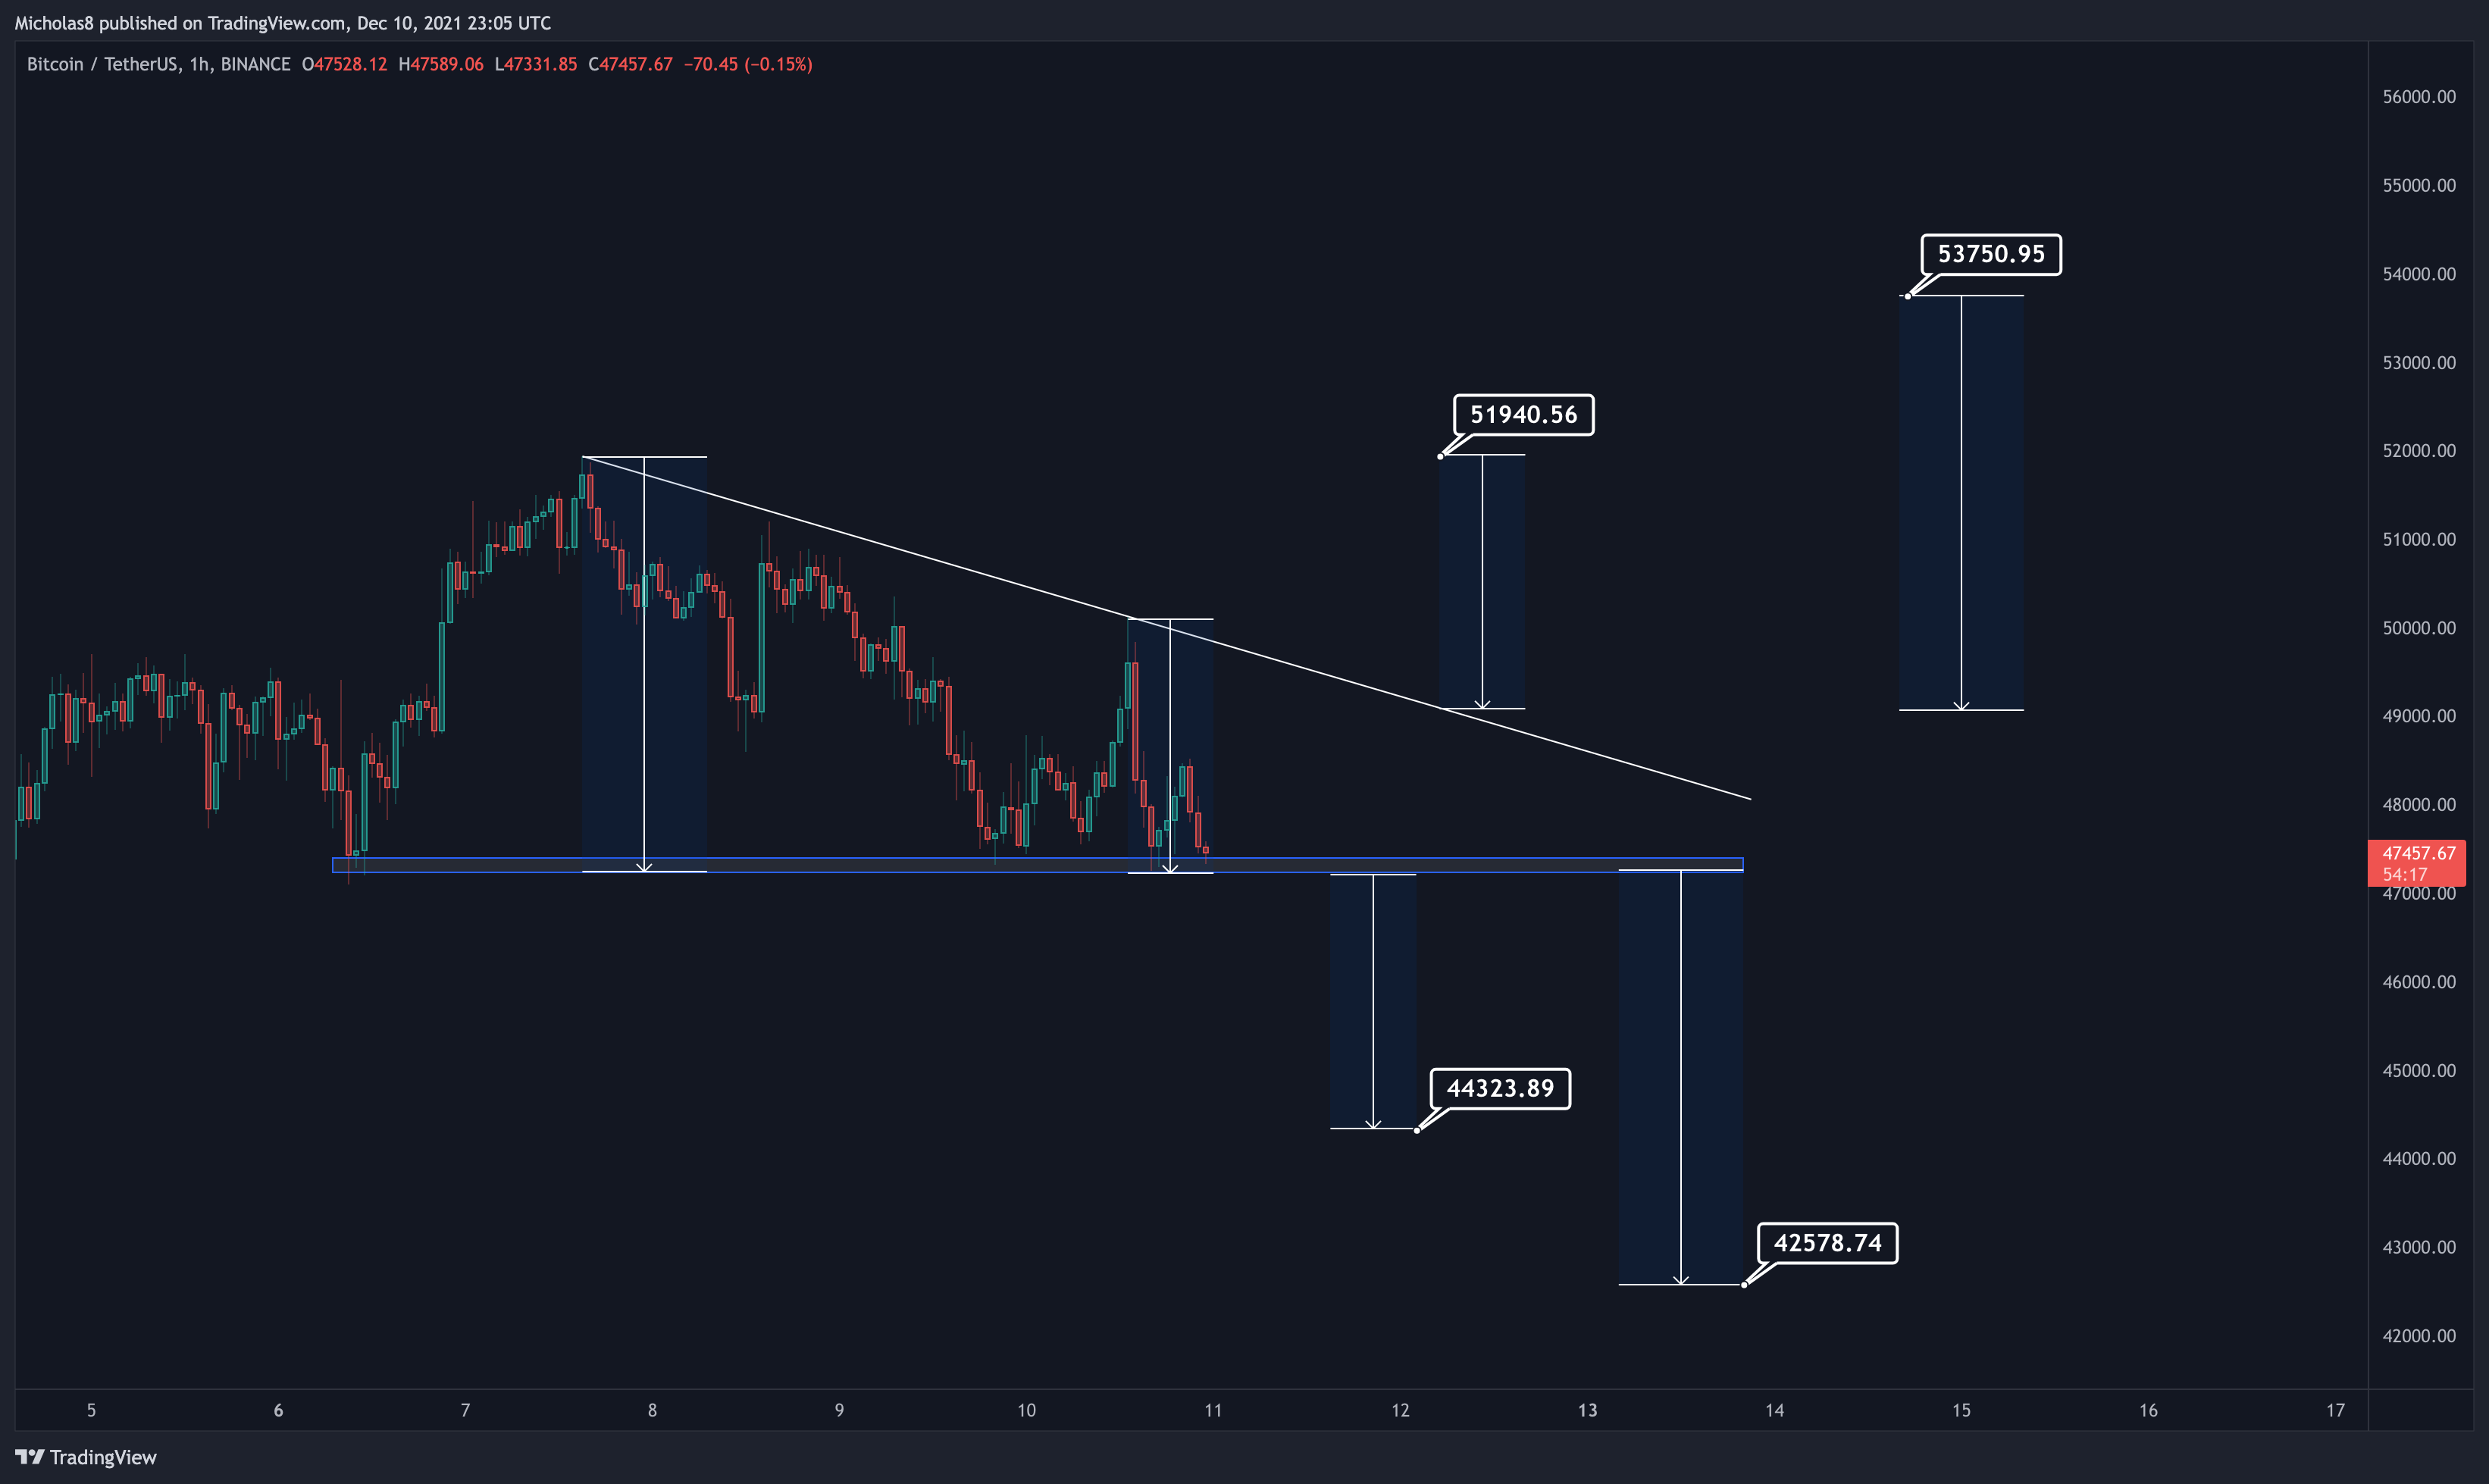
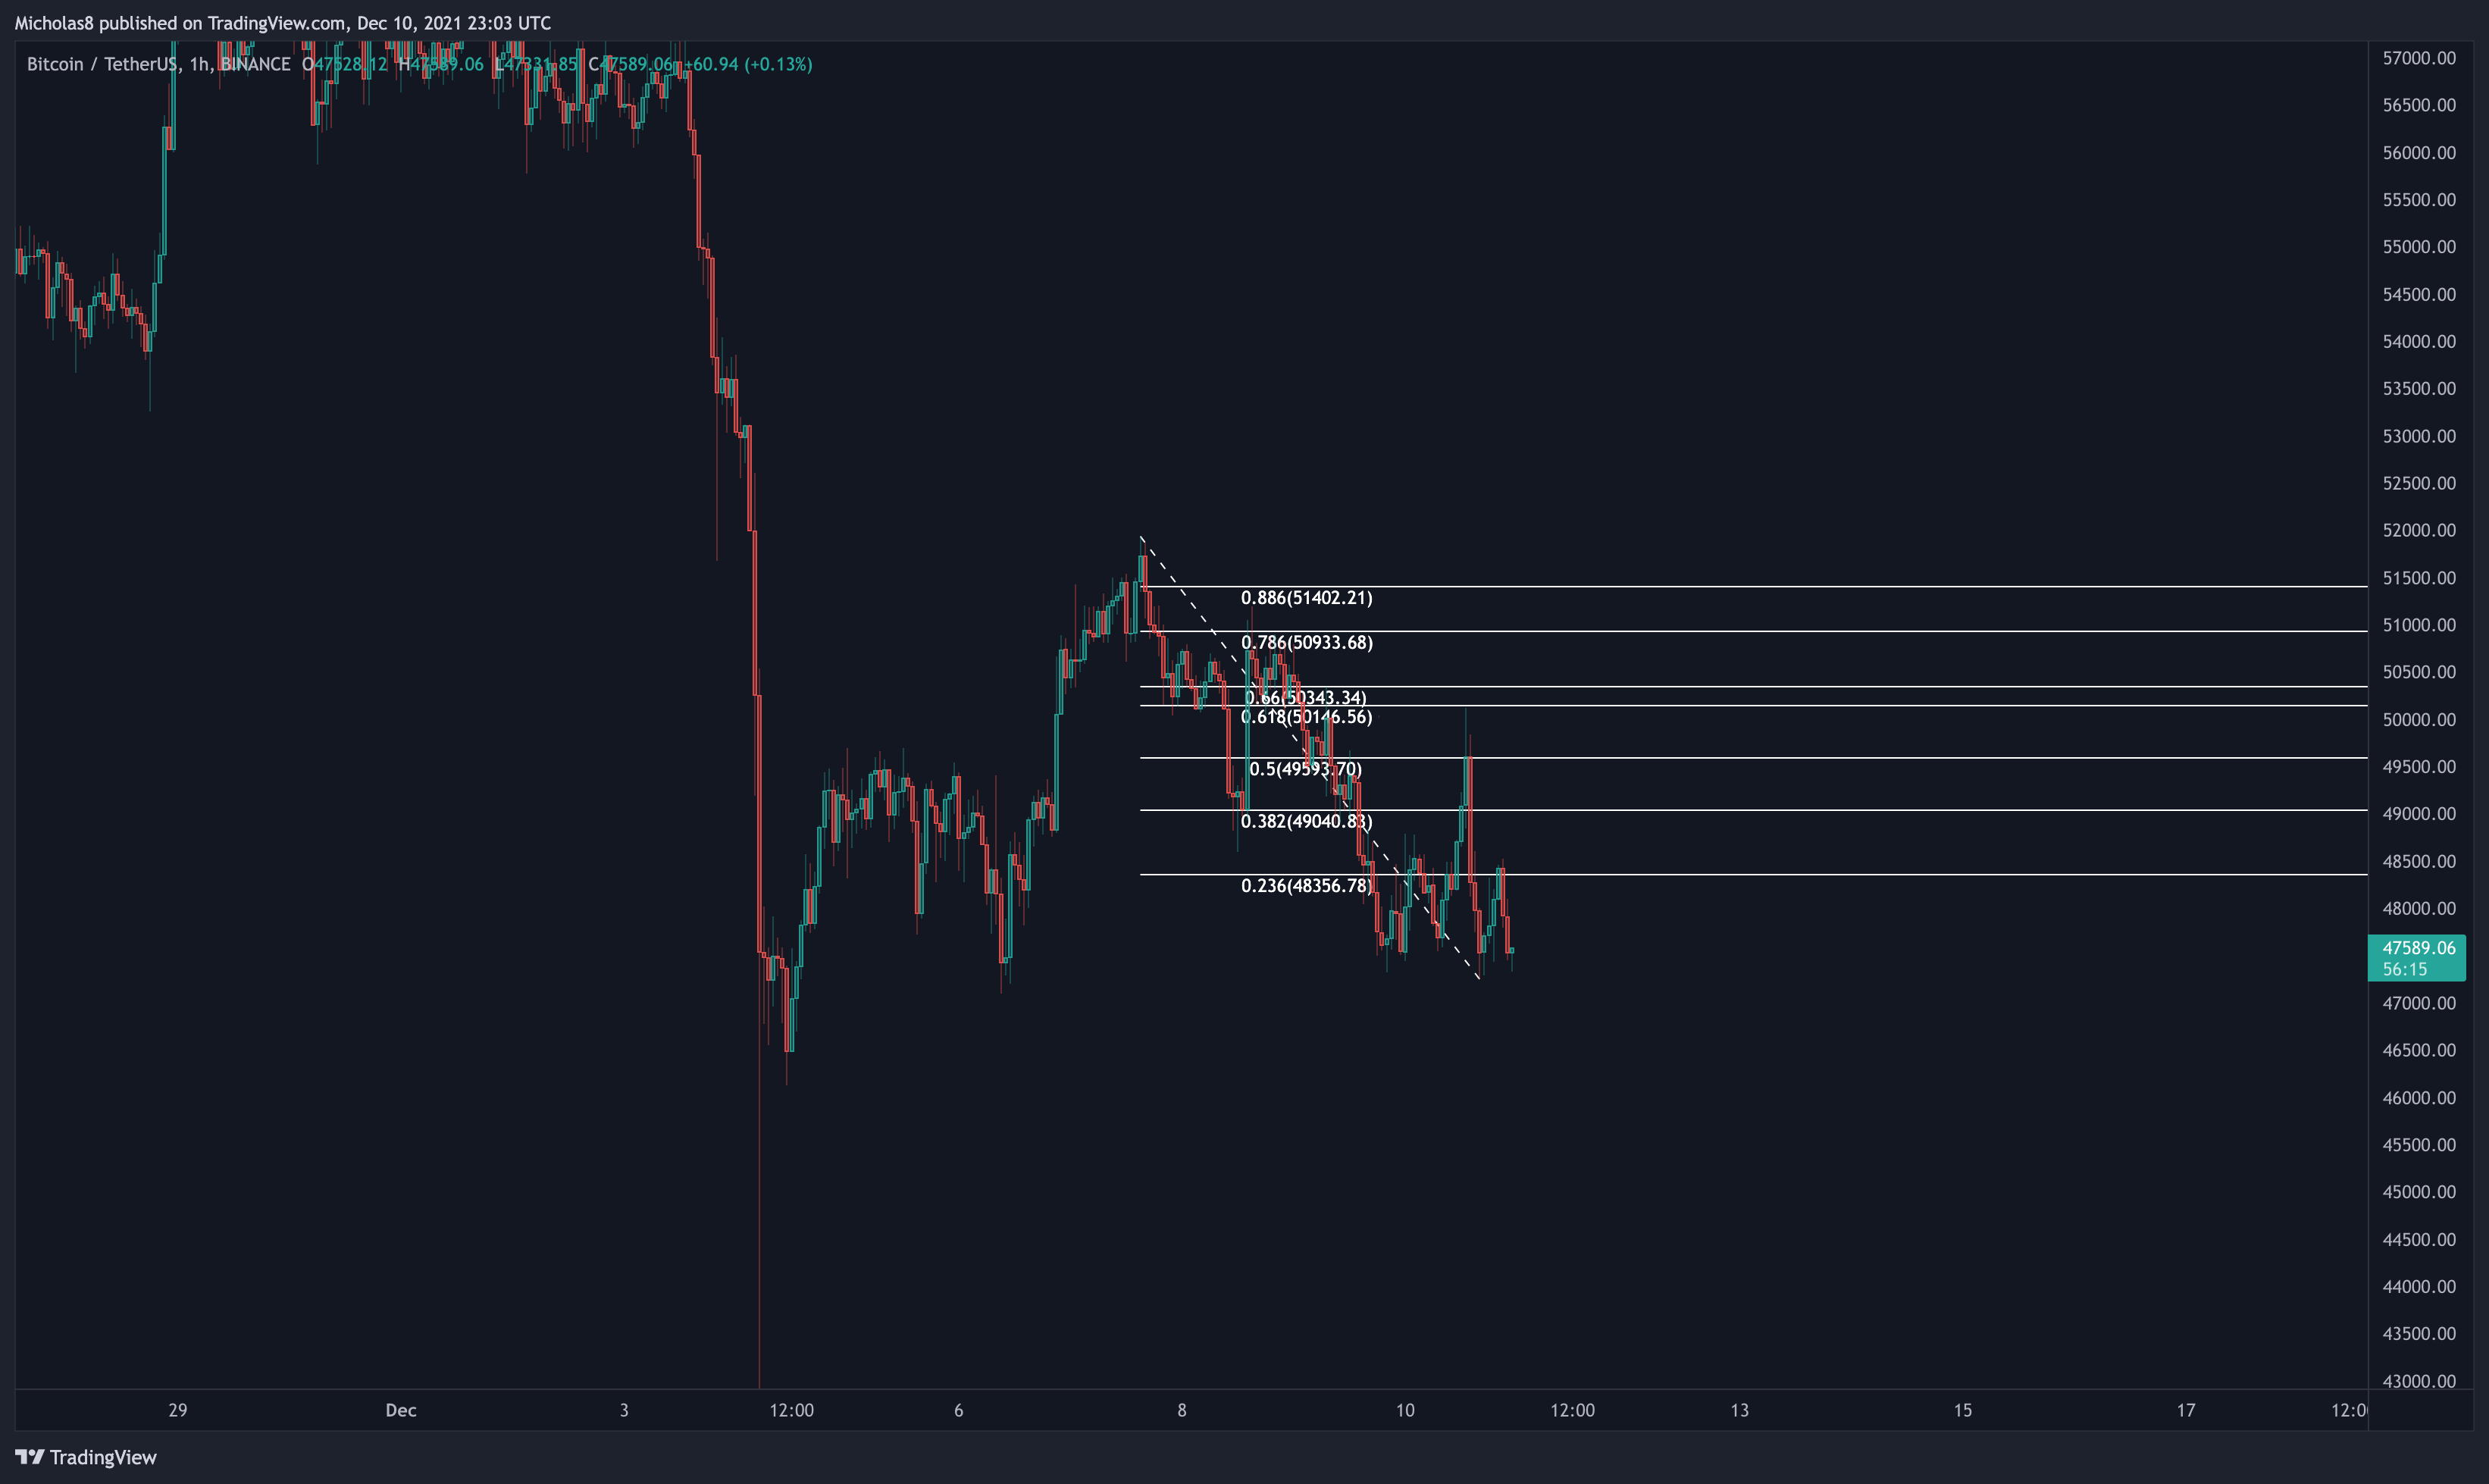
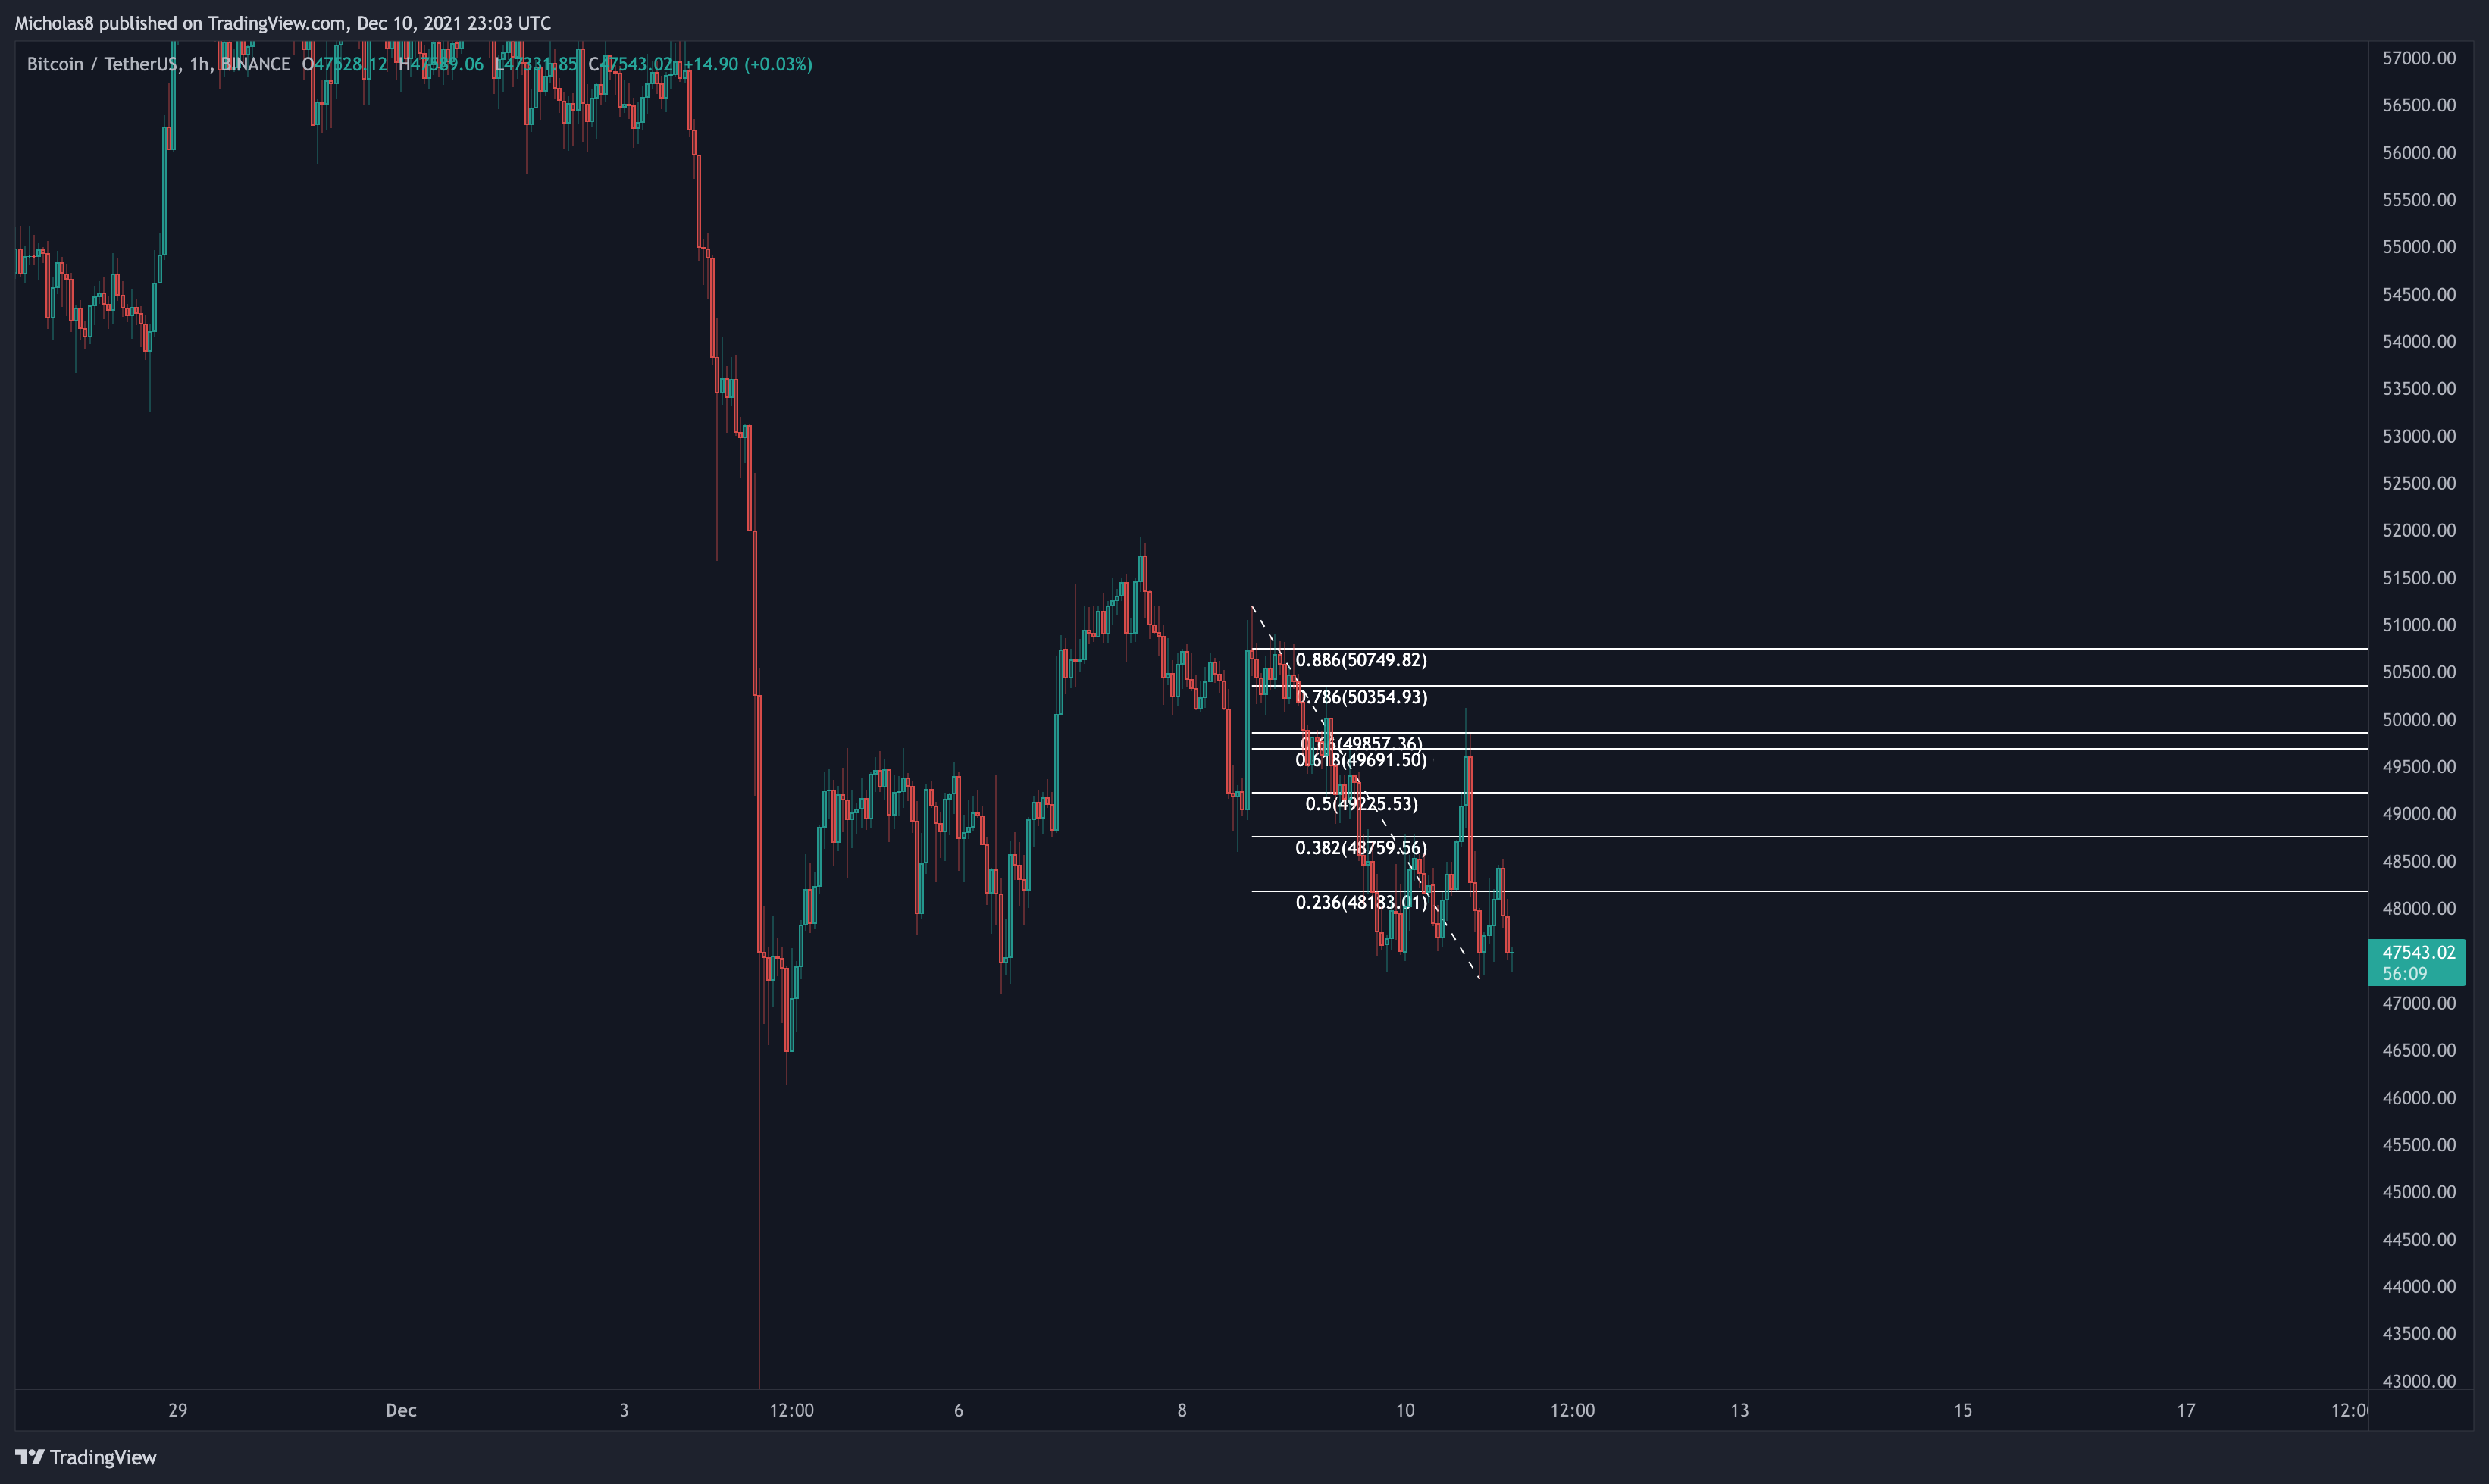
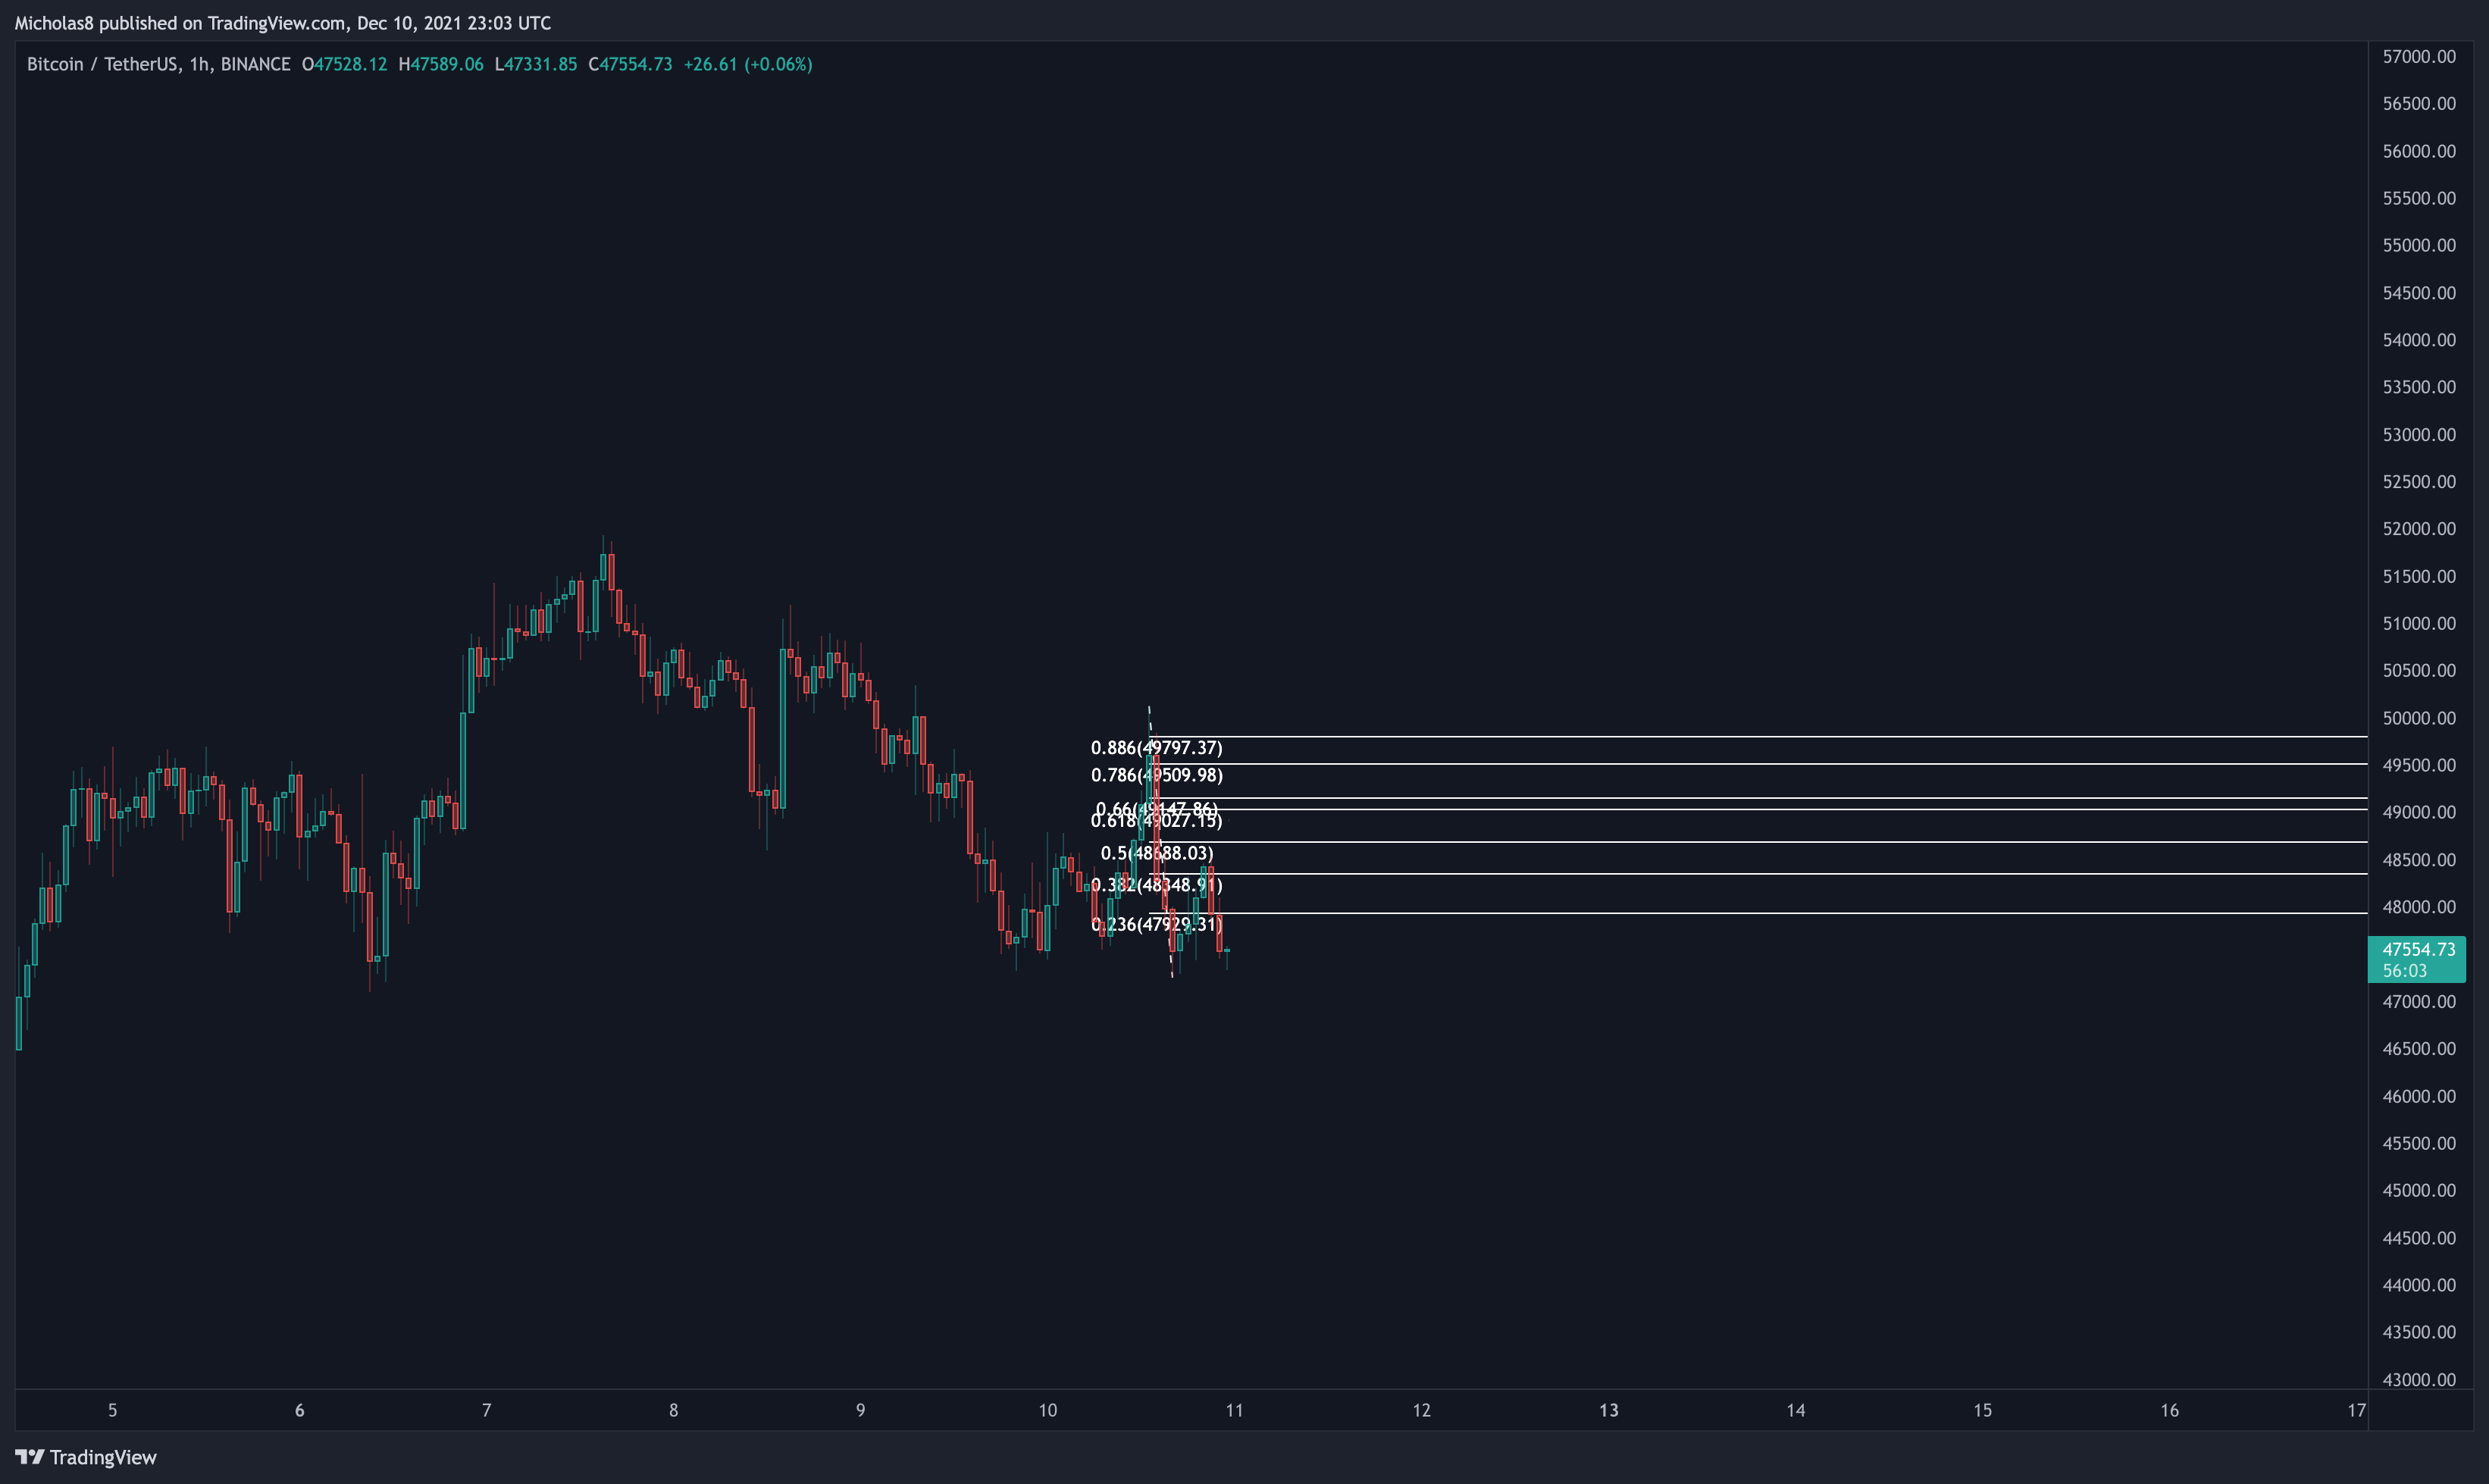
Patterns
*Please note not all technical targets will be hit, so be aware of all key levels and Fibonacci Levels, and also look out for divergences as they have the power to reverse a trend
Descending Triangle
CME GAPS
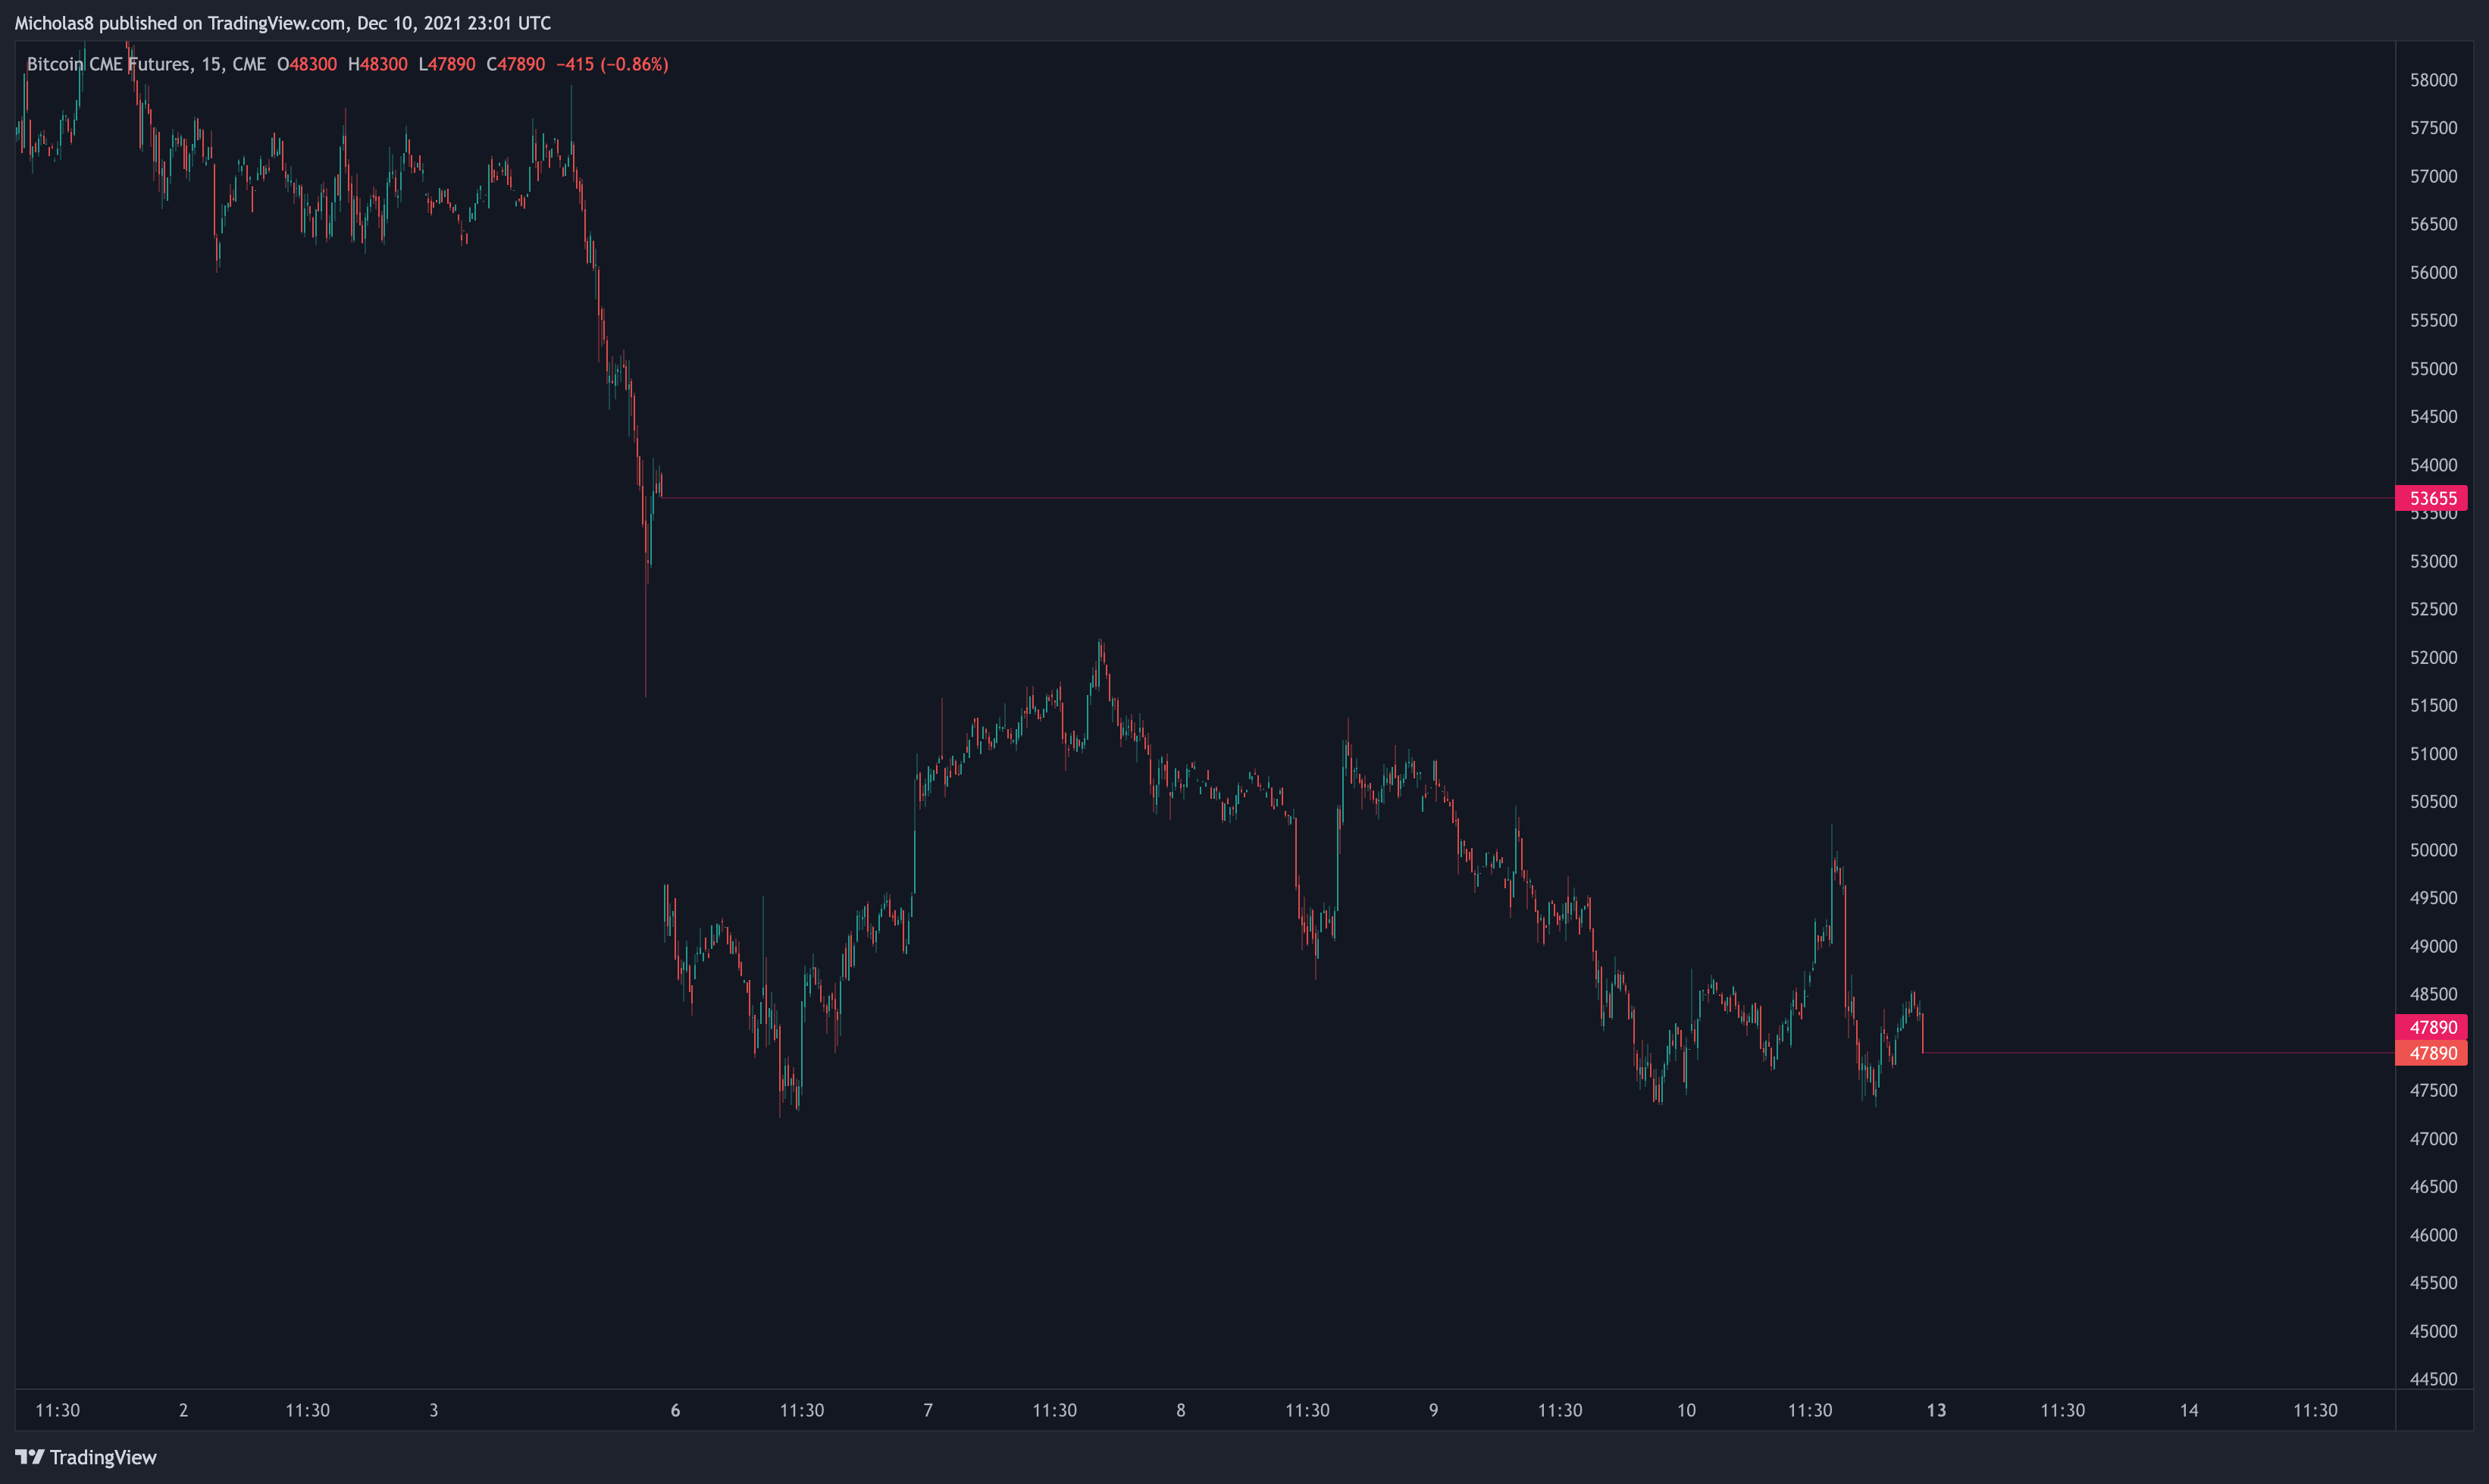
The gap below us at 32480 is still open. Although not all gaps fill, they do tend to, which is why I'm still including this gap as something to be aware of.
NEW GAP: 53665
NEW GAP: 47890
Key Levels
Daily Timeframe
47800
47635
46255
44865
42205
40735
39245
38205
35910
33400
29800
48290
49490
50590
51295
51755
52665
53950
54340
54720
55315
56245
56900
57775
58050
58415
58865
Fibonacci Levels
4H Timeframe
39970
40755
41645
42845
44215
45310
46745
48145
48845
49755
50380
51000
51885
52190
52829
53235
53865
54885
55473
Fibonacci levels
1-hour Timeframe
42000
46130
47920
48315
49190
49700
50545
51680
52605
53860
56040
57375
Fibonacci levels
FINAL THOUGHTS
RECAP FROM THIS MORNING
Bitcoin saw a very nice rally to upside this morning. But ultimately, it was seen by a swift rejection. What exactly happened? Let's take a look at the technicals.
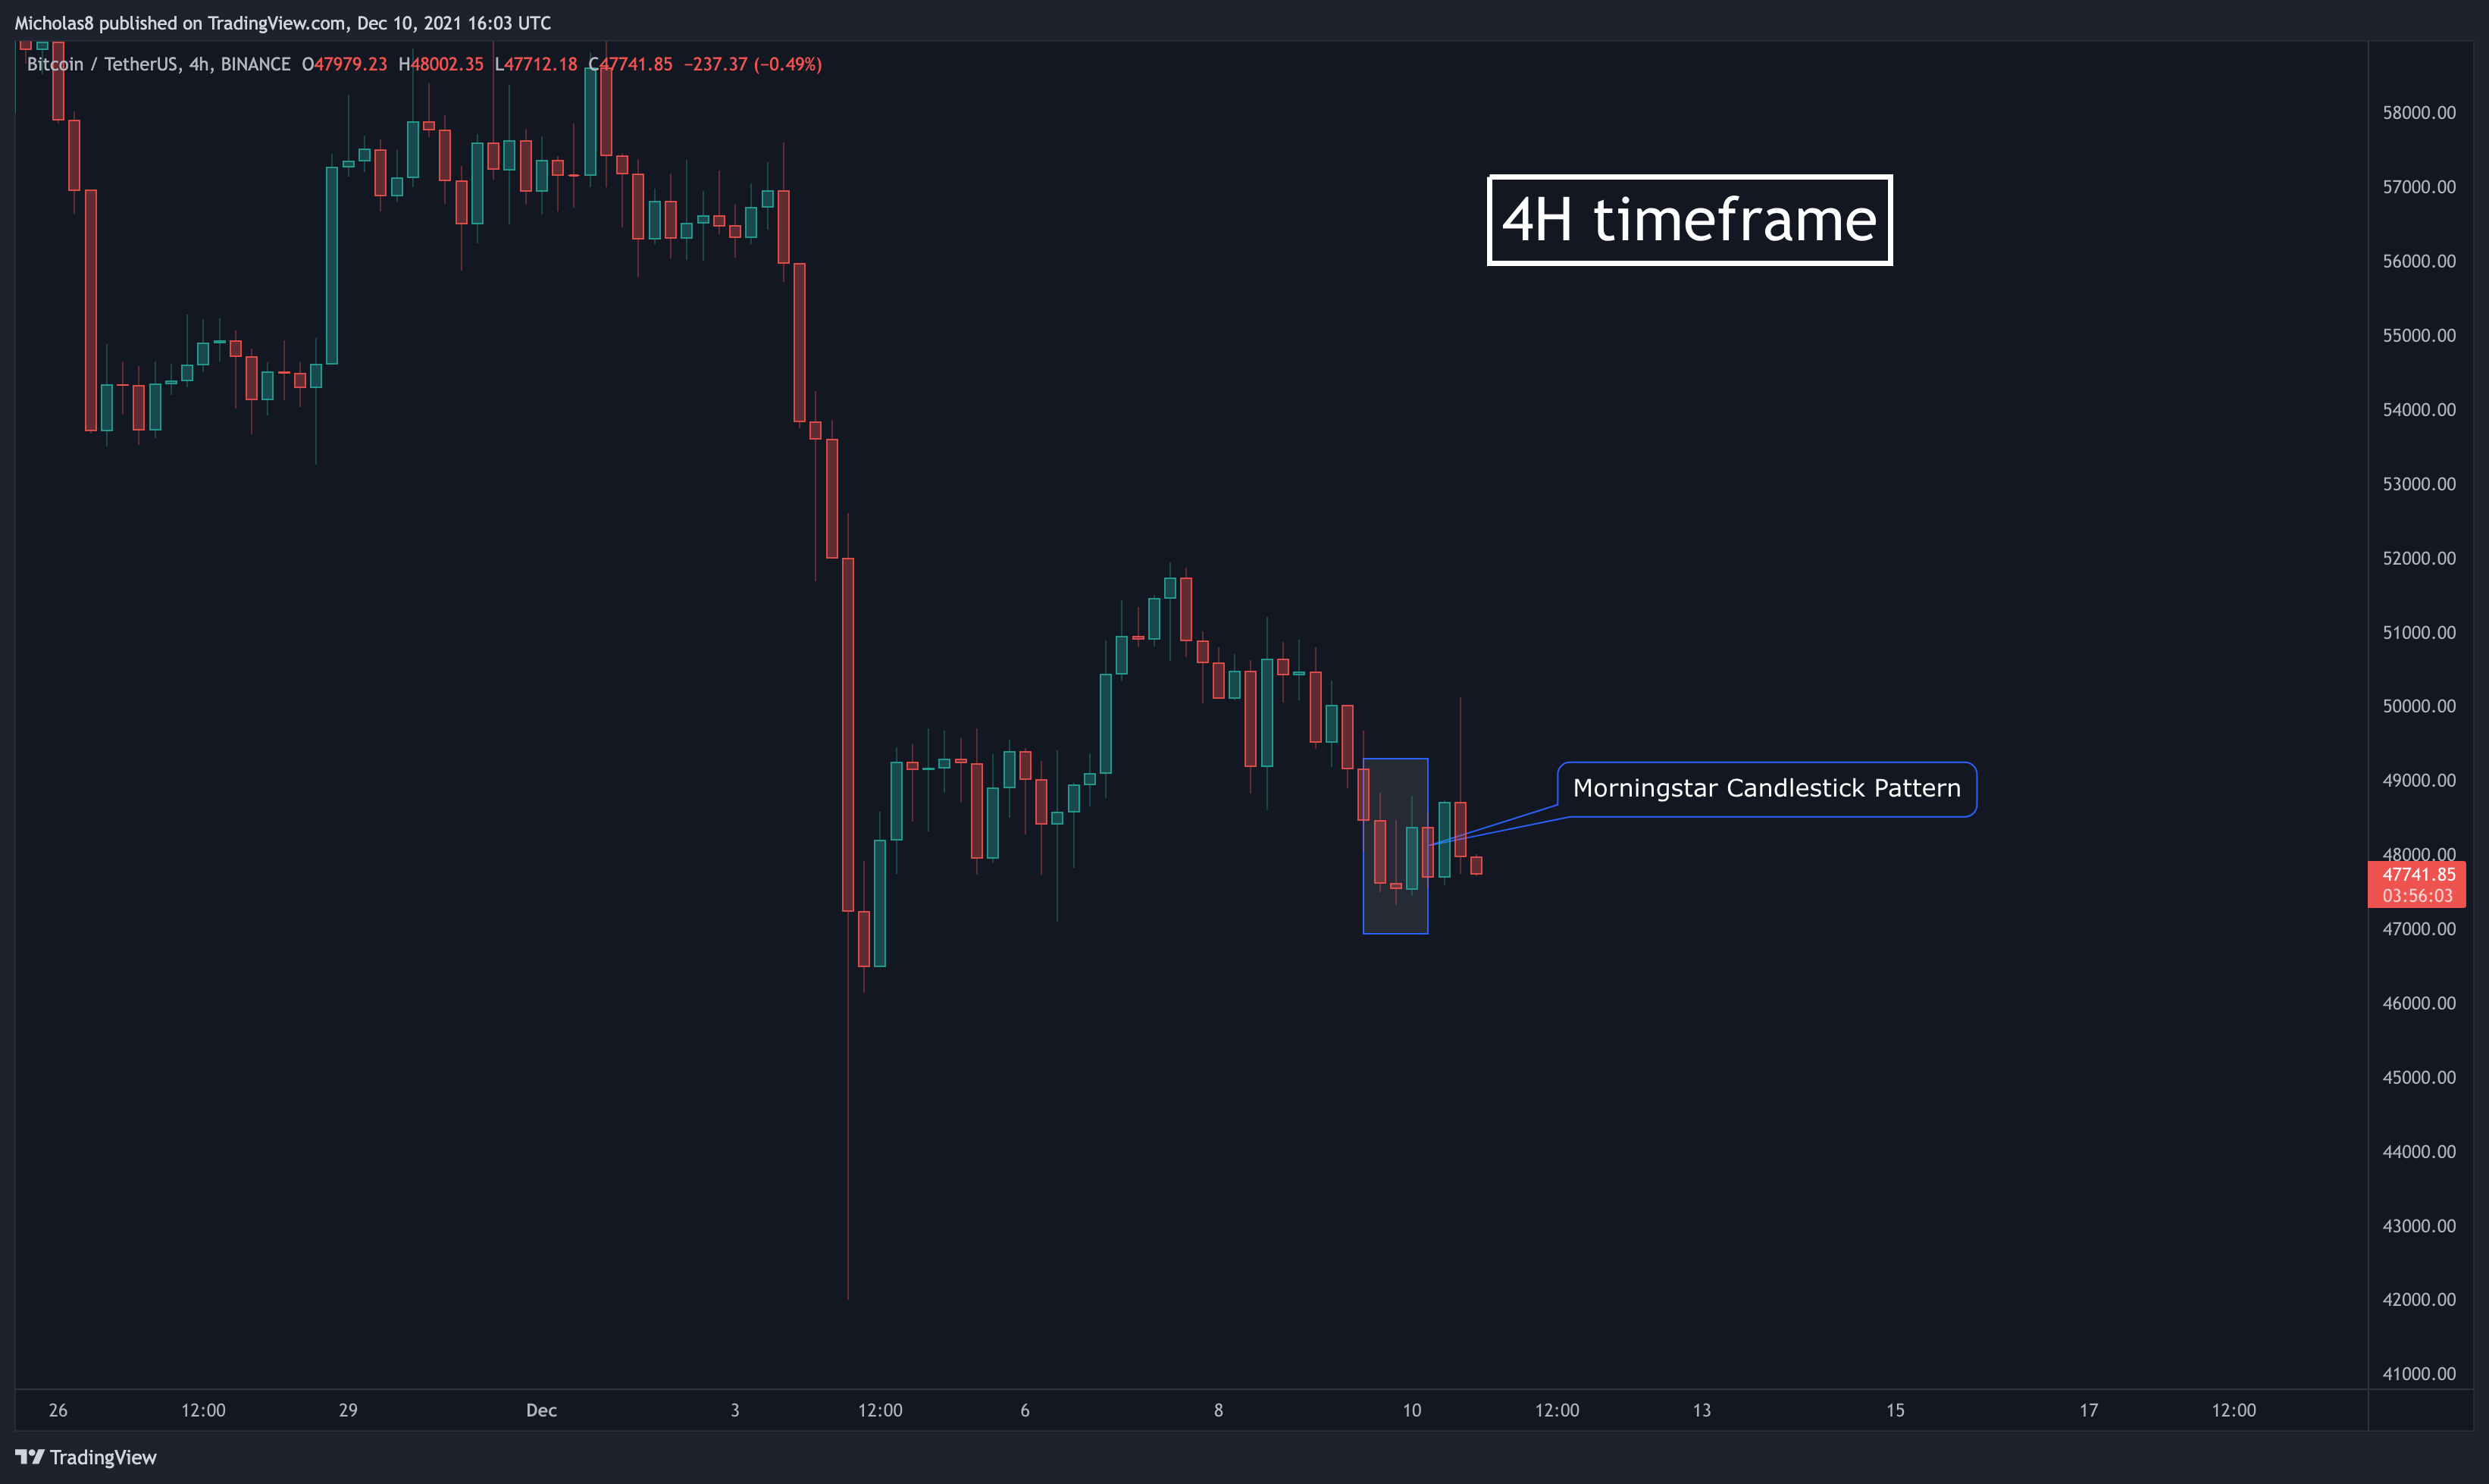
Last night, on Twitter and in the private Discord, I notified everyone of the Morningstar Candlestick Pattern (MCP) on the 4H timeframe which did have confluence with the 1H/4H bullish divergences. If you've been a subscriber for at least 2 months, you may remember the previous MCPs on the 1D timeframe. What was different about this one, was that it was on on a lower timeframe, implying a lower probability/significance. Nonetheless, we did see a rise. However, it just wasn't as significant.
Where did we see a rejection?
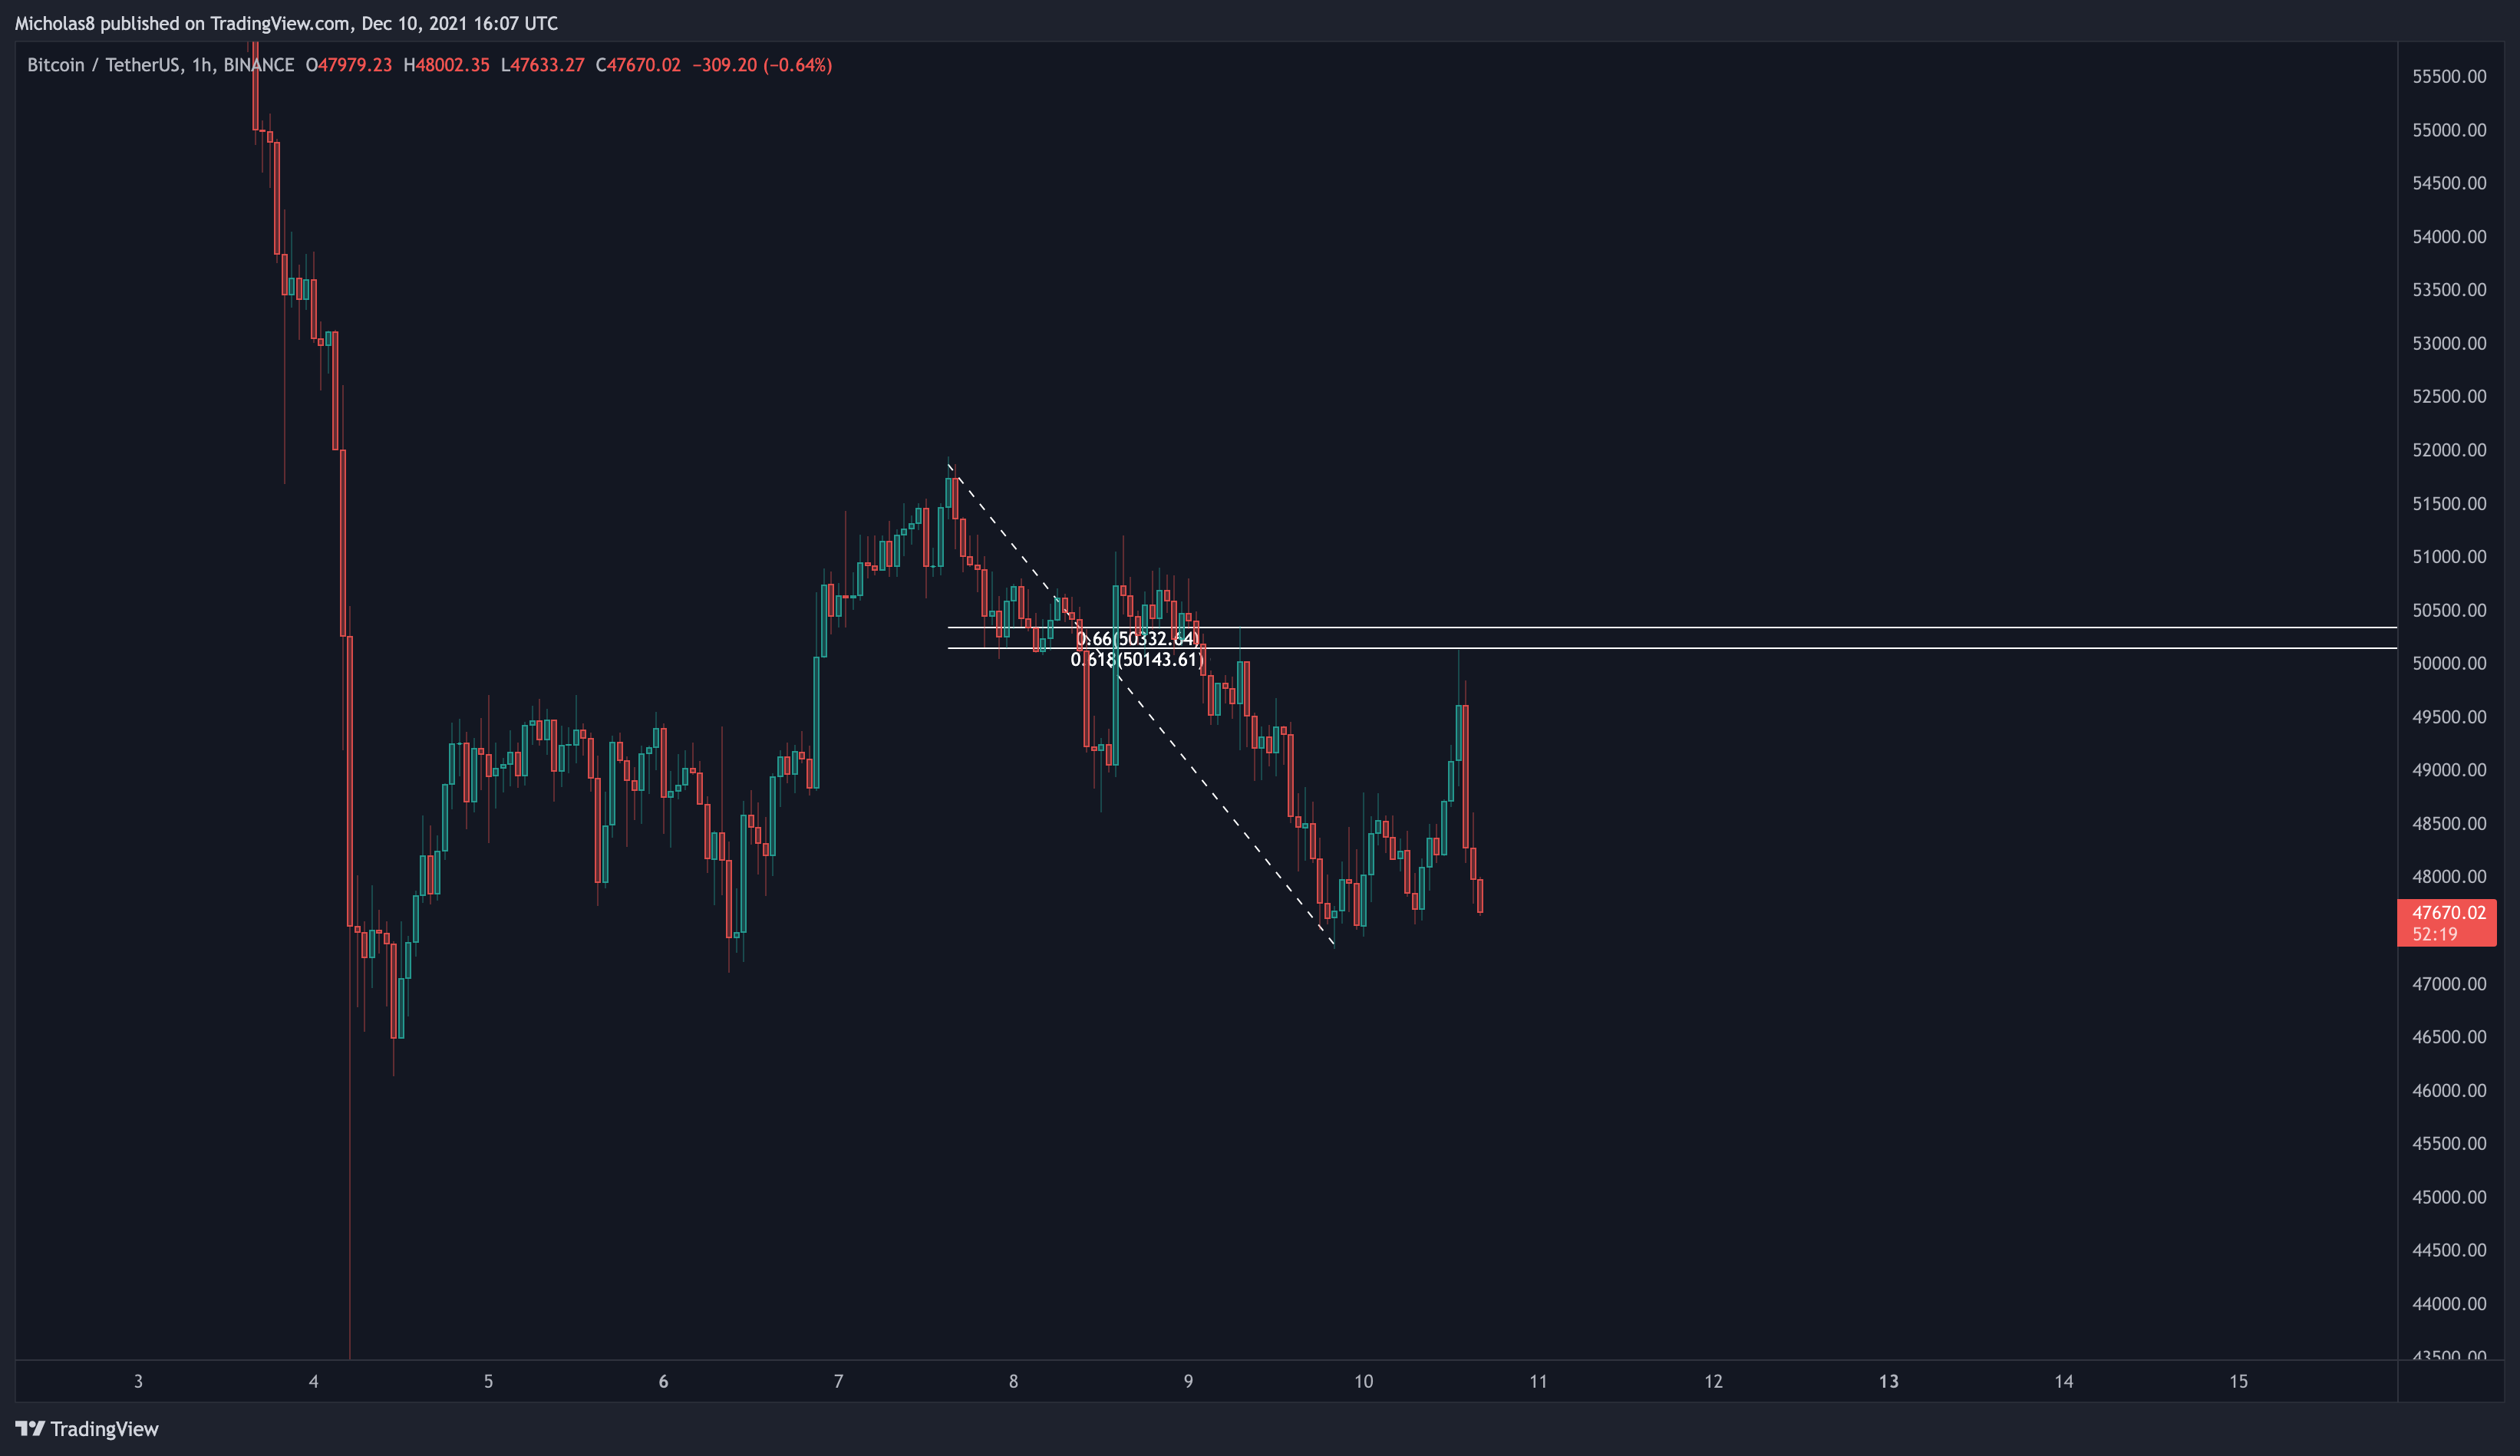
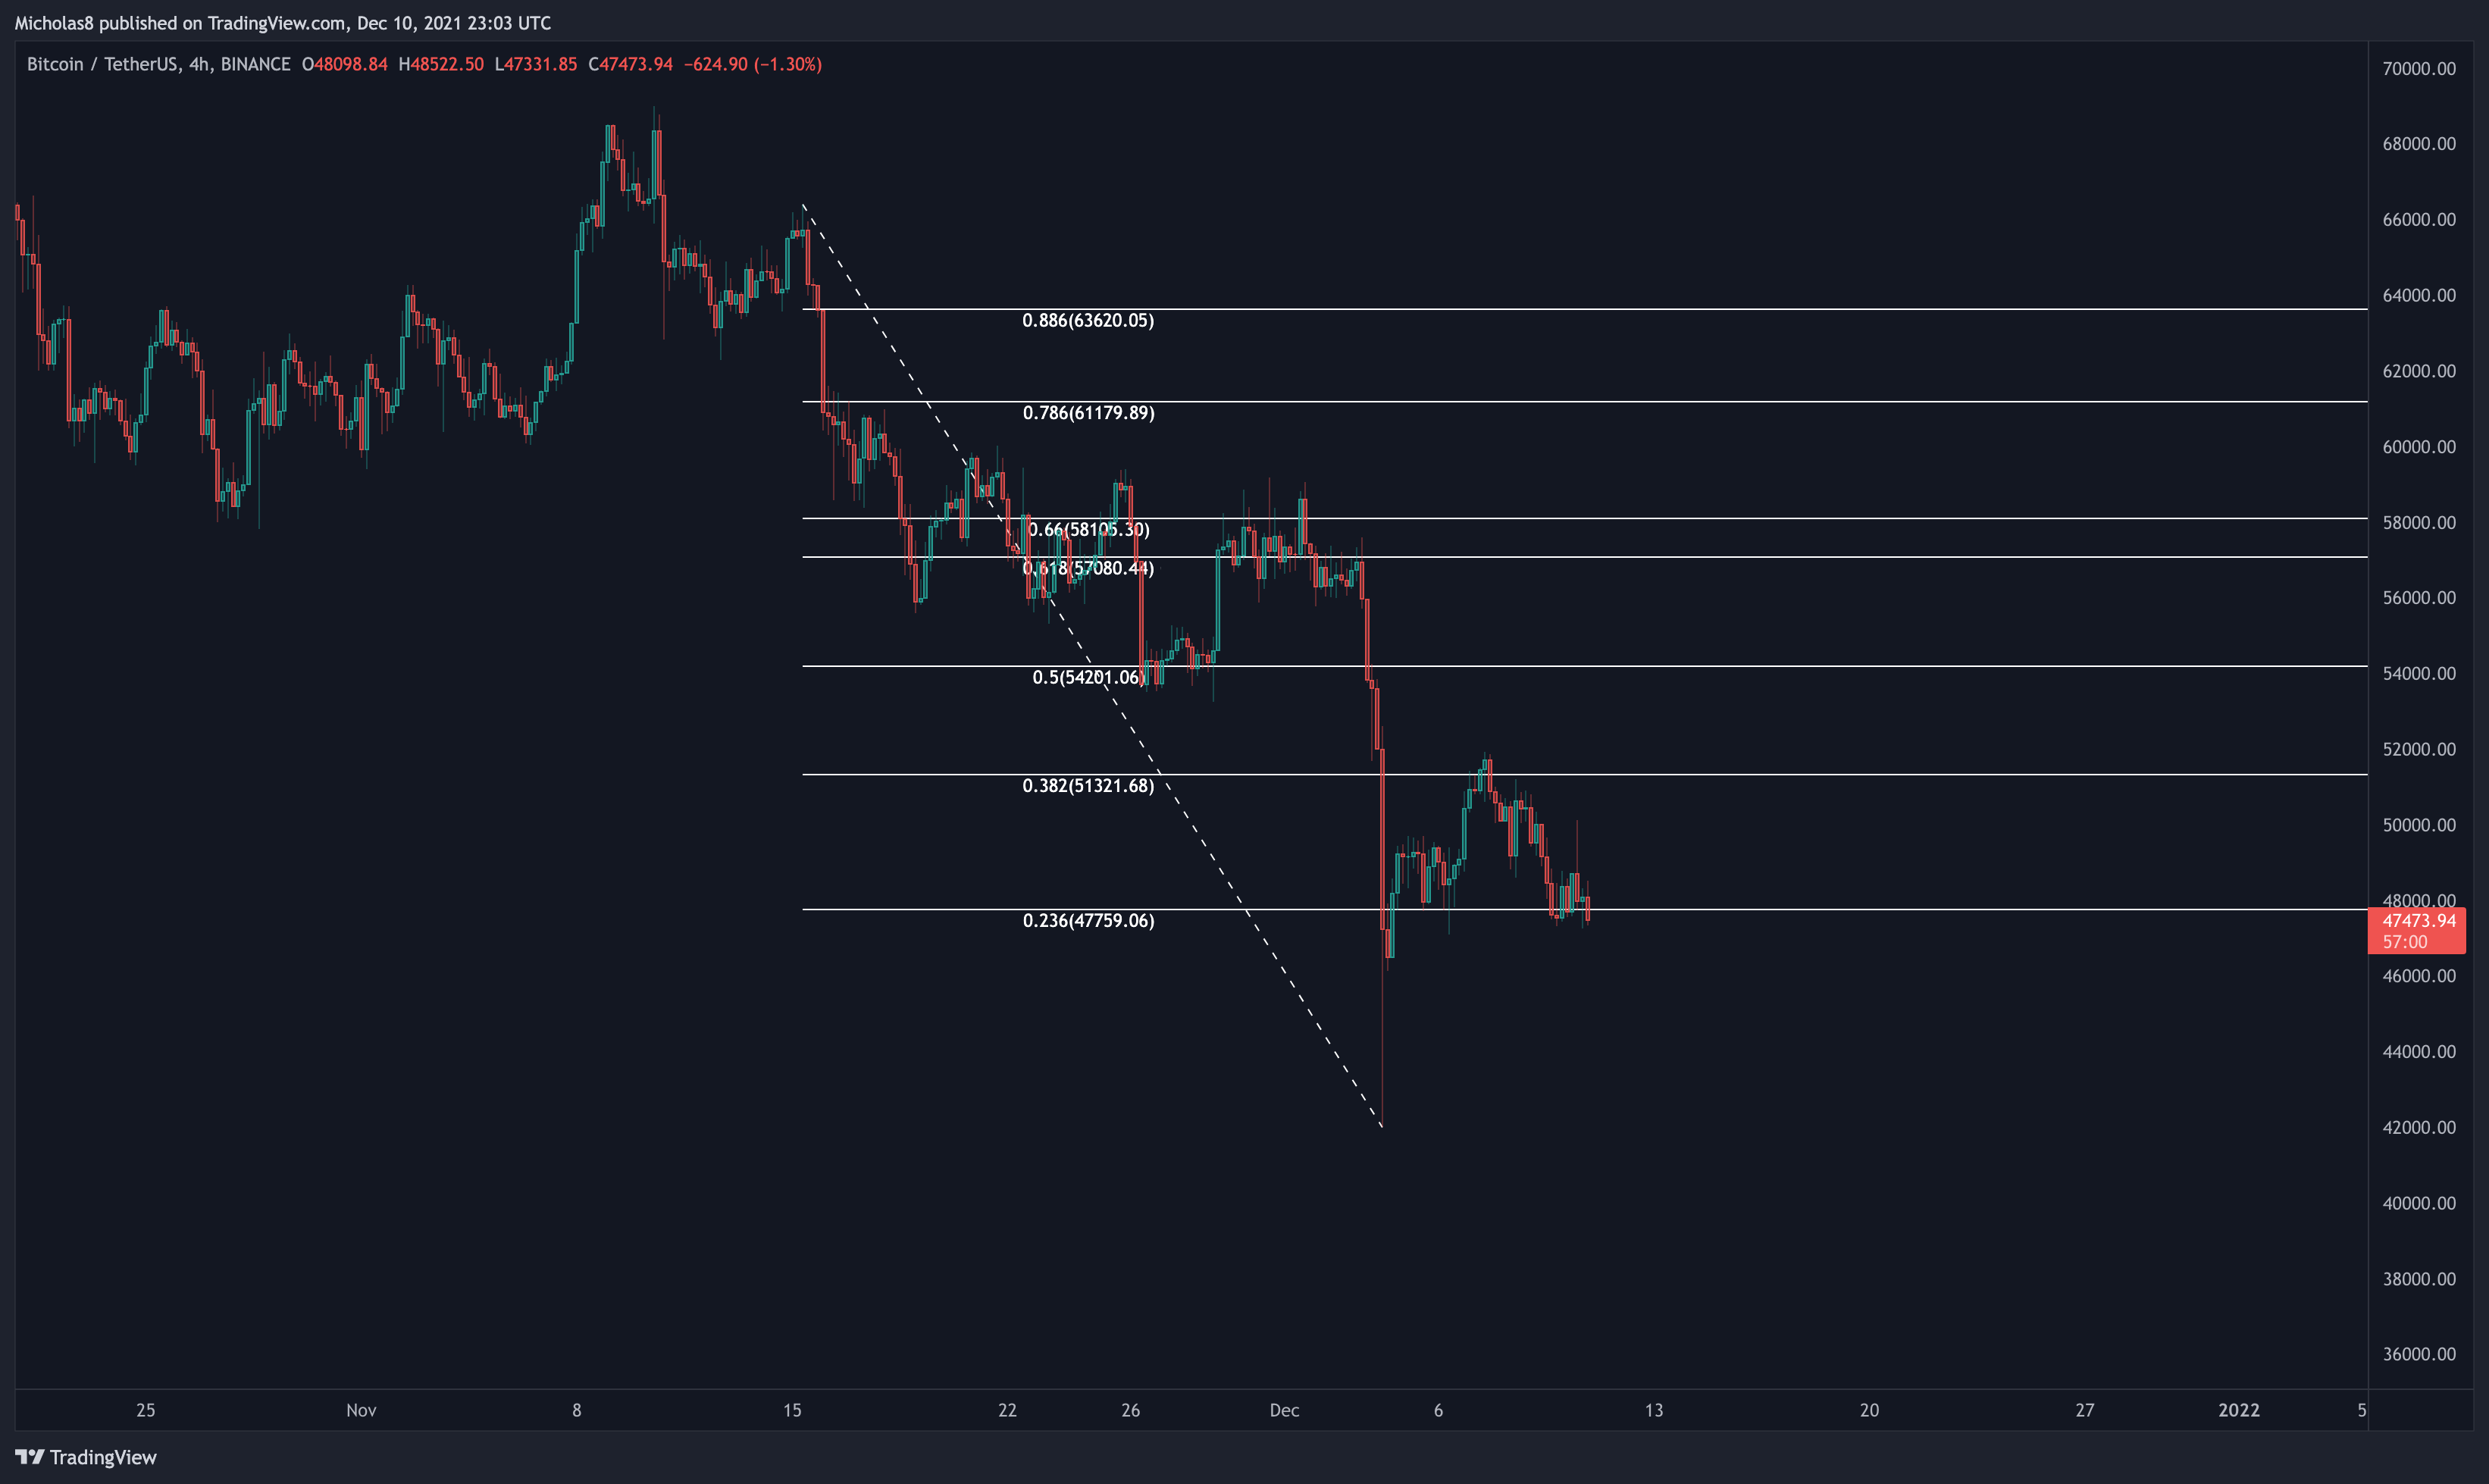
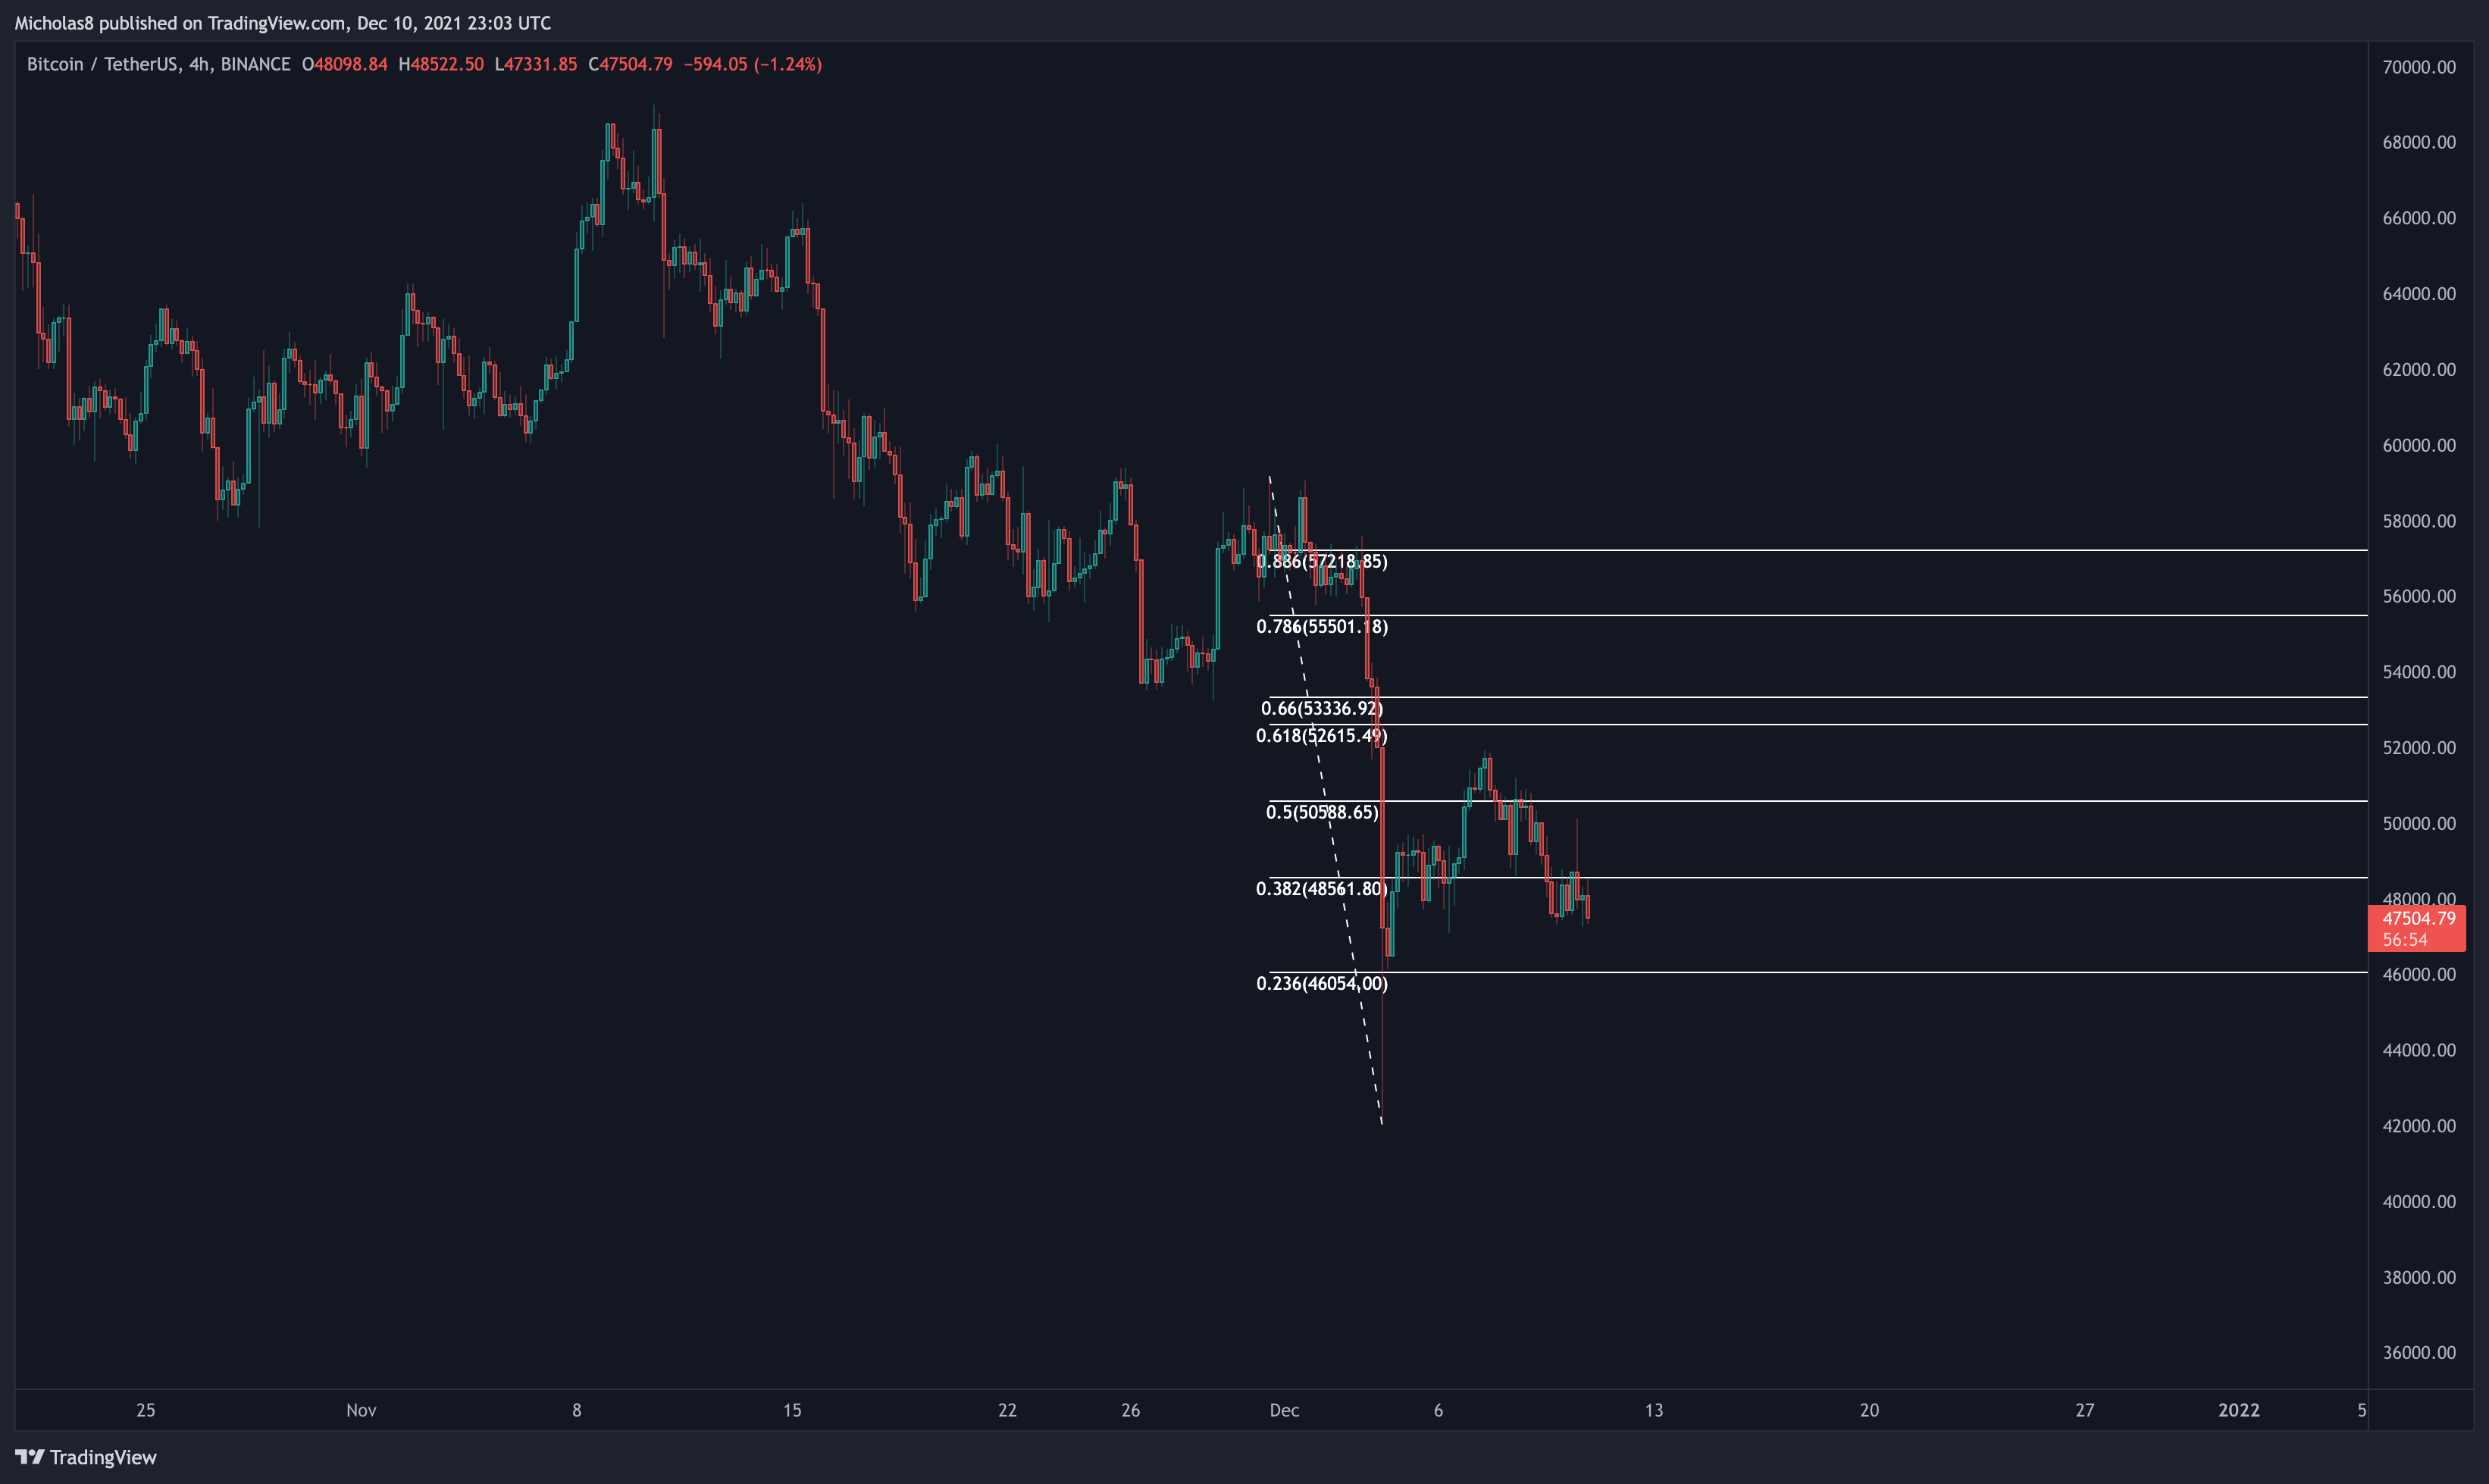
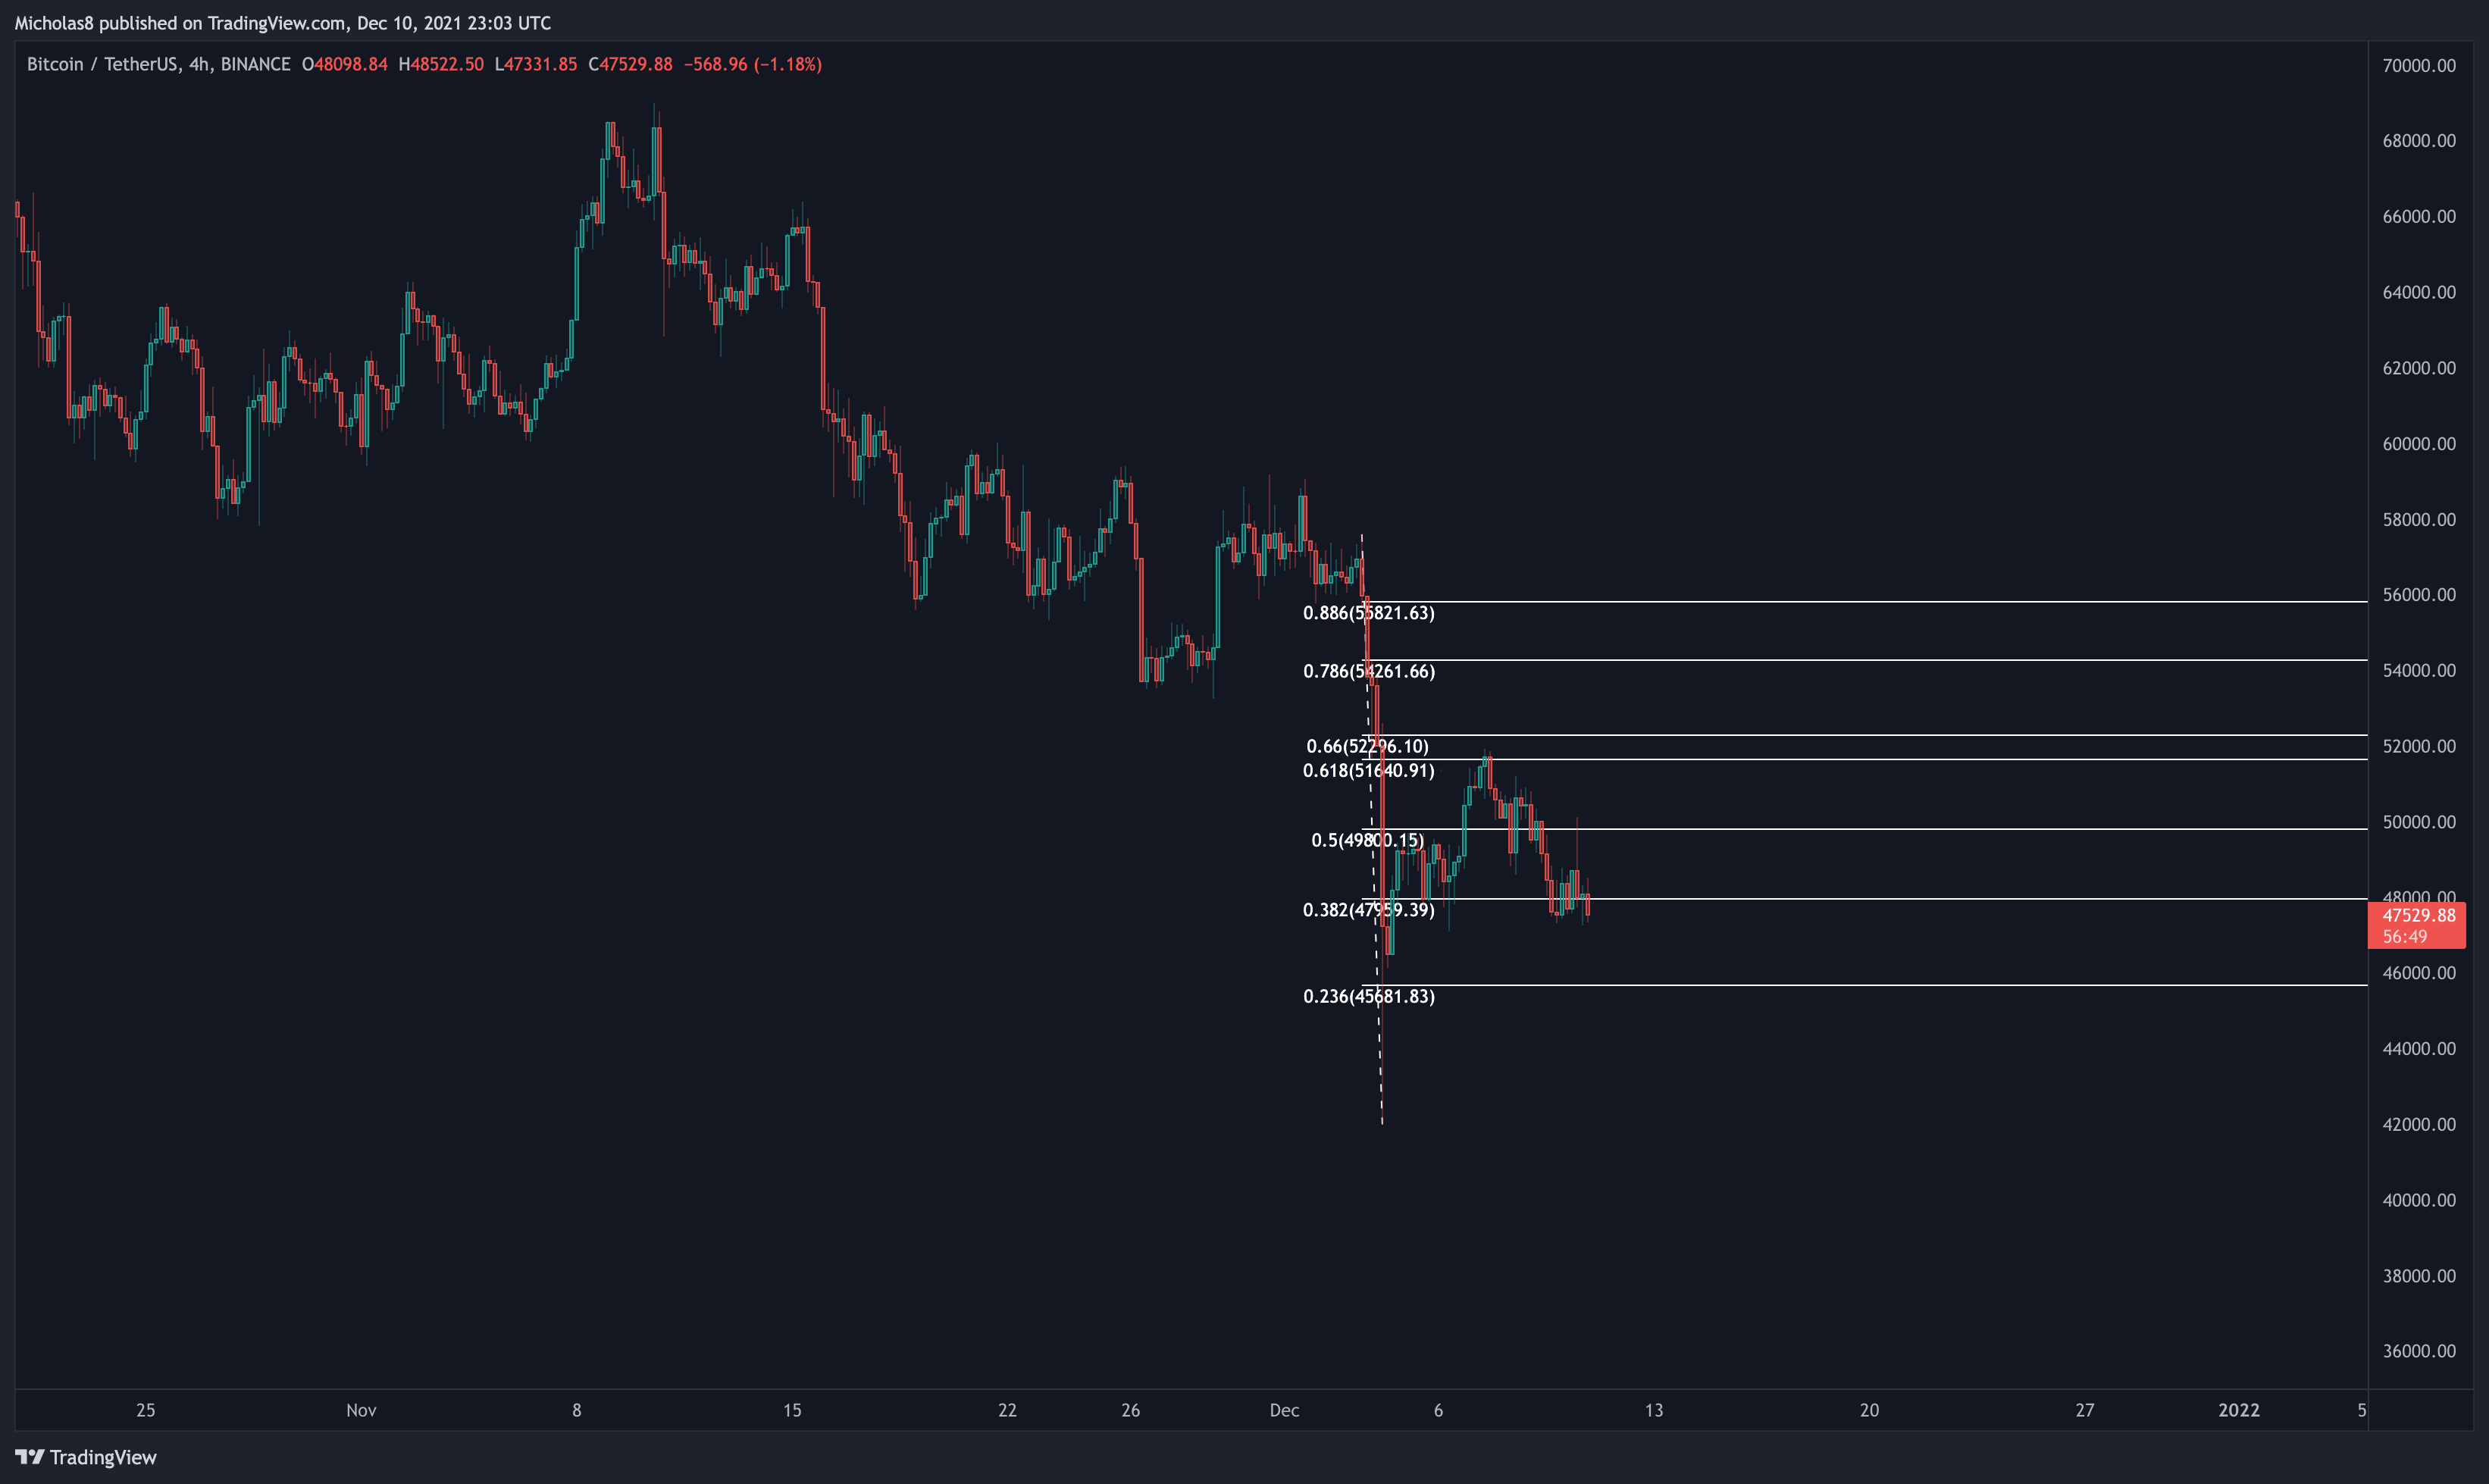
The rejection was seen at the Golden Pocket of the recent move down. In confluence, we did also have the 1H/4H hidden bearish divergences.
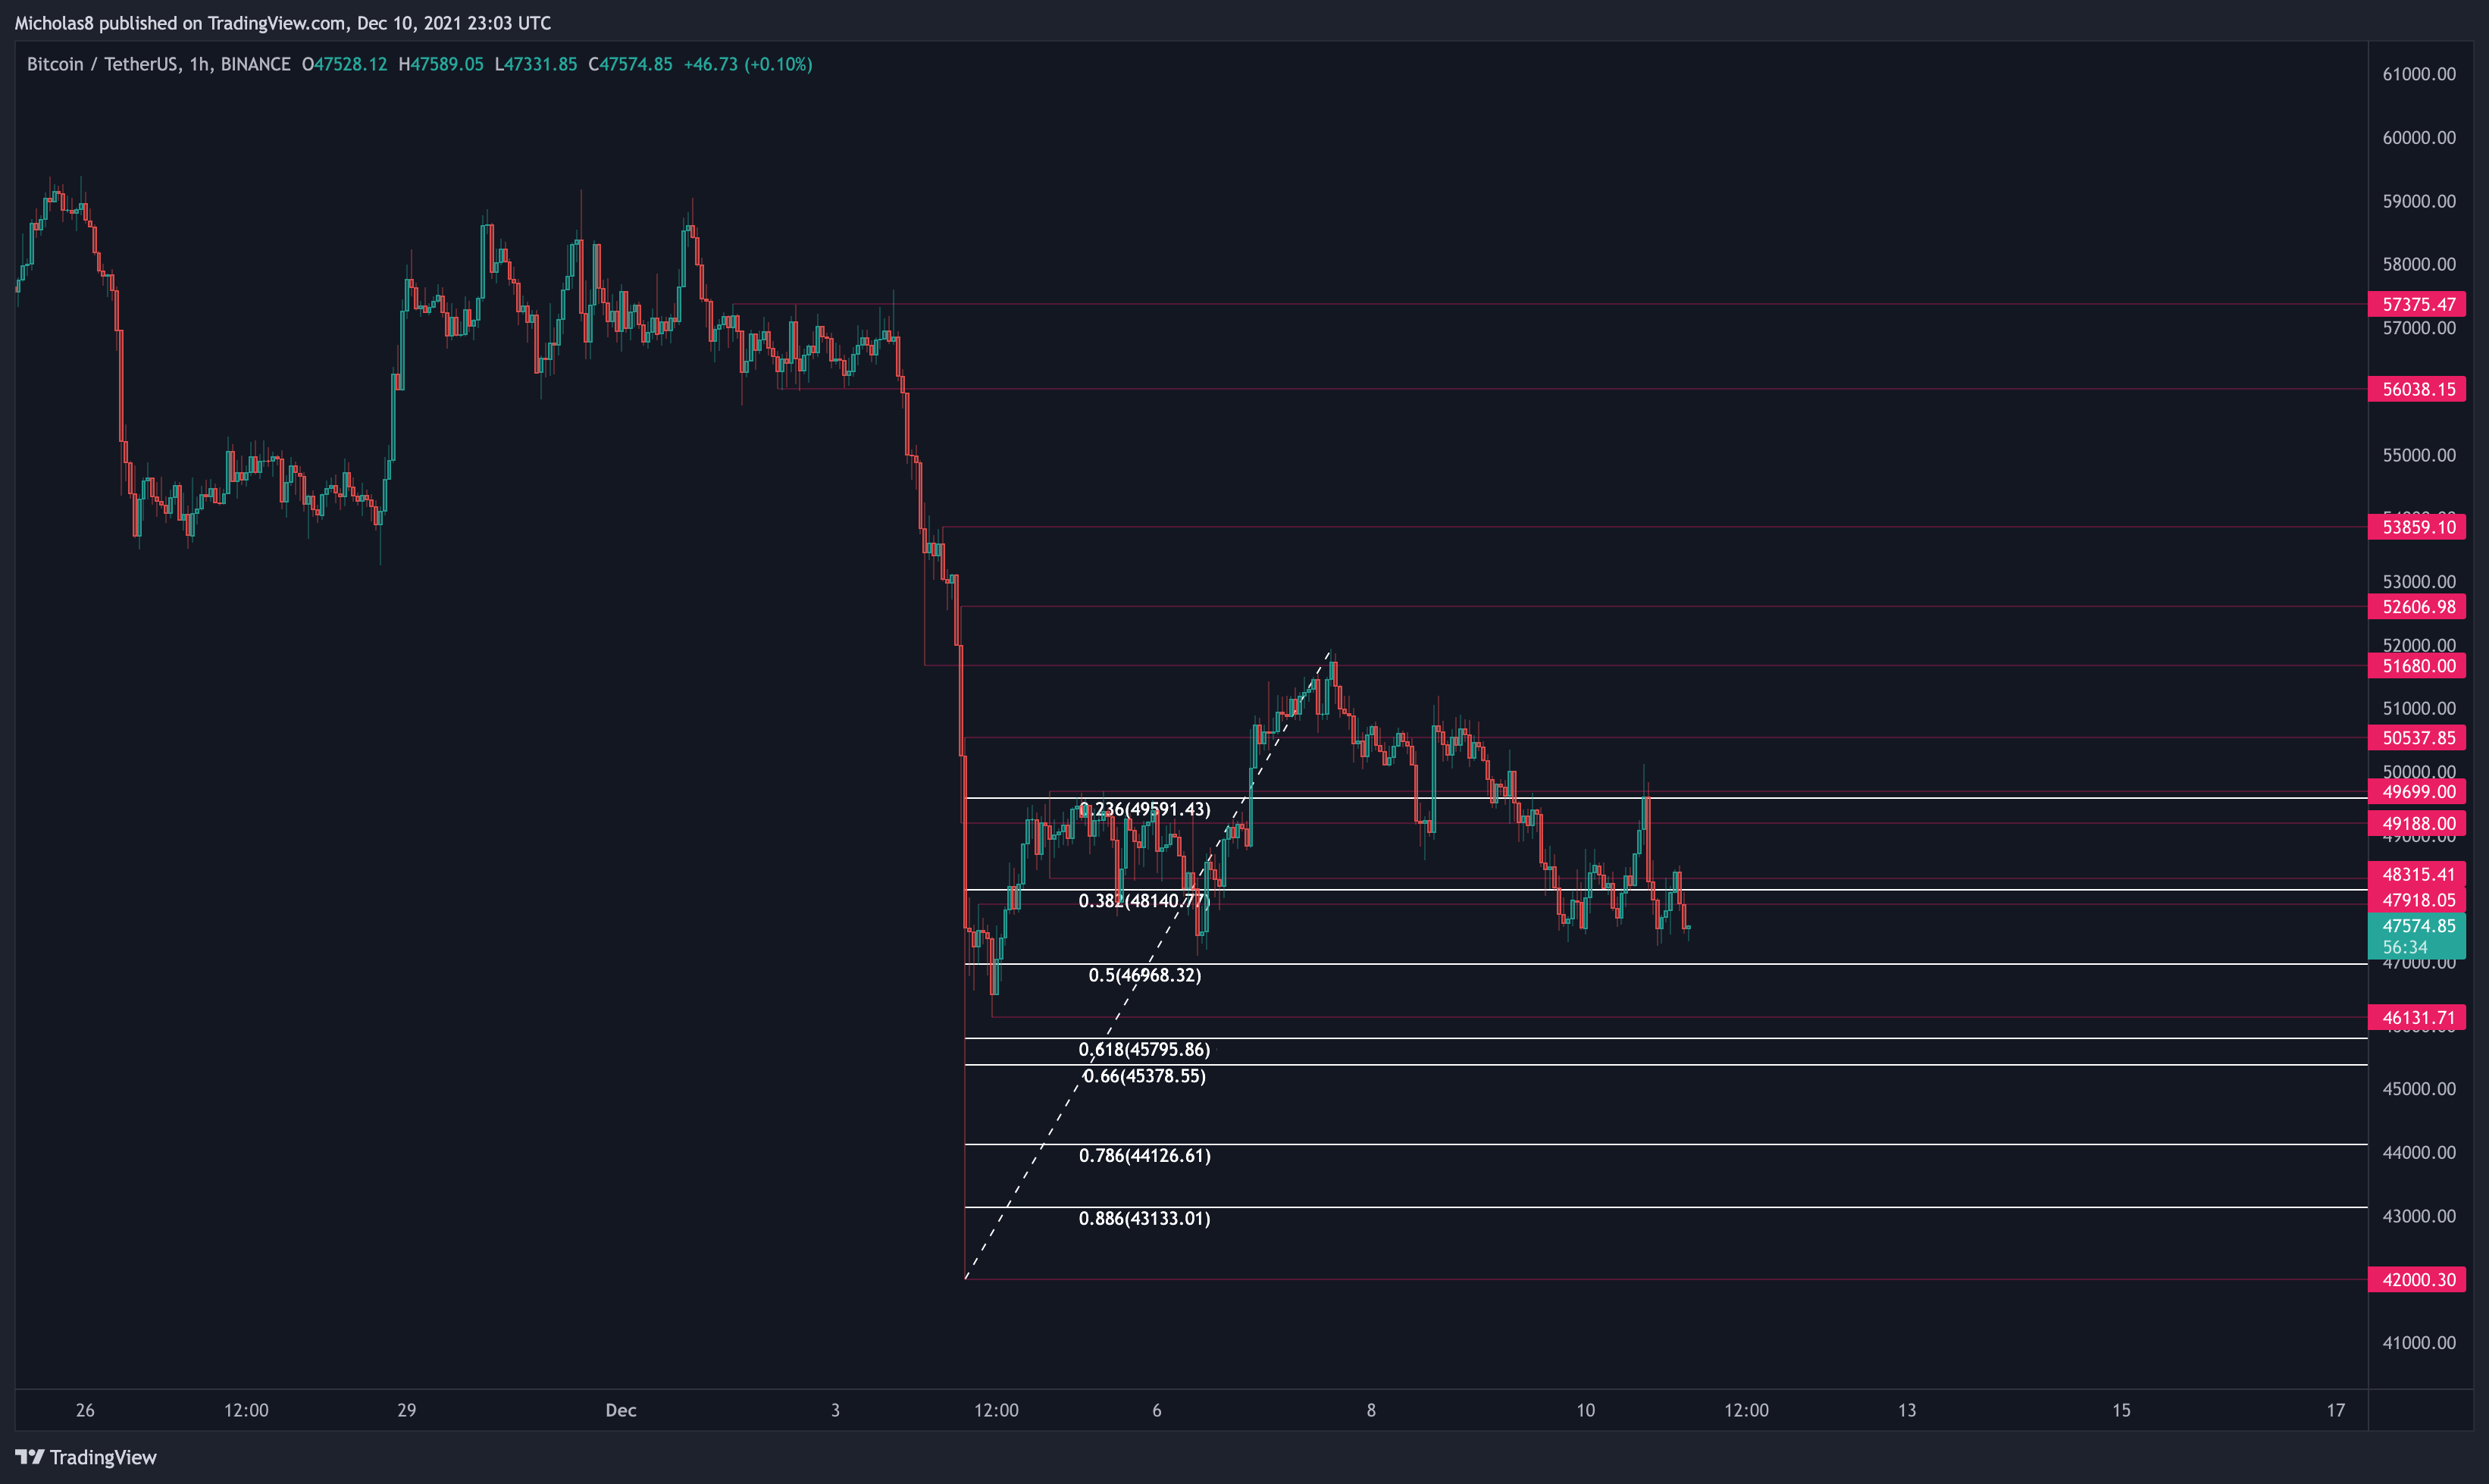
In the immediate short term, Bitcoin is in a consolidation structure. Currently, maintaining higher lows, but also lower highs. As long as Bitcoin can continue creating higher lows, it increases the probability to go on to create a higher high. But, if we start to lose the higher low structure, it's reasonable to consider the PA as bearish on the LTFs.
Moving forward, we have our levels above us and below us to keep an eye on.
All in all, it's important to keep in mind that there's still the possibility that this is/was a dead cat bounce if we continue up much higher than here given that we have the 4H hidden bearish divergence still in play. And as we're right now in the middle of a move, we'll have to wait to see where we end up before coming to any additional conclusions.
_
TONIGHT
The Good
Trading above the Daily LQZ 1/2
Holding the 200 1D SMA as support
1D Hidden Bullish Divergence
1D Bullish Divergence
Holding the 1W EMA Ribbon
Holding the 50W SMA
CME Gap at 53,665
Bullish Market Structure (1D timeframe)
1H Regular Bullish Divergence
_
The Bad
1W Bearish Divergence
1M Bearish Divergence
Bullish Exhaustion
Lost the 1H/4H/1D EMA Ribbons
Lost the 8/21/50/200-day EMAs and the 20/50/100-day SMAs
Lost the 20/50/200 4H SMAs
Lost Daily LQZ 3
Lost the 4H LQZ 1
Volume Analysis
Bearish NVT
Bearish DMI
Rejected from the Bitcoin Logarithmic Curve Median Line
20/50-day SMA Death Cross
21/50-day EMA Death Cross
20/100-day SMA Death Cross
8/200-day EMA Death Cross
Bearish Market Structure (4H timeframe)
Lost the Bull Market Support Band
Lost the 20W SMA
Lost the 8/13/21W EMAs
4H Hidden Bearish Divergence
Descending Triangle
_
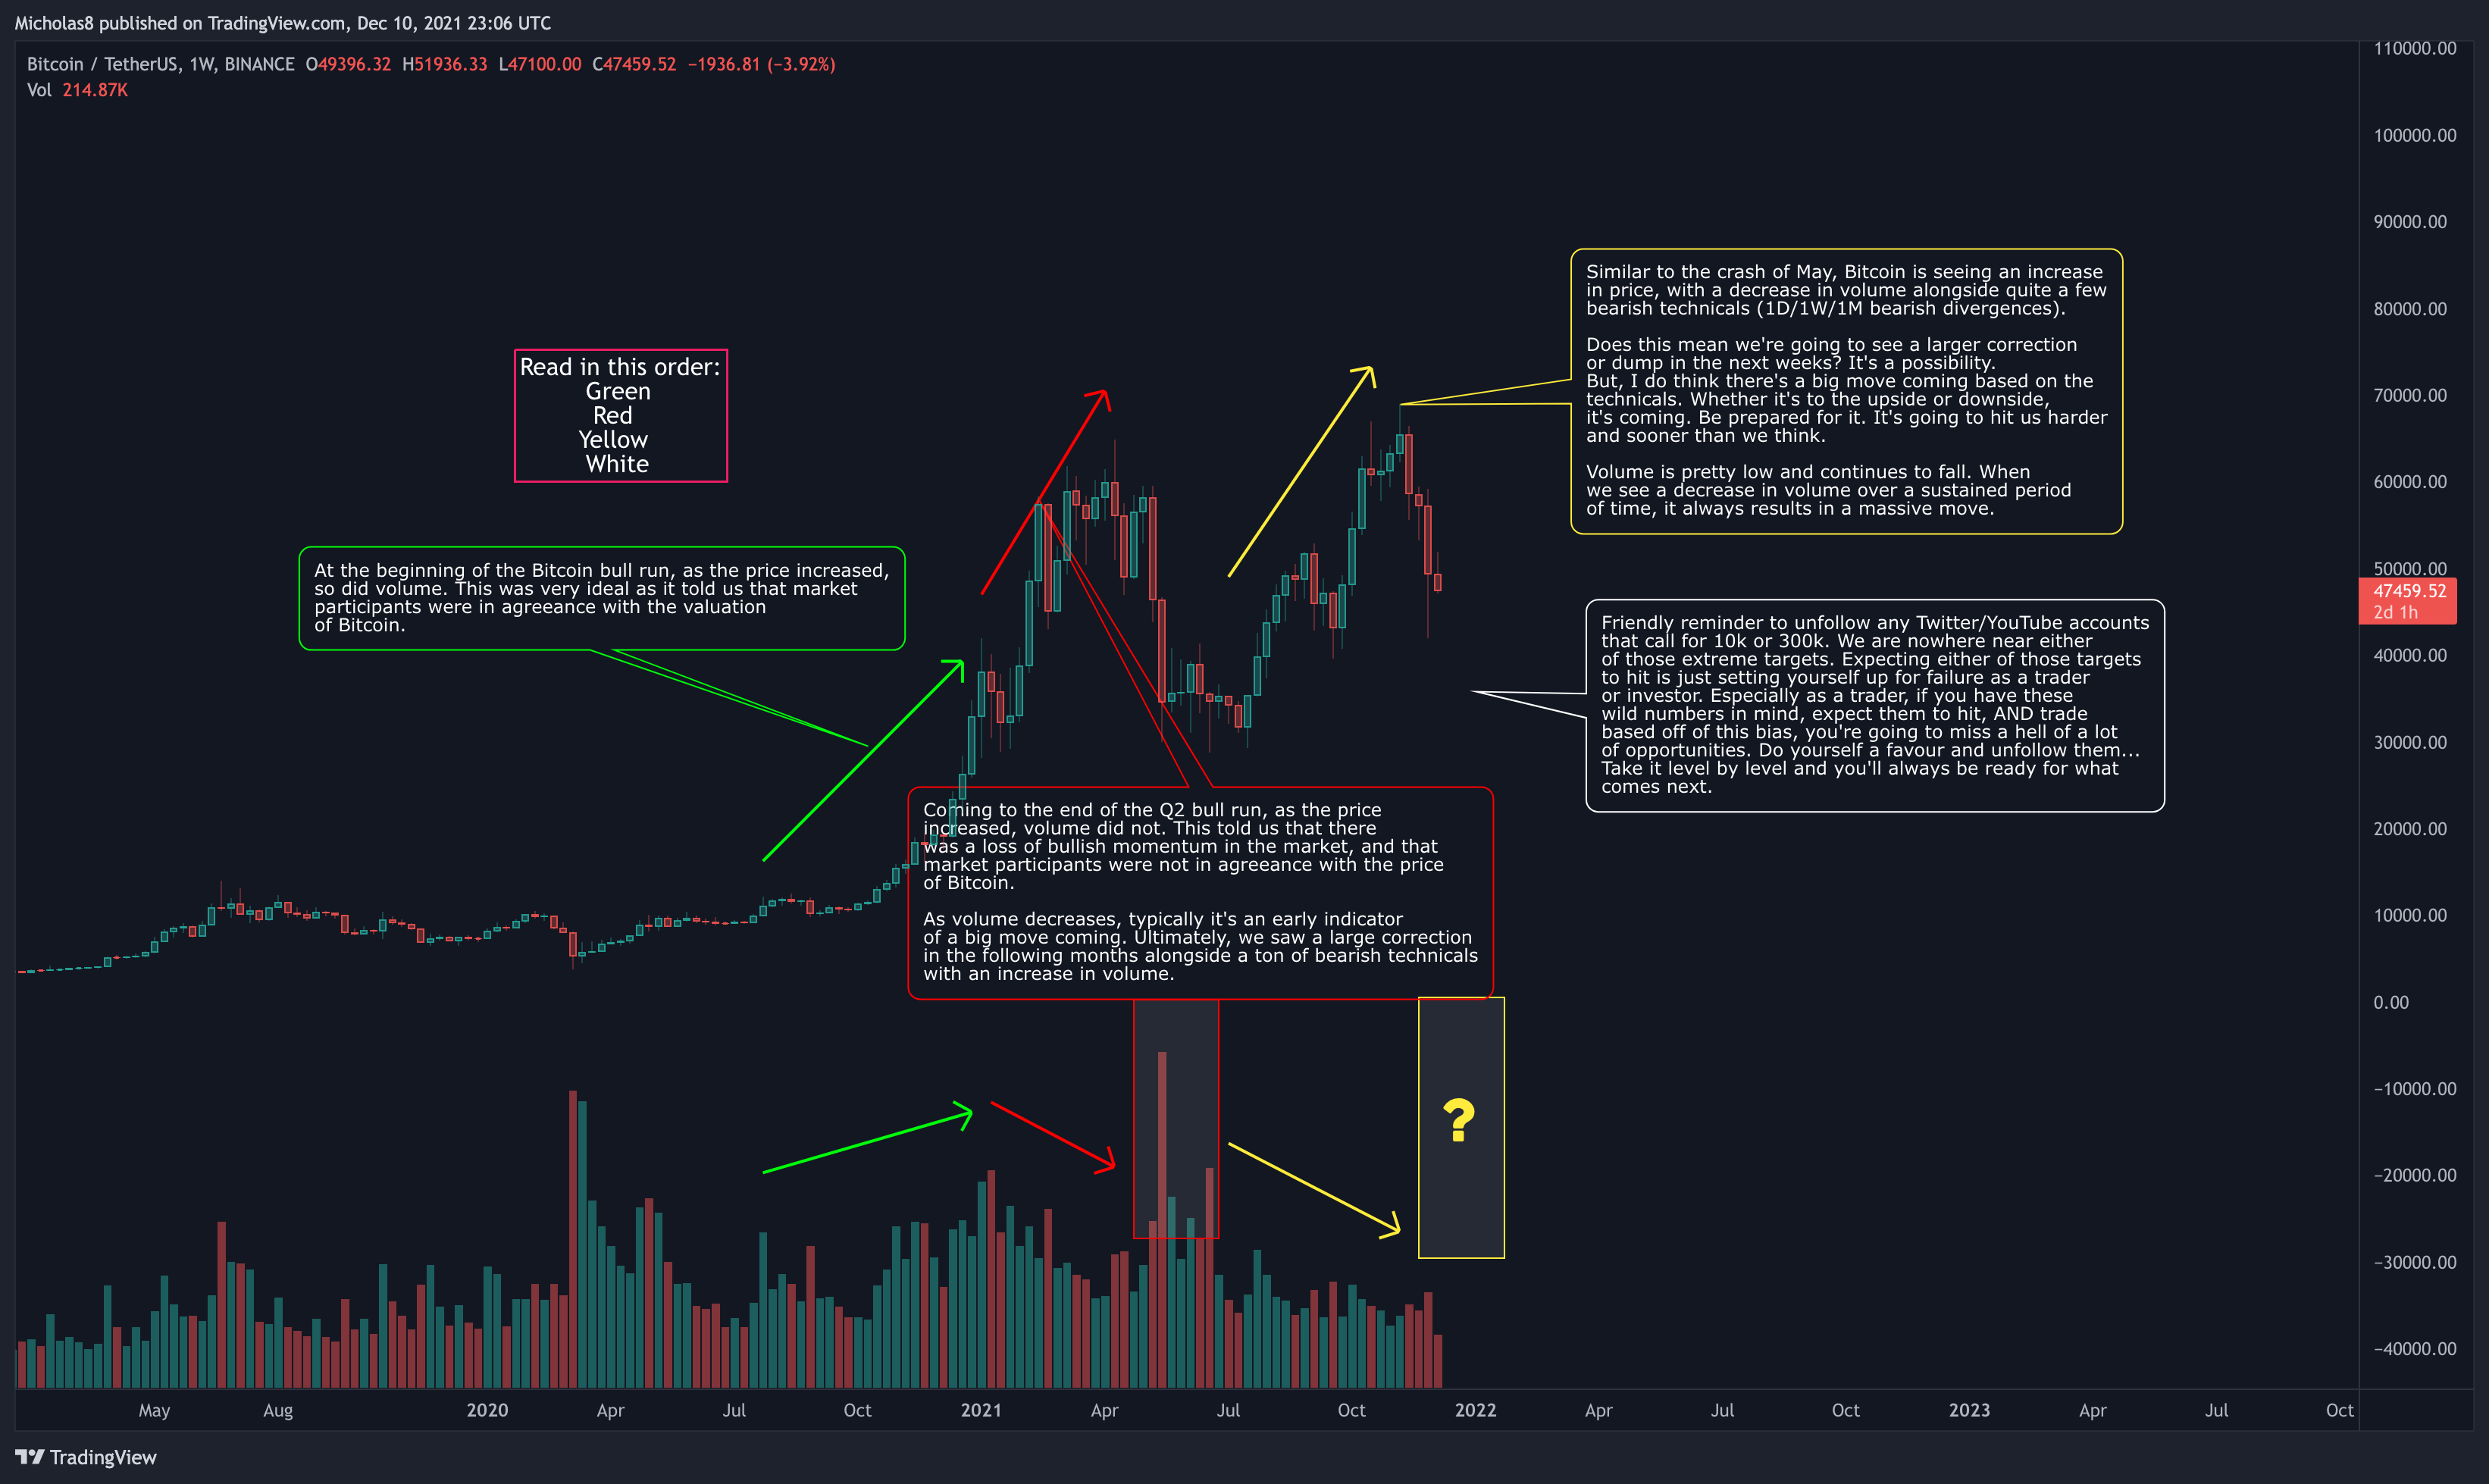
This Macro Volume Analysis still stands.
_
After a fairly volatile day, Bitcoin is essentially exactly where it was at the daily open.
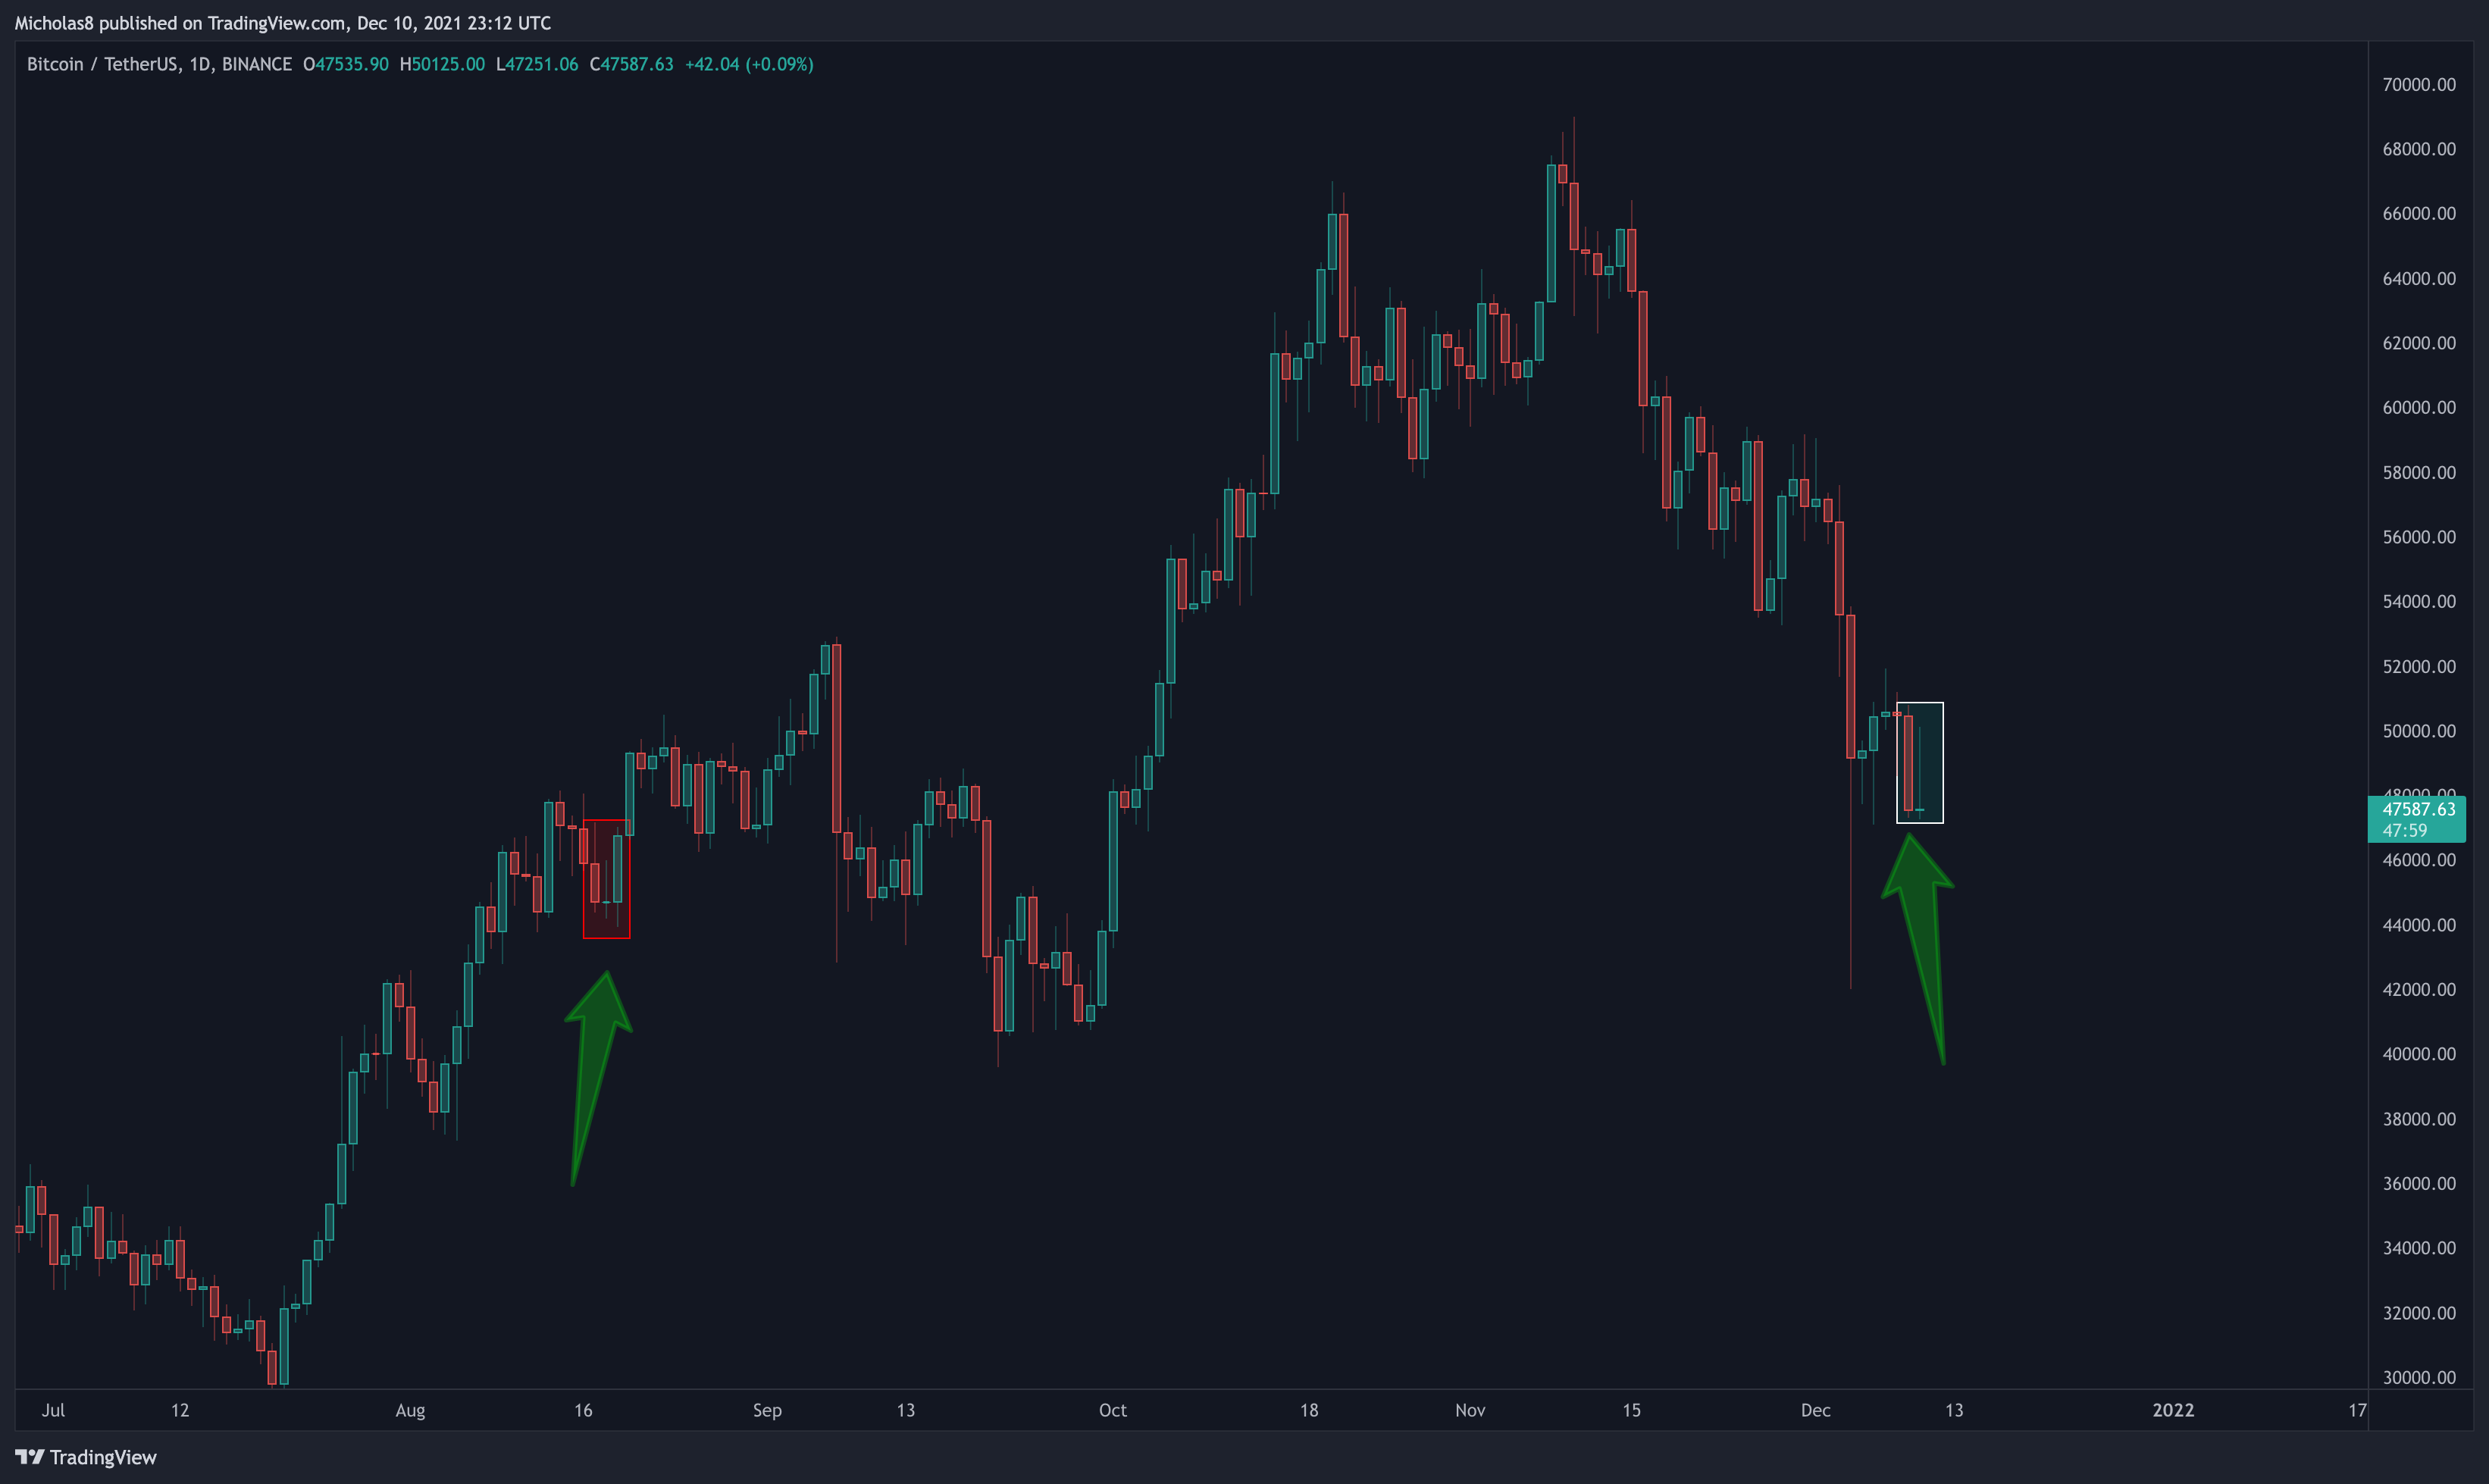
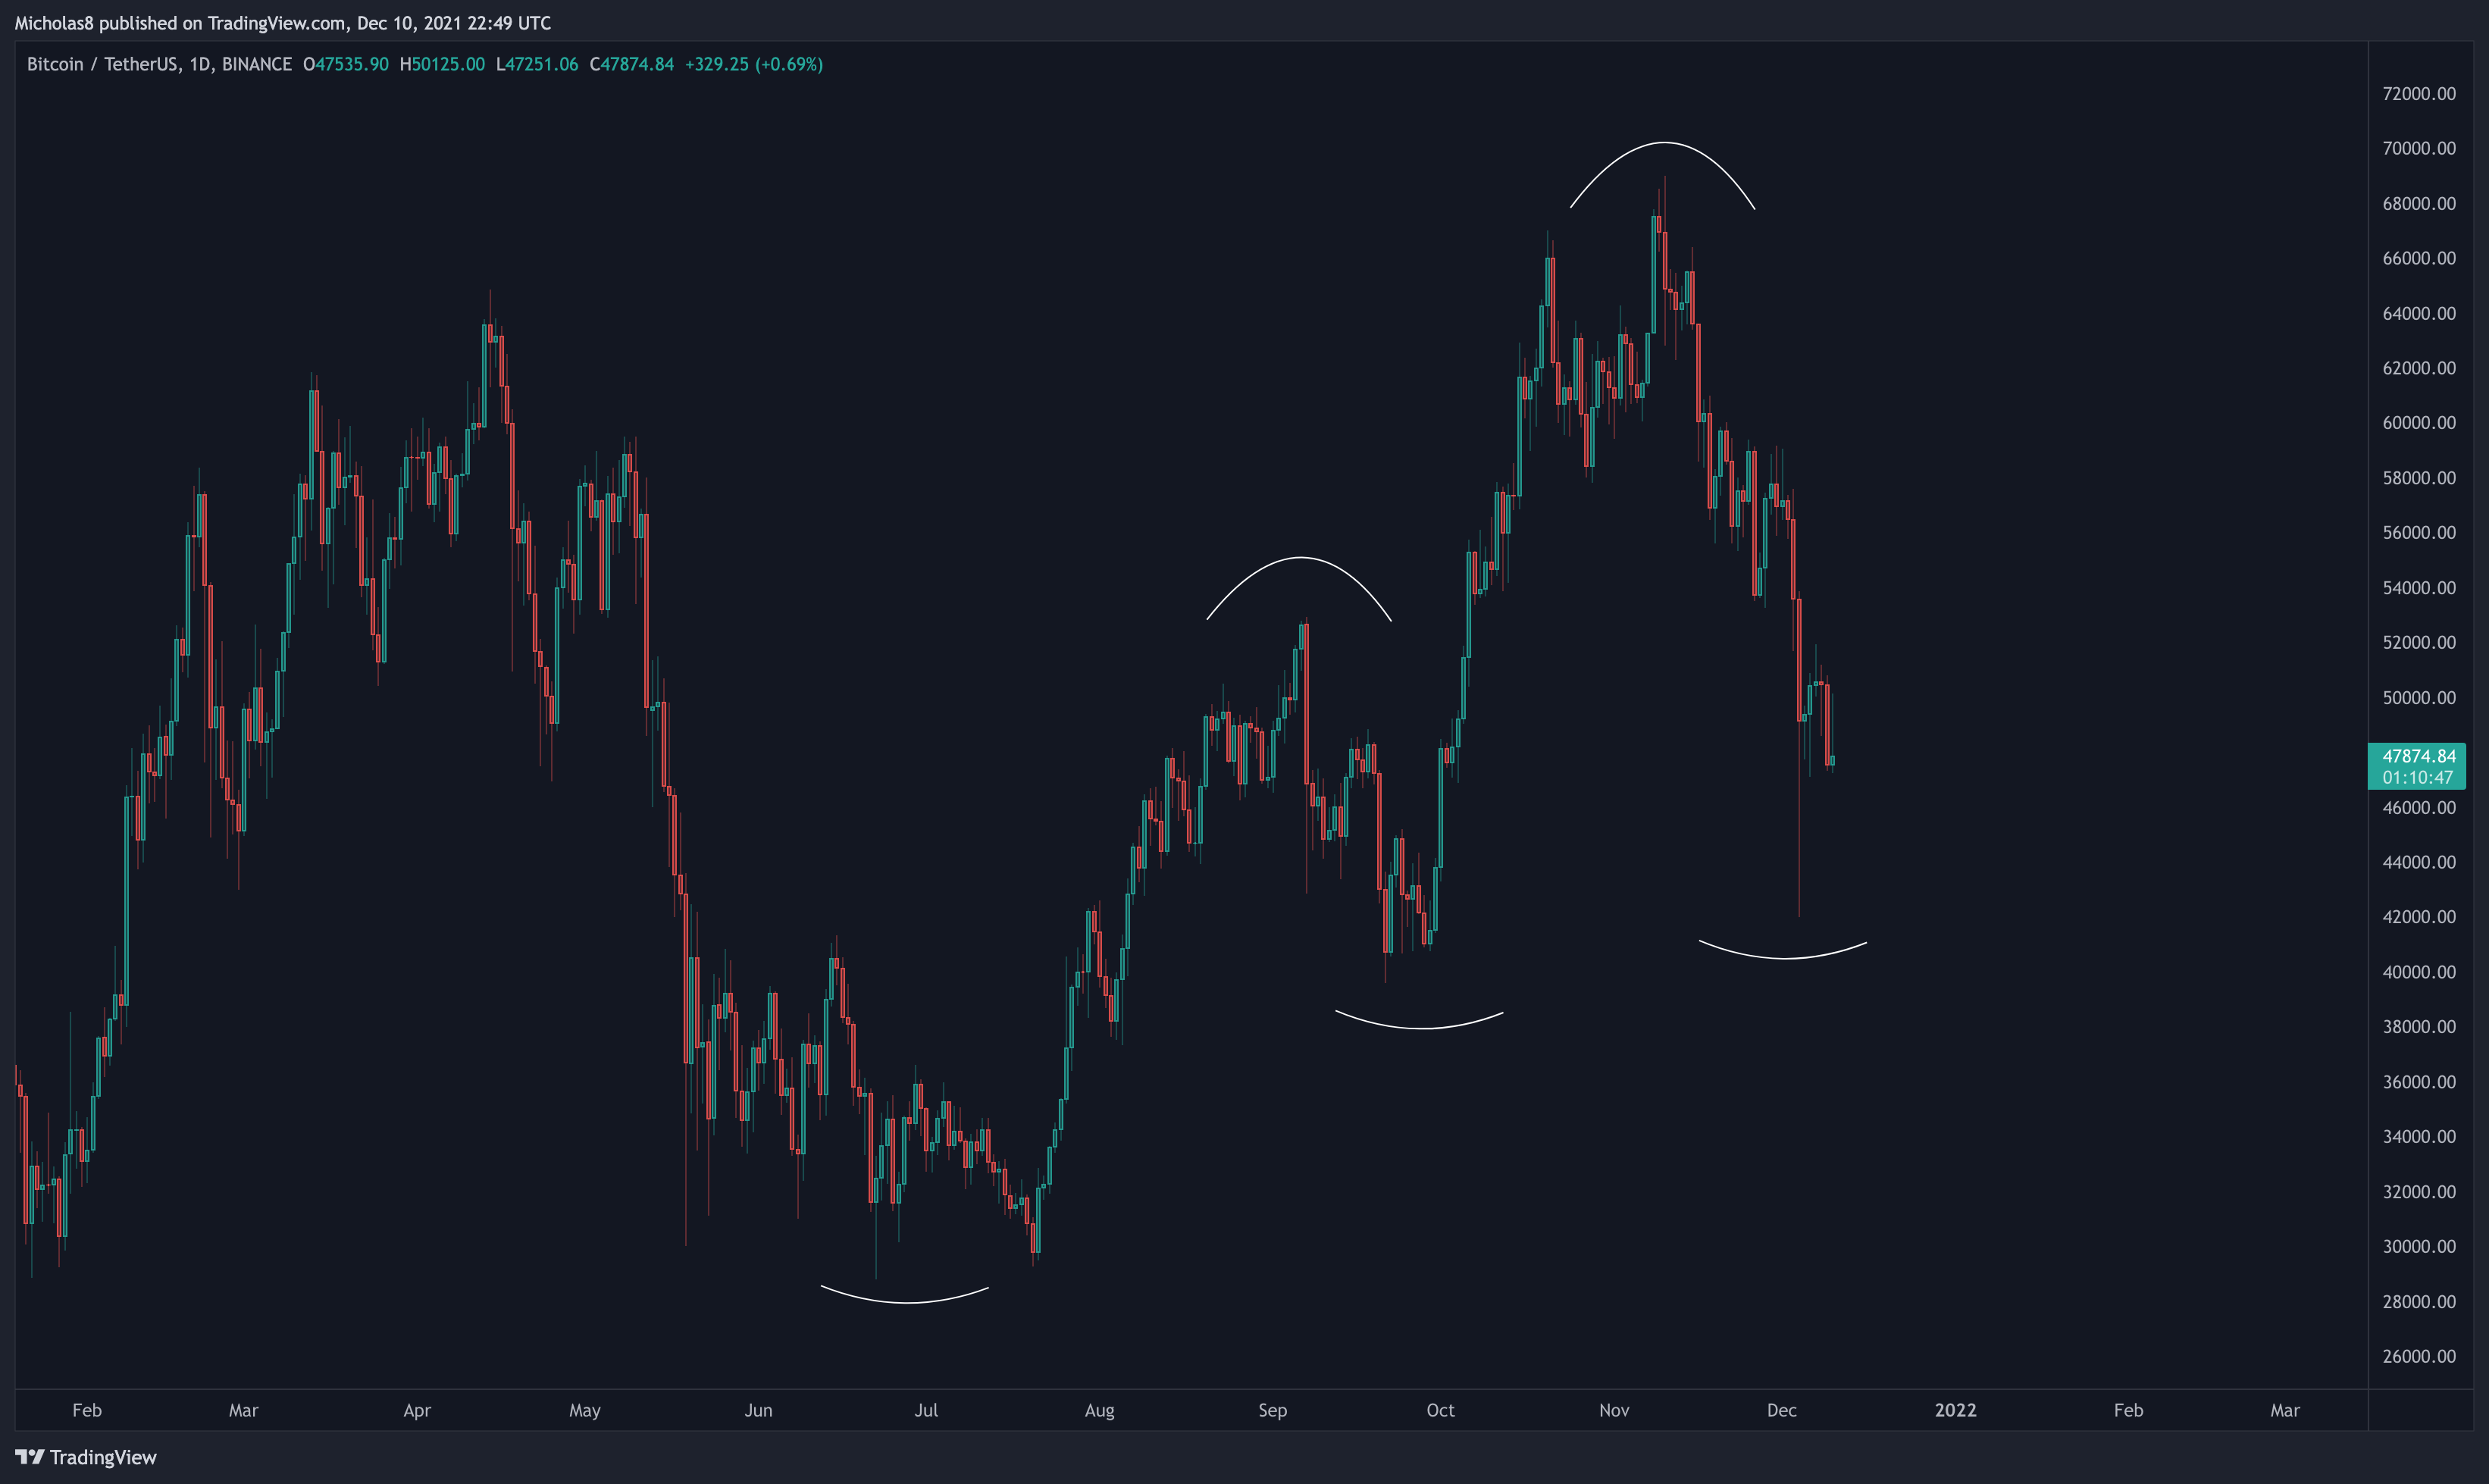
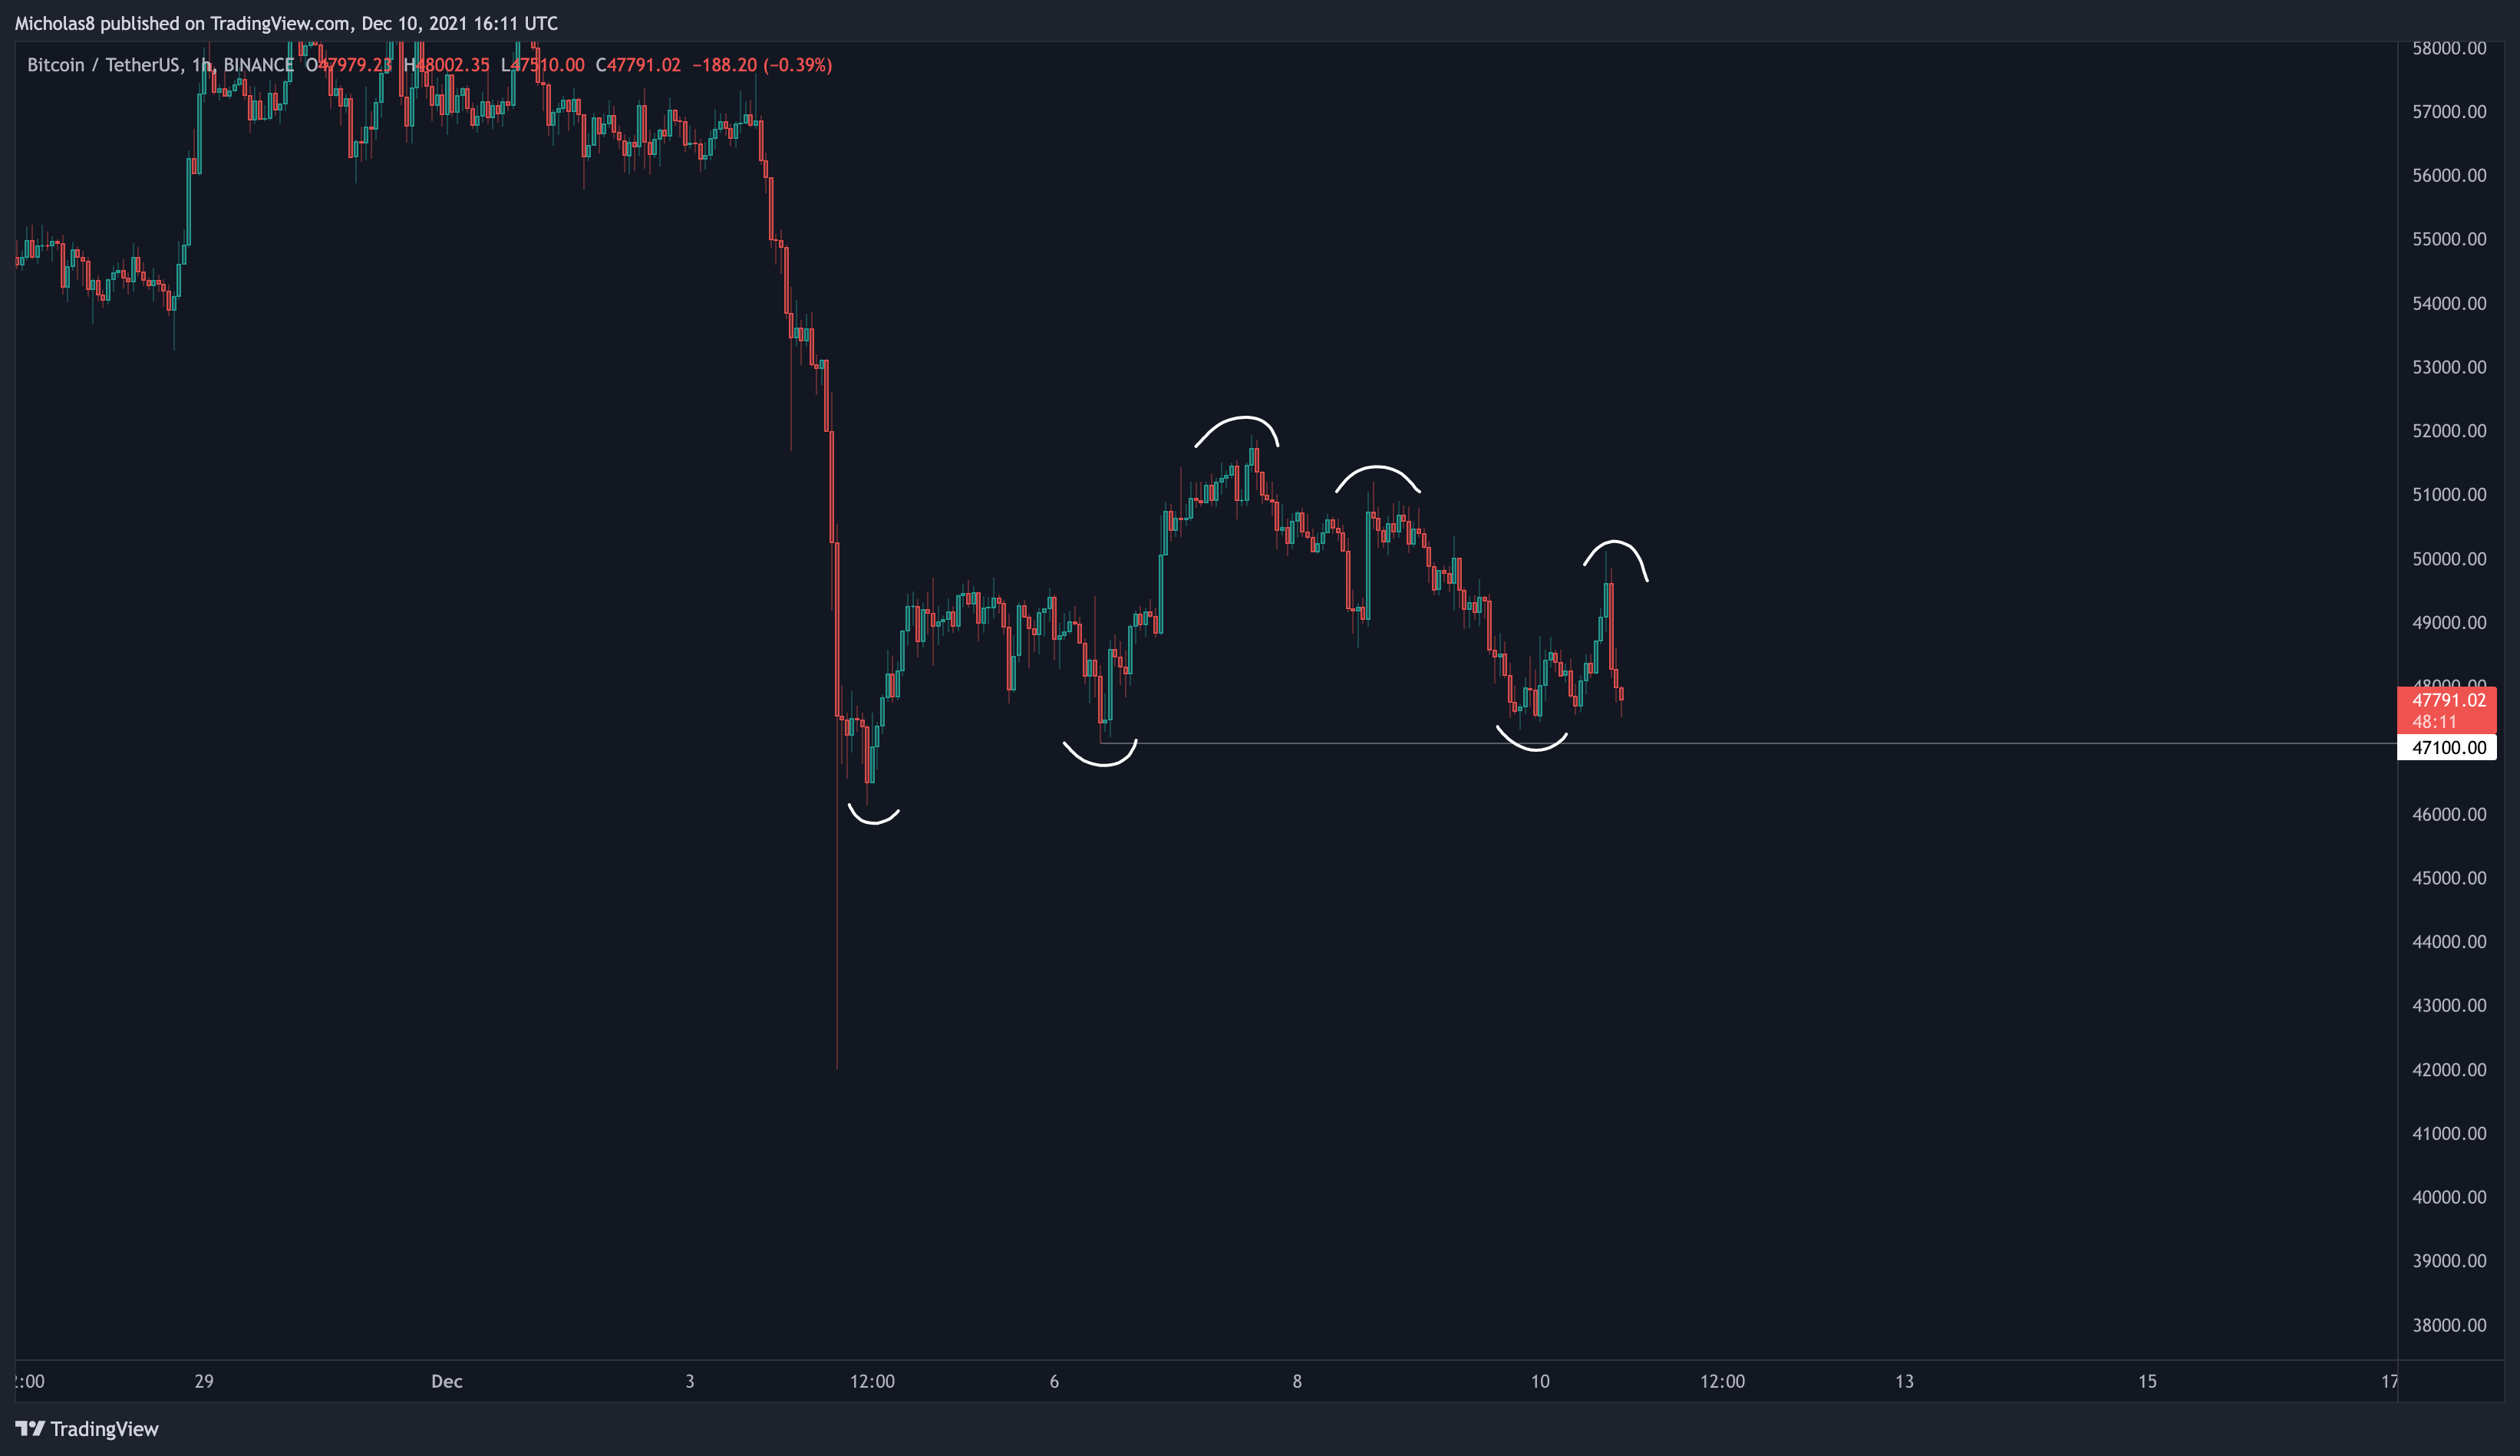
On the 1D timeframe, we have the potential for a Morningstar Candlestick Pattern (MCP) to form. This is the same pattern from yesterday's report, except now on the 1D timeframe. This isn't confirmed yet because we do need to see a candle form similar to the one in the red box. Inside of that red box was another MCP which did result in a move to the upside.
Now, we do need other levels of confluence to support the argument for a reversal up. Unfortunately, we don't have the same levels of confluence as we previously did. To me, although it is possible we see similar PA in the coming days, this isn't as strong as the other ones.
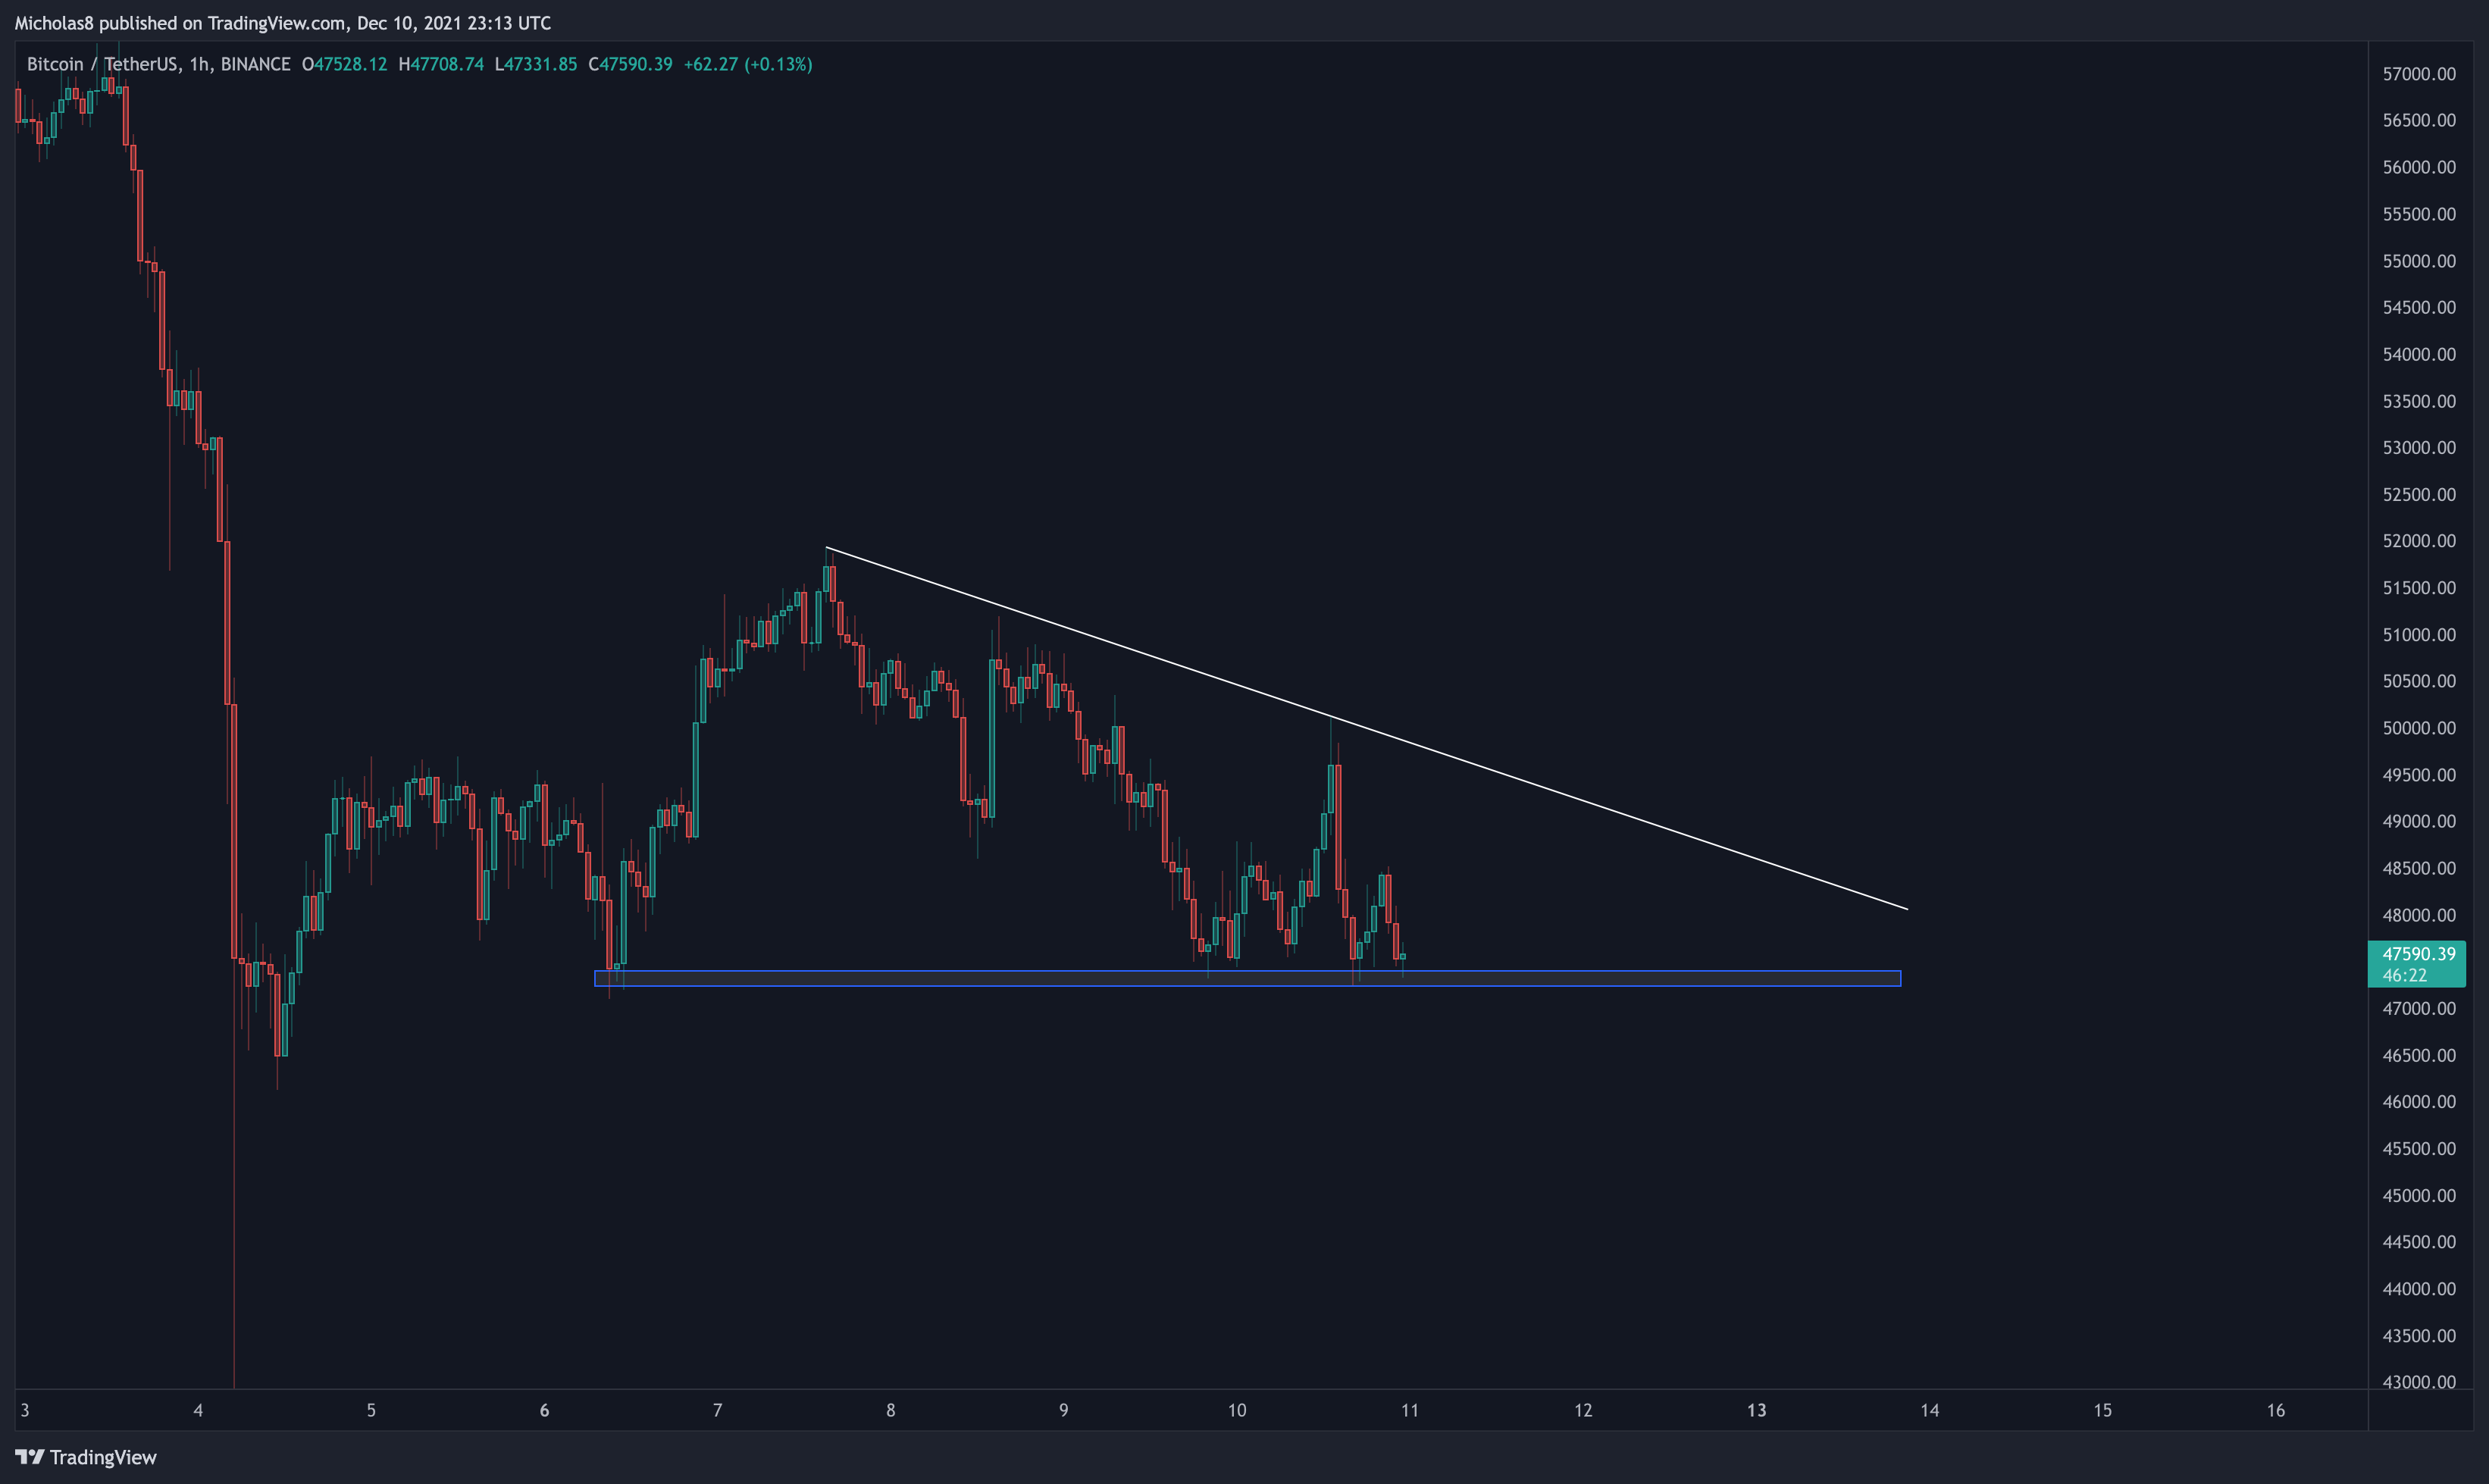
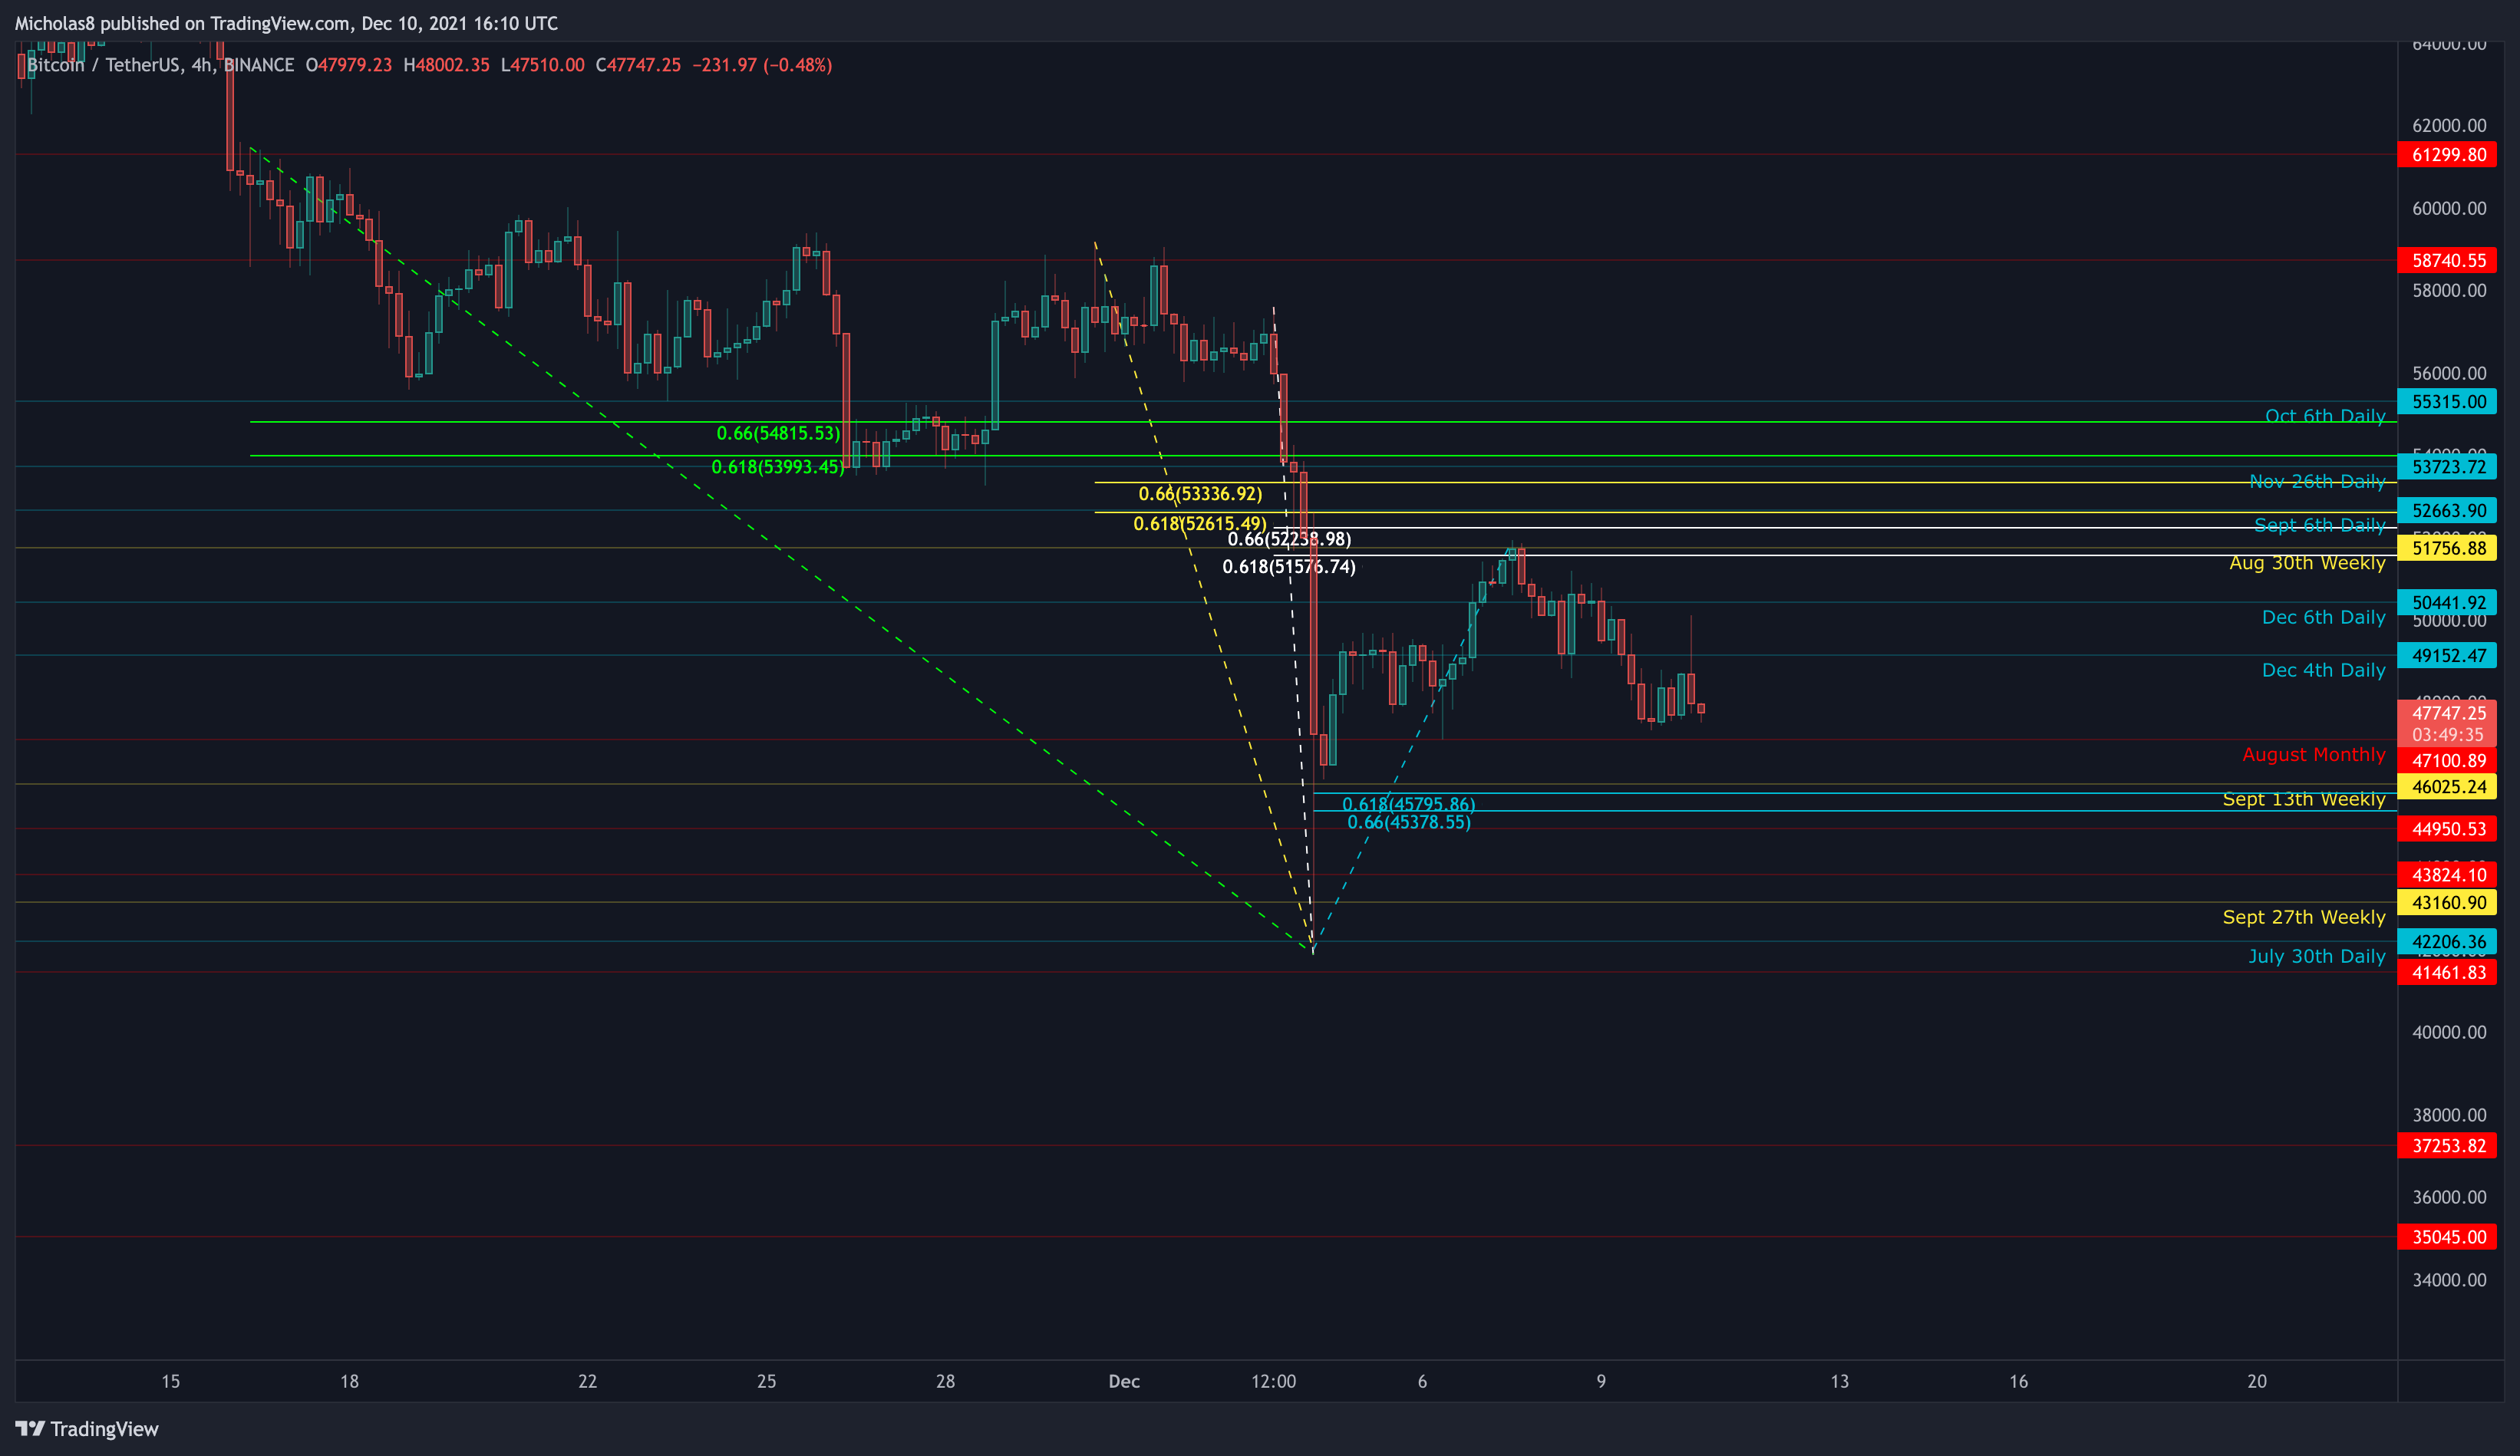
Bitcoin is inside of a Descending Triangle as well. And as we know, this is a pattern that comes with a bearish bias. Meaning, there's a statistically higher chance that we break to the downside. However, please keep in mind that there is still a possibility of breaking to the upside.
All in all, nothing has really changed in the grand scheme of things. We're still sort of in this state of limbo. It's important to keep in mind that there's still the possibility that this is a dead cat bounce if we continue up much higher than here given that we have the 4H hidden bearish divergence still in play. But, it's nice to see the 1H/4H bullish divergences and the 1D bullish divergences potentially coming into play.
Friendly reminder to remain level-headed! Even if we do see a meaningful move to the upside sooner rather than later, there's still the possibility that it may be a dead cat bounce. Weekly/Monthly divergences are very significant for the macro outlook of an asset if they aren't invalidated.
Thank you for your continued support, and I hope you have a great weekend! See you all on Sunday night.
Cheers!
To subscribe to this newsletter (44 reports per month), or take advantage of the other tiers offered, please visit the link below:
https://www.buymeacoffee.com/bitcoincharts