
You will find the content below in this order:
1. Definitions
2. The Good
3. The Bad
4. Key Levels
5. Final Thoughts
DEFINITIONS
Liquidity zones are high volume levels that offer support and resistance
Hidden bearish divergence: creating a lower high in price, with a higher high on the oscillators. This signals a possible trend continuation down.
Bearish divergence: higher high in price, lower high on the oscillators. This signals a possible trend reversal down.
Hidden bullish divergence: creating a higher low in price, with a lower low on the oscillators. This signals a possible trend continuation up.
Bullish divergence: creating a lower low in price, with a higher low on the oscillators. This signals a possible trend reversal up.
SR flip: turning old resistance into support, and vice-versa.
Fractal: recurring geometric pattern.
Price action (PA): the movement of an asset's price over time.
THE GOOD
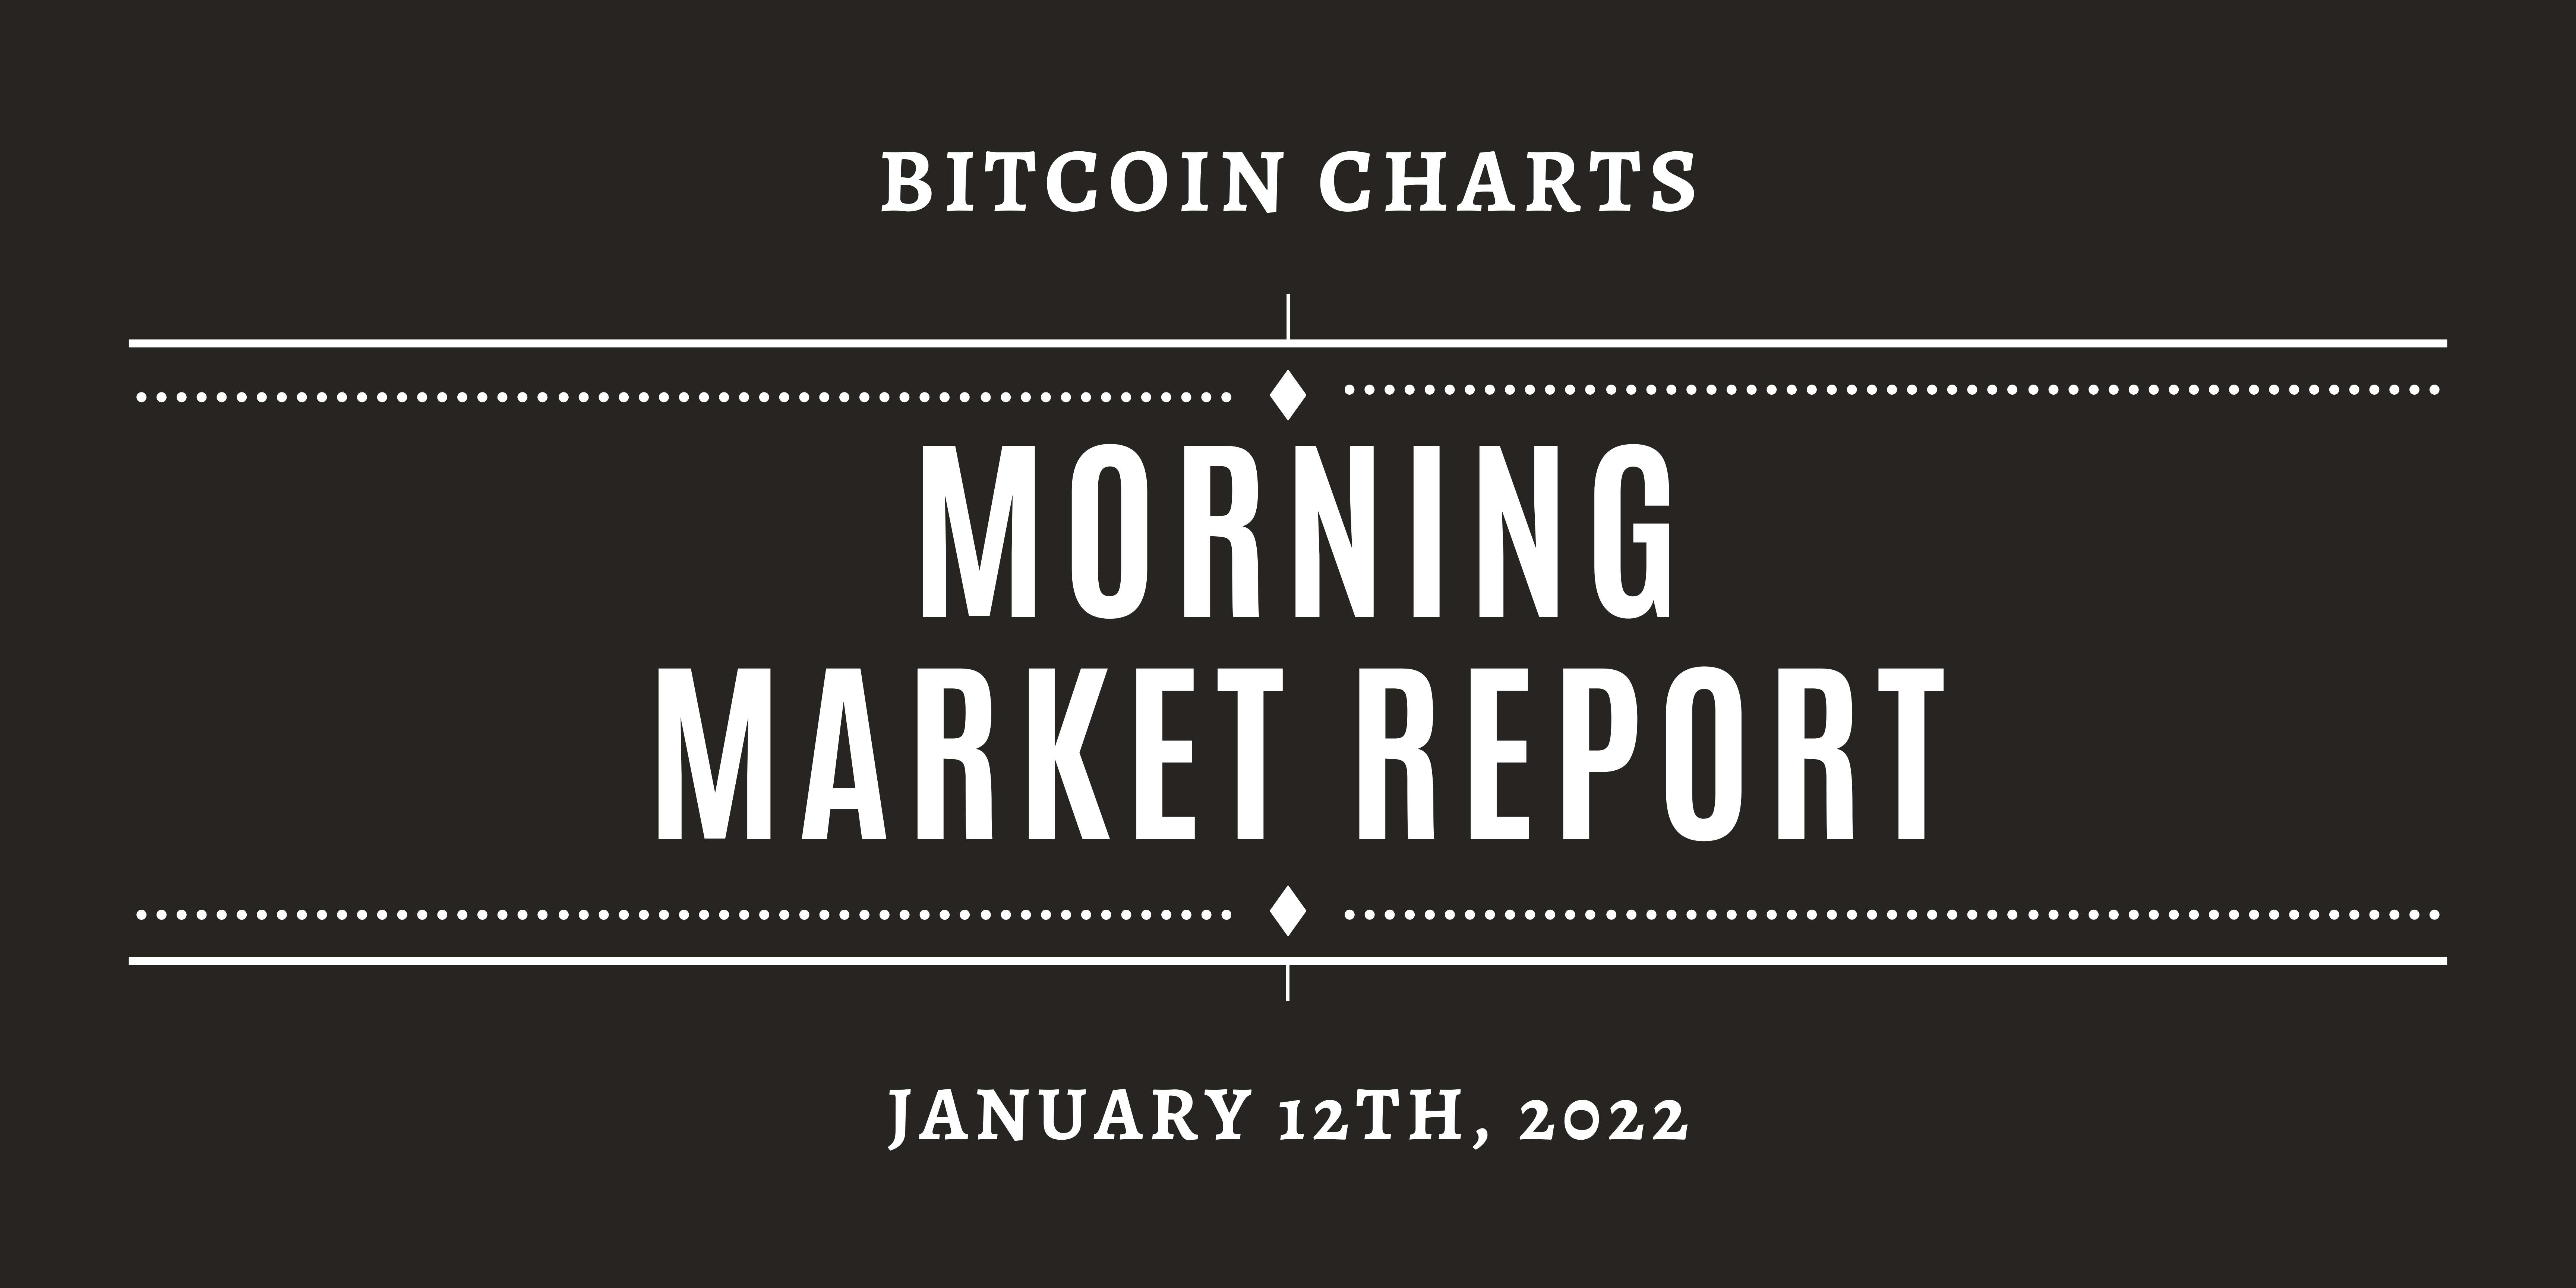
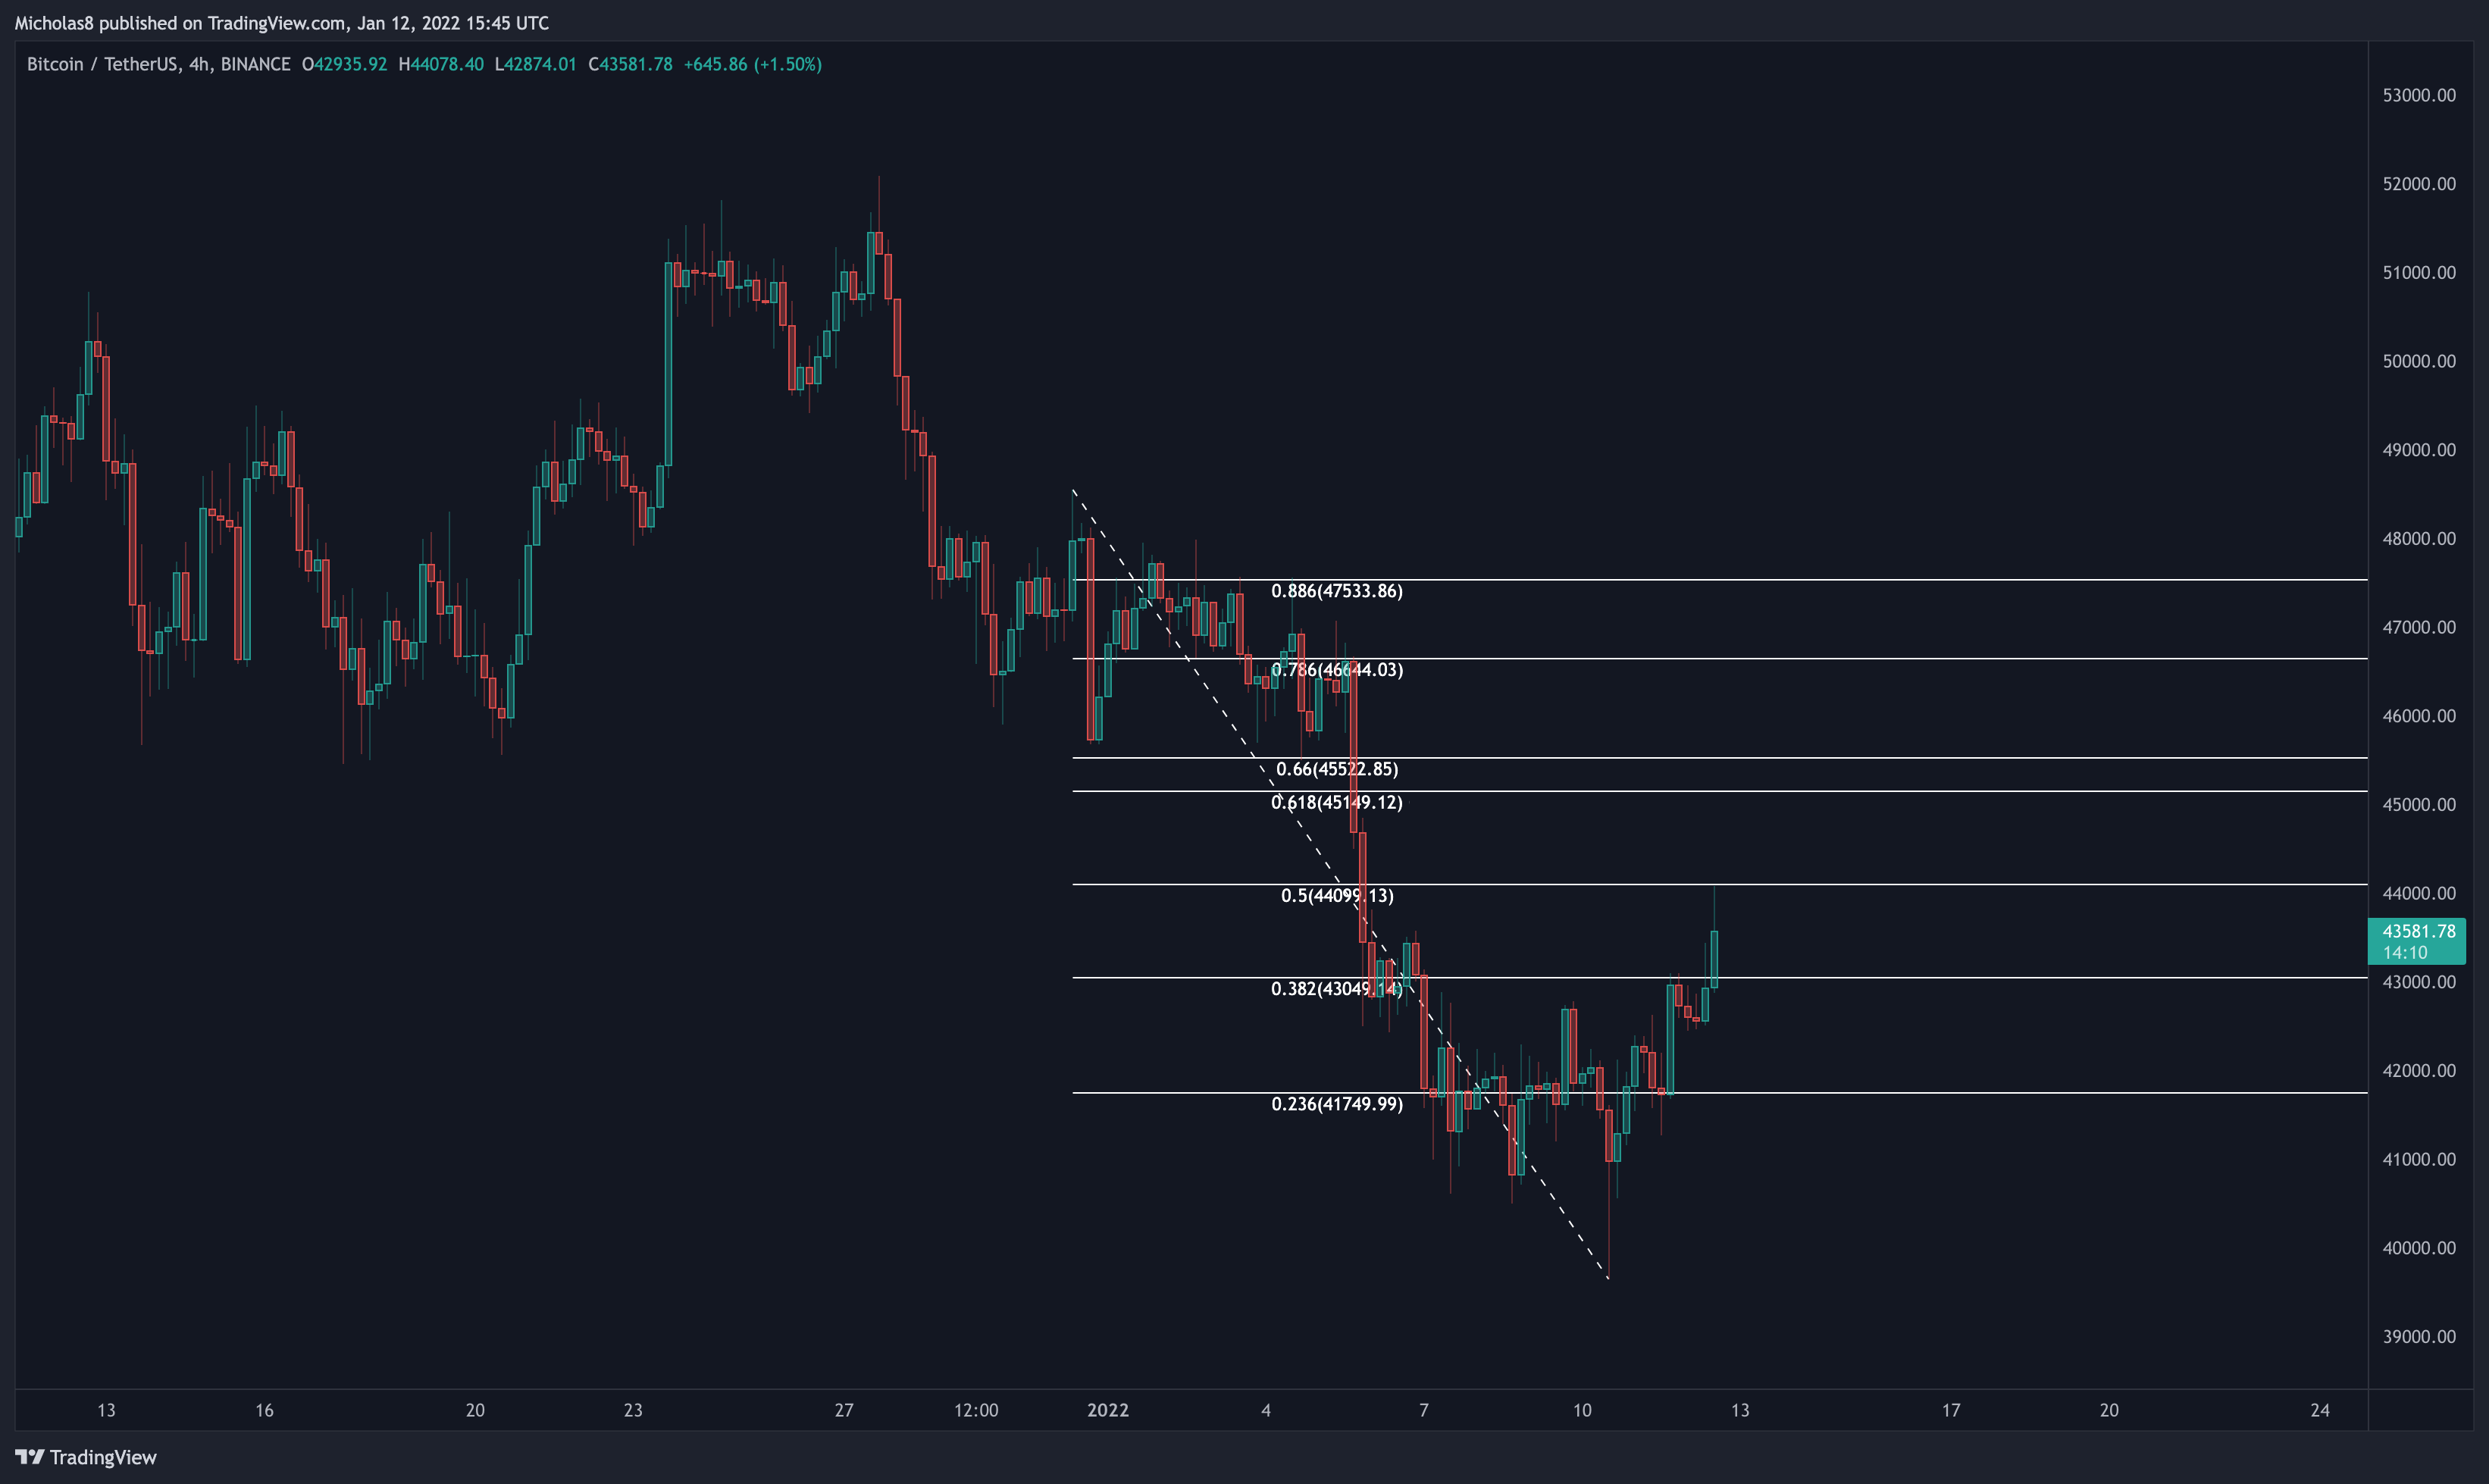
4H Timeframe
Key Liquidity Zone (LQZ)
Zone 2: There is a LQZ at 41.7k-42k which Bitcoin has risen above.
Implications: Ideally, this serves as support moving forward.
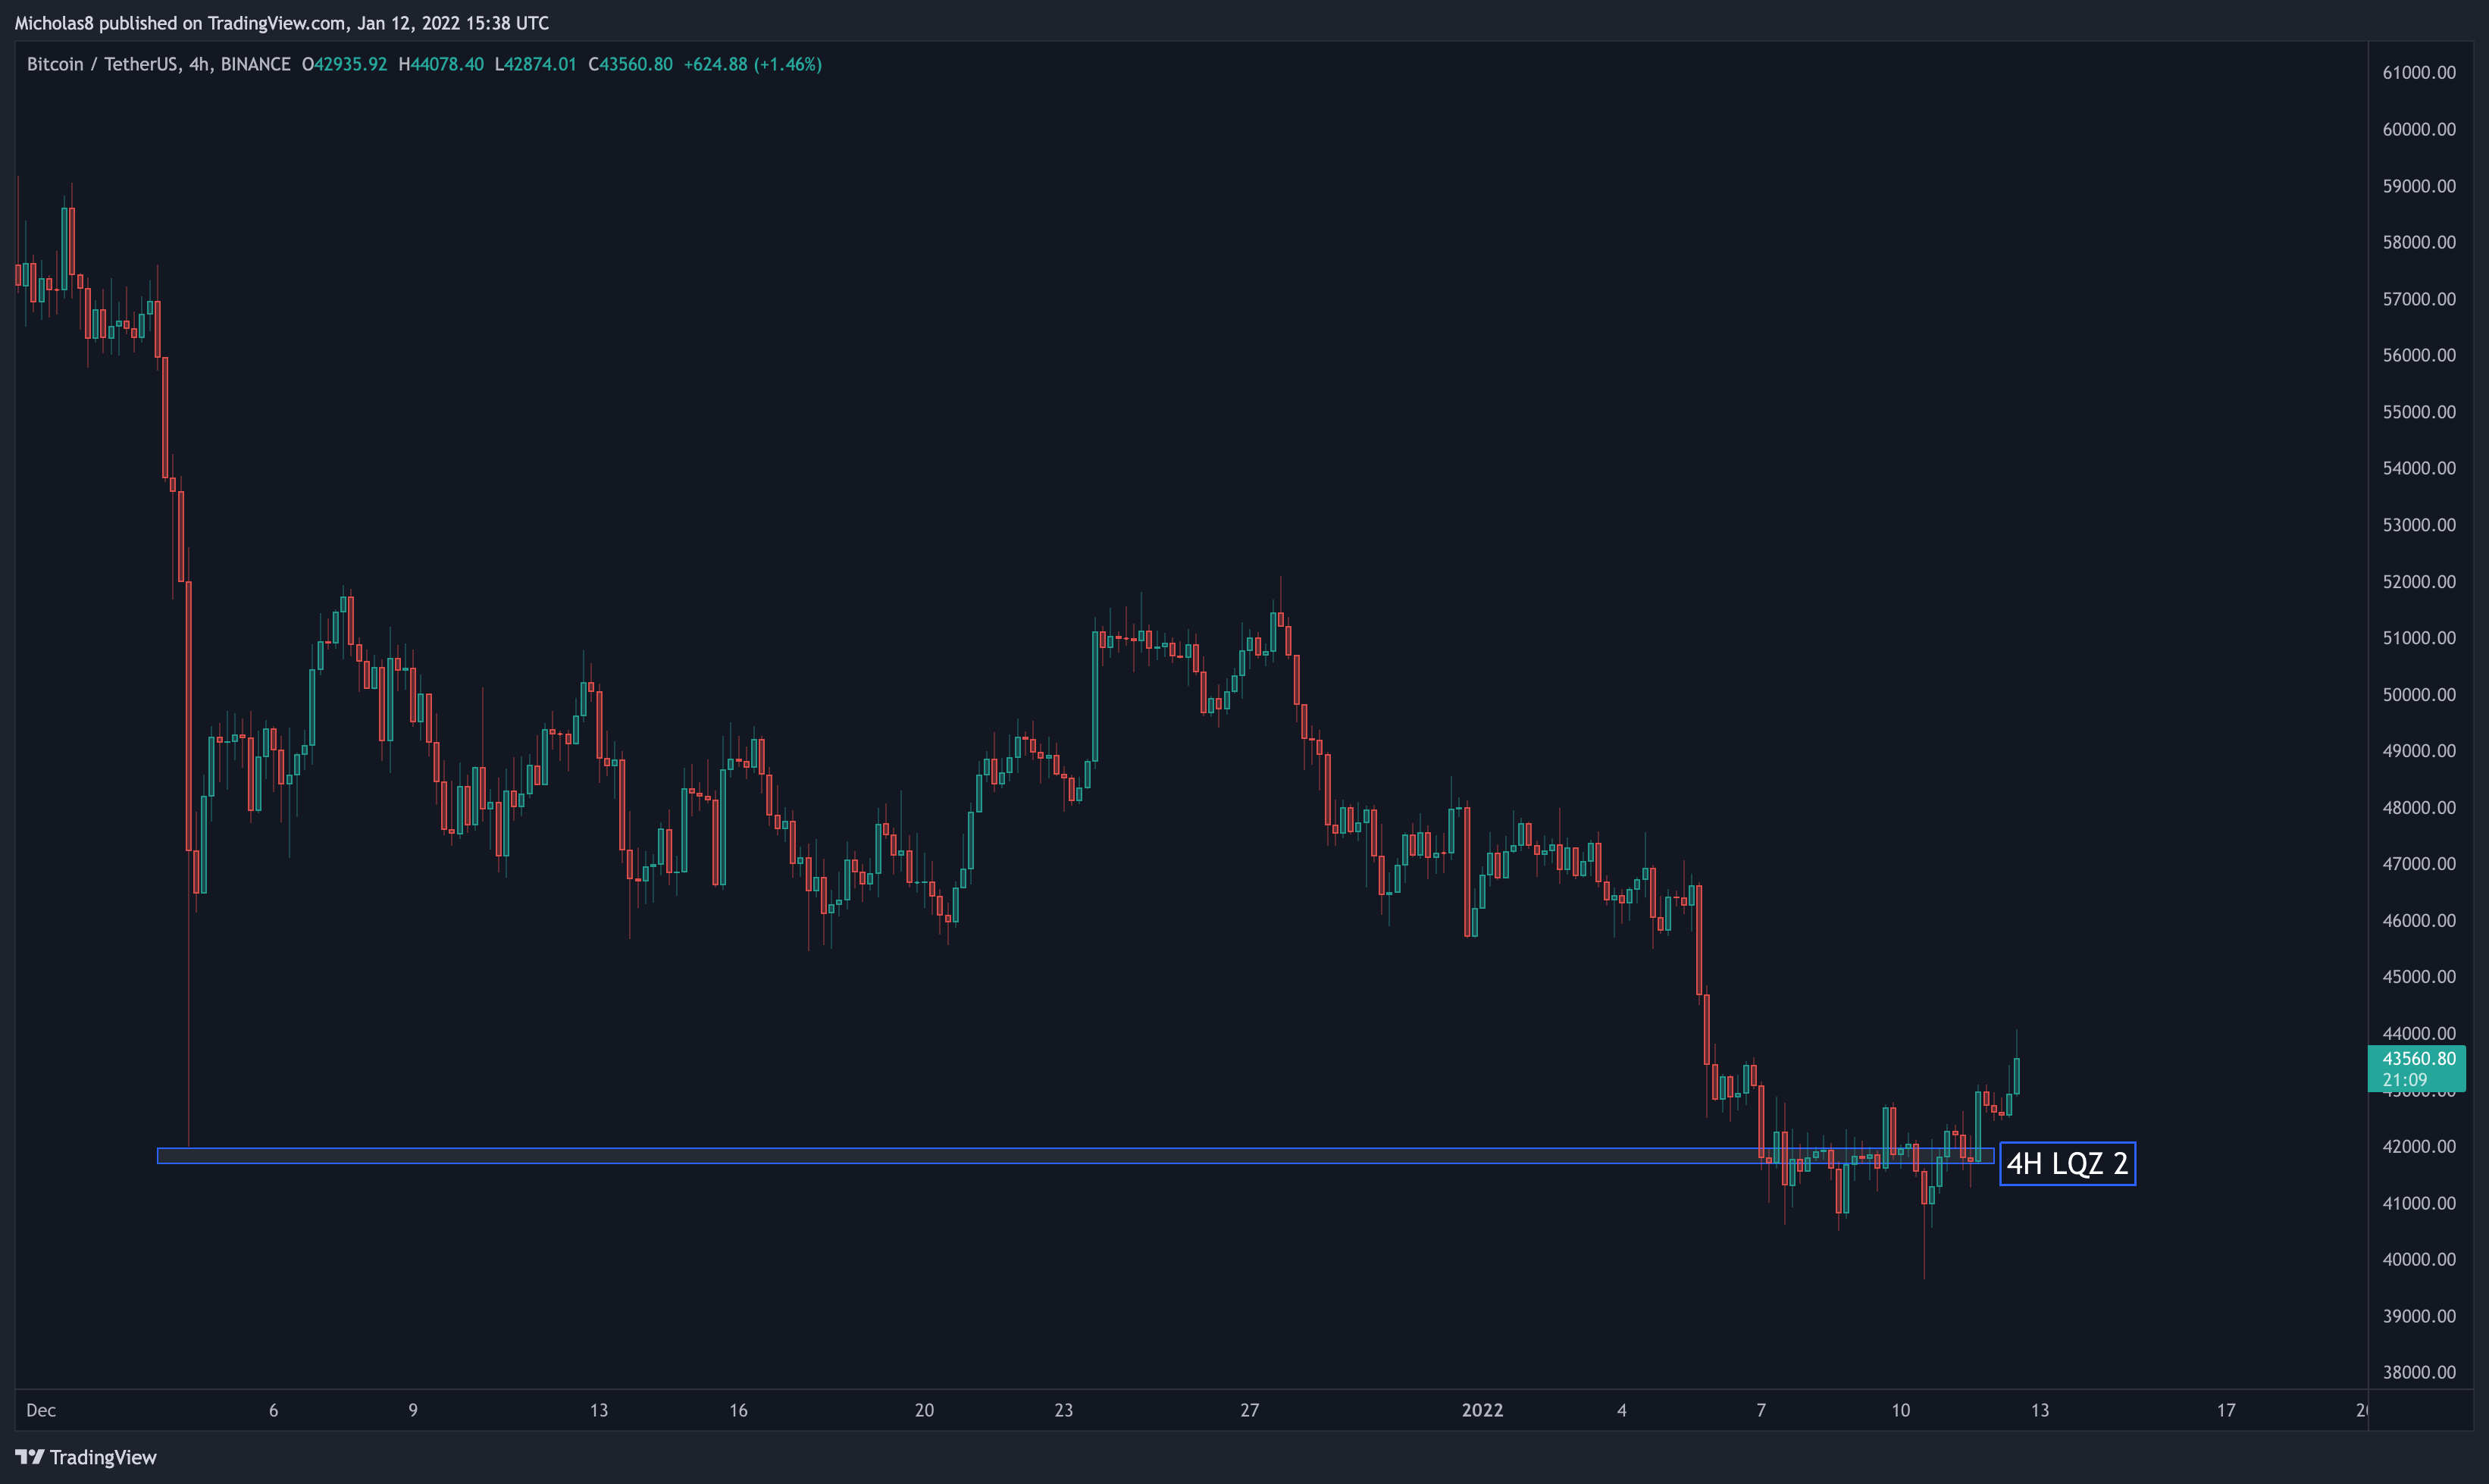
Simple Moving Averages (SMA): 20 and 50
Bitcoin has risen above these SMAs.
Implication: If Bitcoin can maintain PA above these SMAs and hold them as support, it becomes more likely that we see continued upside.
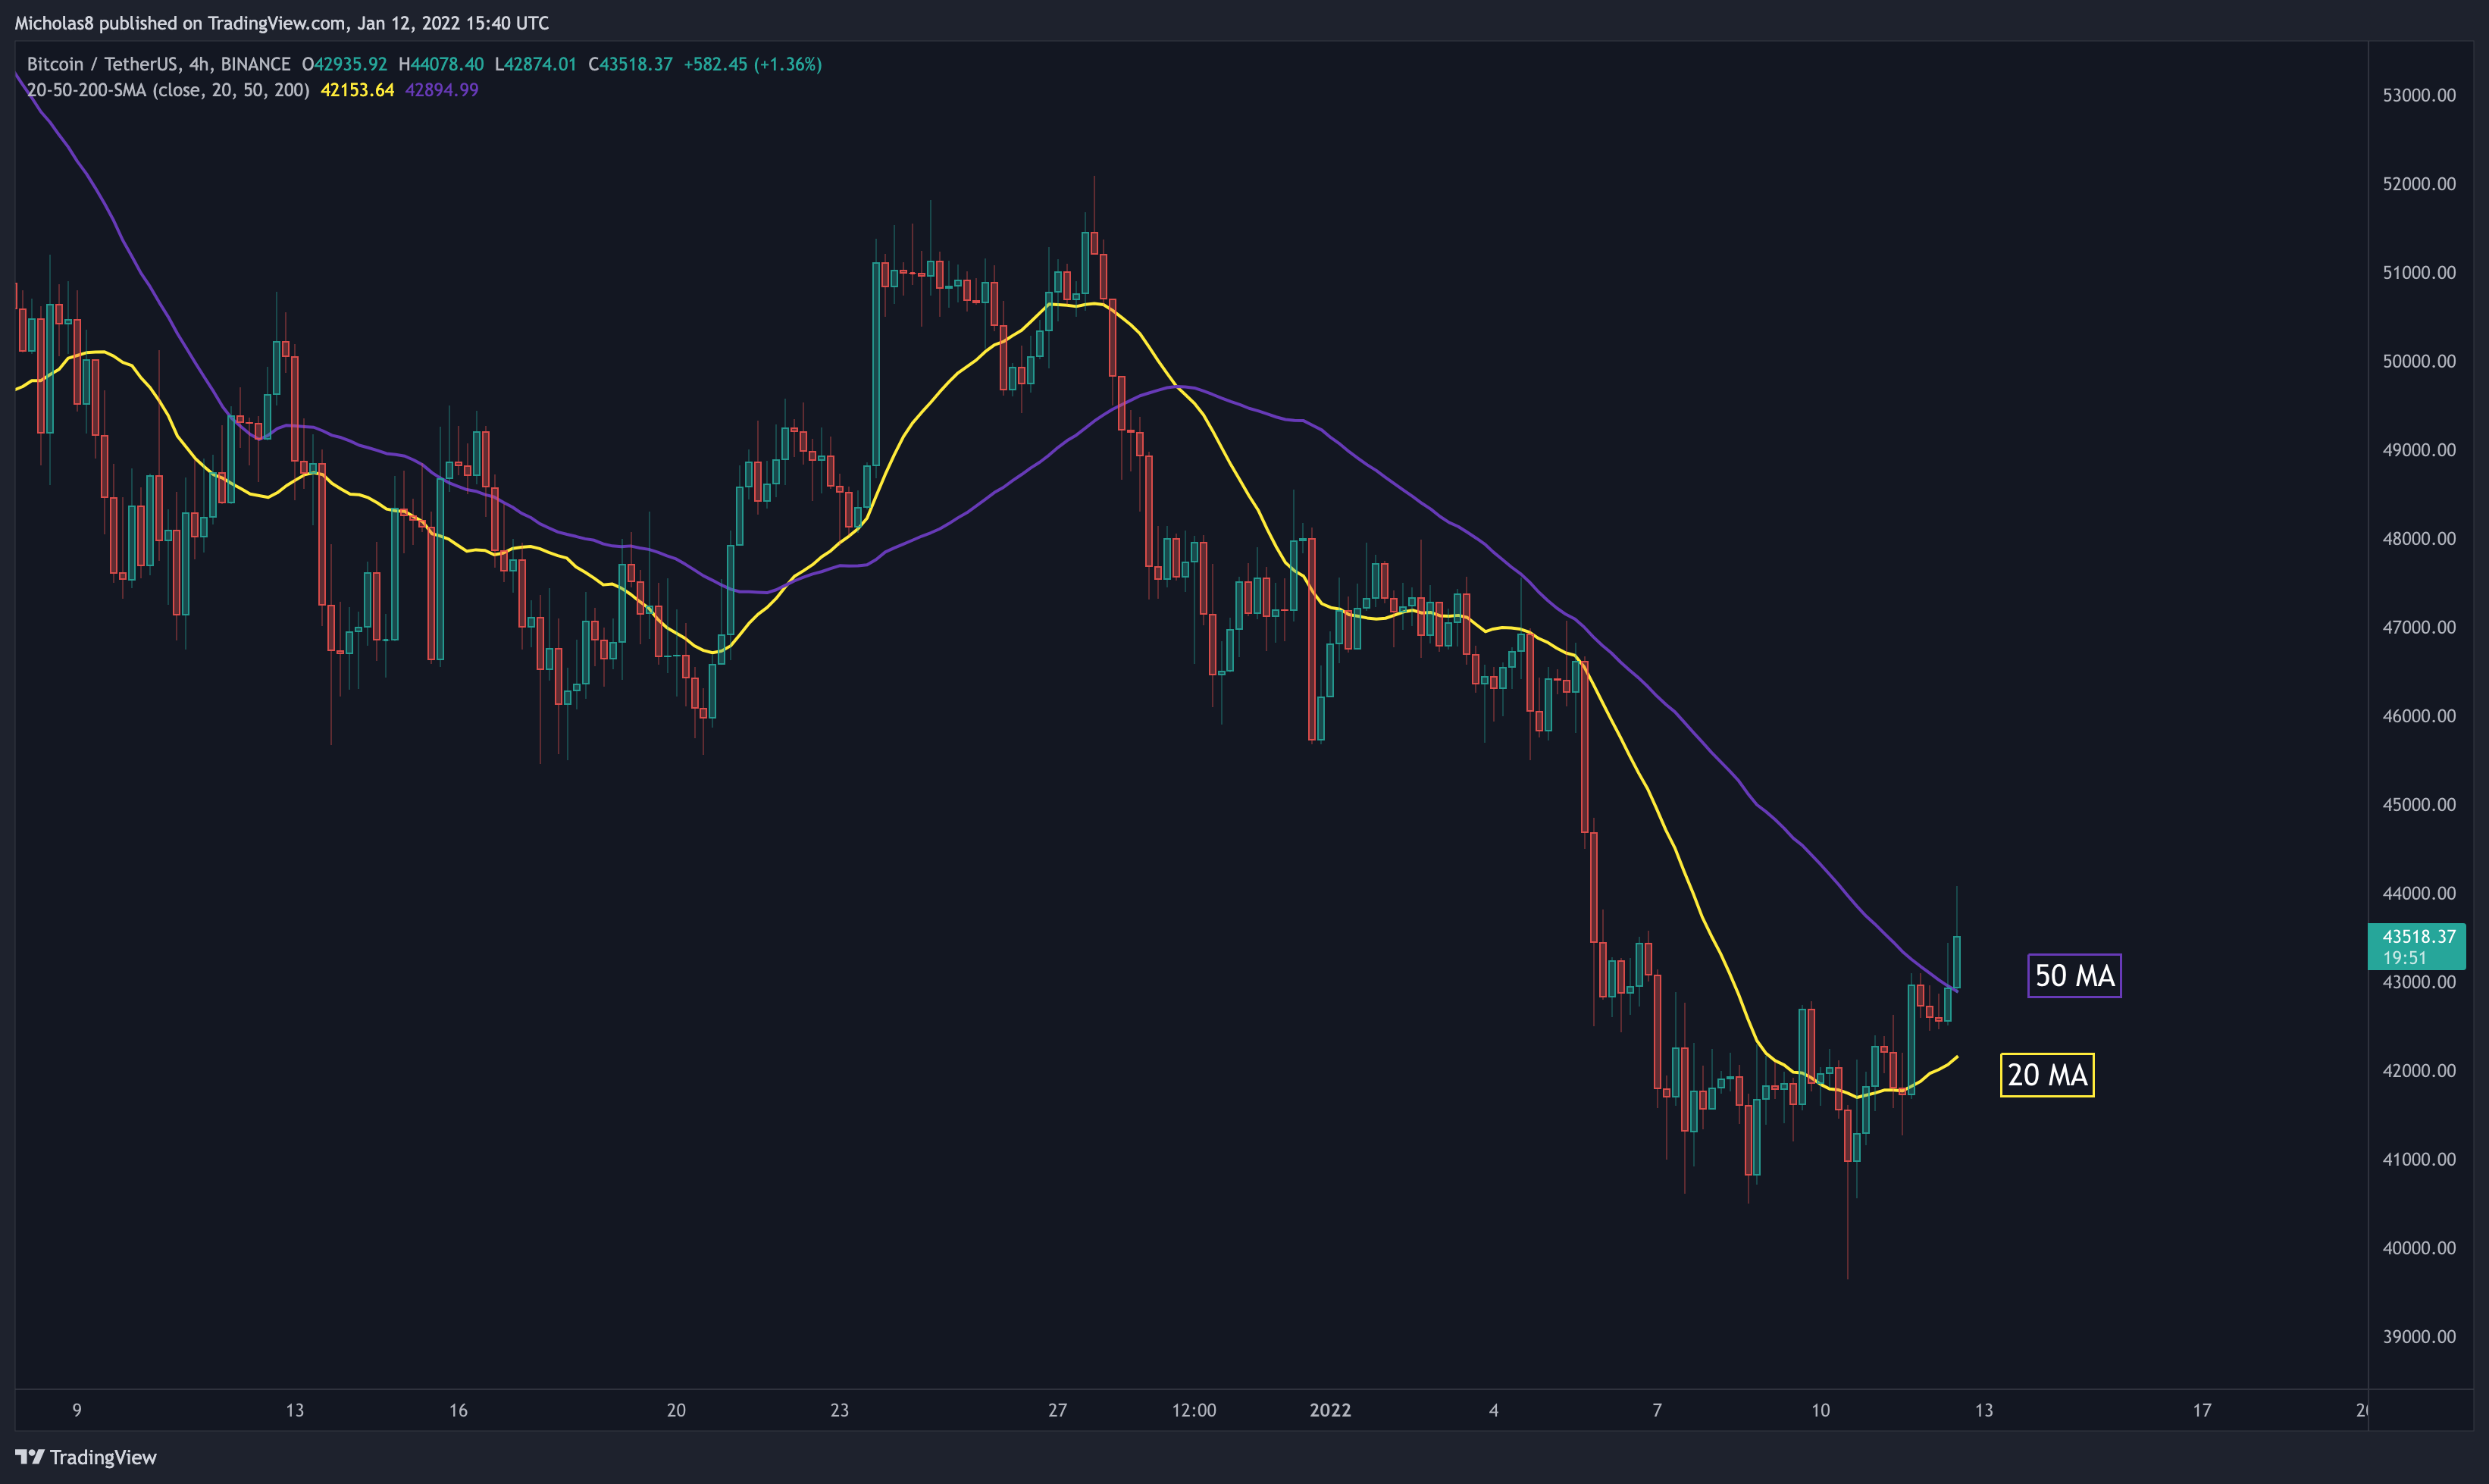
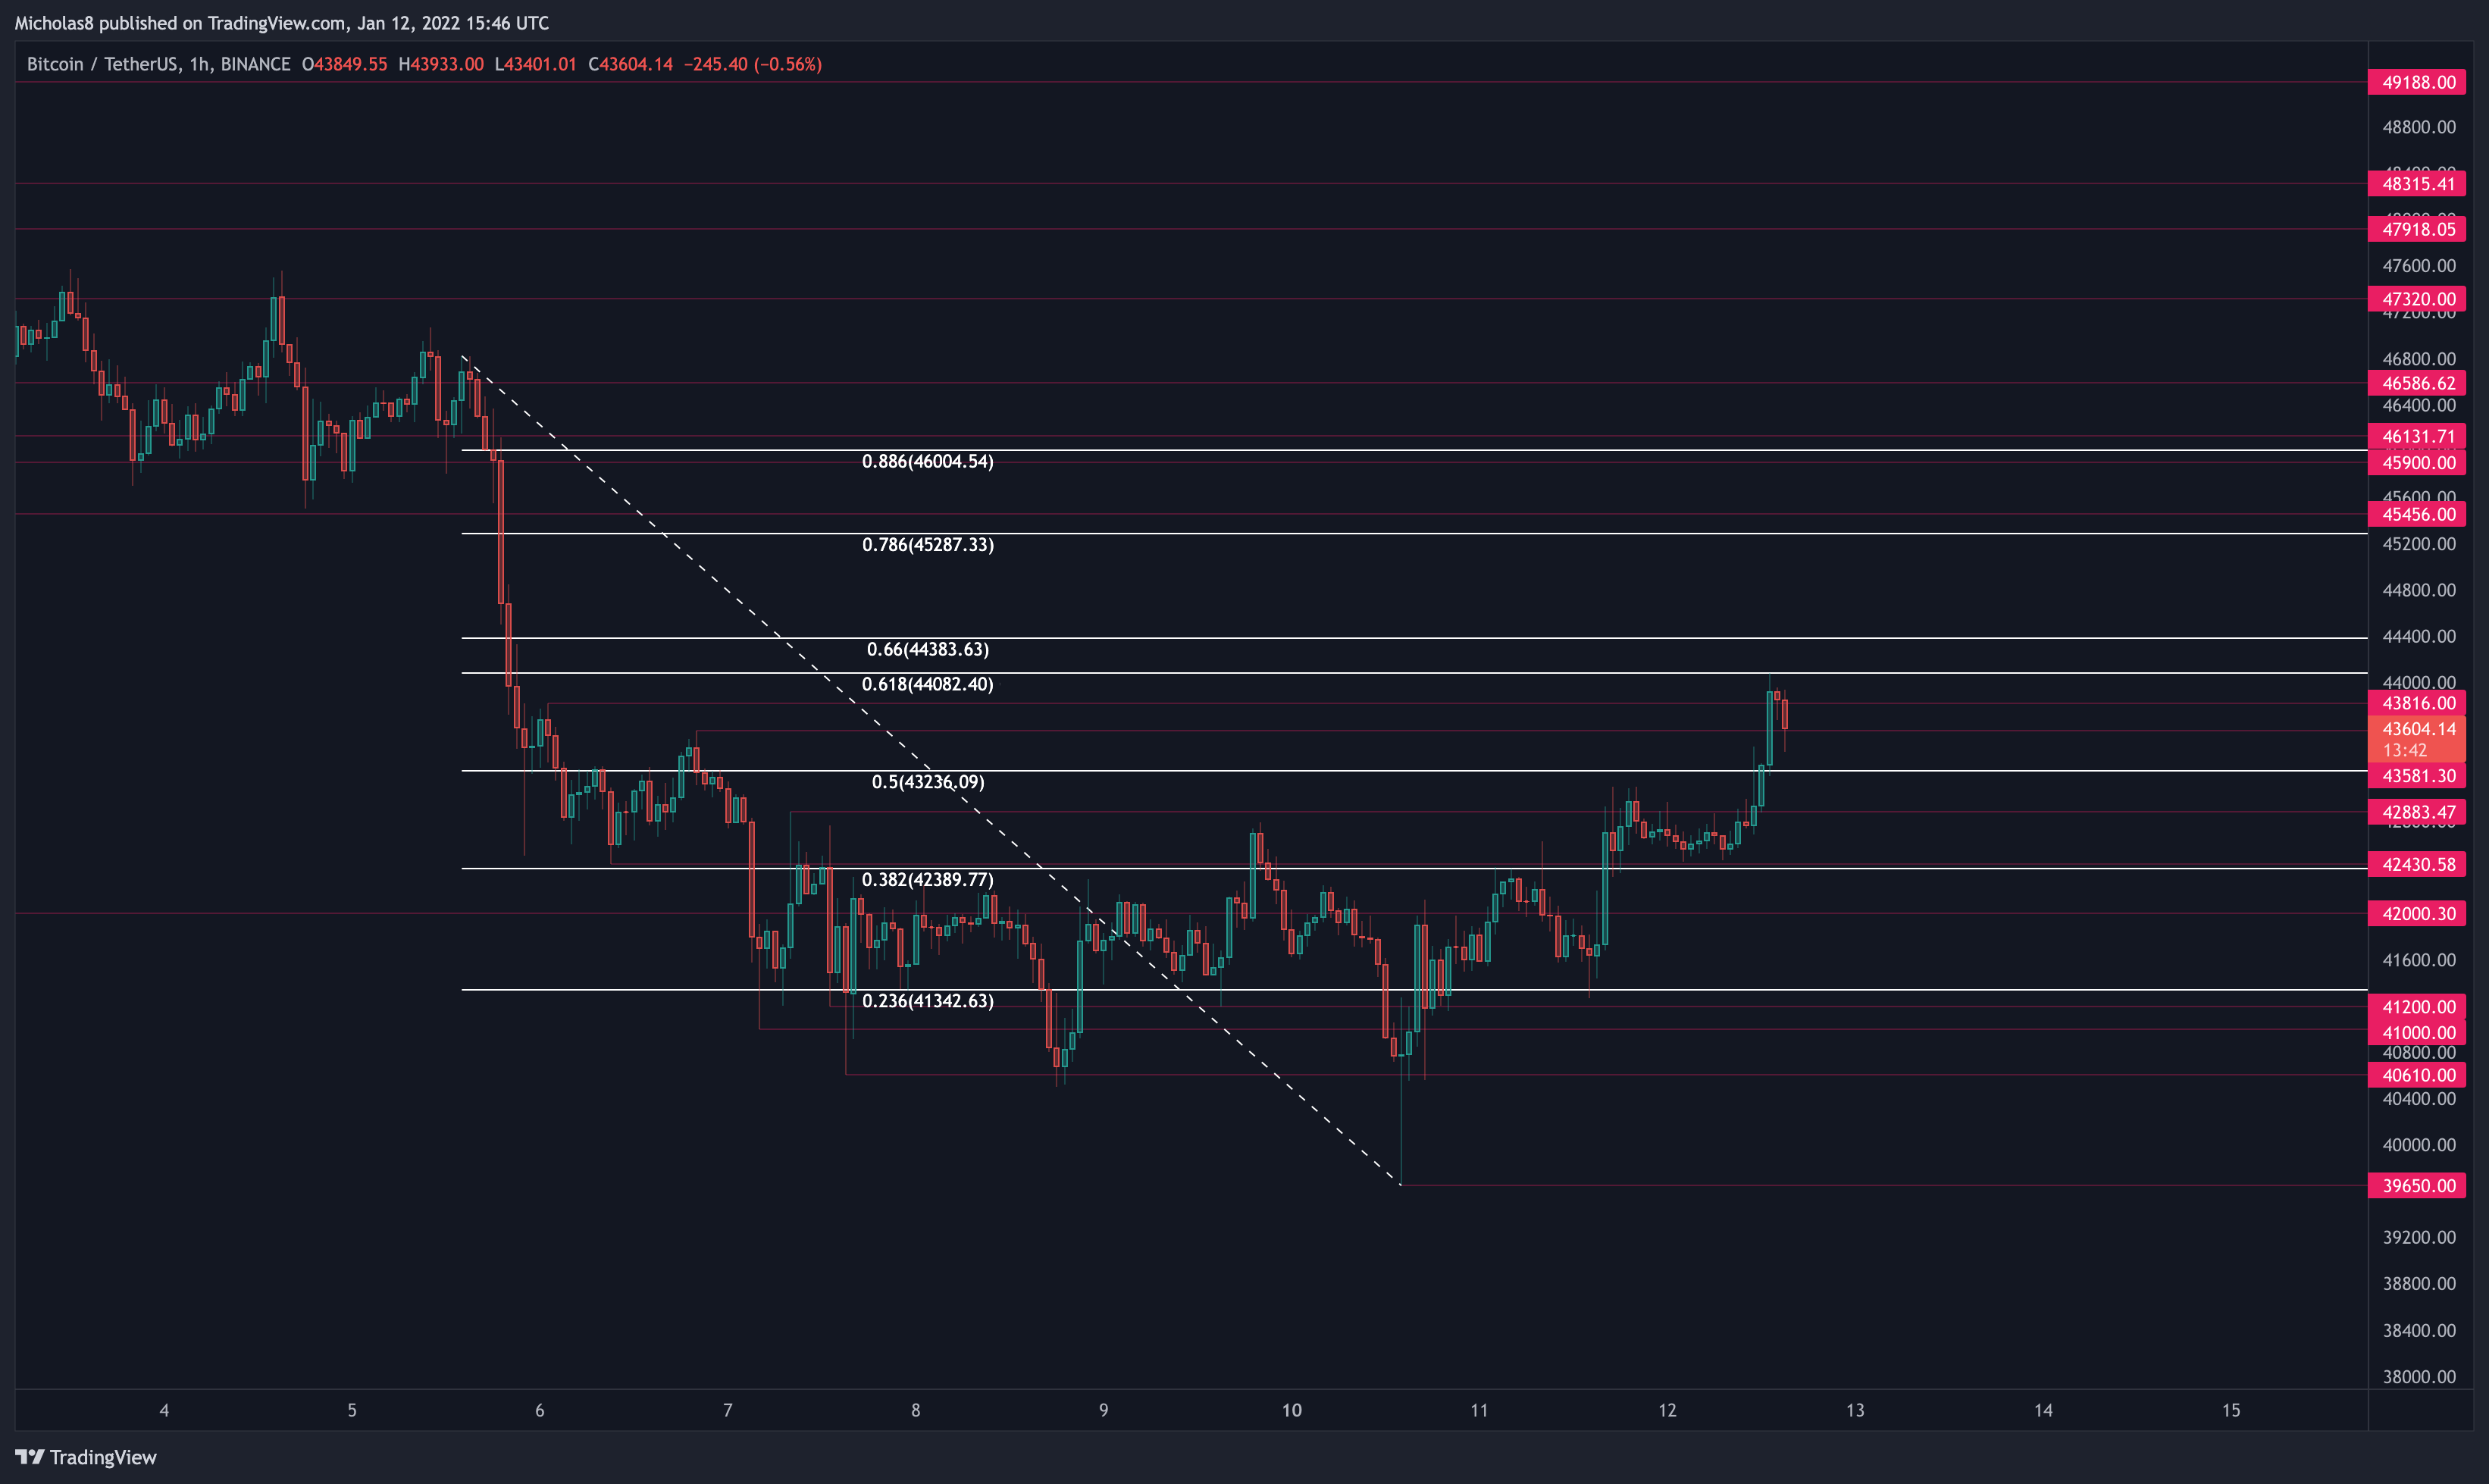
1H Timeframe
EMA Ribbon
Bitcoin has reclaimed the EMA ribbon as support in this timeframe.
Implication: Ideally, this serves as support.
What is an EMA ribbon? A 'ribbon' of EMAs that together indicate bearish and bullish momentum in the market. When an asset is trading is above the ribbon, it's considered bullish. Vice-versa.
THE BAD
4H Timeframe
Bearish Market Structure
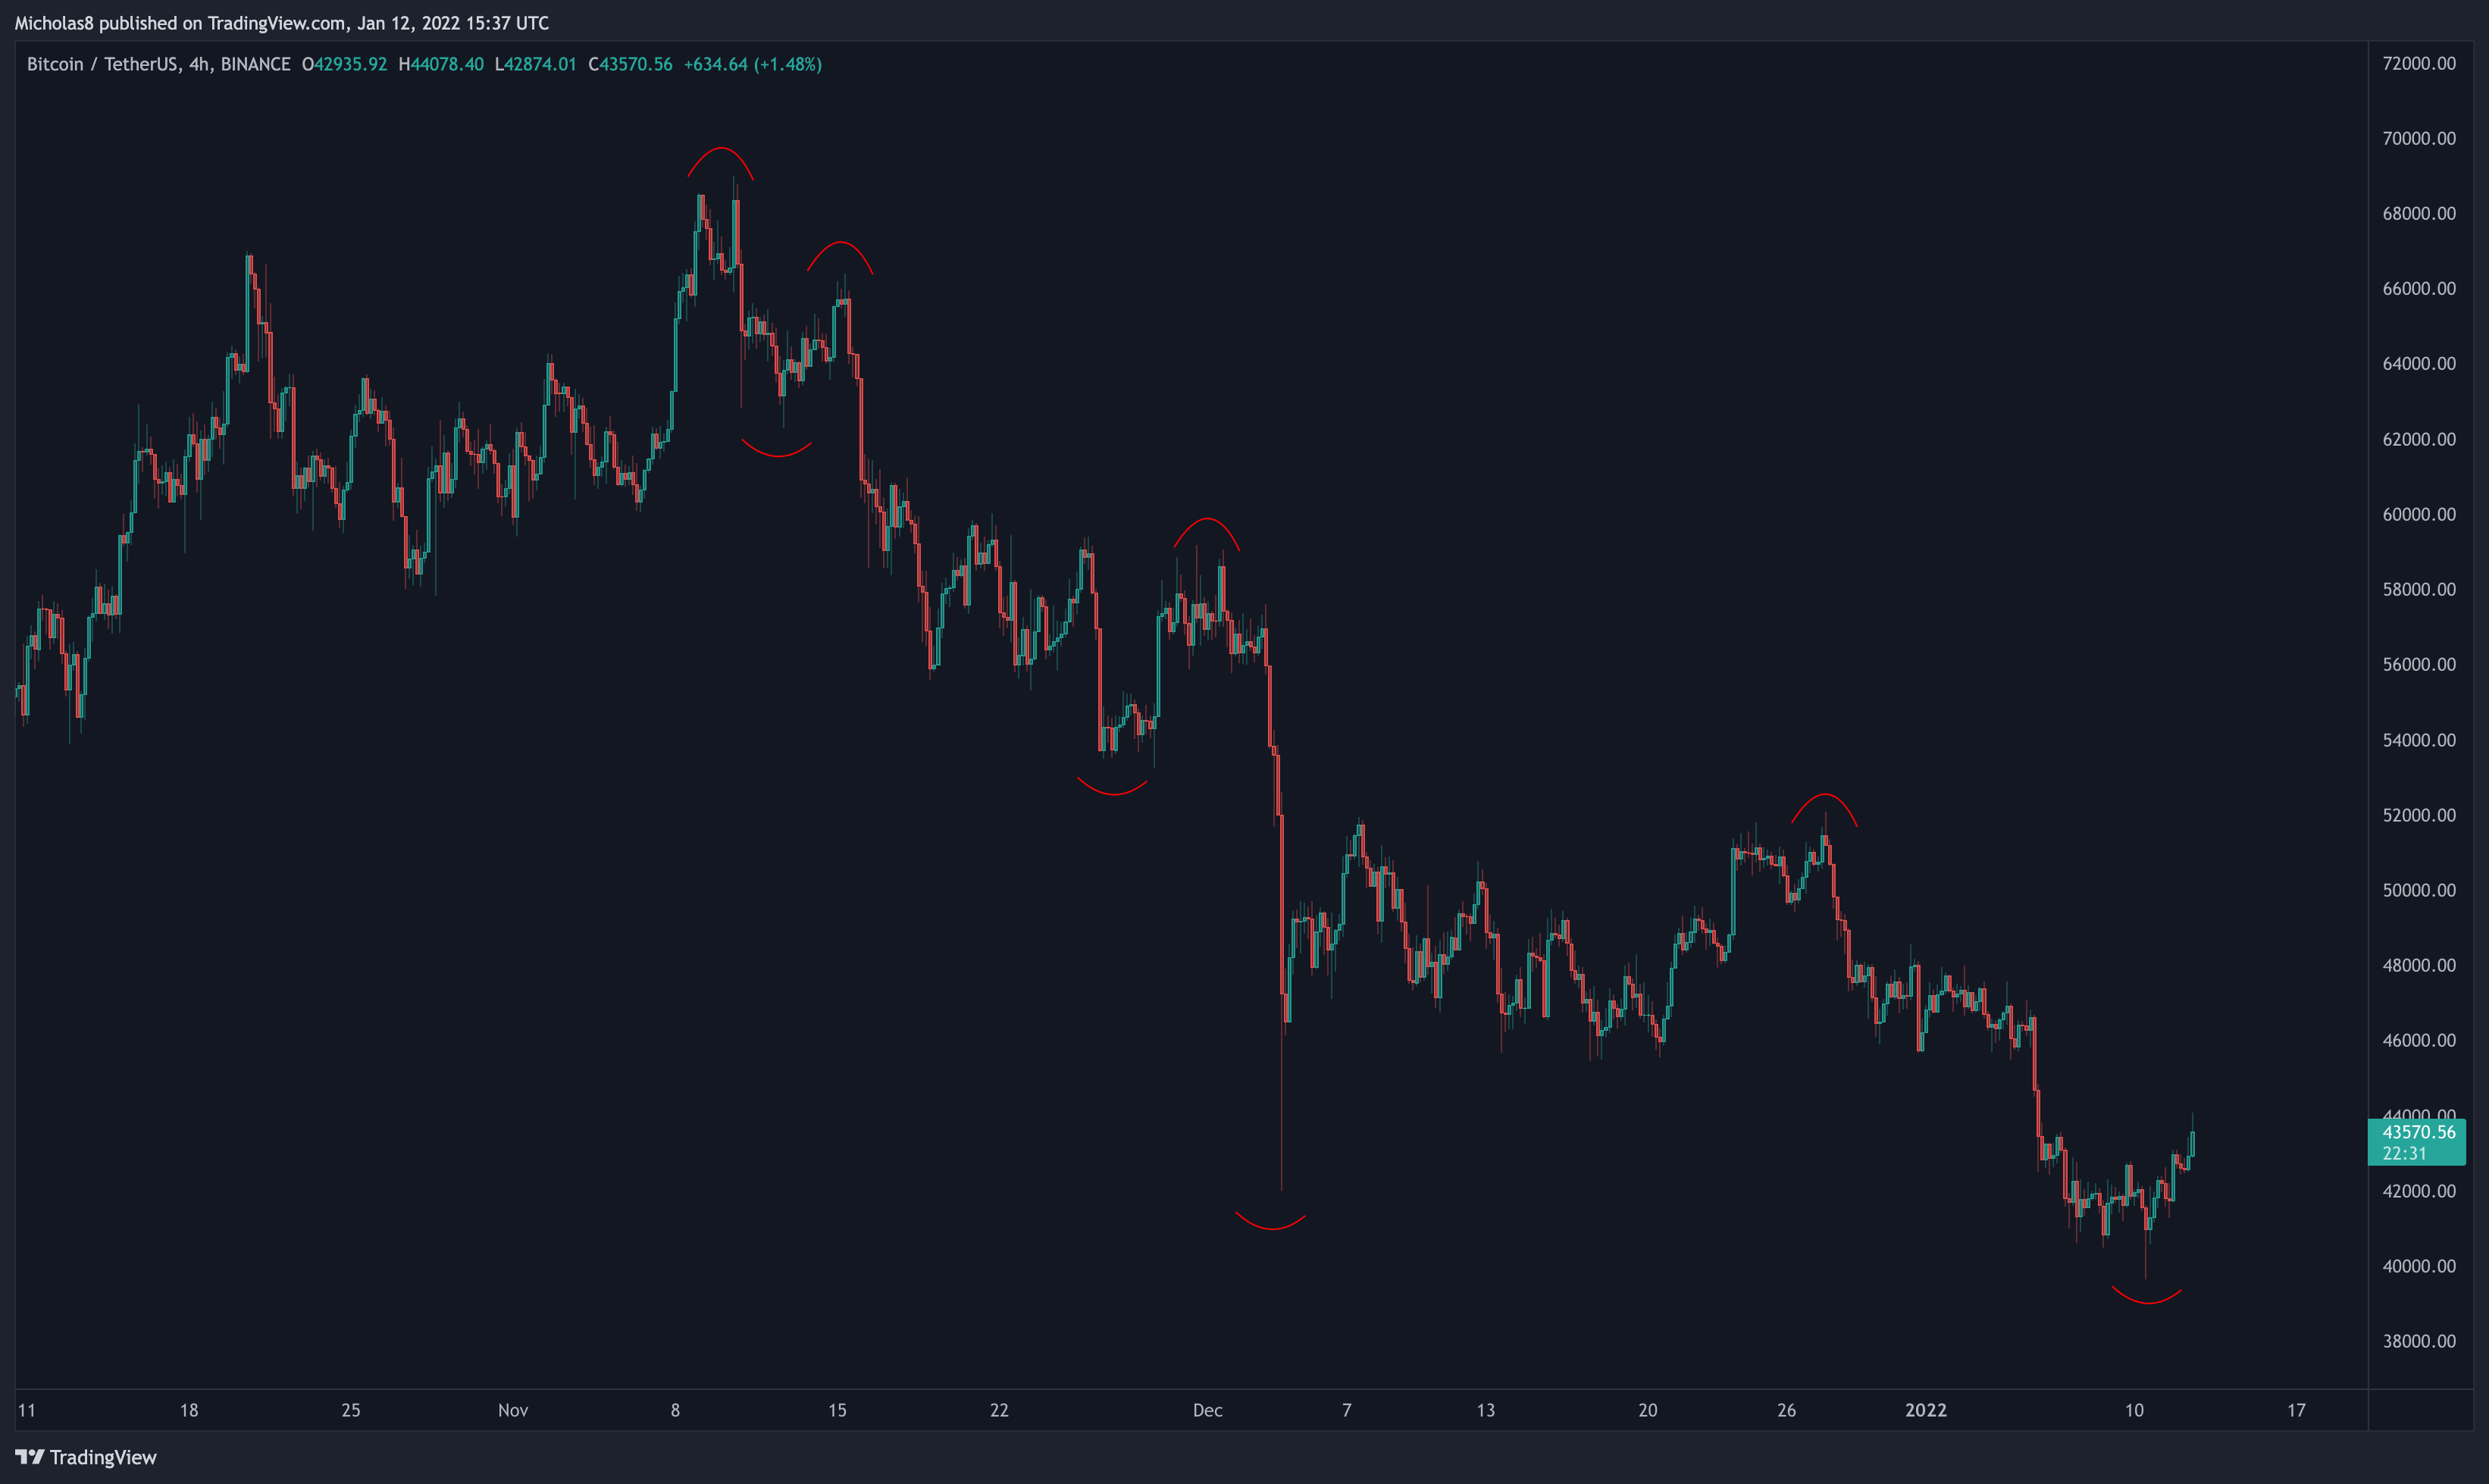
Bitcoin has lost the micro higher high and higher low structure it was attempting to form. We also saw that potential new higher low be taken out, and we've created a new lower low. Until Bitcoin can create a meaningful higher low and higher high, it's reasonable to expect continued downside.
Key Liquidity Zone (LQZ)
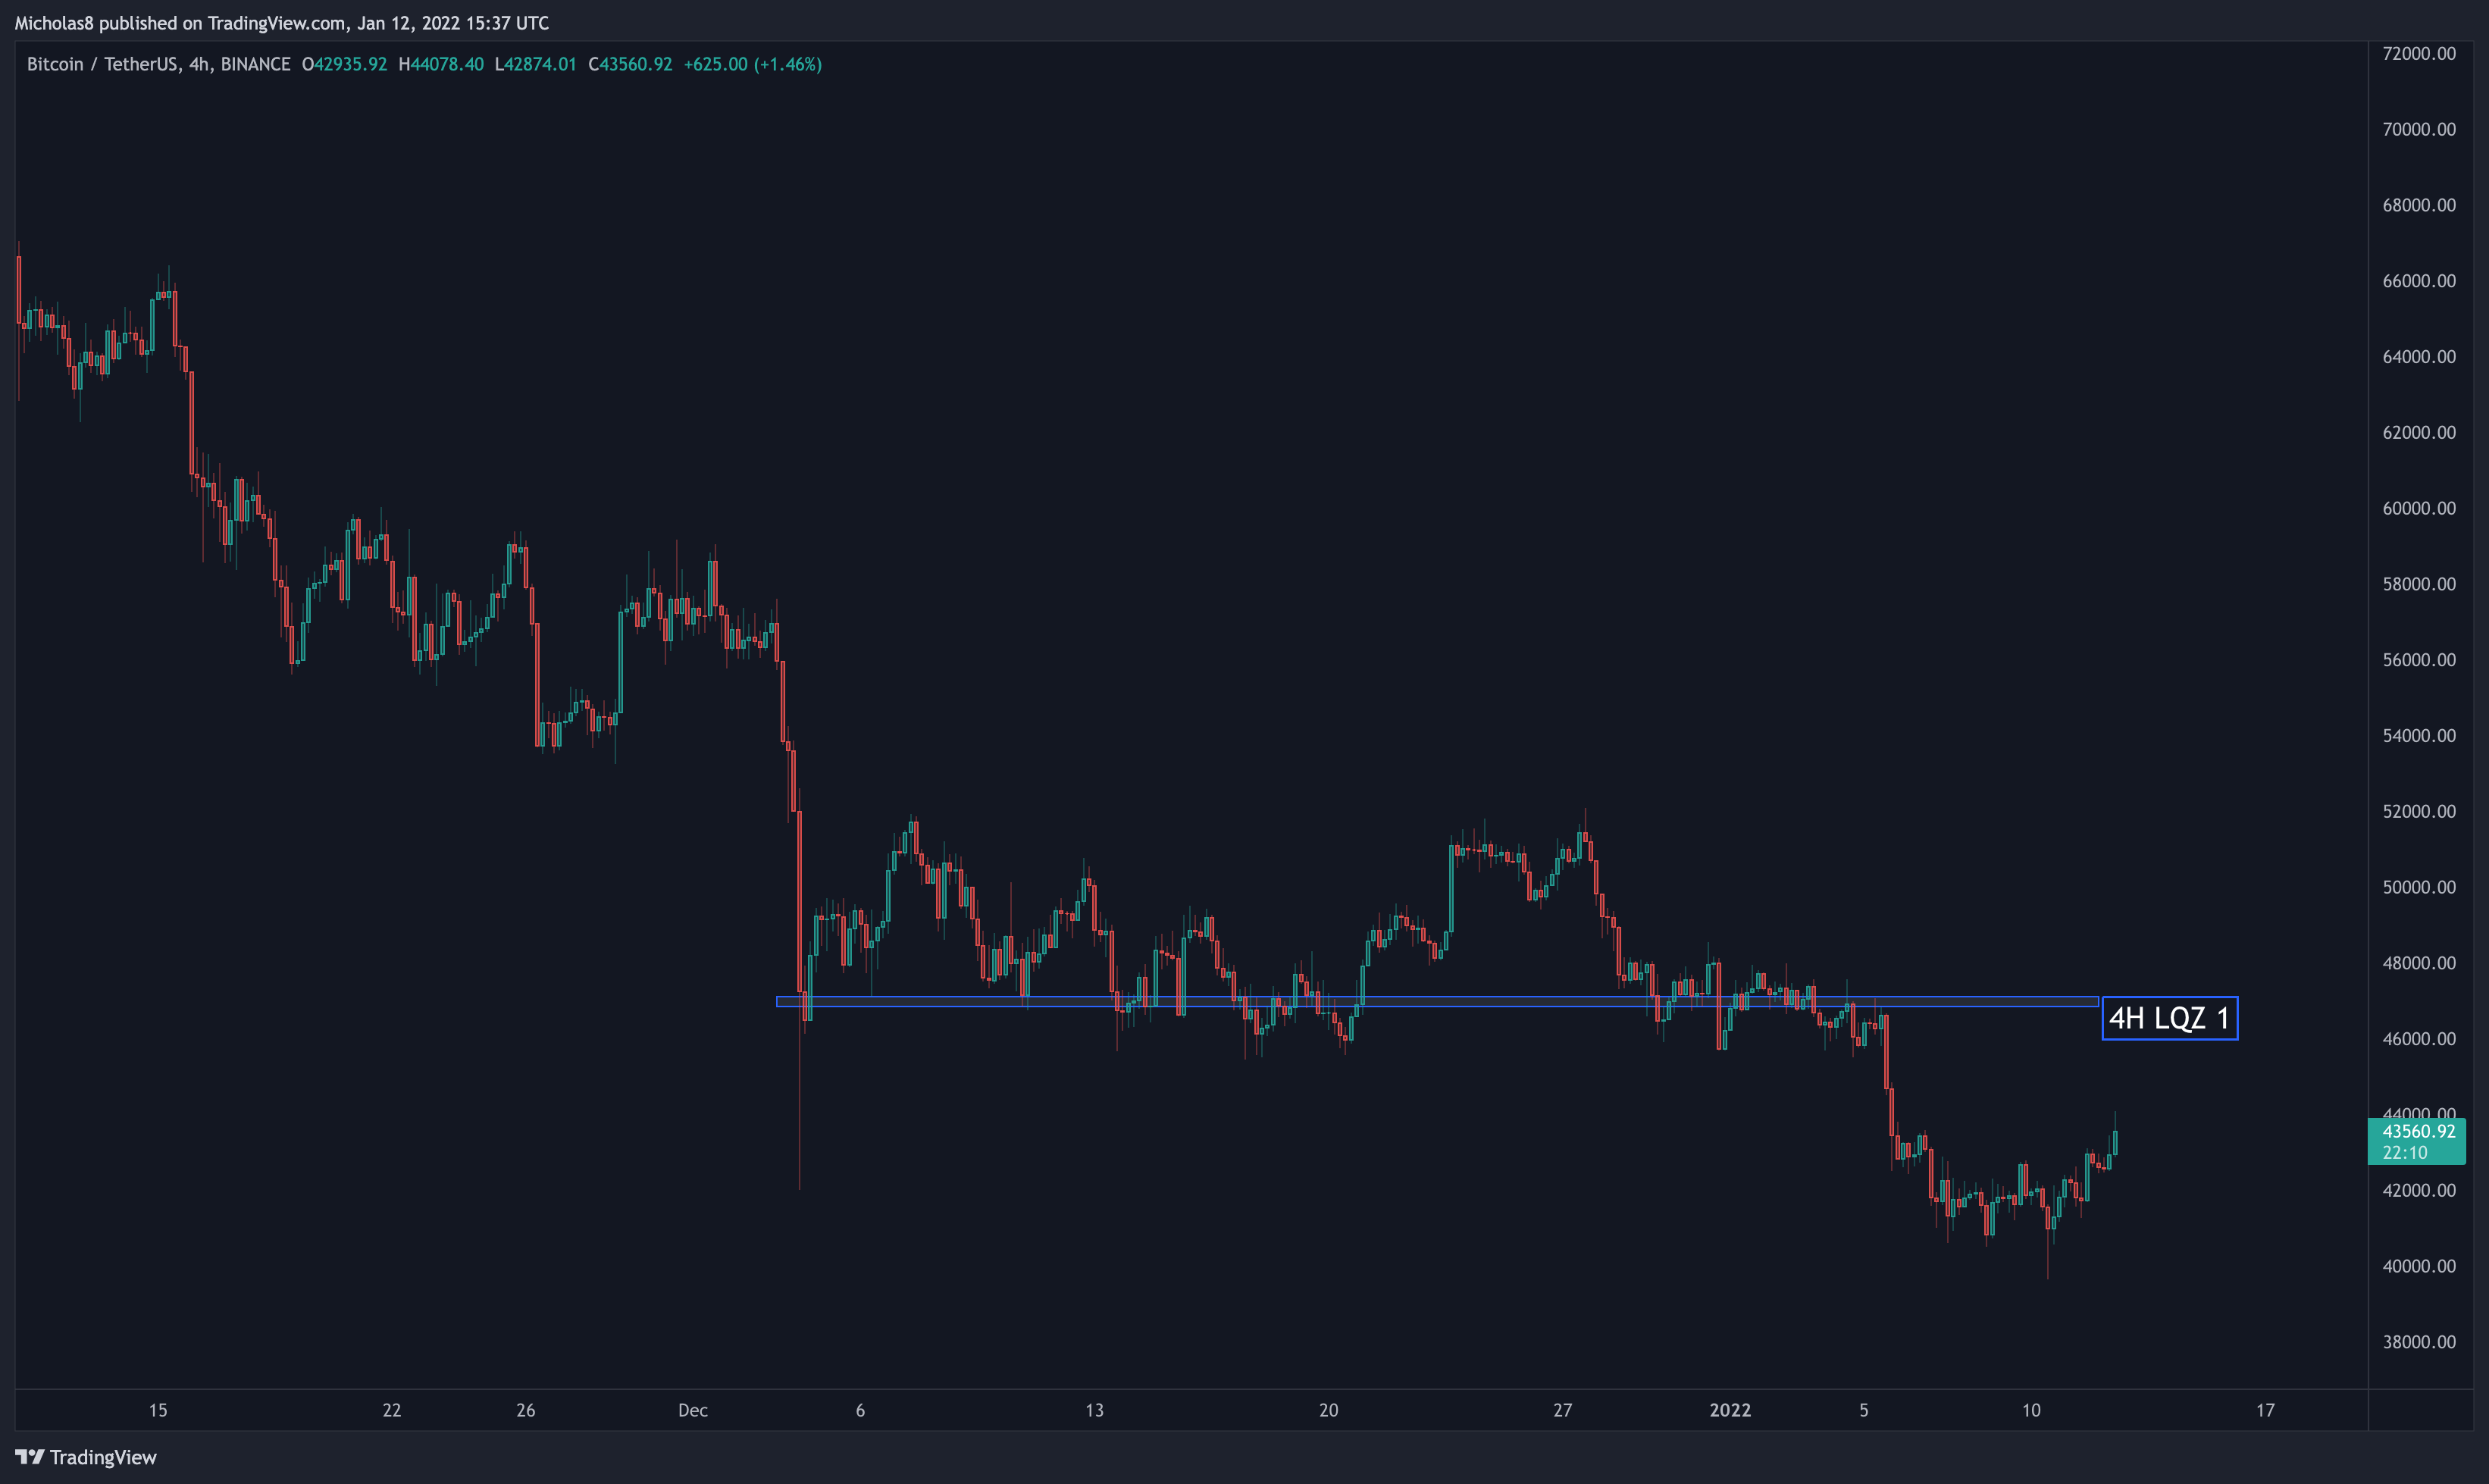
Zone 1: Bitcoin continues to trade below the LQZ sitting at 46.8k-47.1k.
Zone 2: There is now a new LQZ at 41.7k-42k which Bitcoin is currently finding as resistance.
Implications: We may see these serve as resistance moving forward.
EMA Ribbon
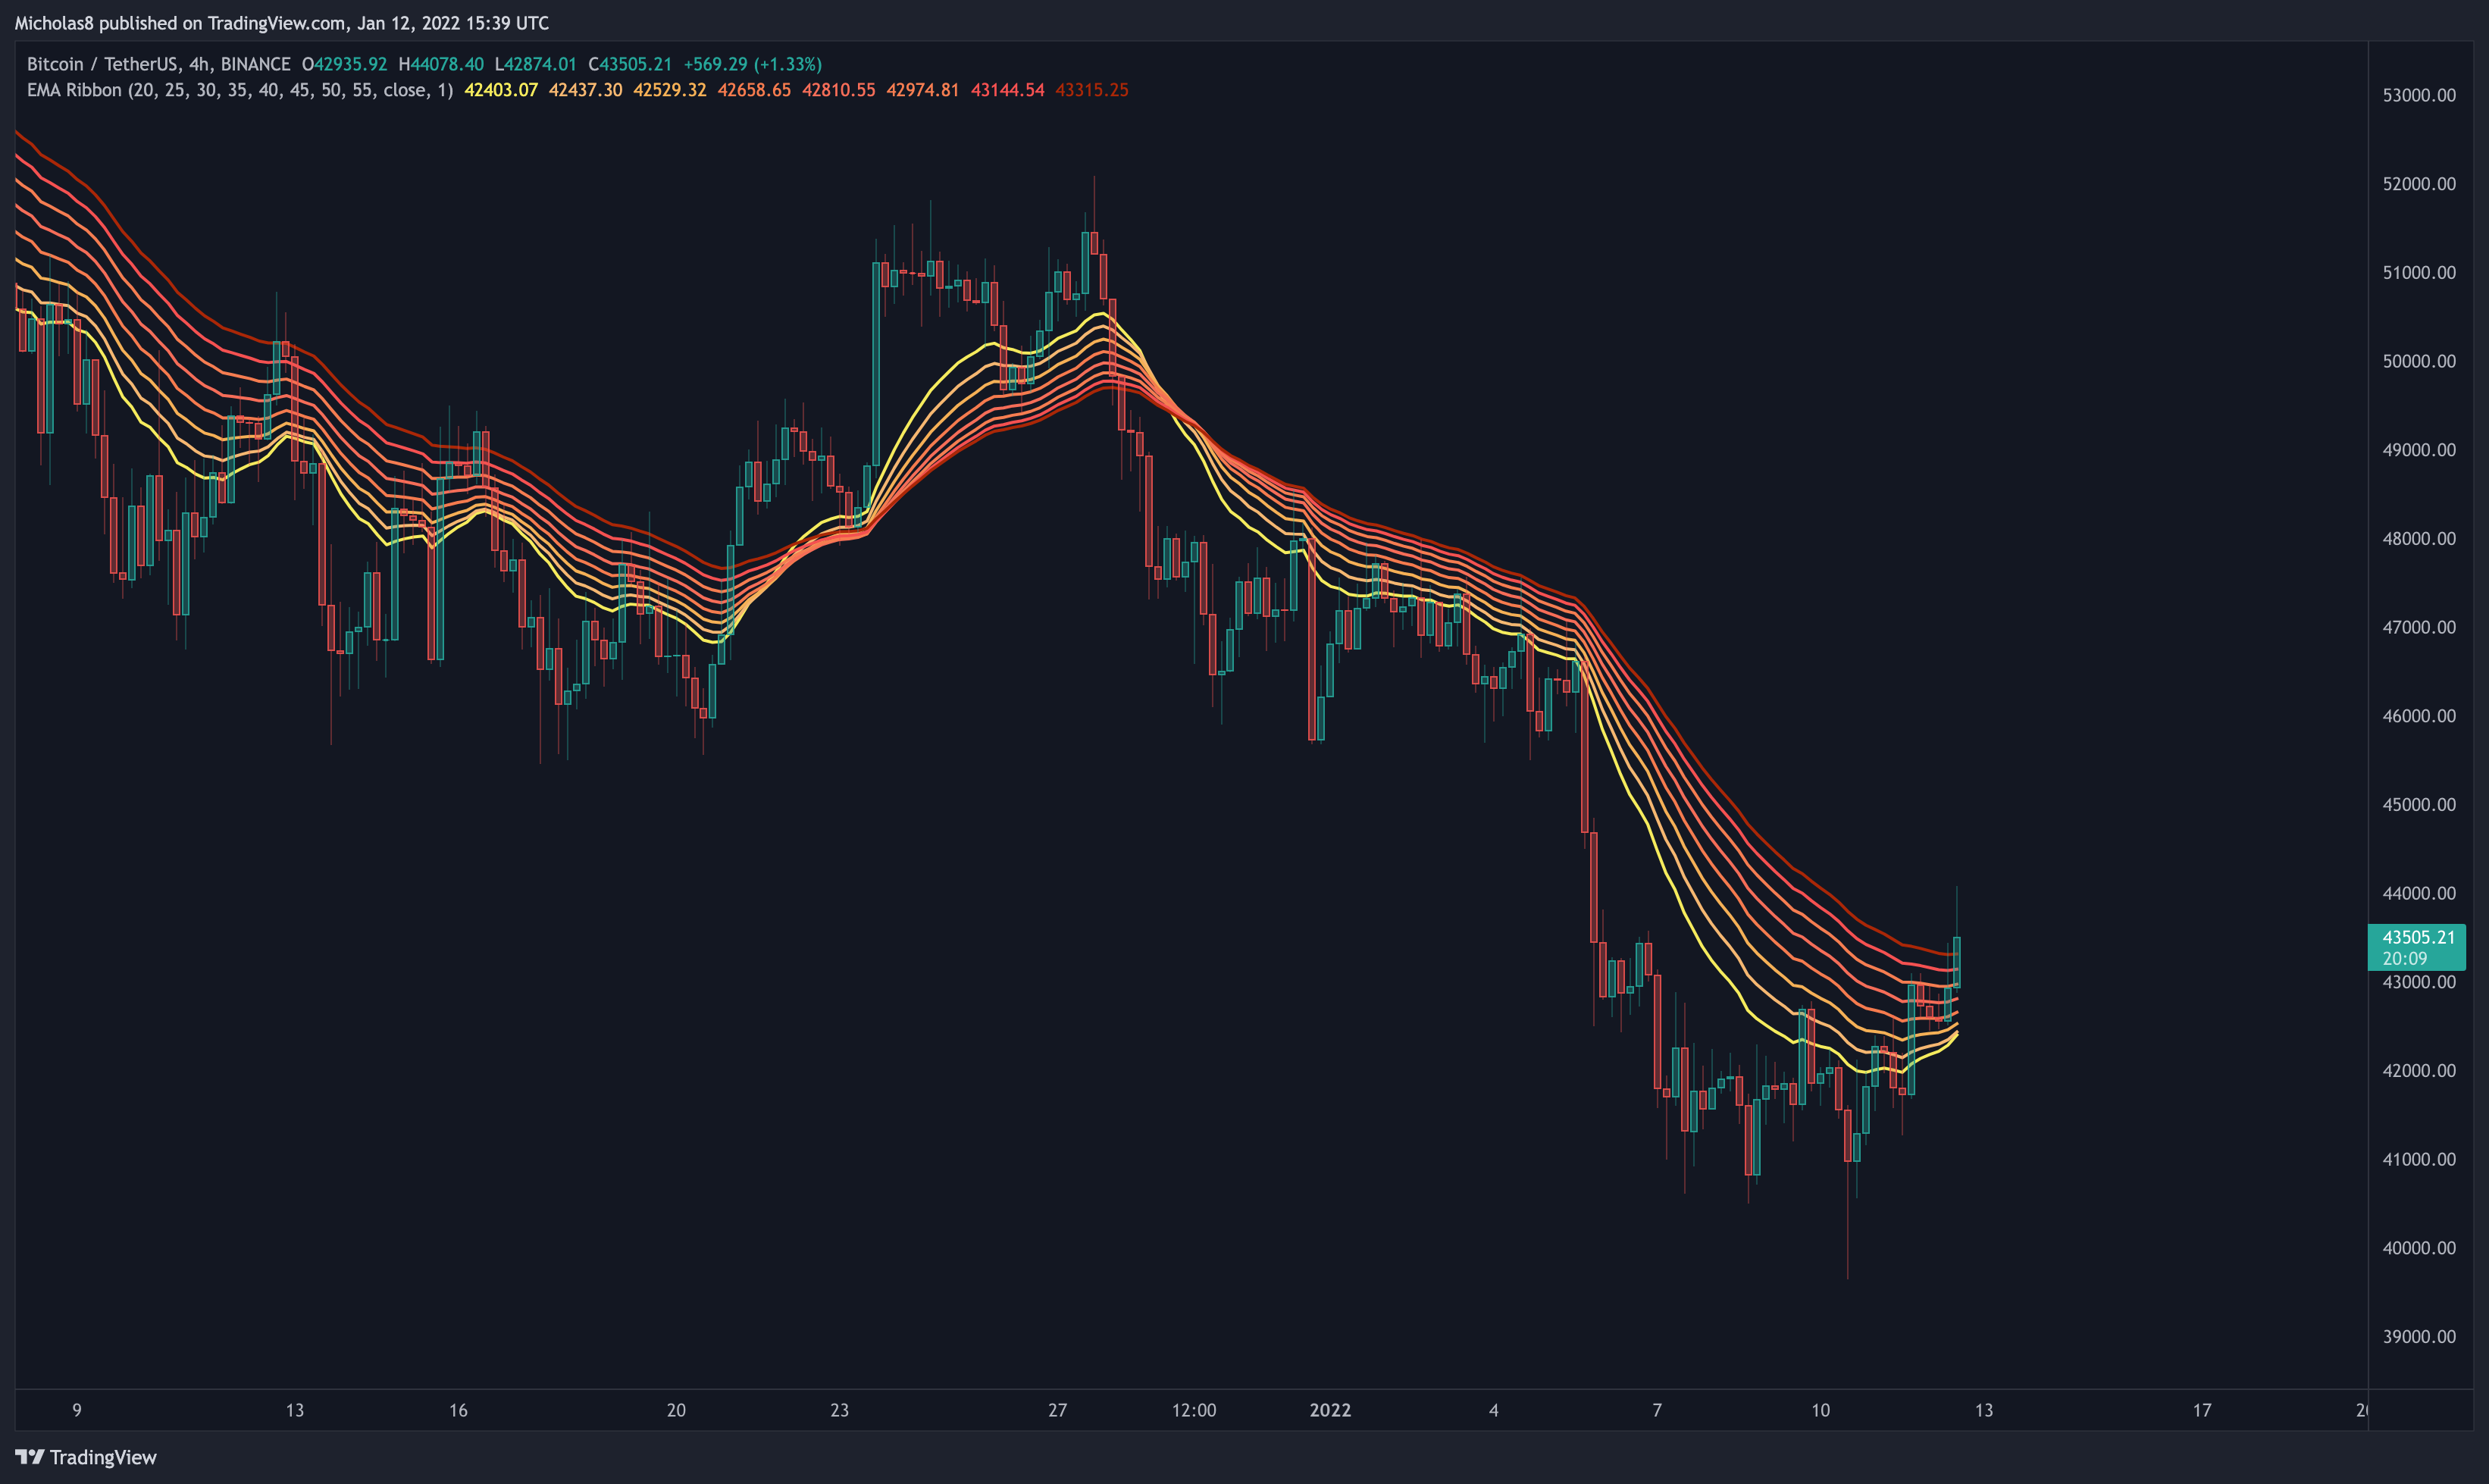
Bitcoin has lost the EMA ribbon as support in this timeframe.
Implication: It may end up serving as strong resistance.
What is an EMA ribbon? A 'ribbon' of EMAs that together indicate bearish and bullish momentum in the market. When an asset is trading is above the ribbon, it's considered bullish. Vice-versa.
Simple Moving Averages (SMA): 200
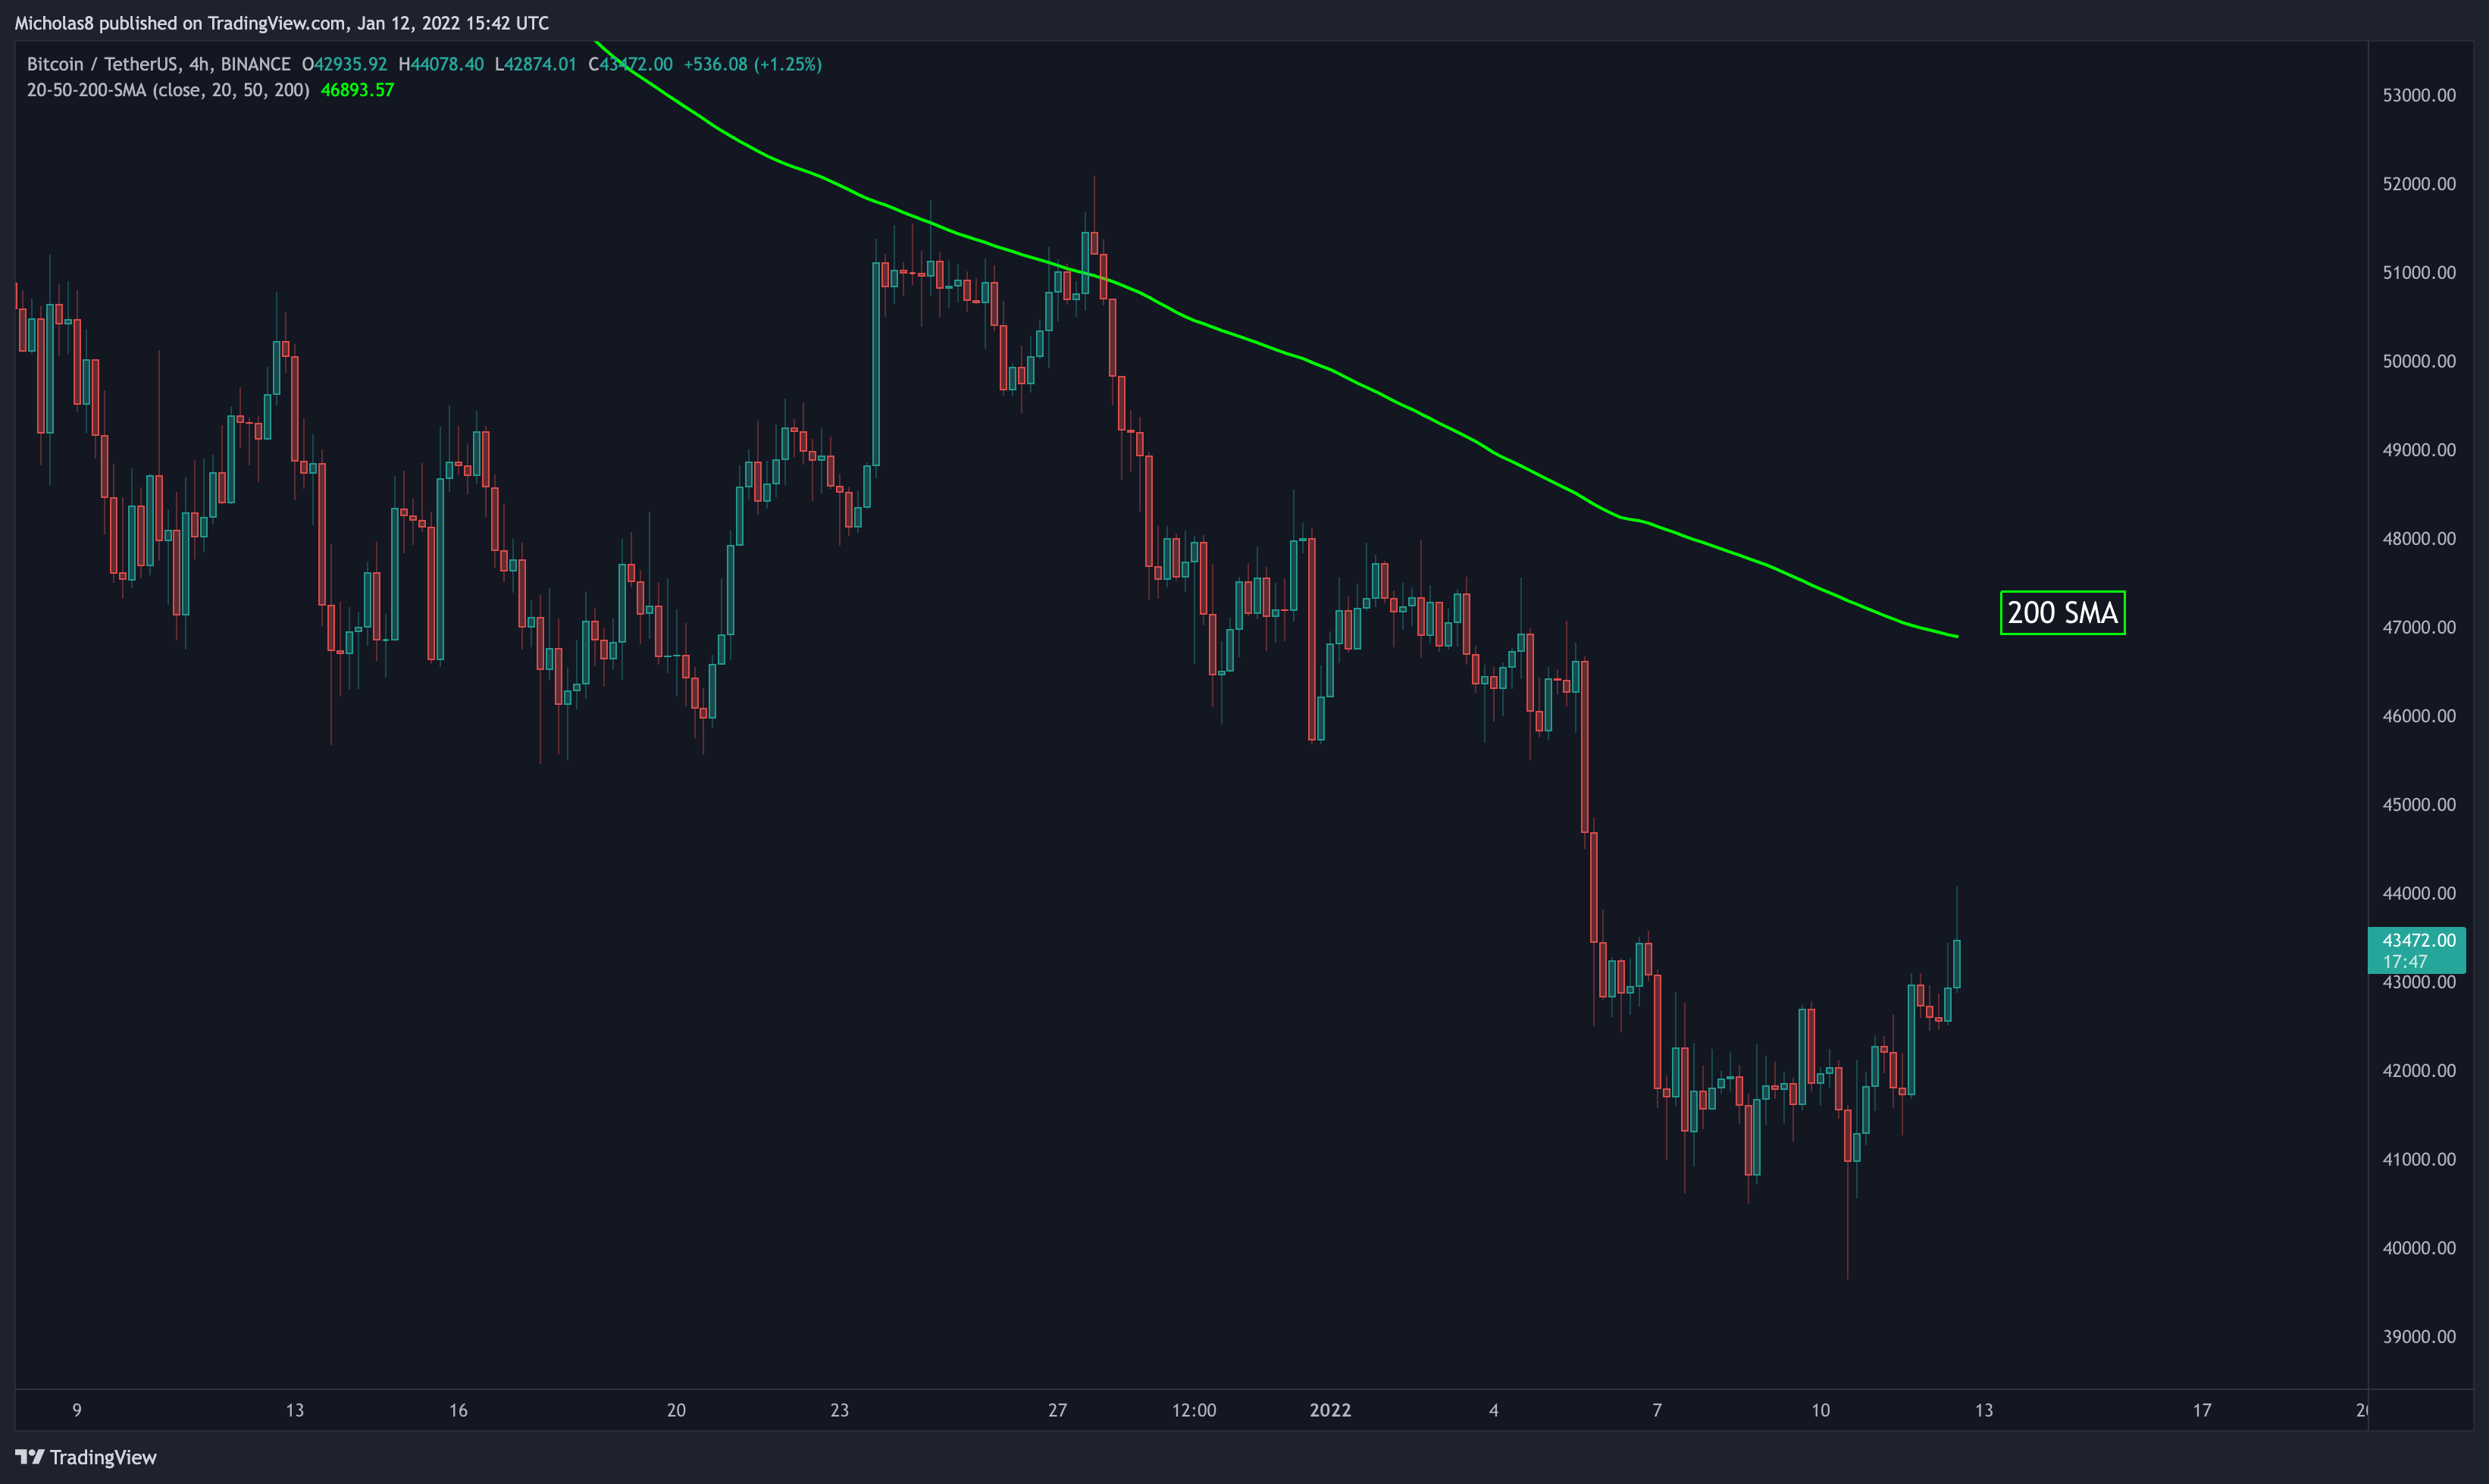
Bitcoin continues to trade below this SMA.
Implication: This may serve as resistance moving forward.
Divergences
Hidden Bearish Divergence
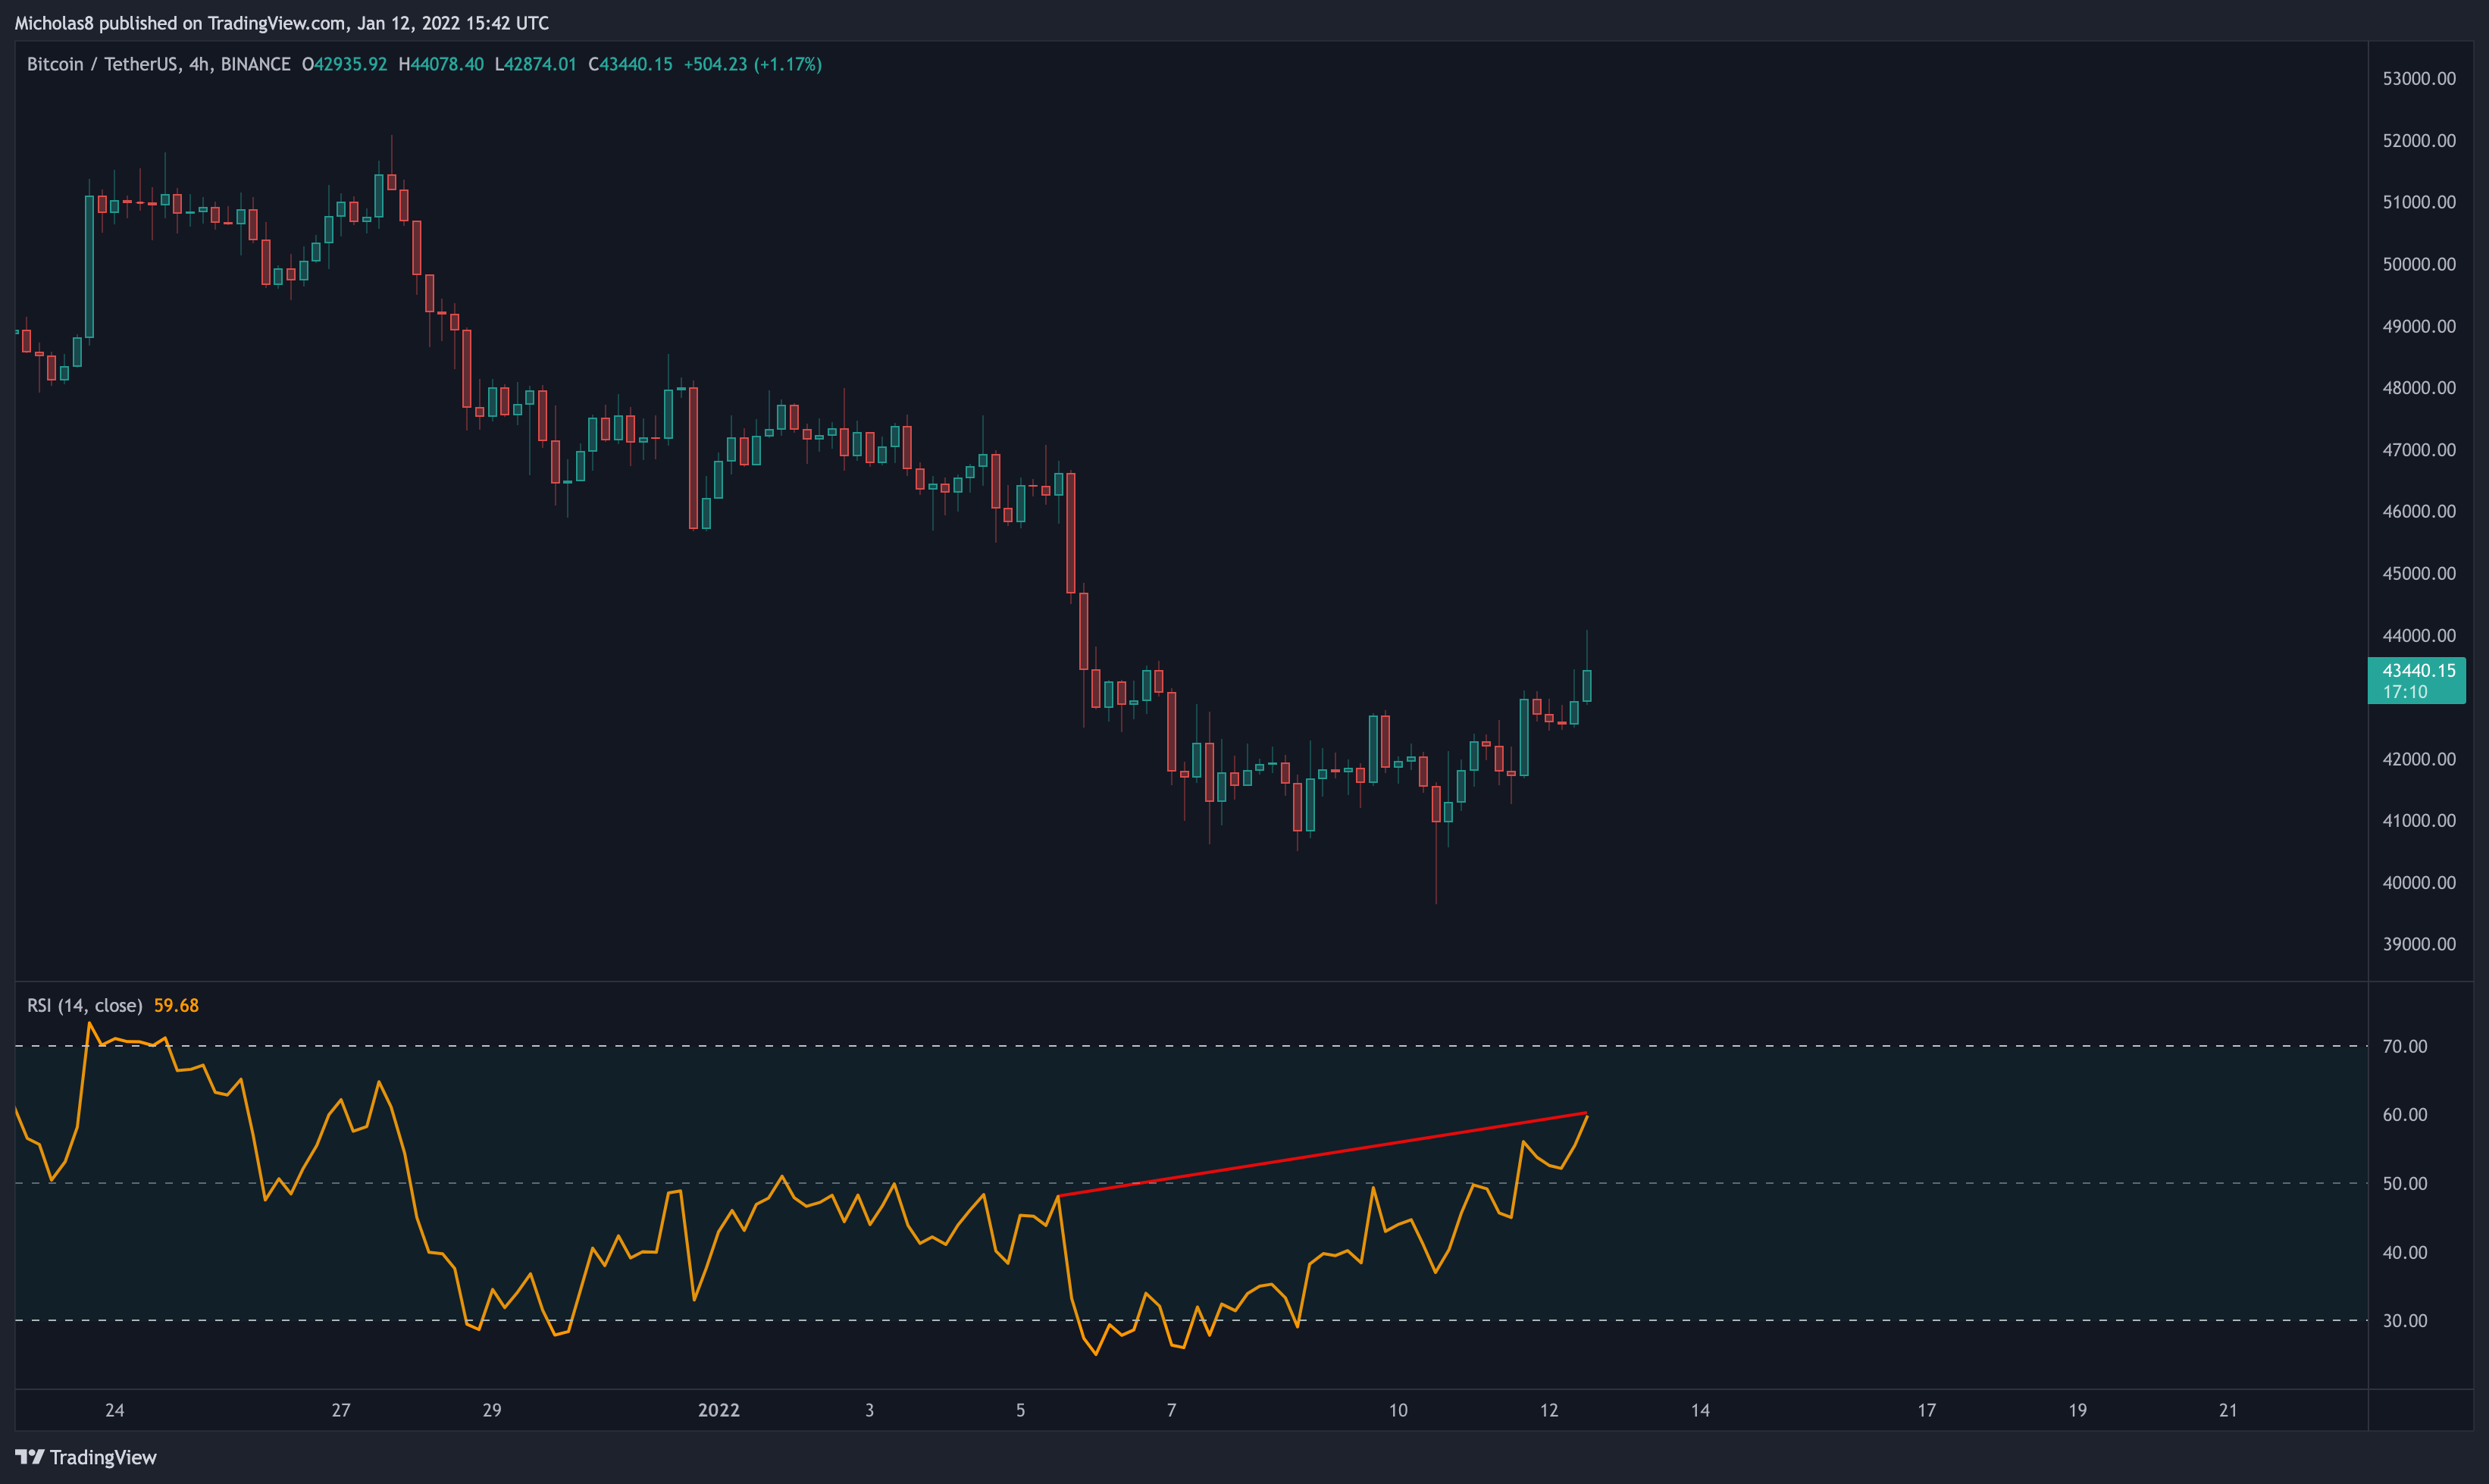
Bitcoin has a lower high in price, with a higher high on the RSI. This is a hidden bearish divergence, which signals a possible trend continuation down.
Invalidation: Higher high in price and in the RSI.
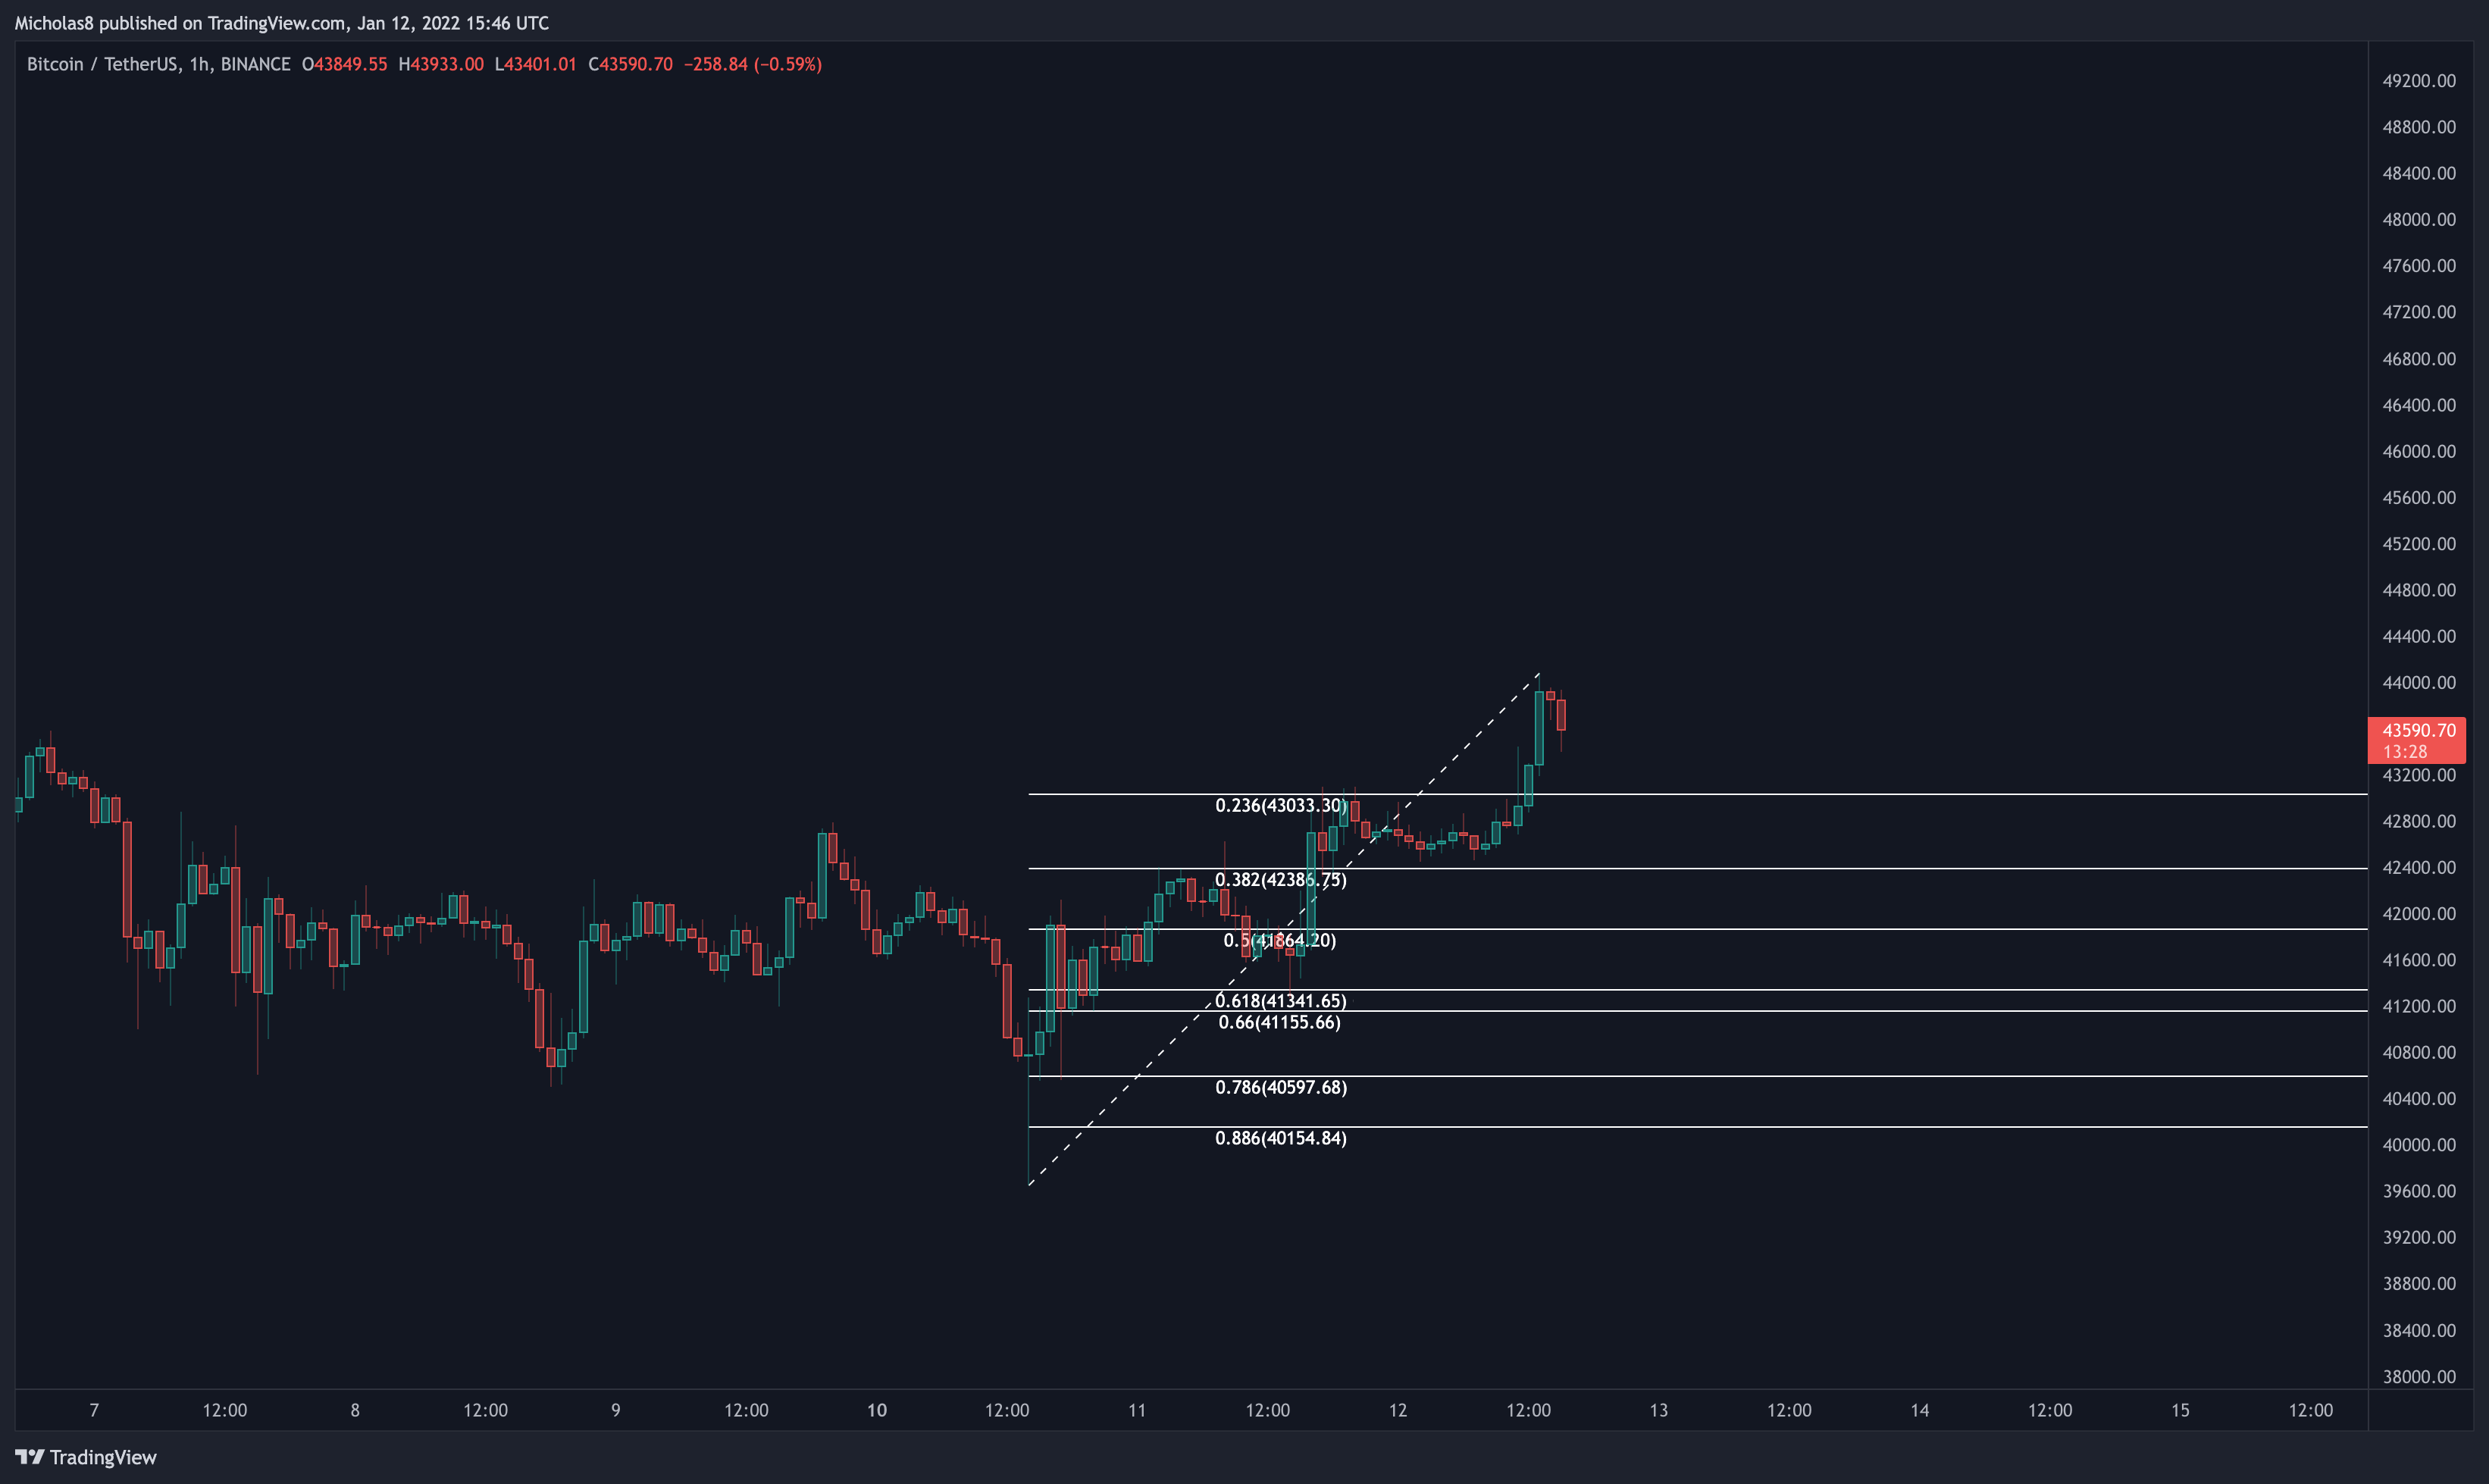
1H Timeframe
Divergences
Bearish Divergence
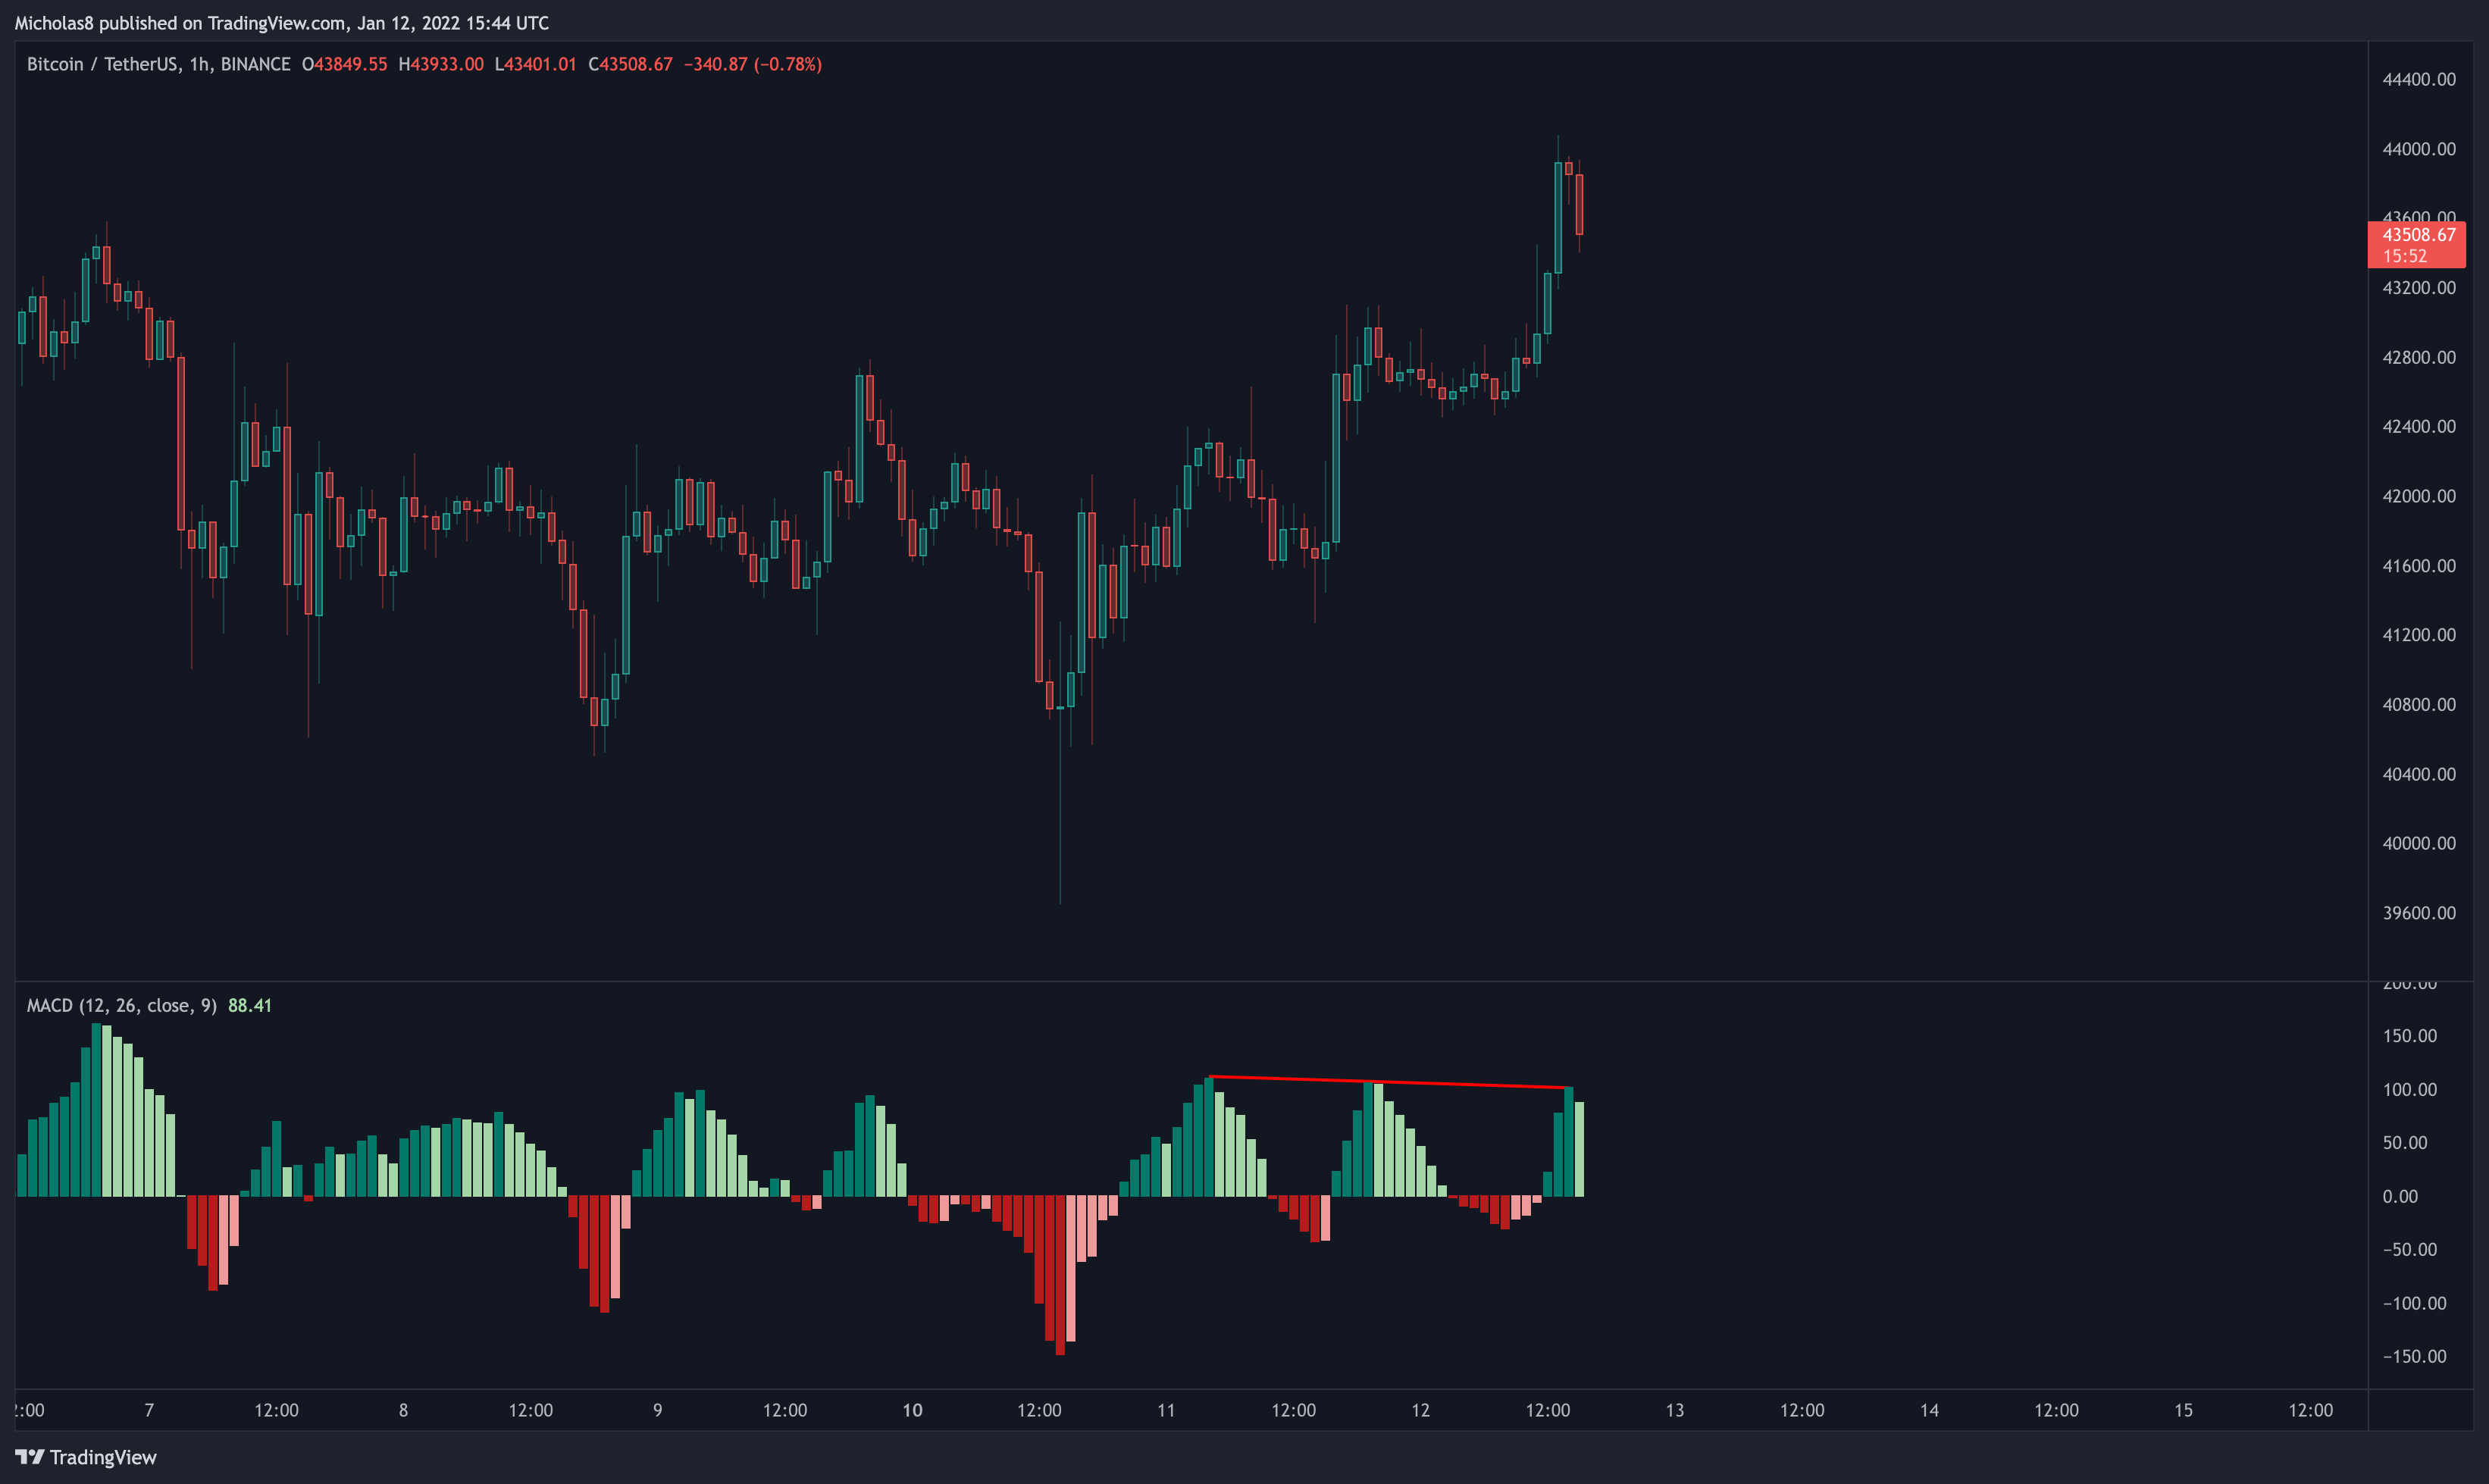
Bitcoin has higher highs in price, with lower highs in the MACD. This is a bearish divergence, which signals a possible trend reversal down.
Invalidation: Higher high in price and in the MACD.
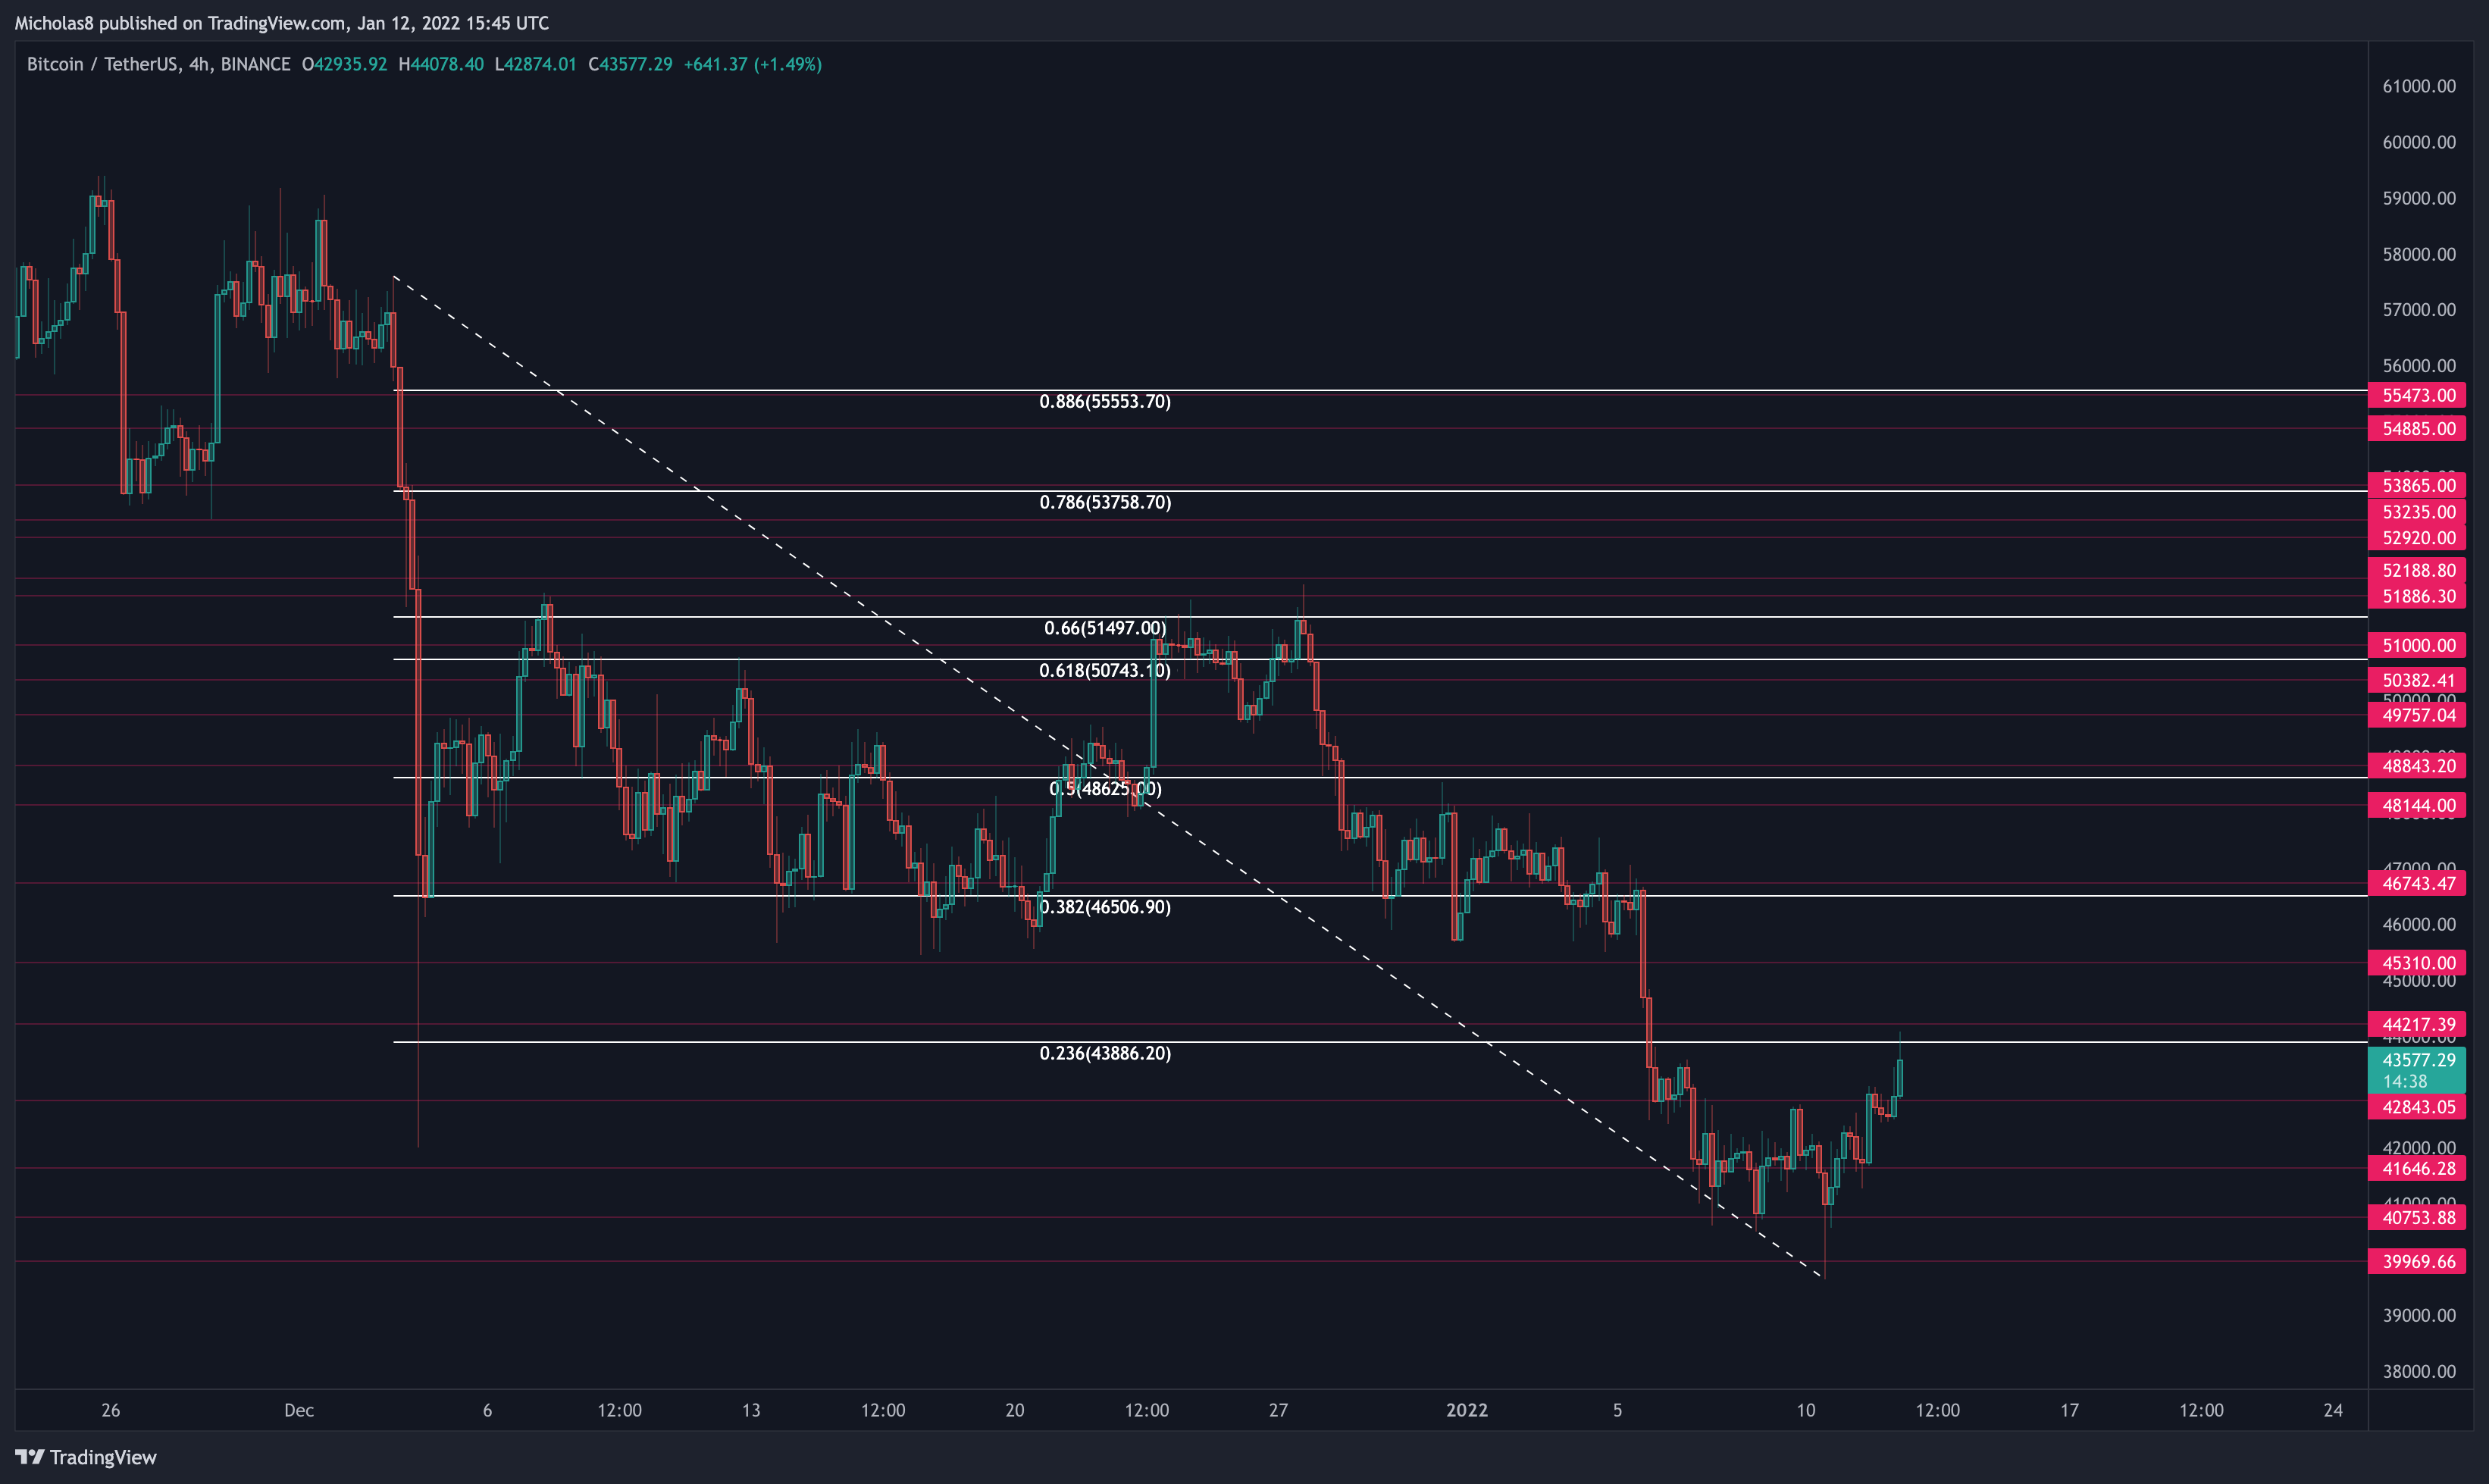
KEY LEVELS
4H Timeframe
39970
40755
41645
42845
44215
45310
46745
48145
48845
49755
50380
51000
51885
52190
52829
53235
53865
54885
55473
Fibonacci levels
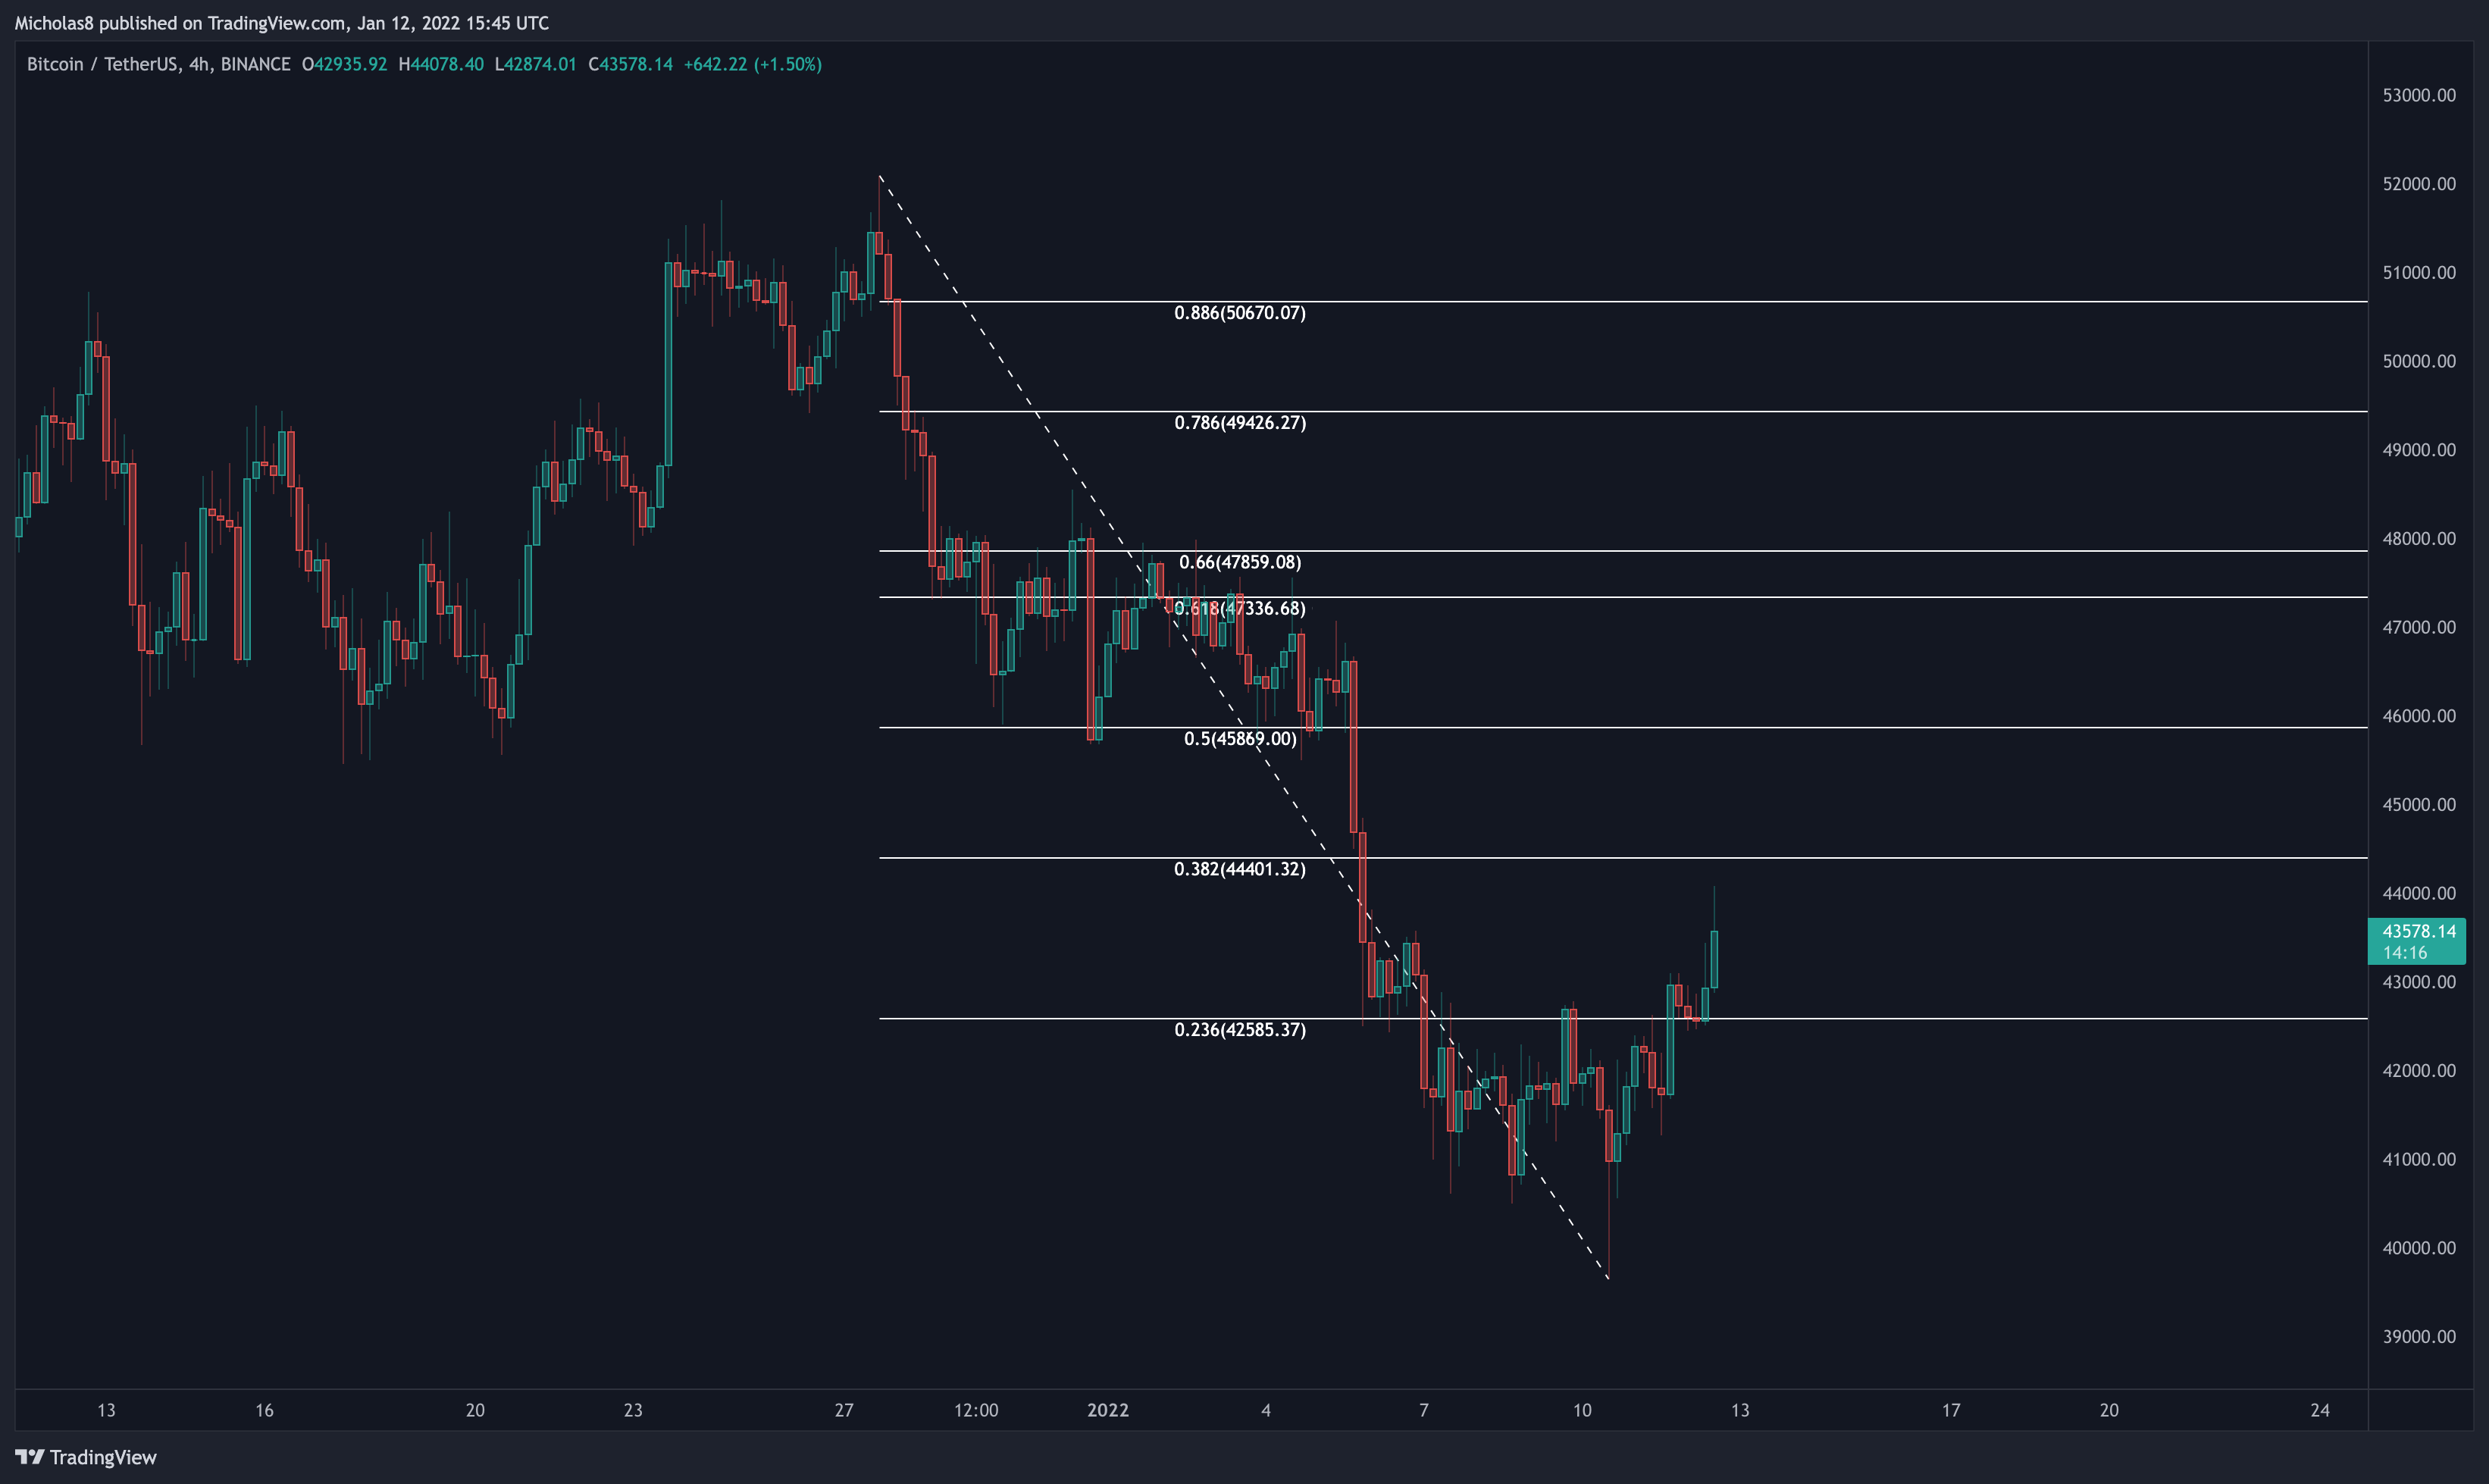
1-hour Timeframe
39650
41000
41200
42000
42430
42885
43580
43815
45455
45900
46130
46585
47320
47920
48315
49190
Fibonacci levels
FINAL THOUGHTS
RECAP FROM LAST NIGHT
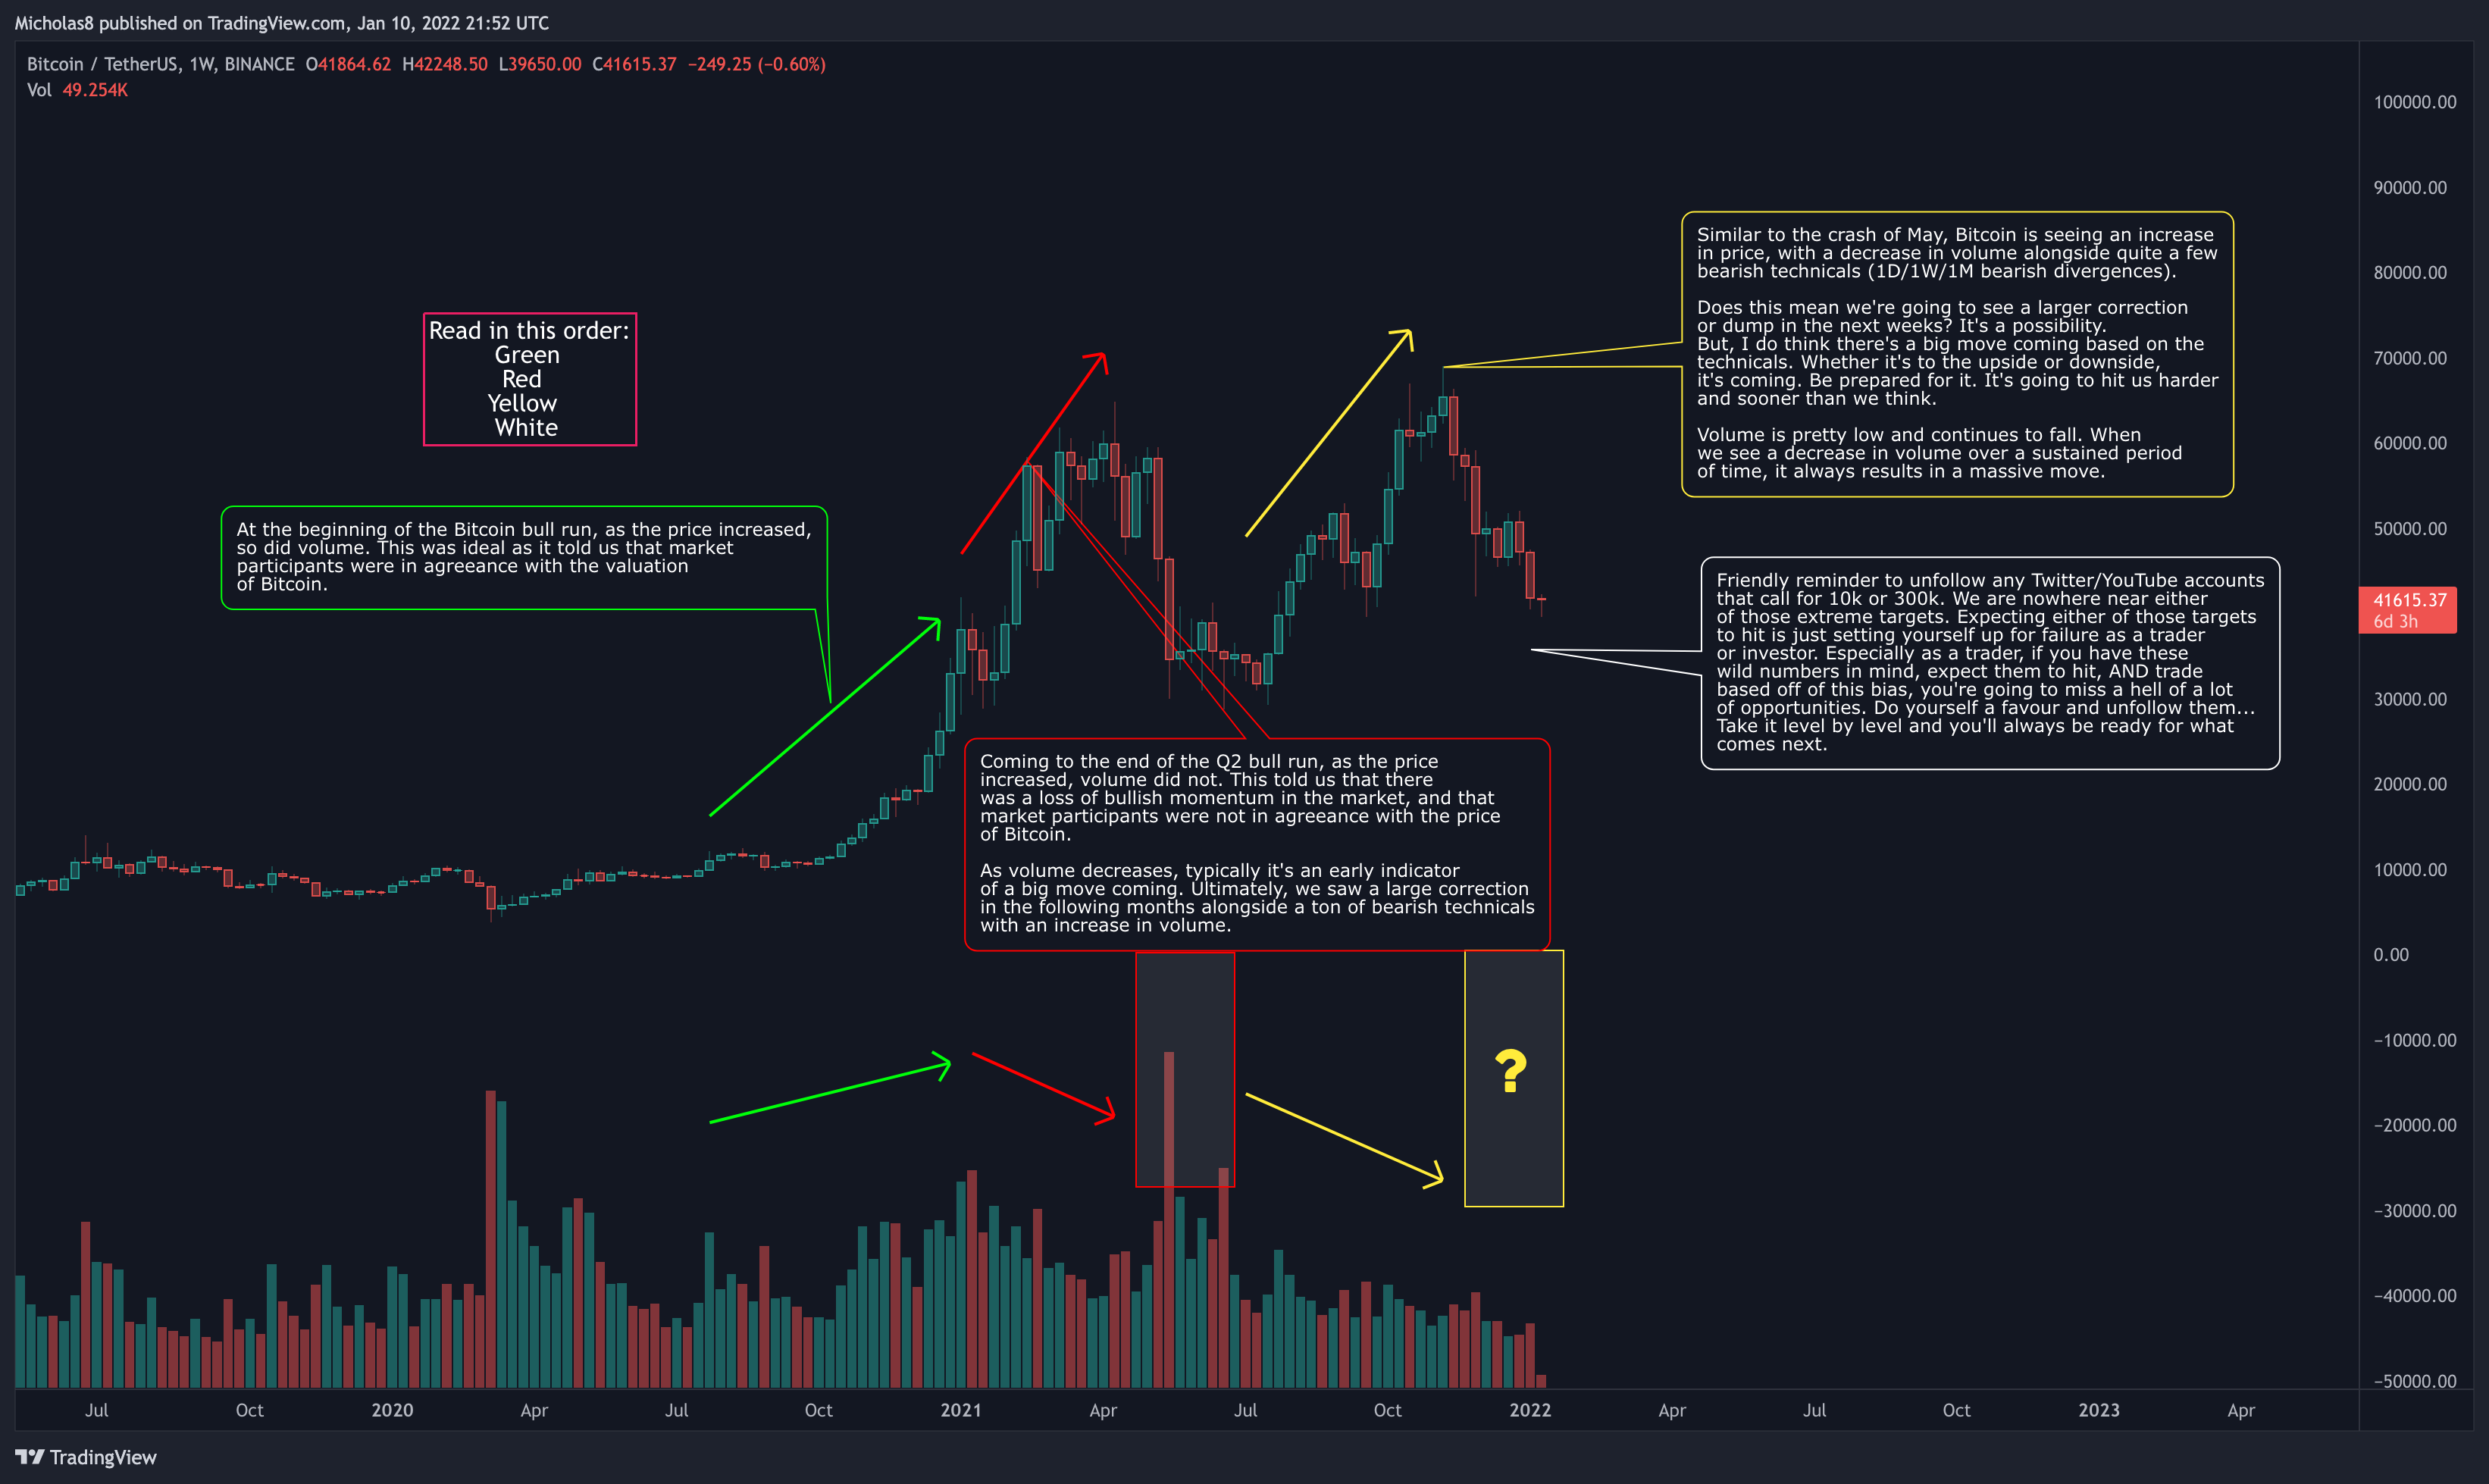
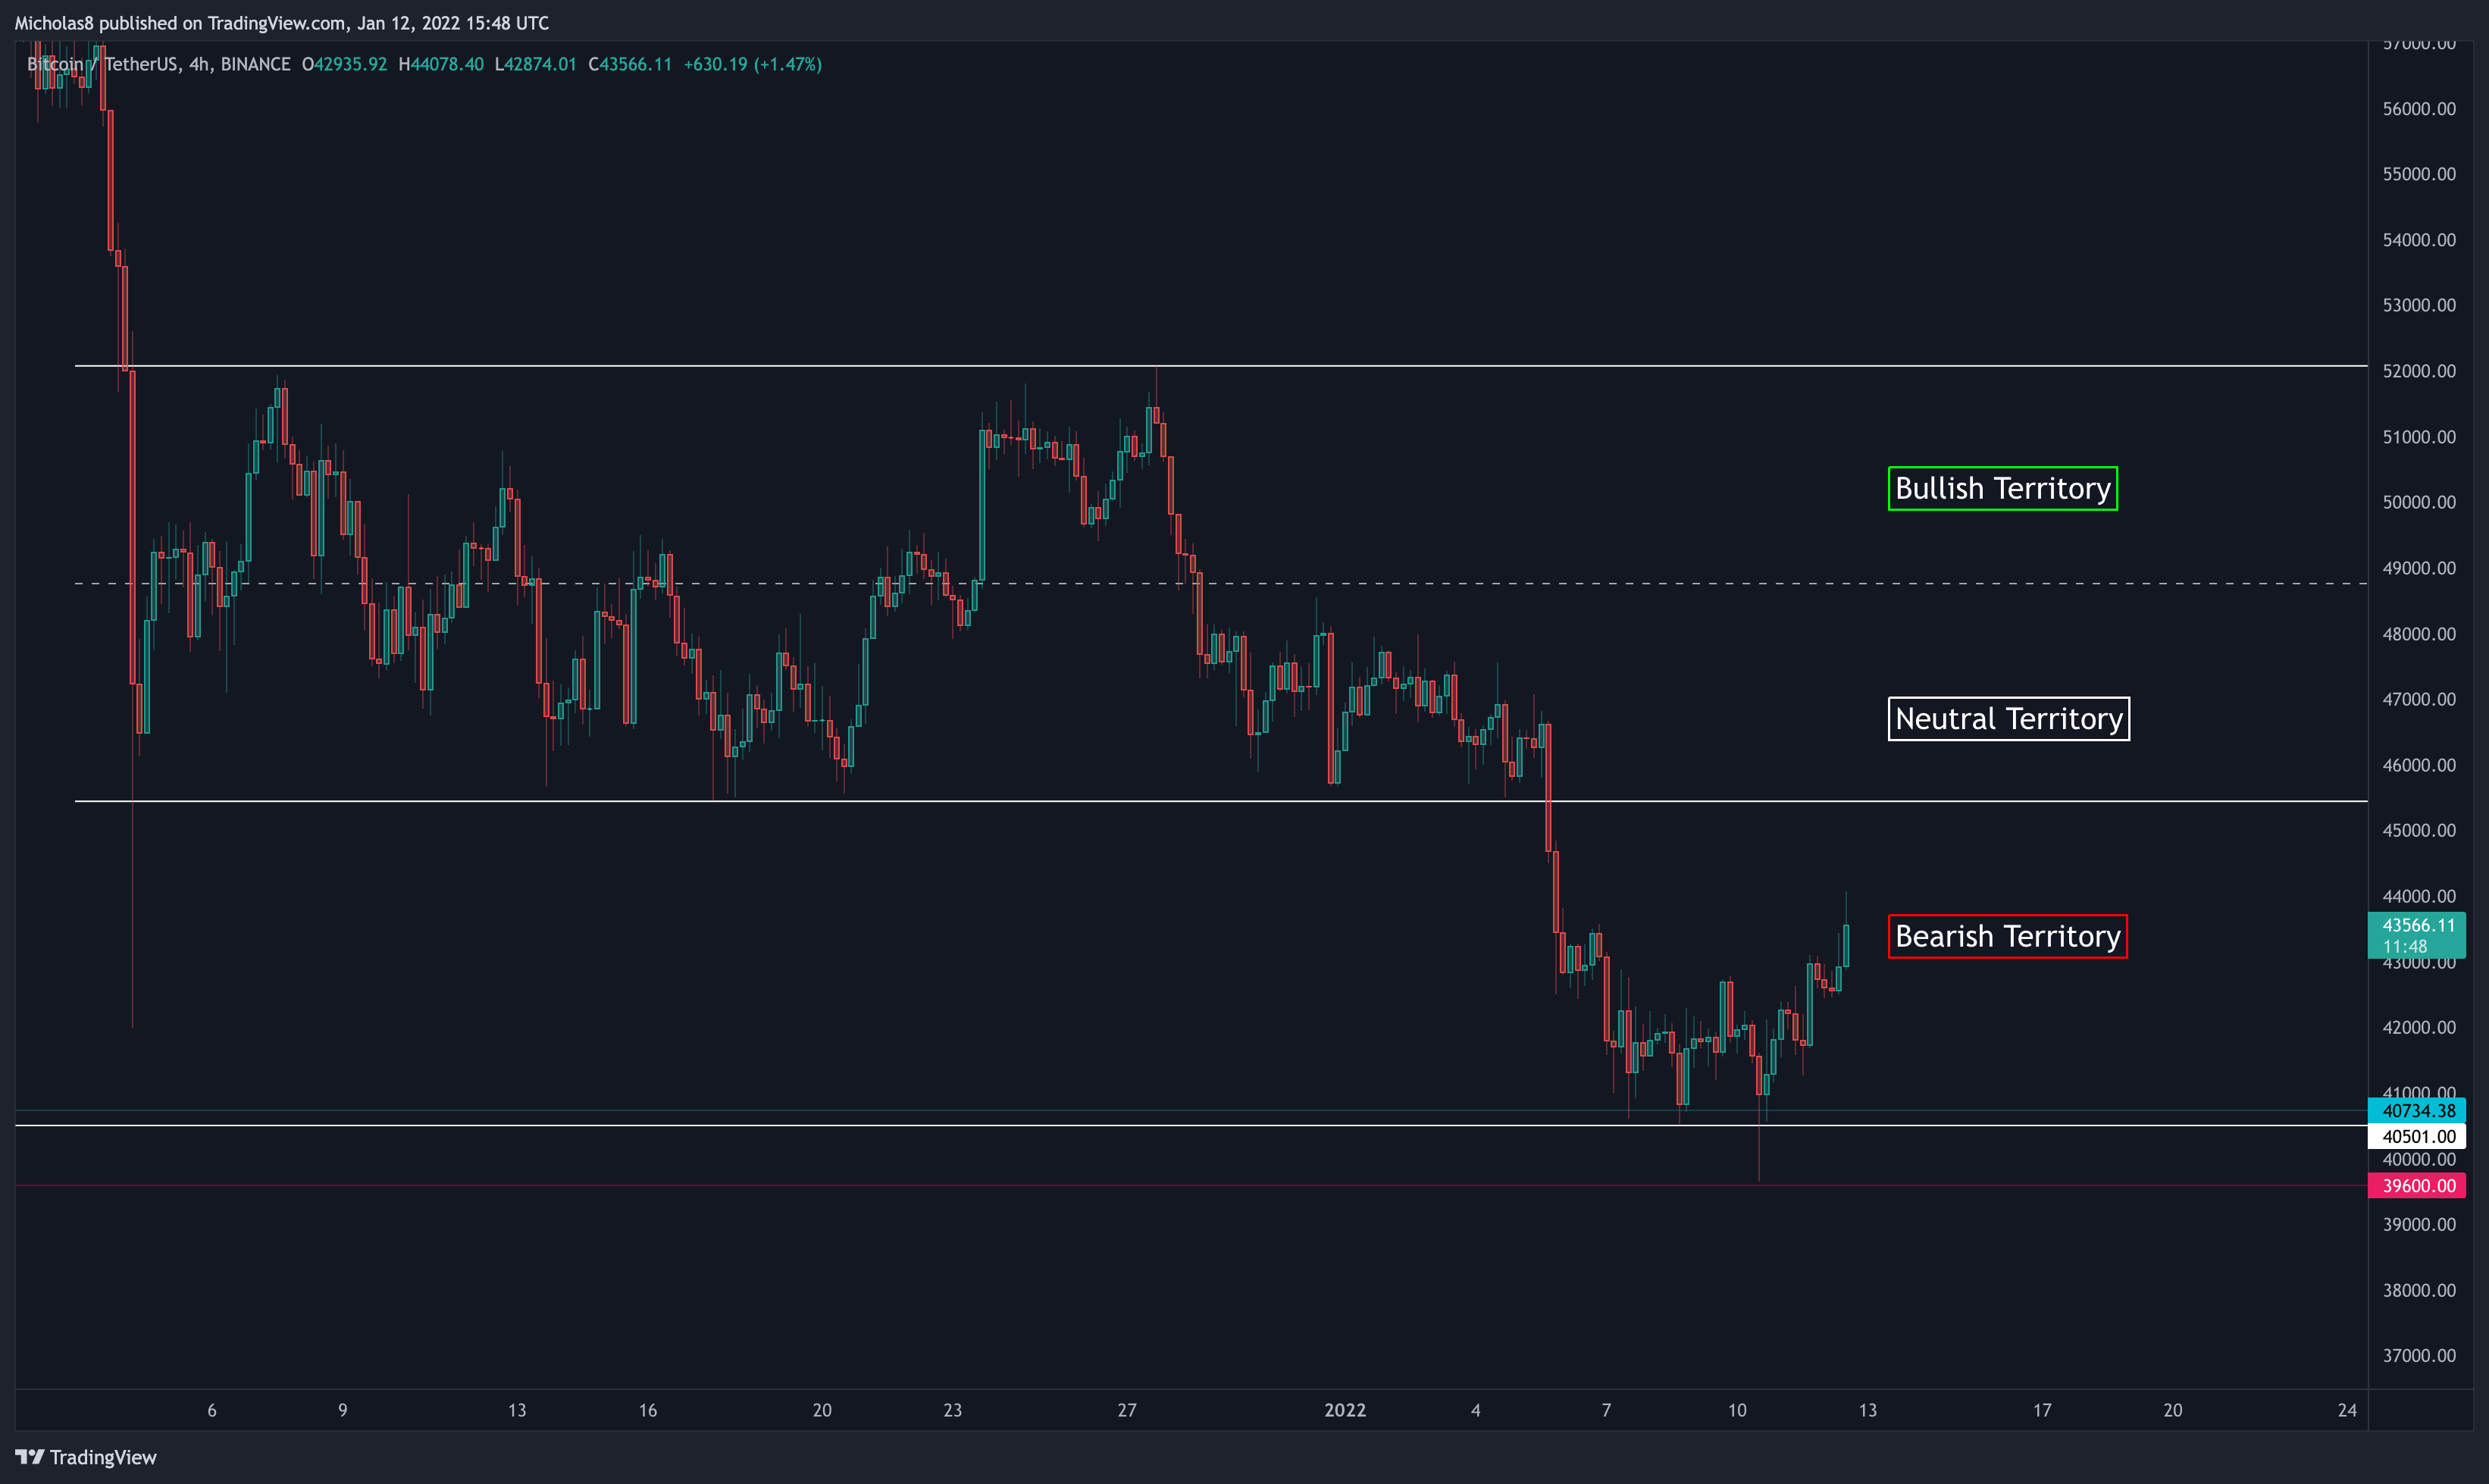
This Macro Volume Analysis still applies.
_
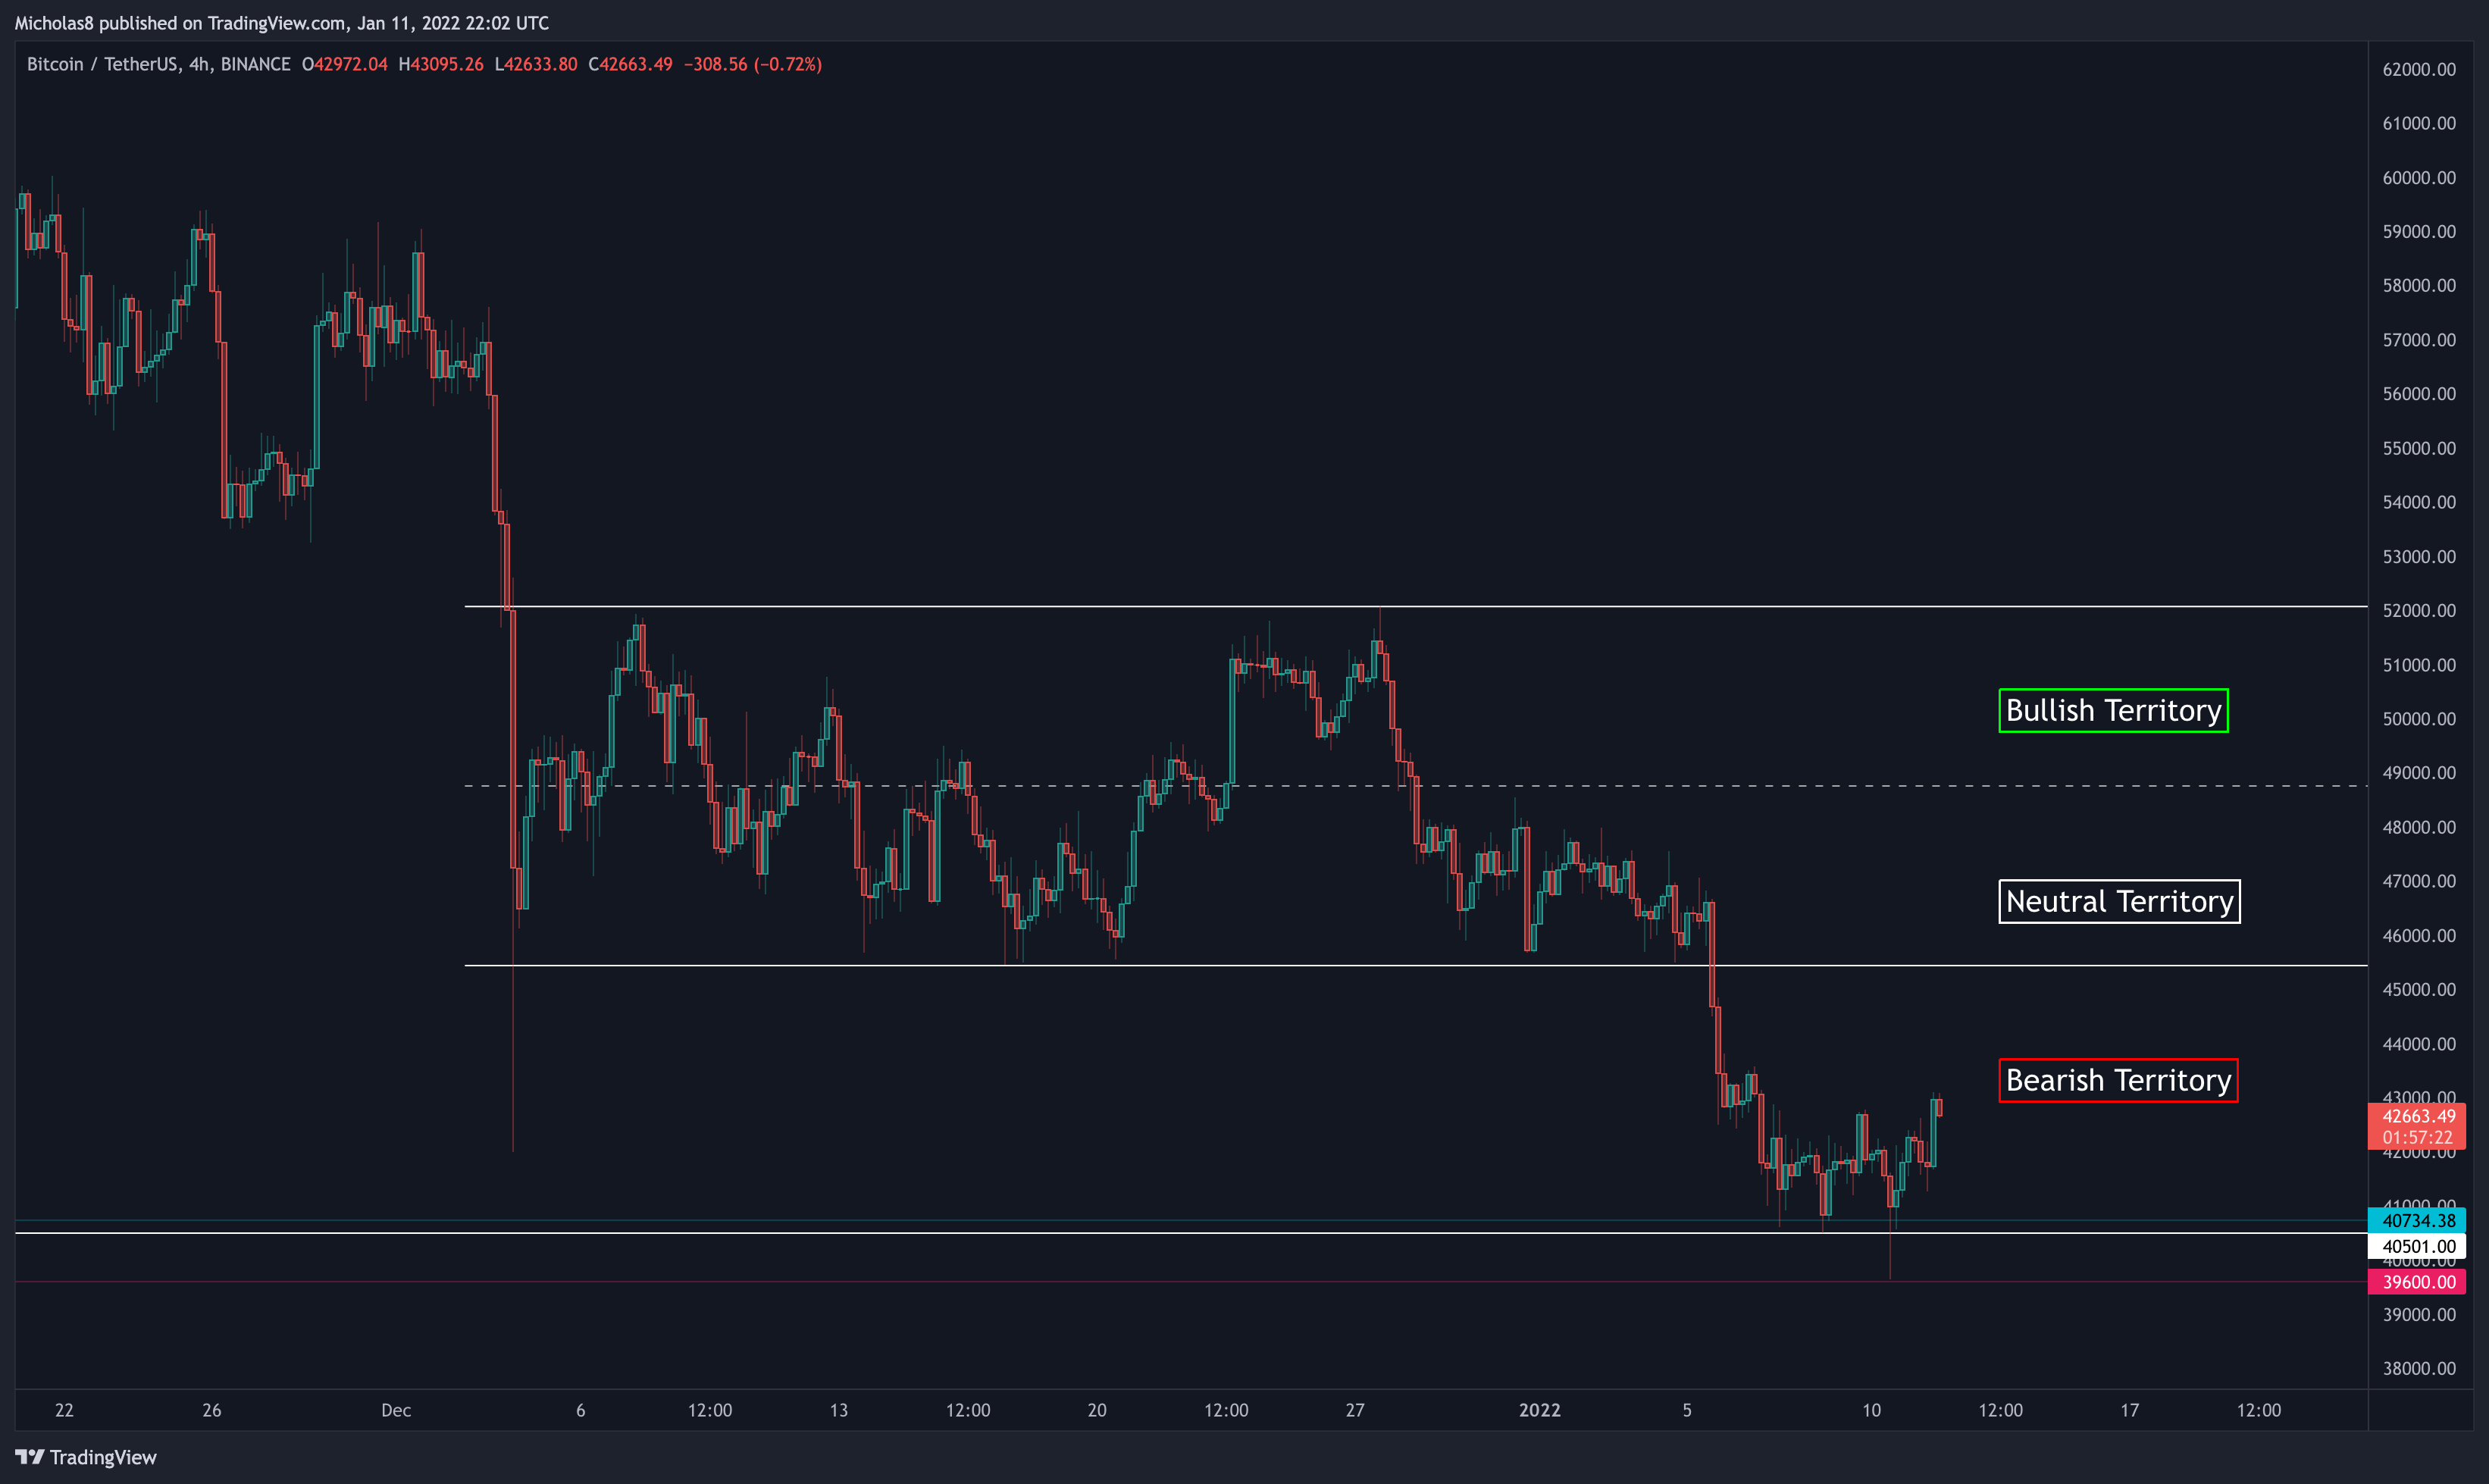
Bitcoin remains trading inside the Bearish Territory.
If we have a look at the current market structure of Bitcoin, we can see that we have actually created a micro higher high. Although this is a step in the right direction, there's still a lot of work to be done as there are many highs still to take out. We'll need to take this level to level.
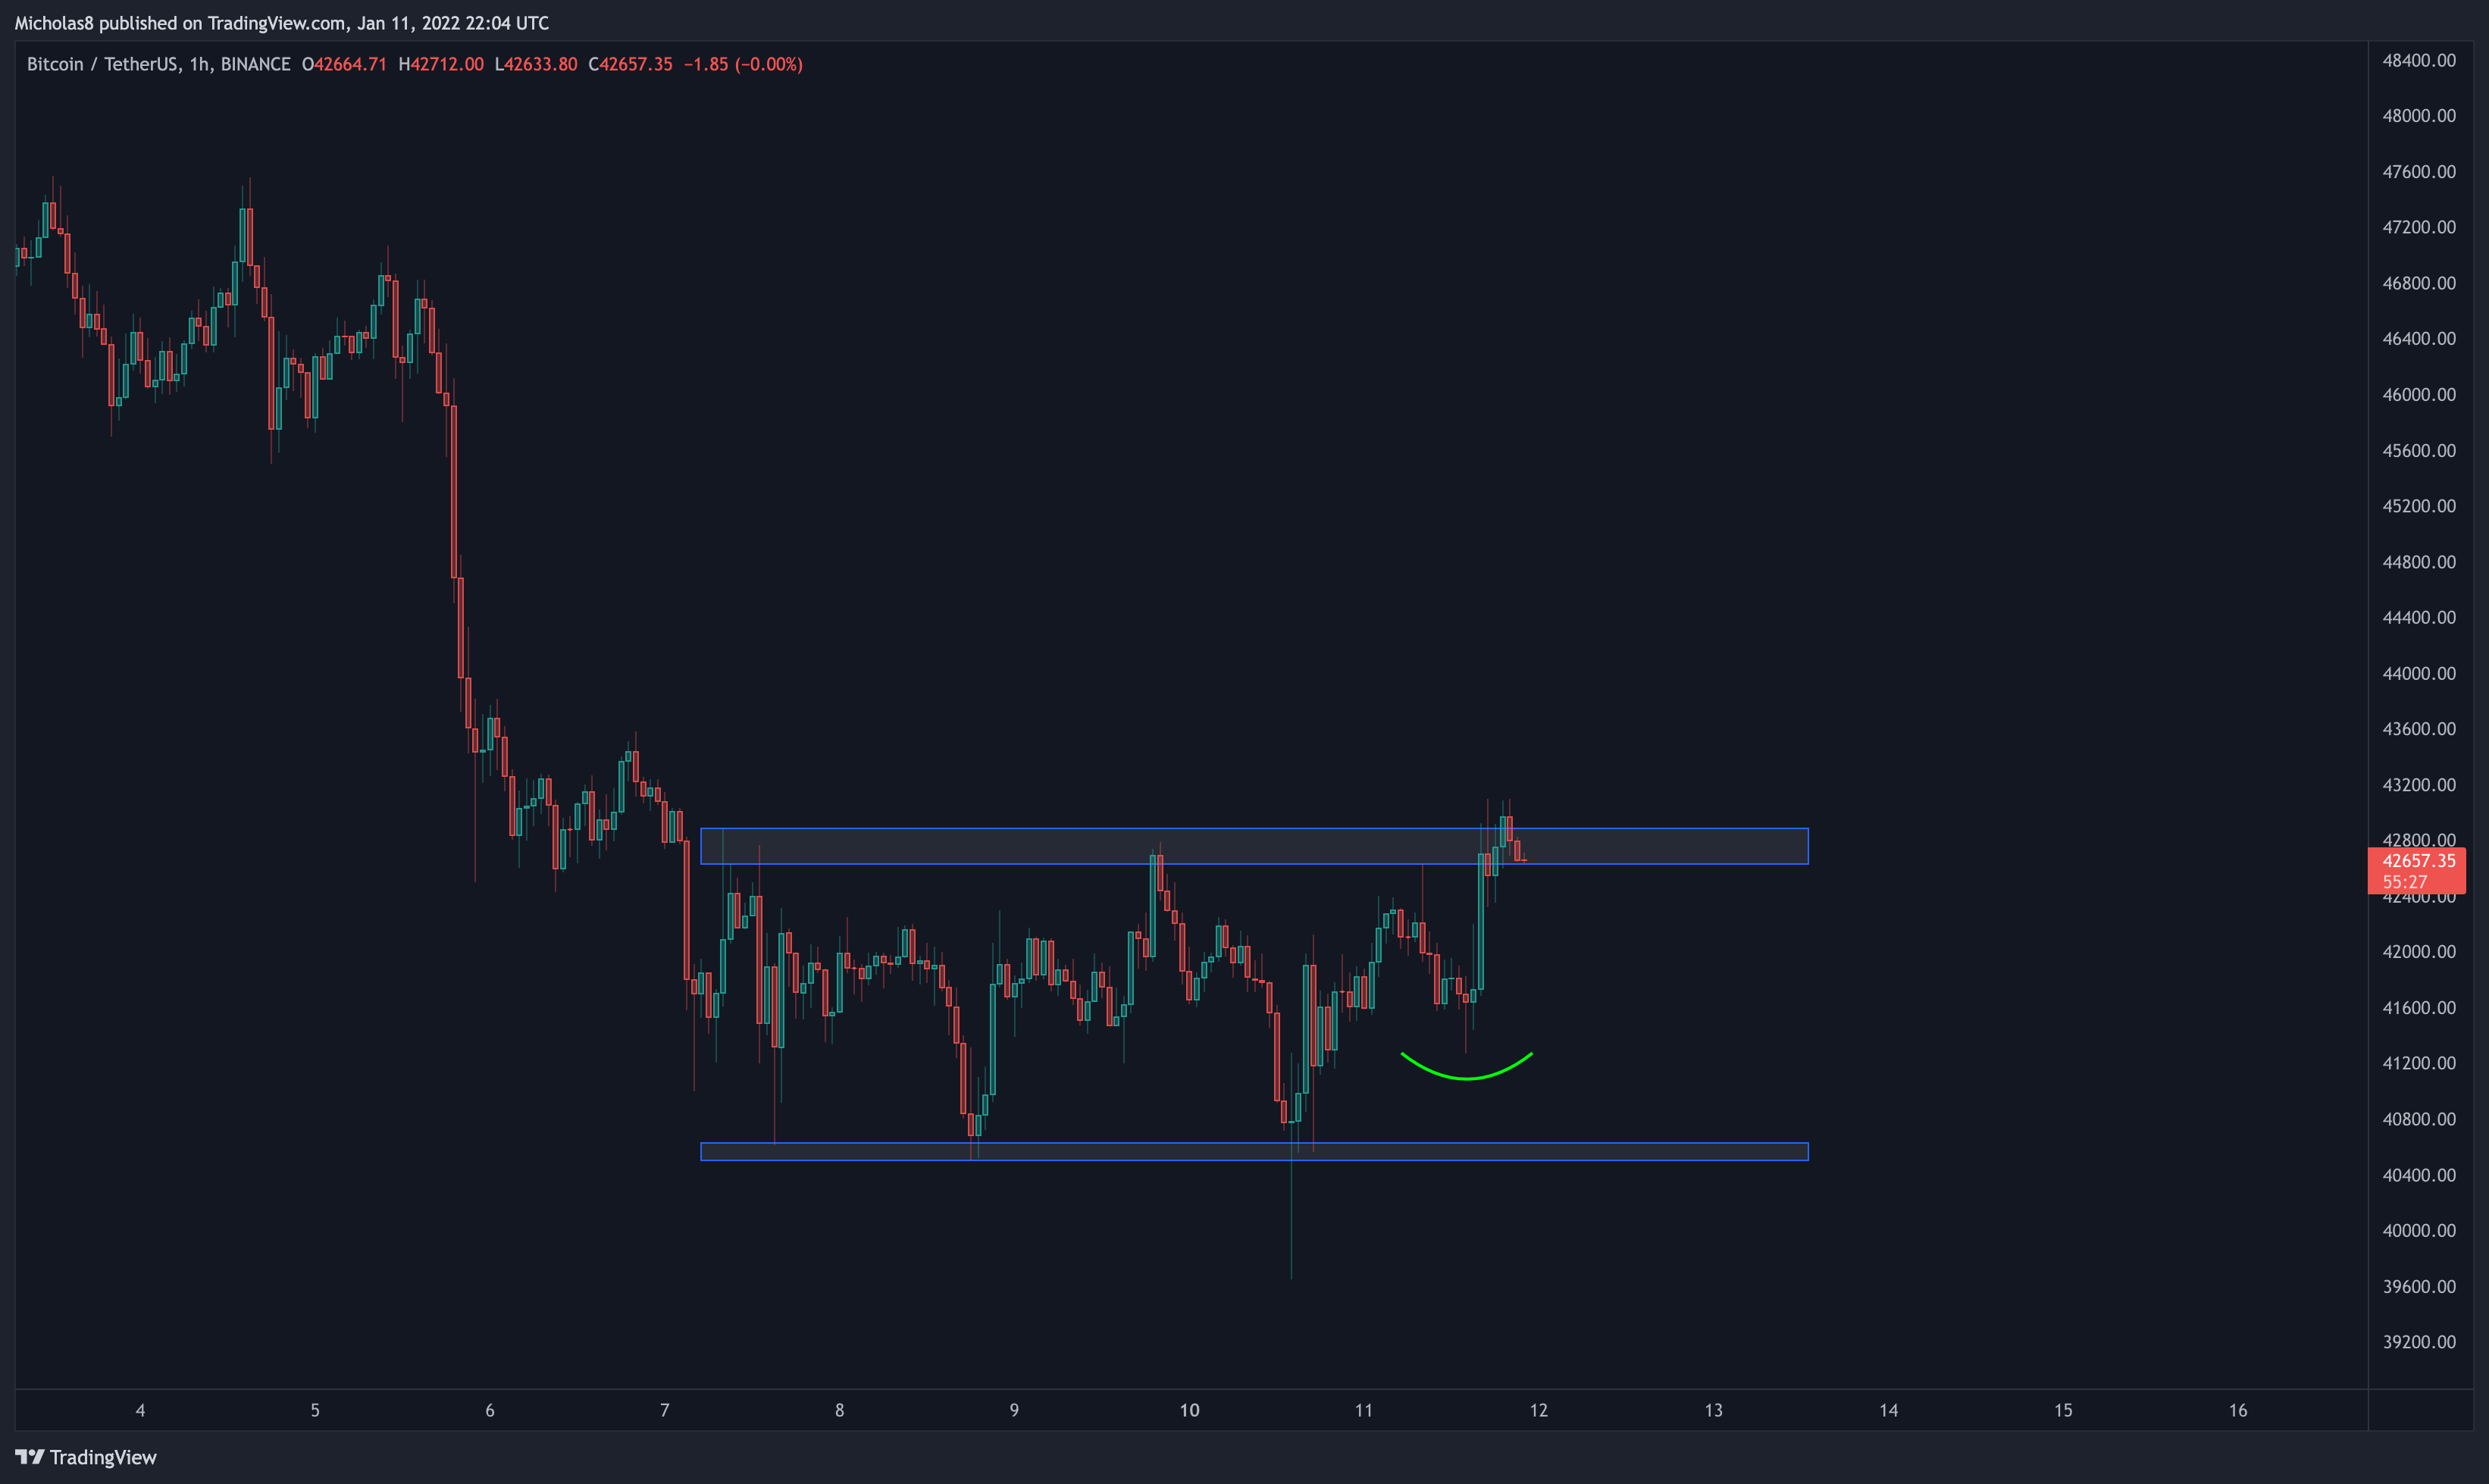
In confluence with the bearish divergences we're seeing, Bitcoin is also in this lower timeframe range between 40.5k-43k. Ideally, even if Bitcoin does see a short-term move down from here, we would want to create a higher low than the one indicated by the green curve. That green curve is what we call a "pivot low" within a range. It's a potential early indication of a structural change, ie. reversal. As long as that higher low remains in tact, there's a much higher likelihood that we see Bitcoin make a move to the upside.
All in all, Bitcoin remains in the same position as it's been in over the last few months – more bearish than bullish. On a short to medium term level, we are seeing a possible shift in market structure with this new higher high. What I would like to see happen here, because there are bearish divergences in play, is either consolidation up at the high of the range, or a move down to create a new higher low before pivoting to the upside. If unsuccessful, there's then a higher likelihood that Bitcoin makes its way to the bottom of the range.
Thank you for your continued support, and I hope you have a great week!
Cheers!
THIS MORNING
Bitcoin continues to trade within the Bearish Territory.
And has now also taken out another high to create a higher high.
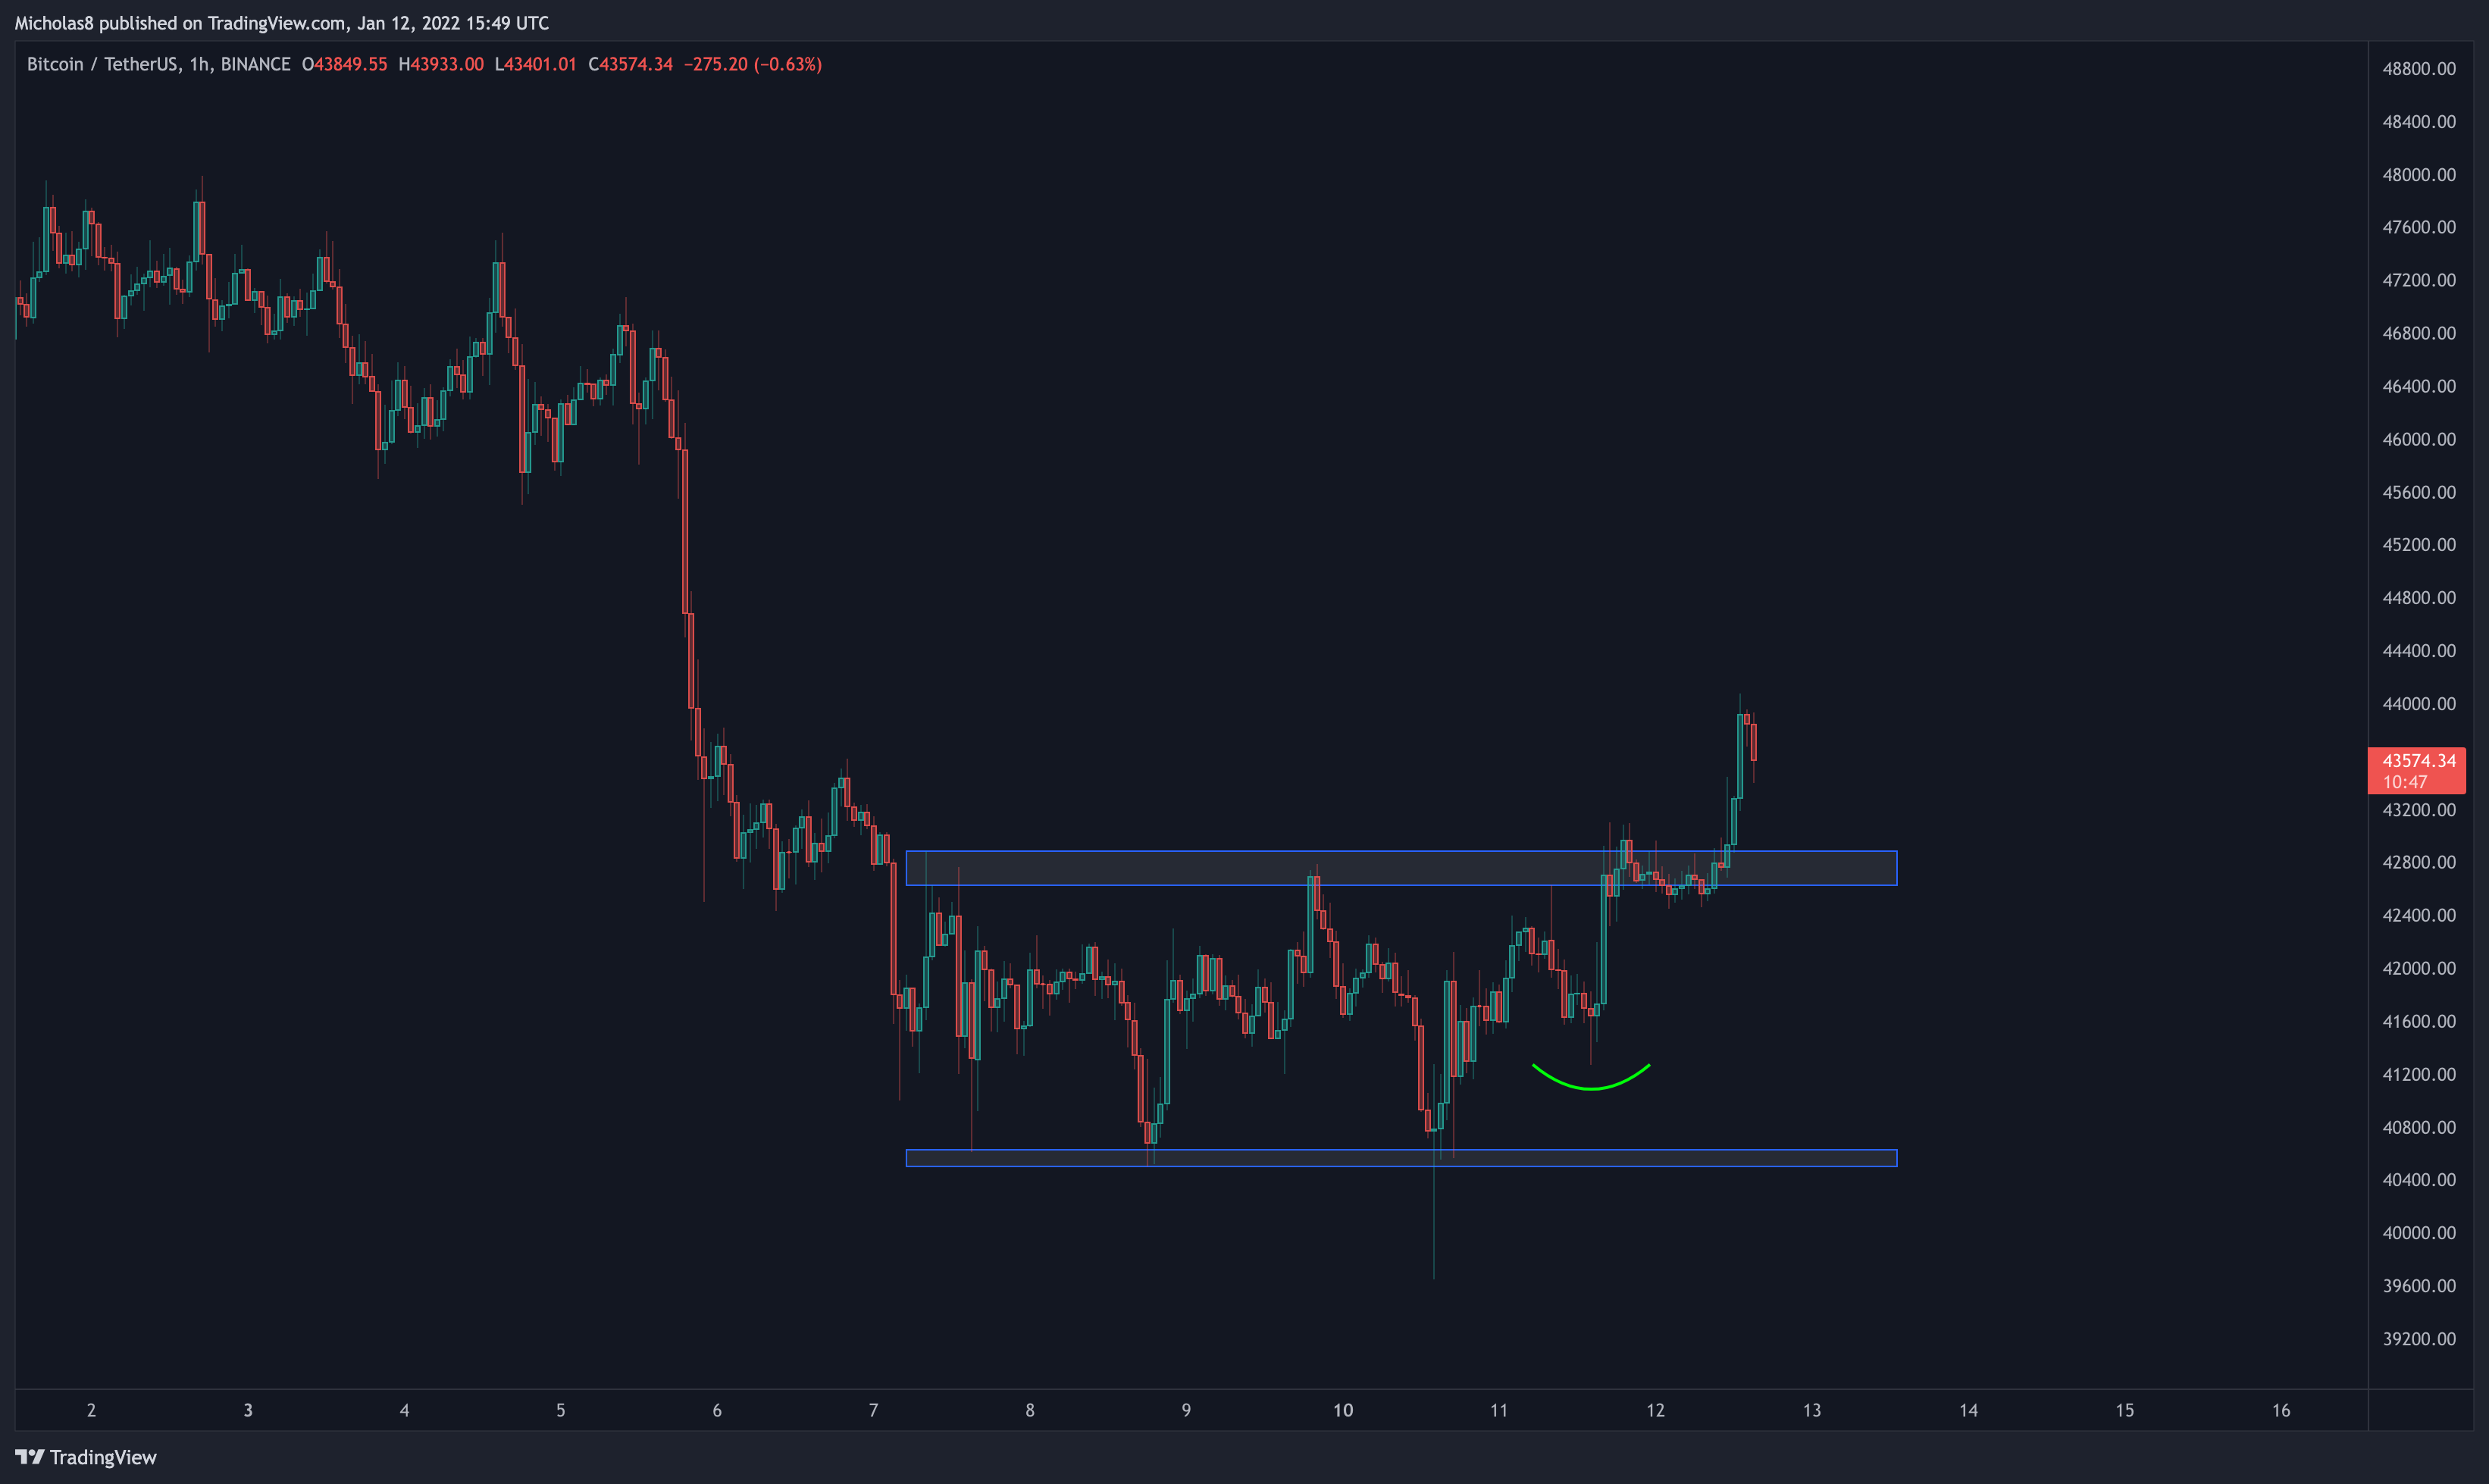
On top of that, Bitcoin has also broken out from our mini range after solidifying the green curve as our "pivot low".
What's next?
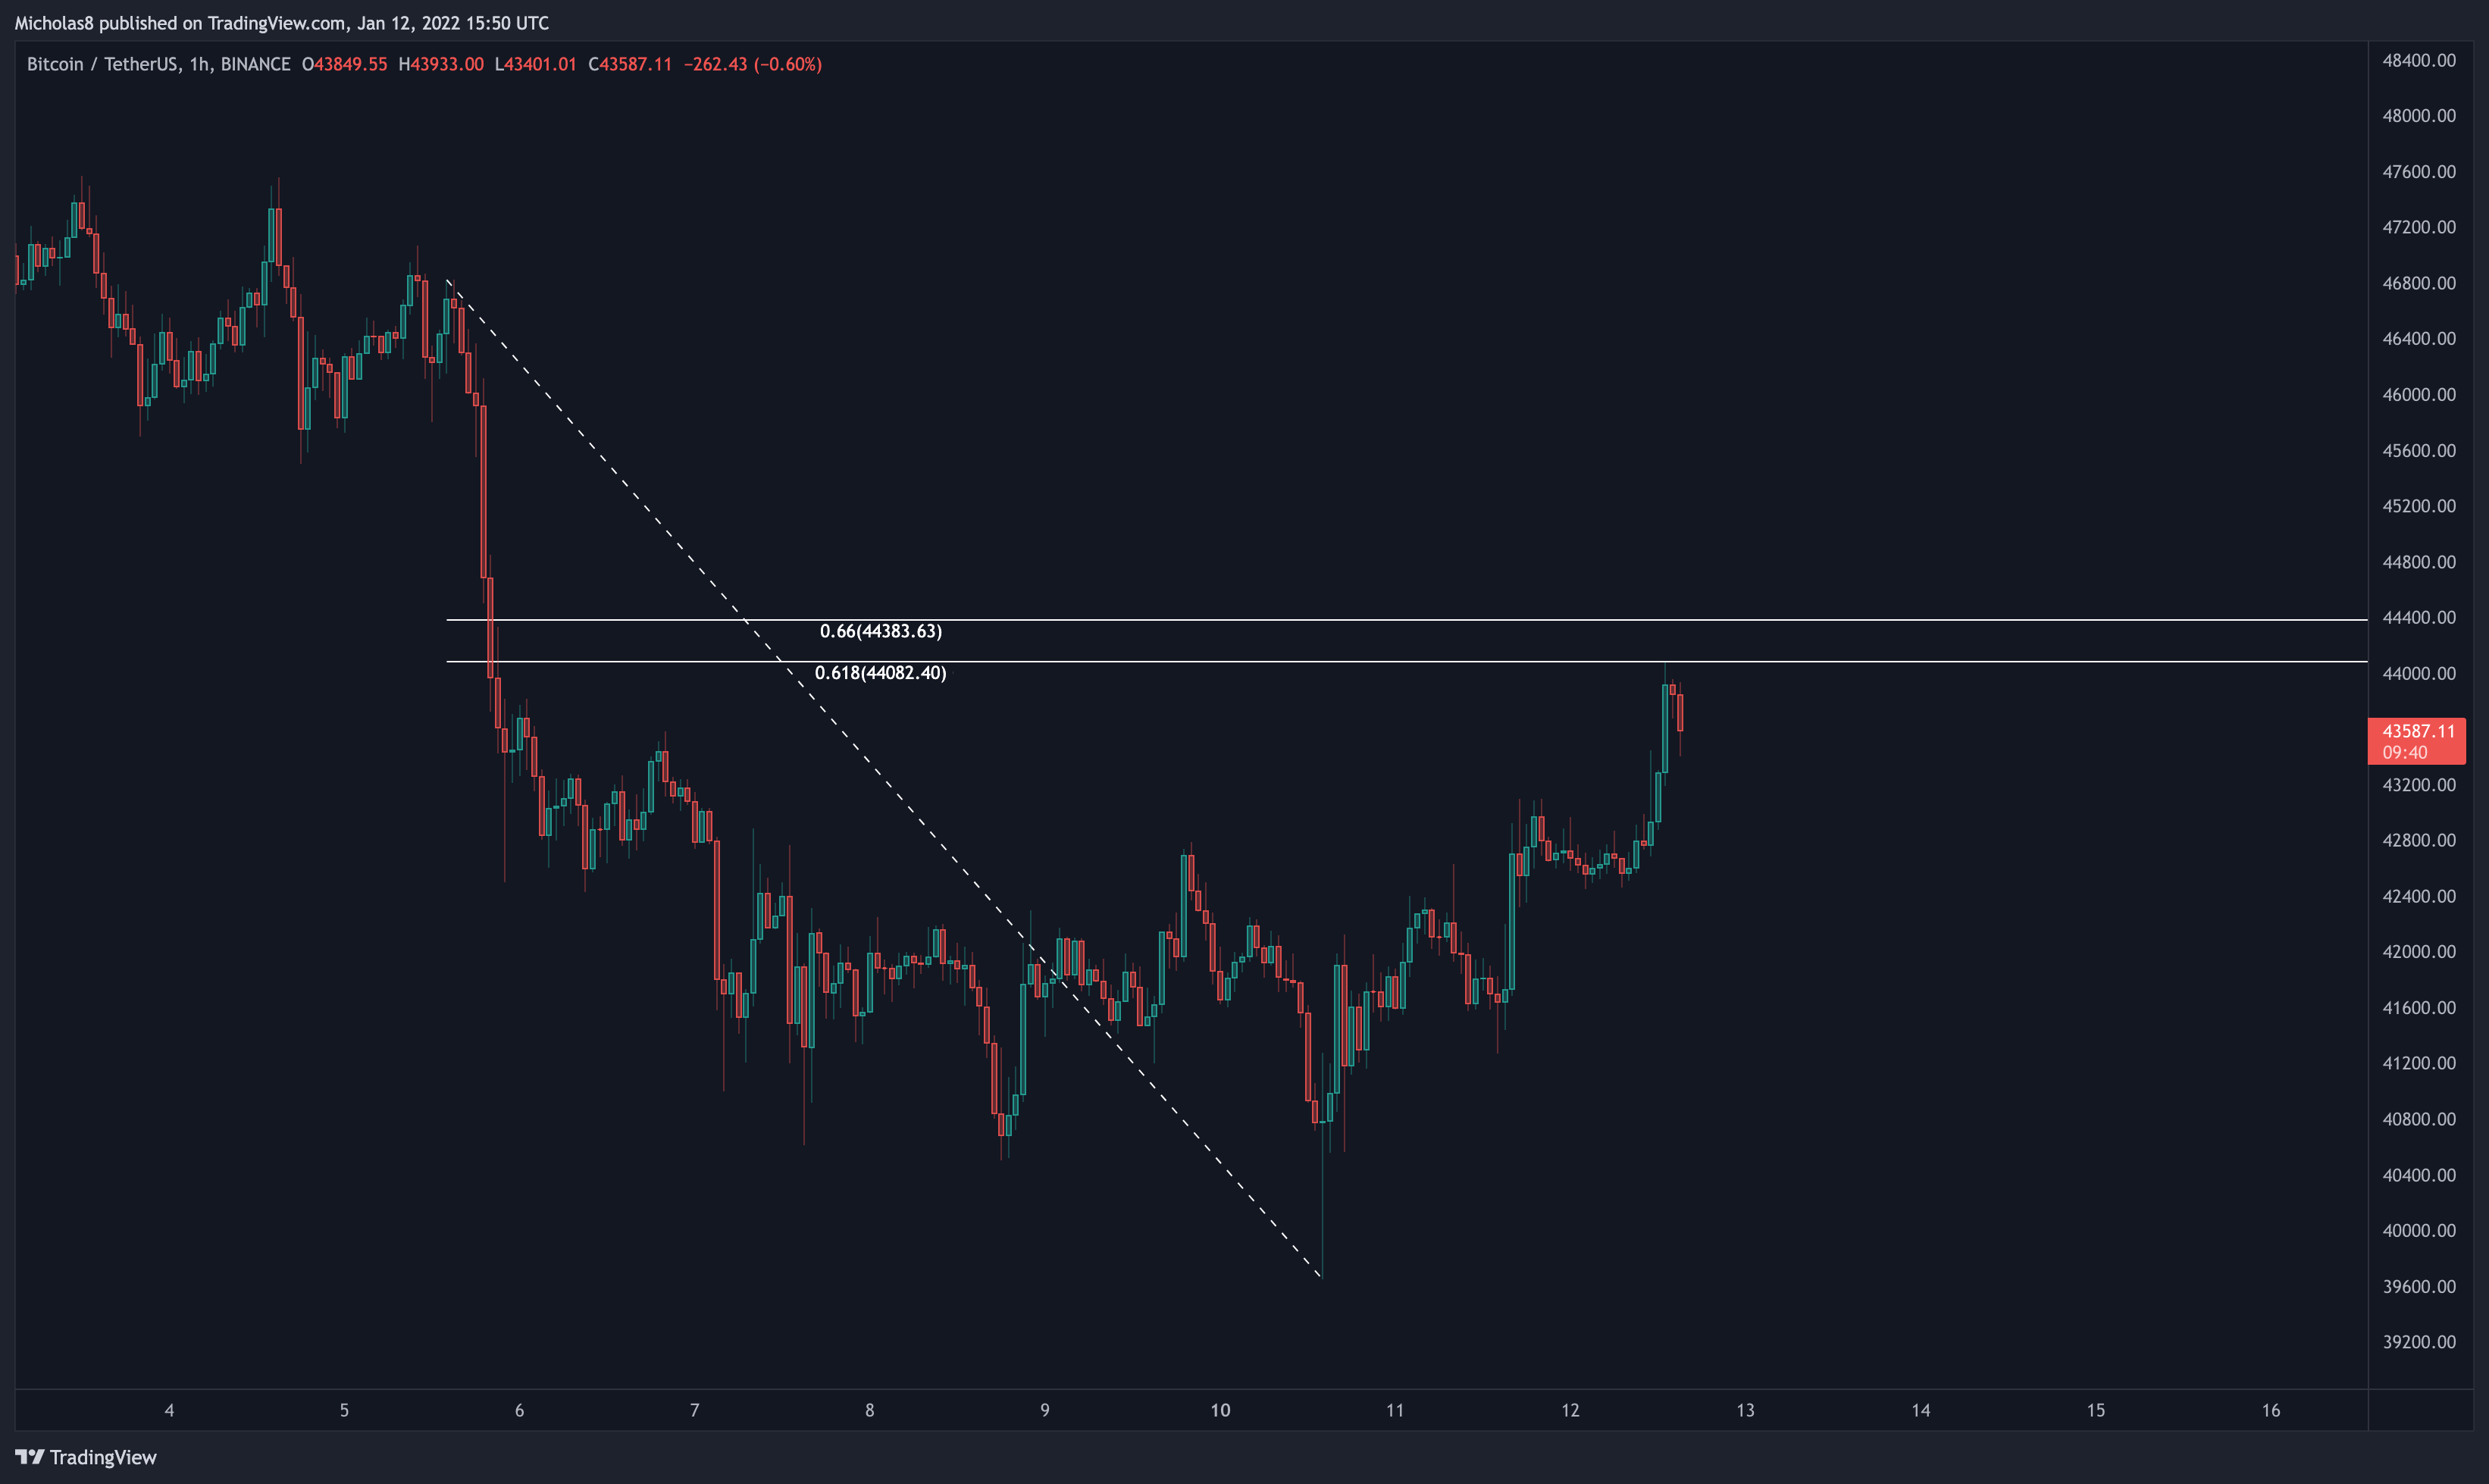
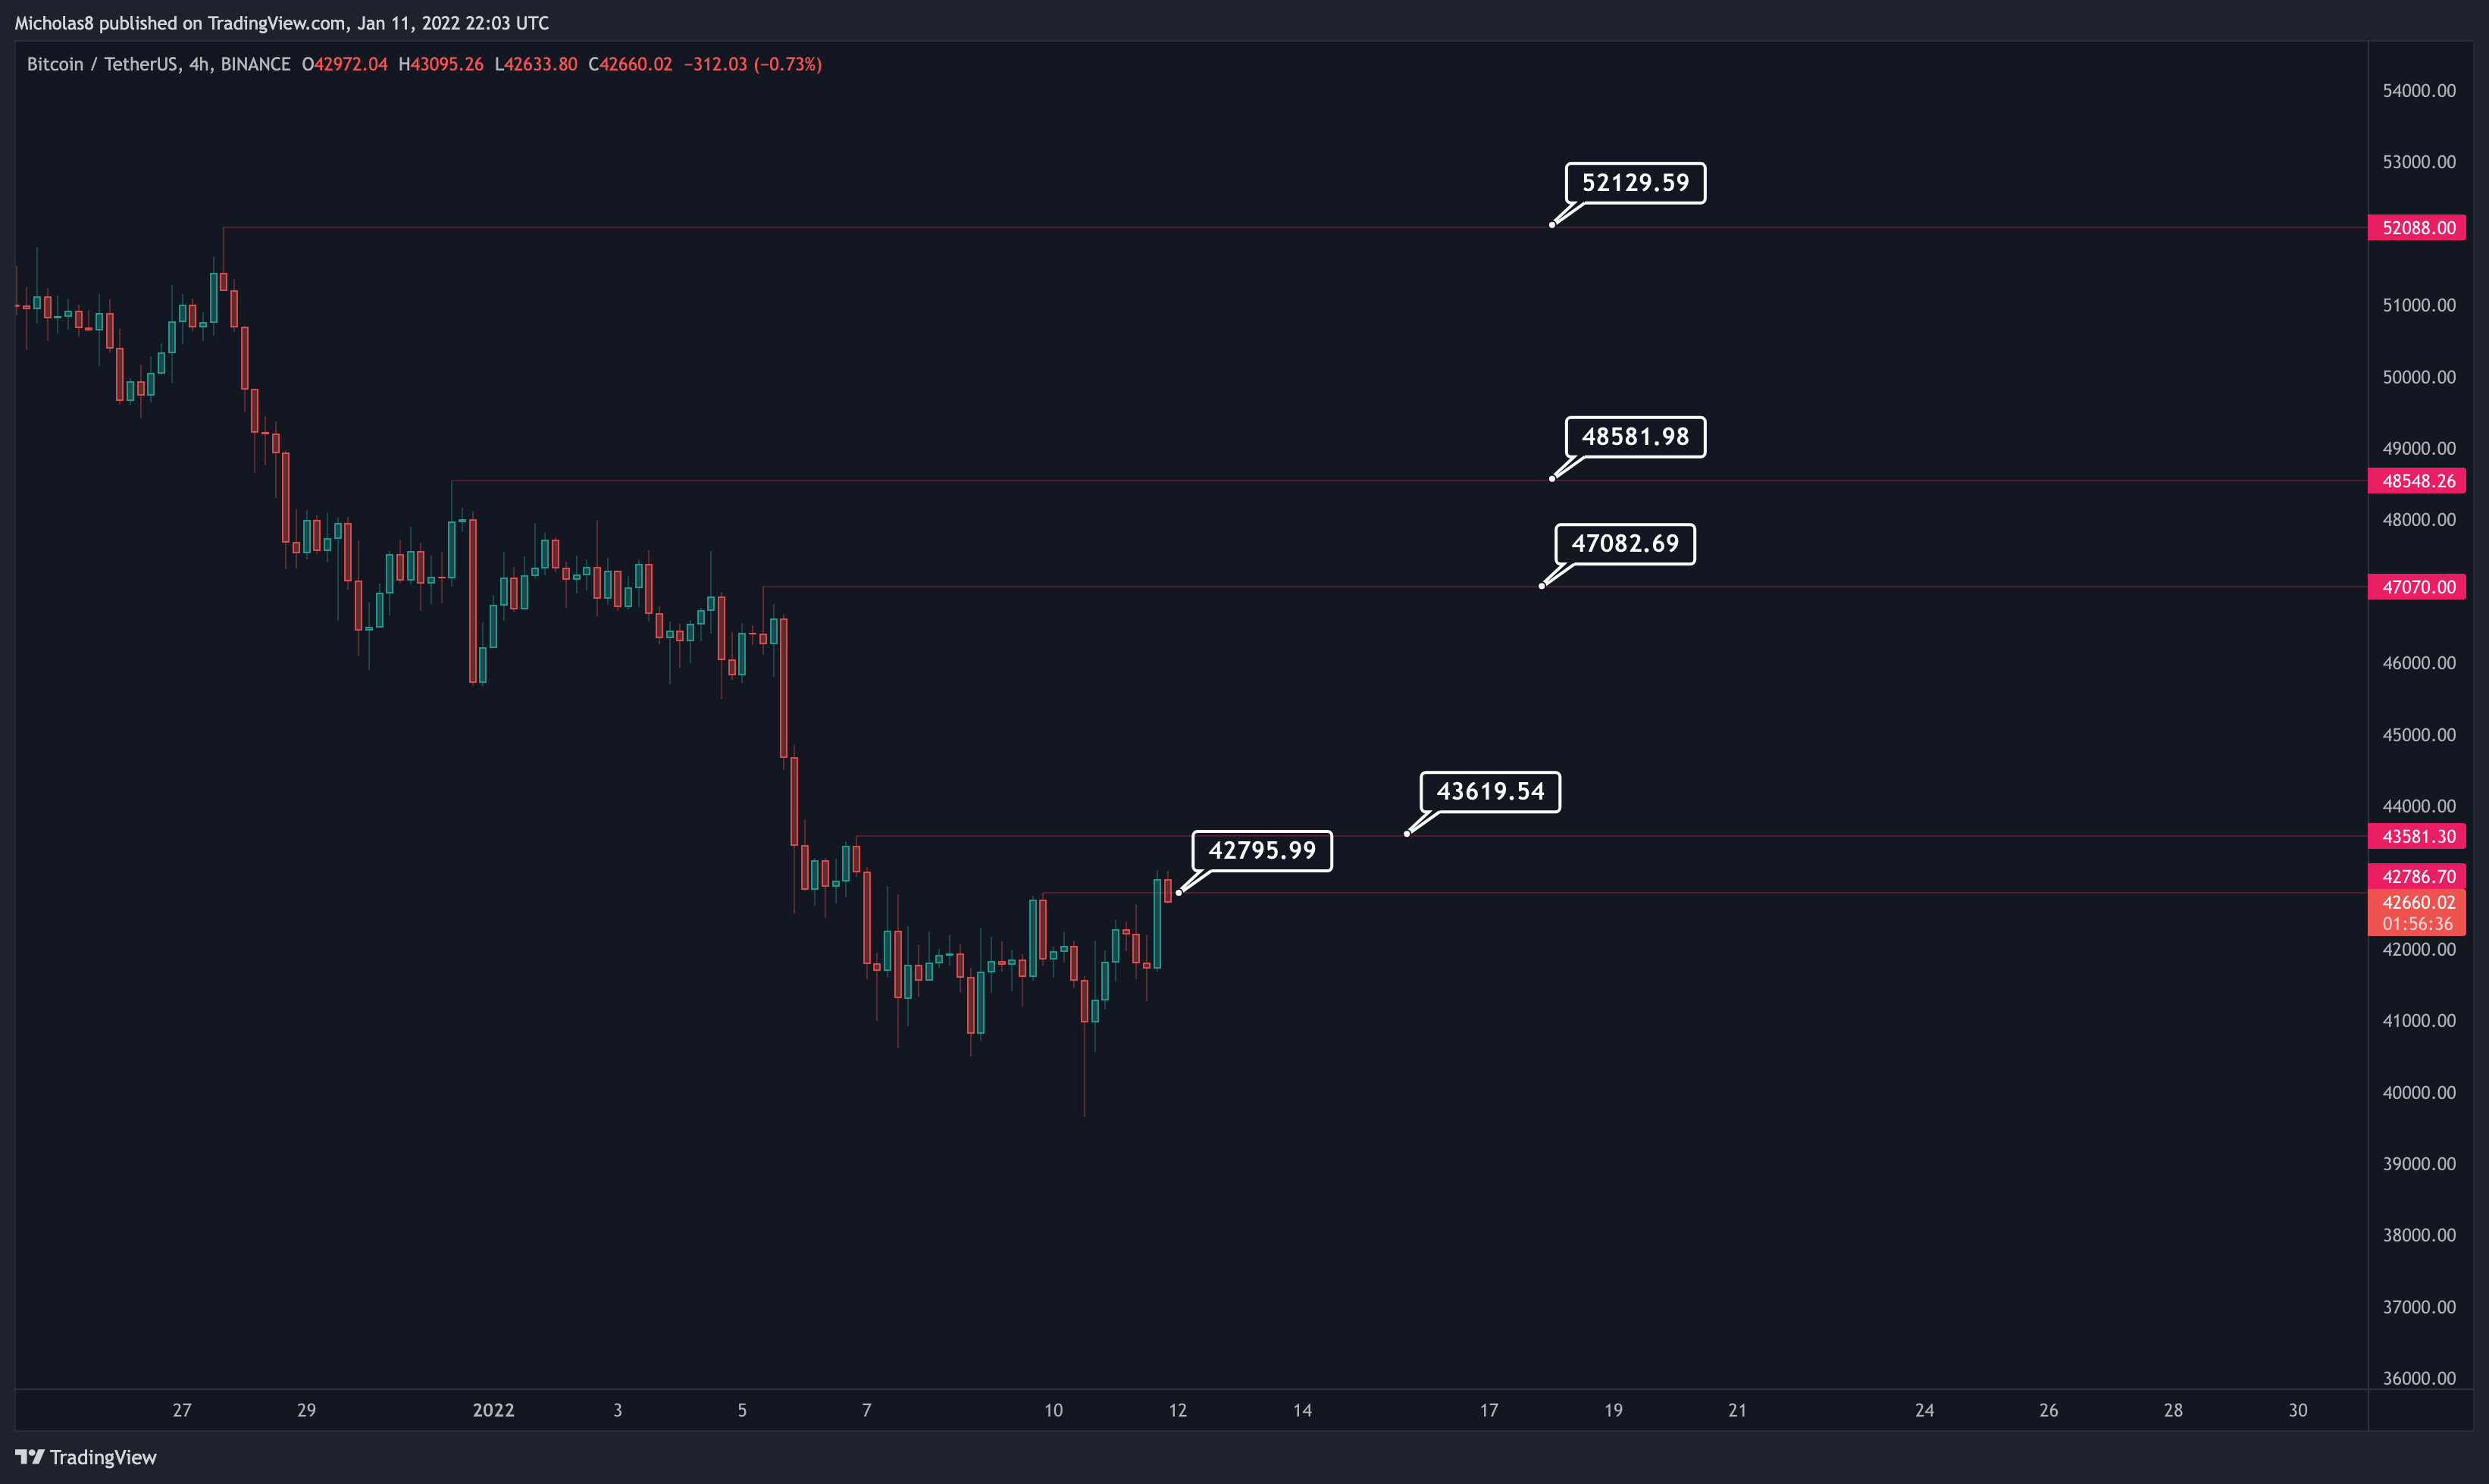
Well, Bitcoin is currently finding resistance from one of our Golden Pockets. In confluence with this pocket, we have our 1H/4H bearish divergences. What I'm looking for here now is either what we were looking for yesterday and saw last night (consolidation + a small pullback to form a consecutive higher low), or a larger pullback which would create a more macro higher low before continuation up. Typically after we find rejection/resistance from a Golden Pocket, we do see some sort of consolidation.
The reason why I'm looking for continuation at this point even though we have these bearish divergences, is because we have a 1D bullish divergence. As we know, the higher the timeframe, the more significant the data. And since we're also starting to see a change in the market structure from bearish to bullish, I do believe the bears are exhausted for now. Of course though, this can change as new data starts to come, so stay vigilant.
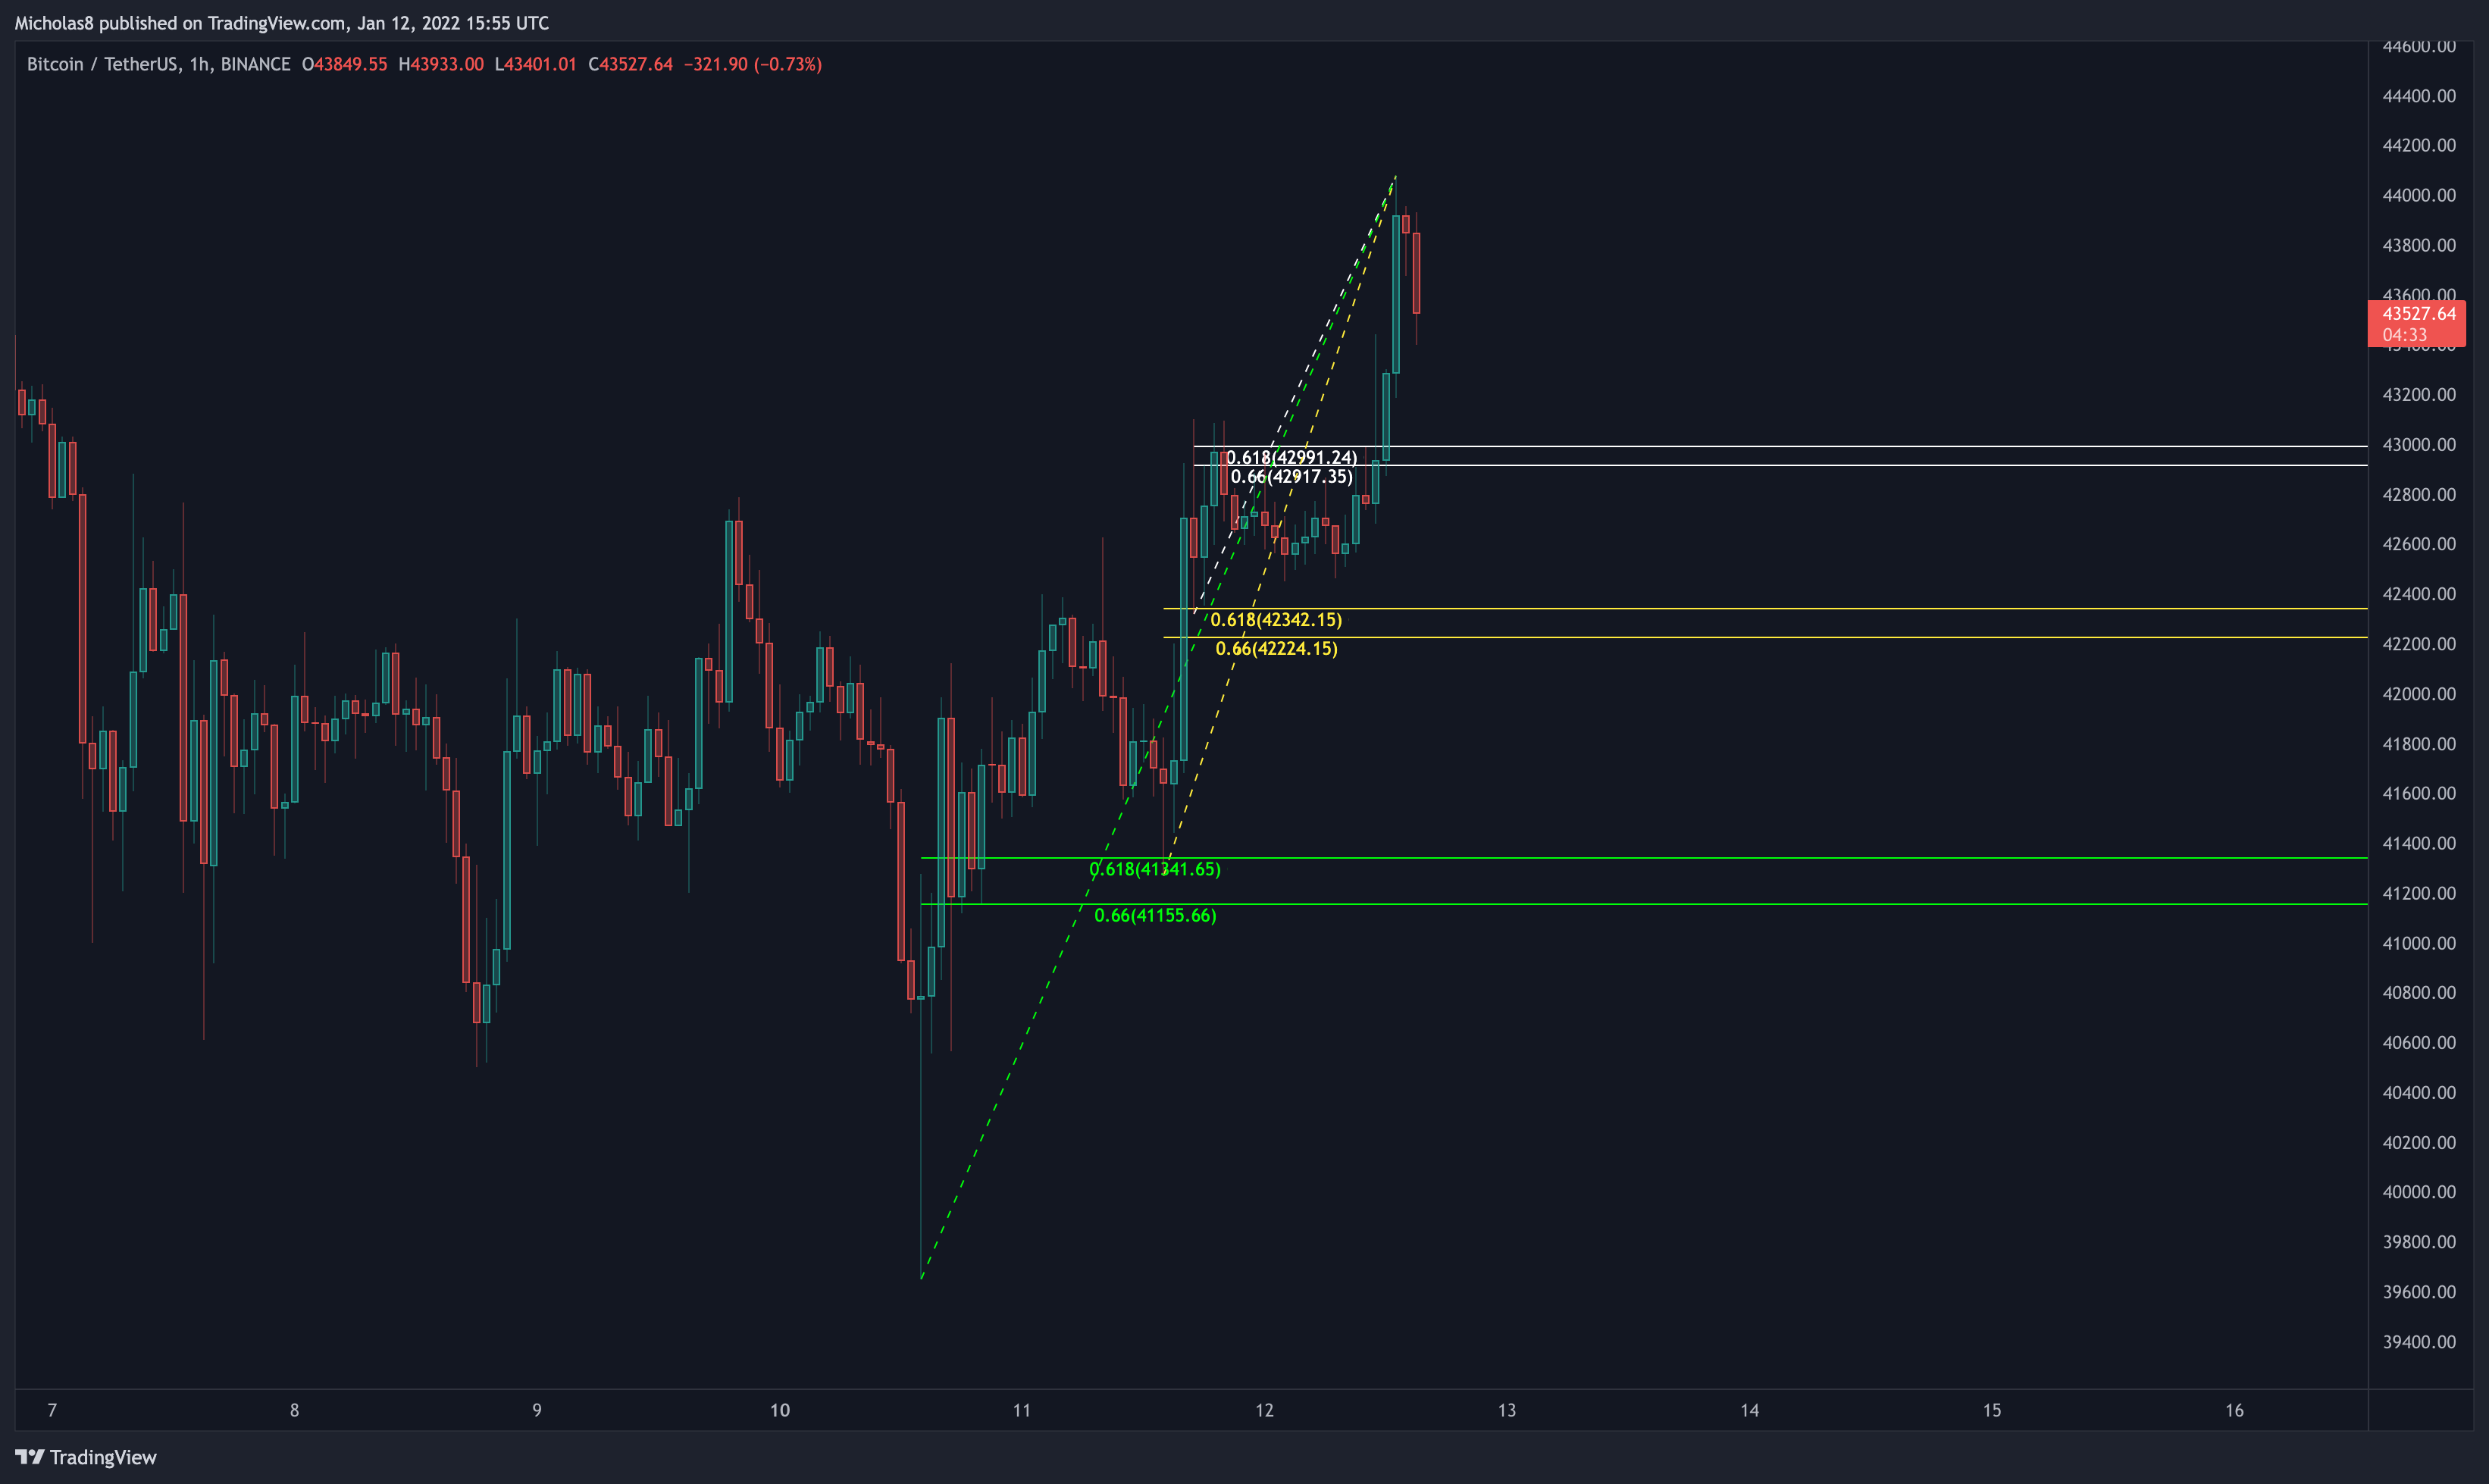
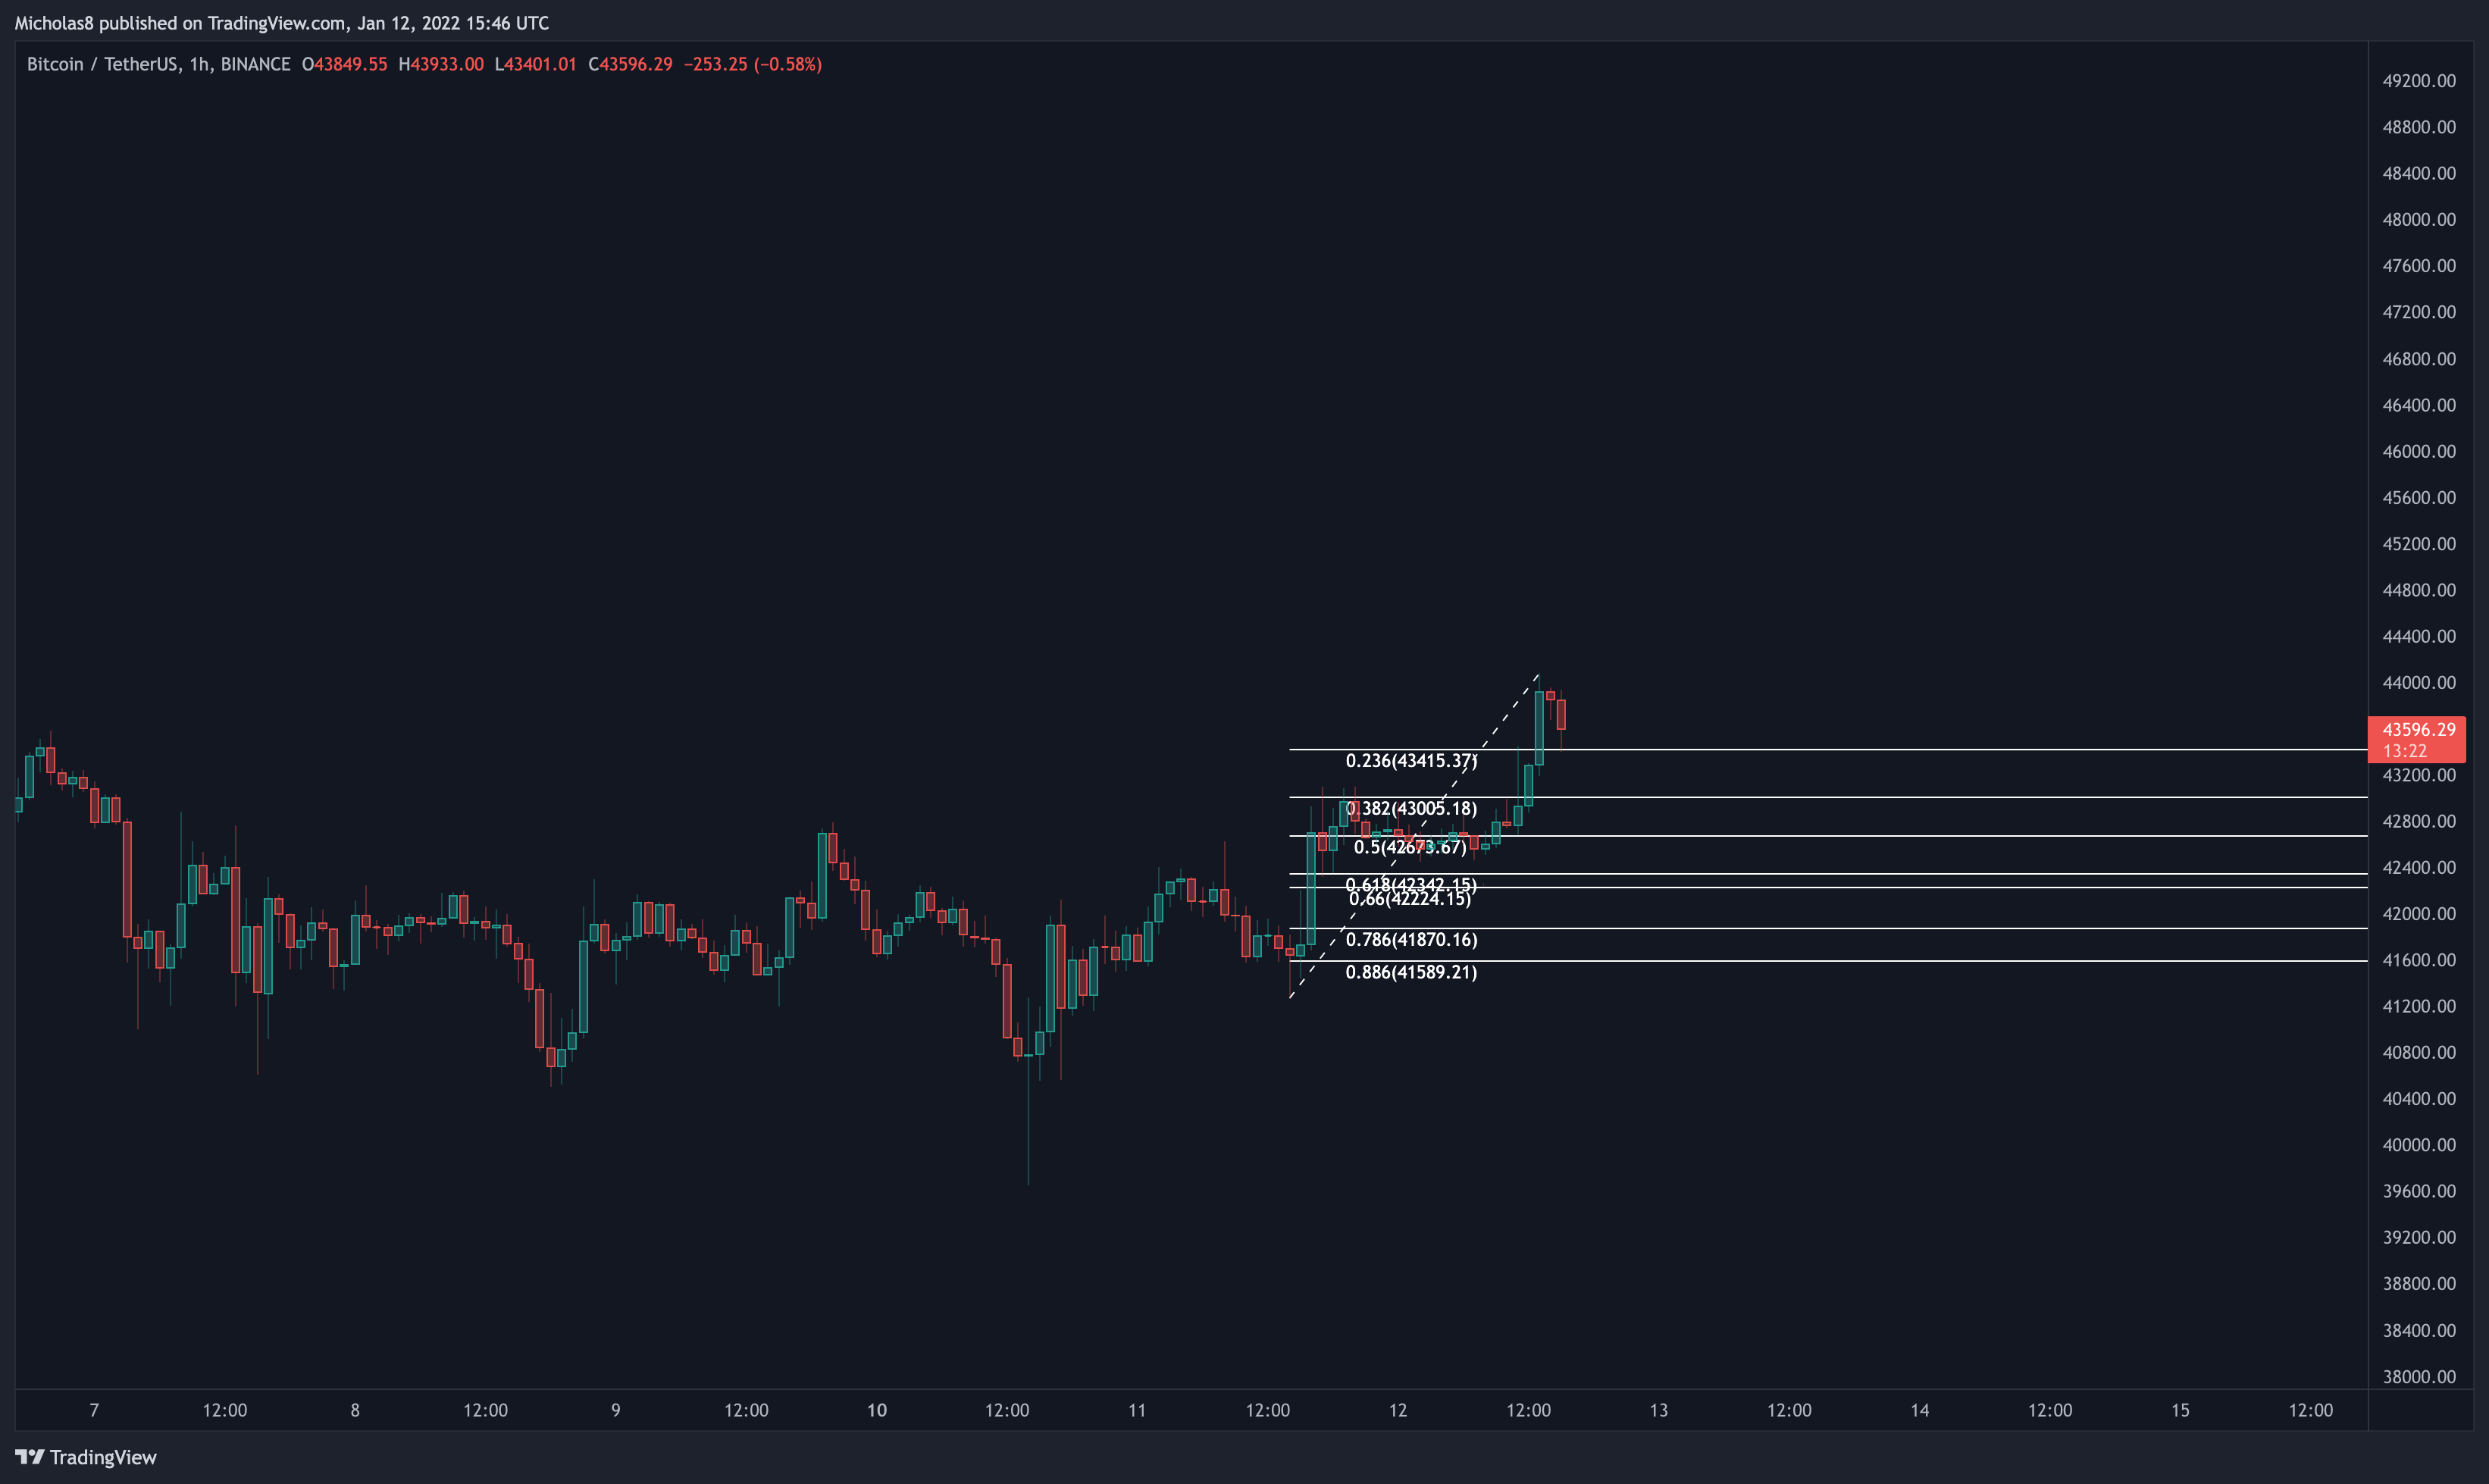
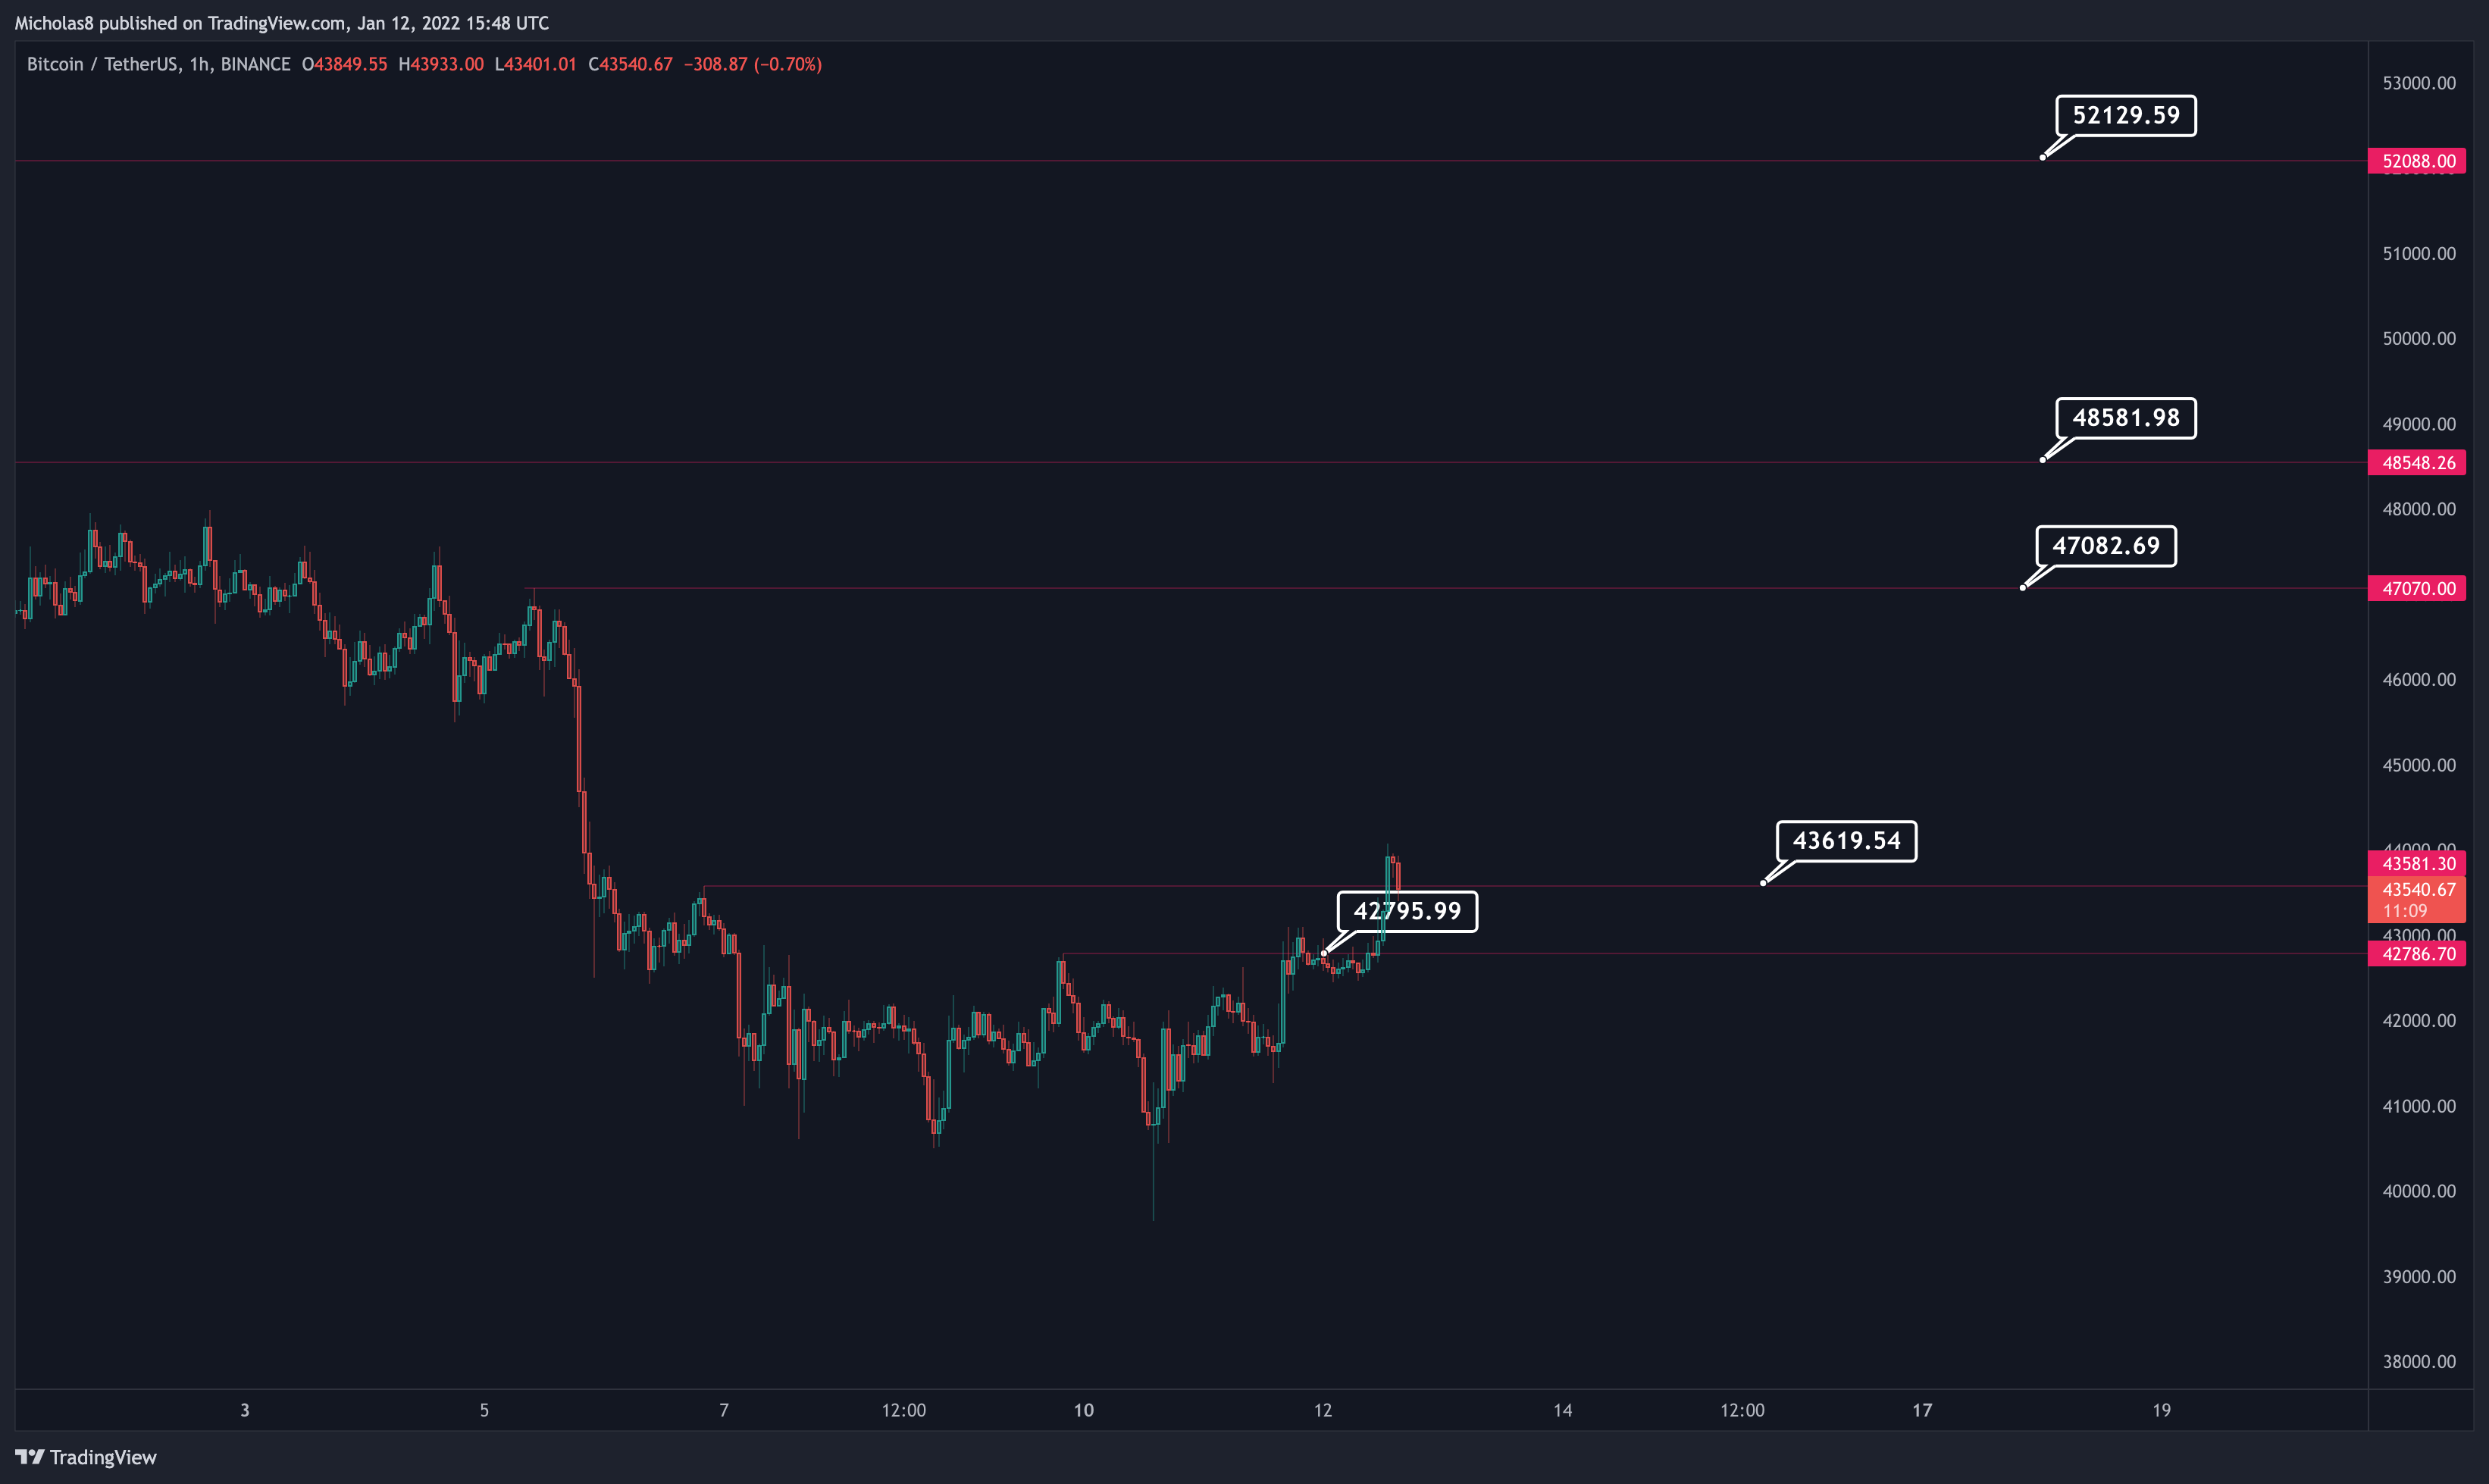
In the case that we do see a pullback, these are the levels I have my eye on for support.
And the other levels we've been looking at remain the same.
All in all, Bitcoin remains in the same position as it's been in over the last few months – more bearish than bullish. On a short to medium term level, we are seeing a shift in market structure with another new higher high. Given what we're seeing right now, I do expect some consolidation, and ideally, continuation up in the days to come. This is subject to change as new data comes in.
Thank you for your continued support and I hope you have a great week!
Keep an eye out for tonight's daily market report in about 8 hours.
Stay safe. Trade safe.
Cheers!