
I recommend reading these reports on the Buy Me A Coffee platform for optimal formatting.
You will find the content below in this order:
1. Definitions
2. Monthly
3. The Good
4. The Bad
5. CME Gaps
6. Key Levels
7. Final Thoughts
DEFINITIONS
Liquidity zones are high volume levels that offer support and resistance
Hidden bearish divergence: creating a lower high in price, with a higher high on the oscillators. This signals a possible trend continuation down.
Bearish divergence: higher high in price, lower high on the oscillators. This signals a possible trend reversal down.
Hidden bullish divergence: creating a higher low in price, with a lower low on the oscillators. This signals a possible trend continuation up.
Bullish divergence: creating a lower low in price, with a higher low on the oscillators. This signals a possible trend reversal up.
SR flip: turning old resistance into support, and vice-versa.
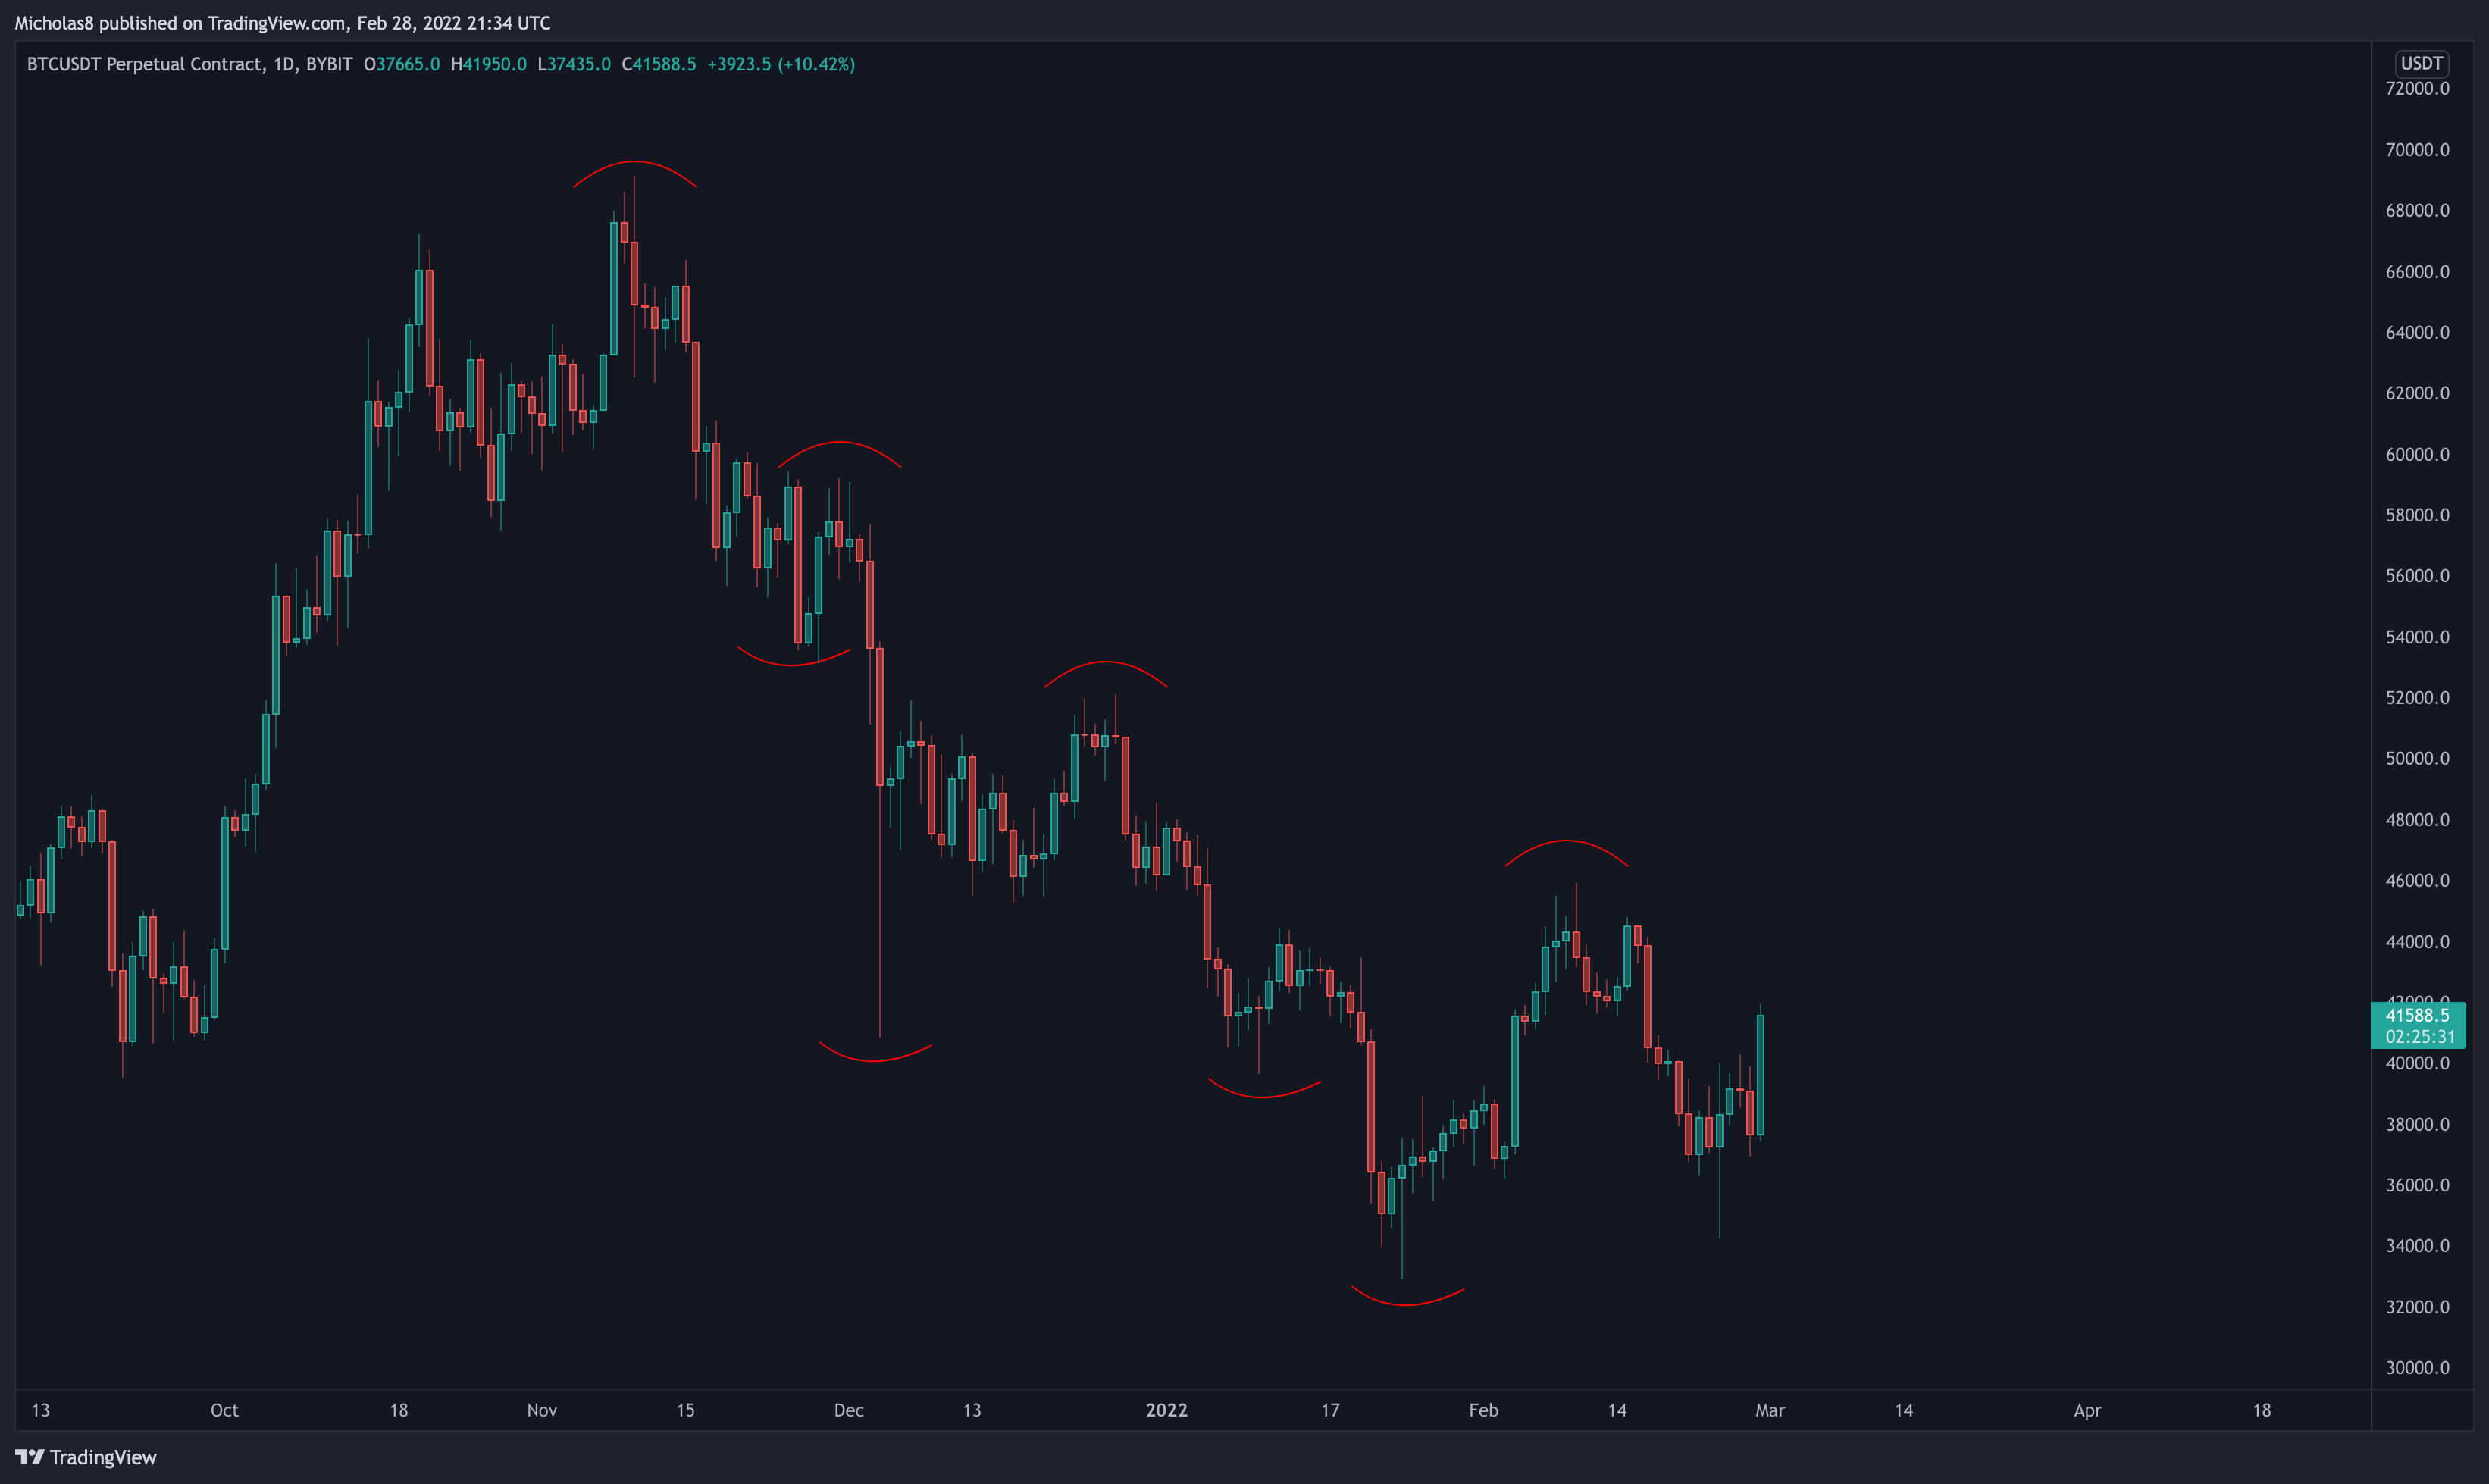
Fractal: recurring geometric pattern.
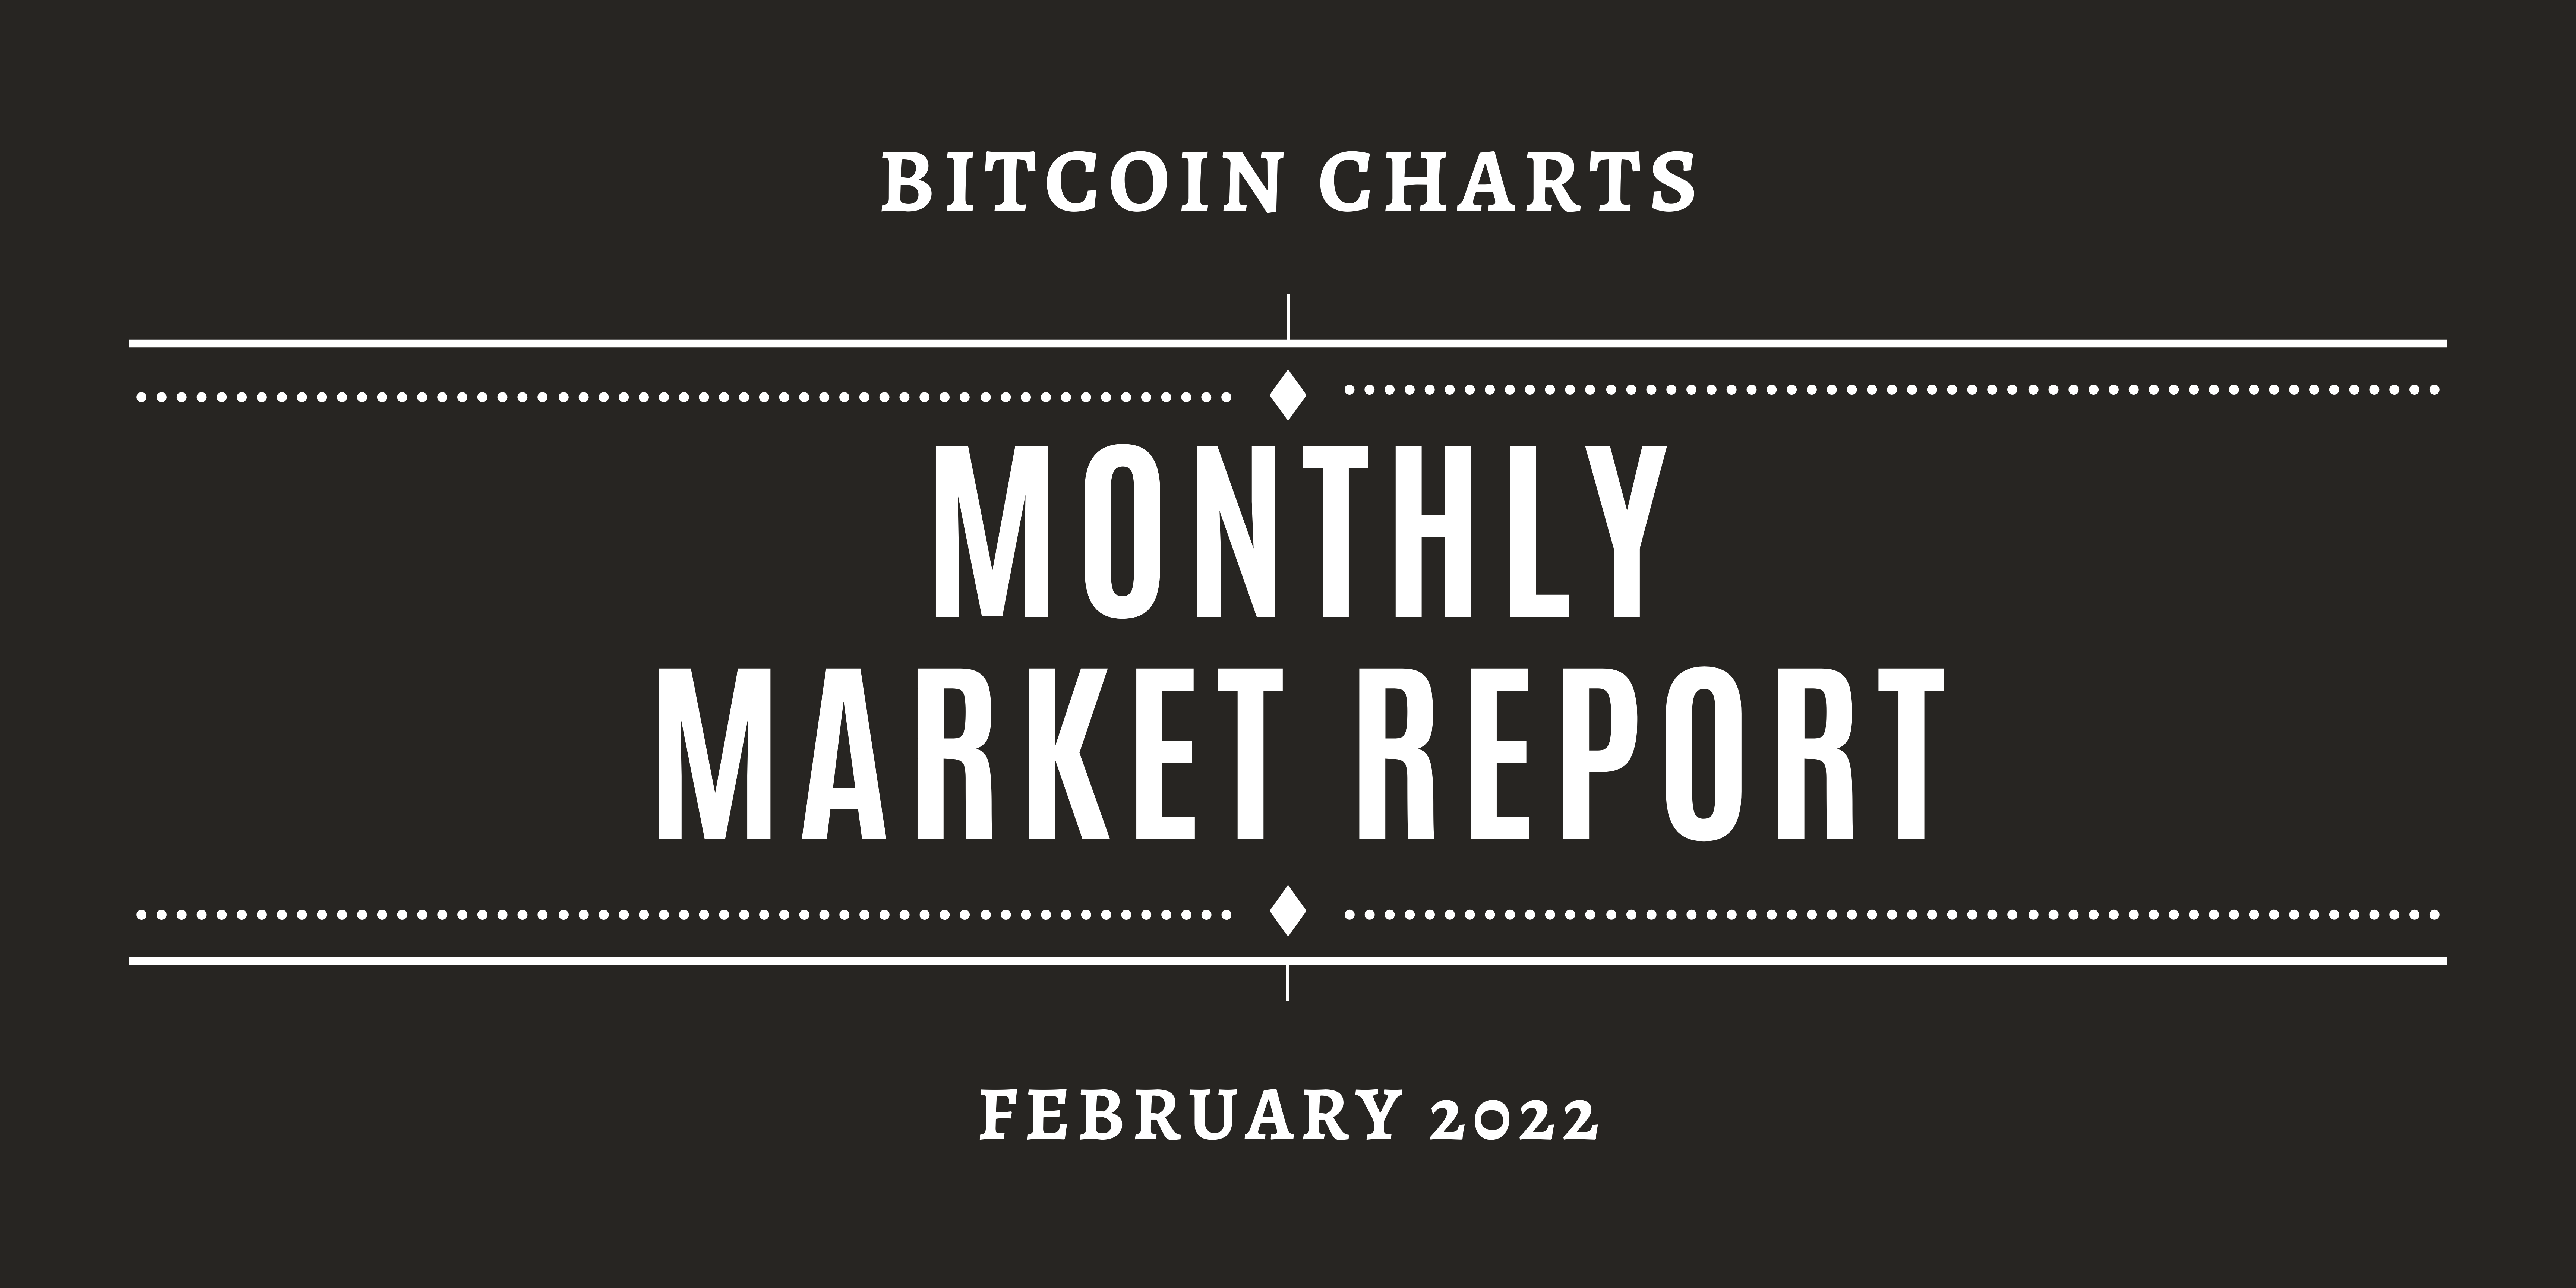
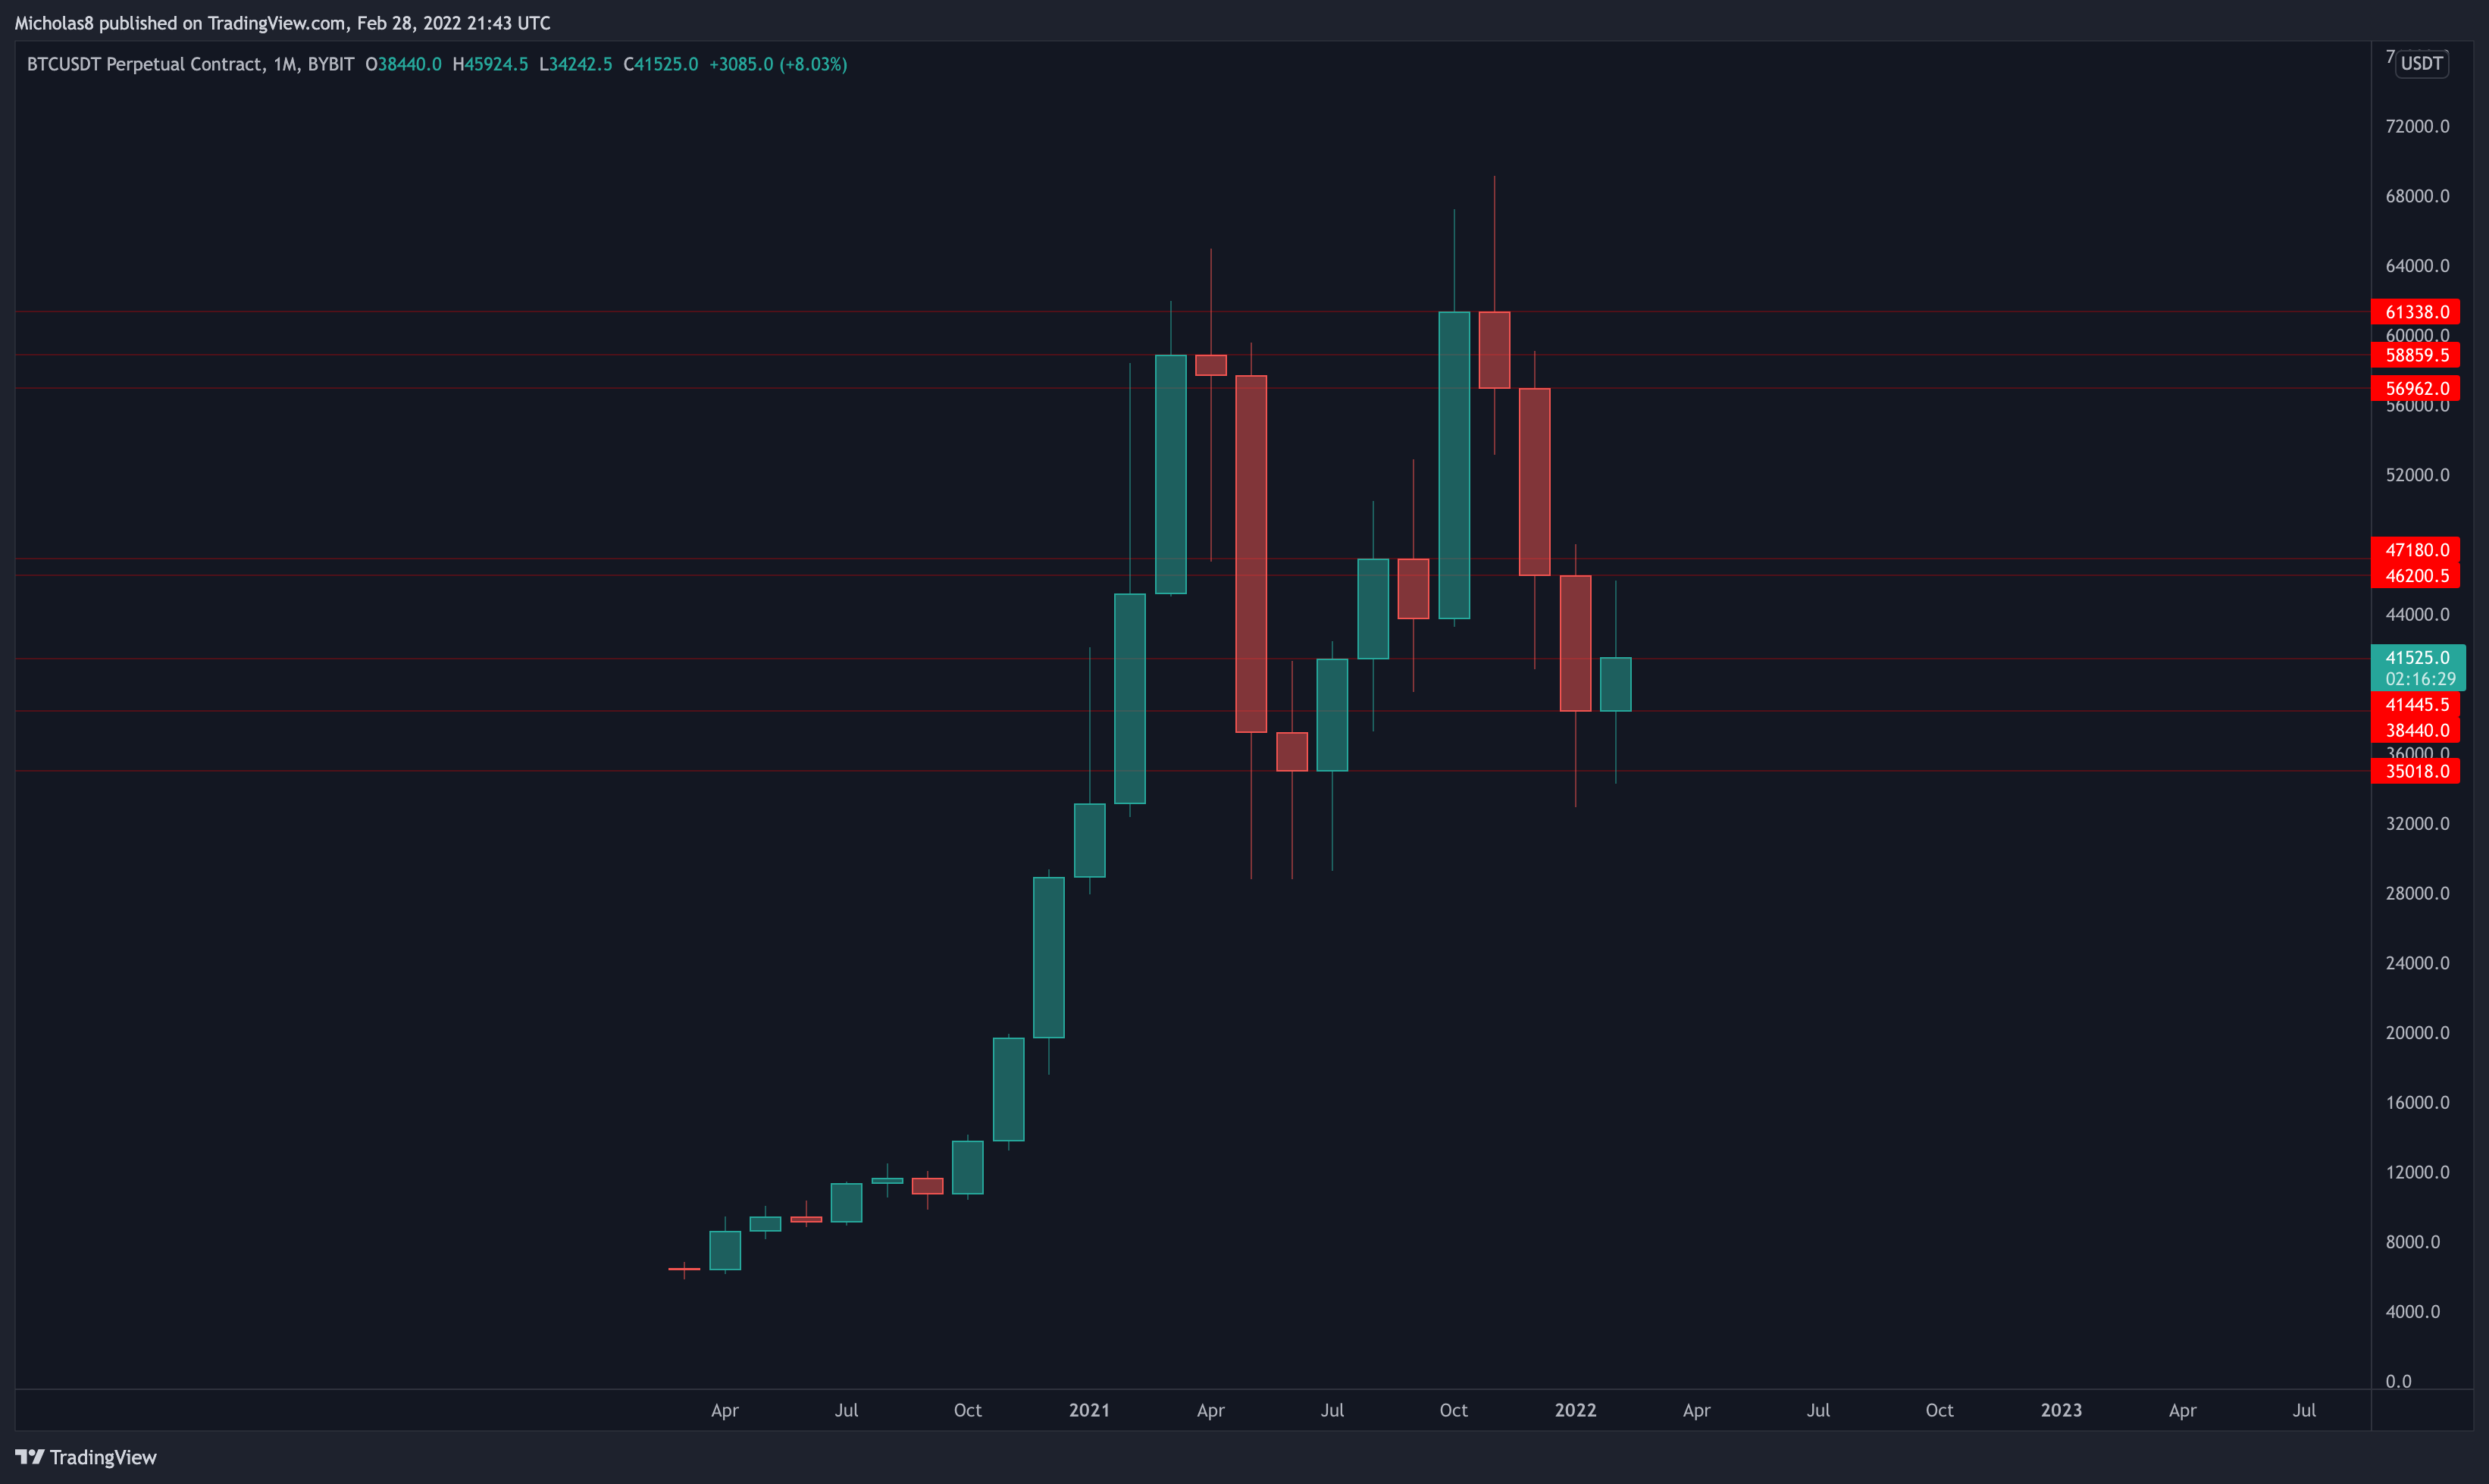
MONTHLY
Overview
Bitcoin will finally print its first green month after three consecutive red monthly candles. further Right now, it does still look like the possibility of this Double Top is becoming the more likely scenario given what the oscillators are saying well.
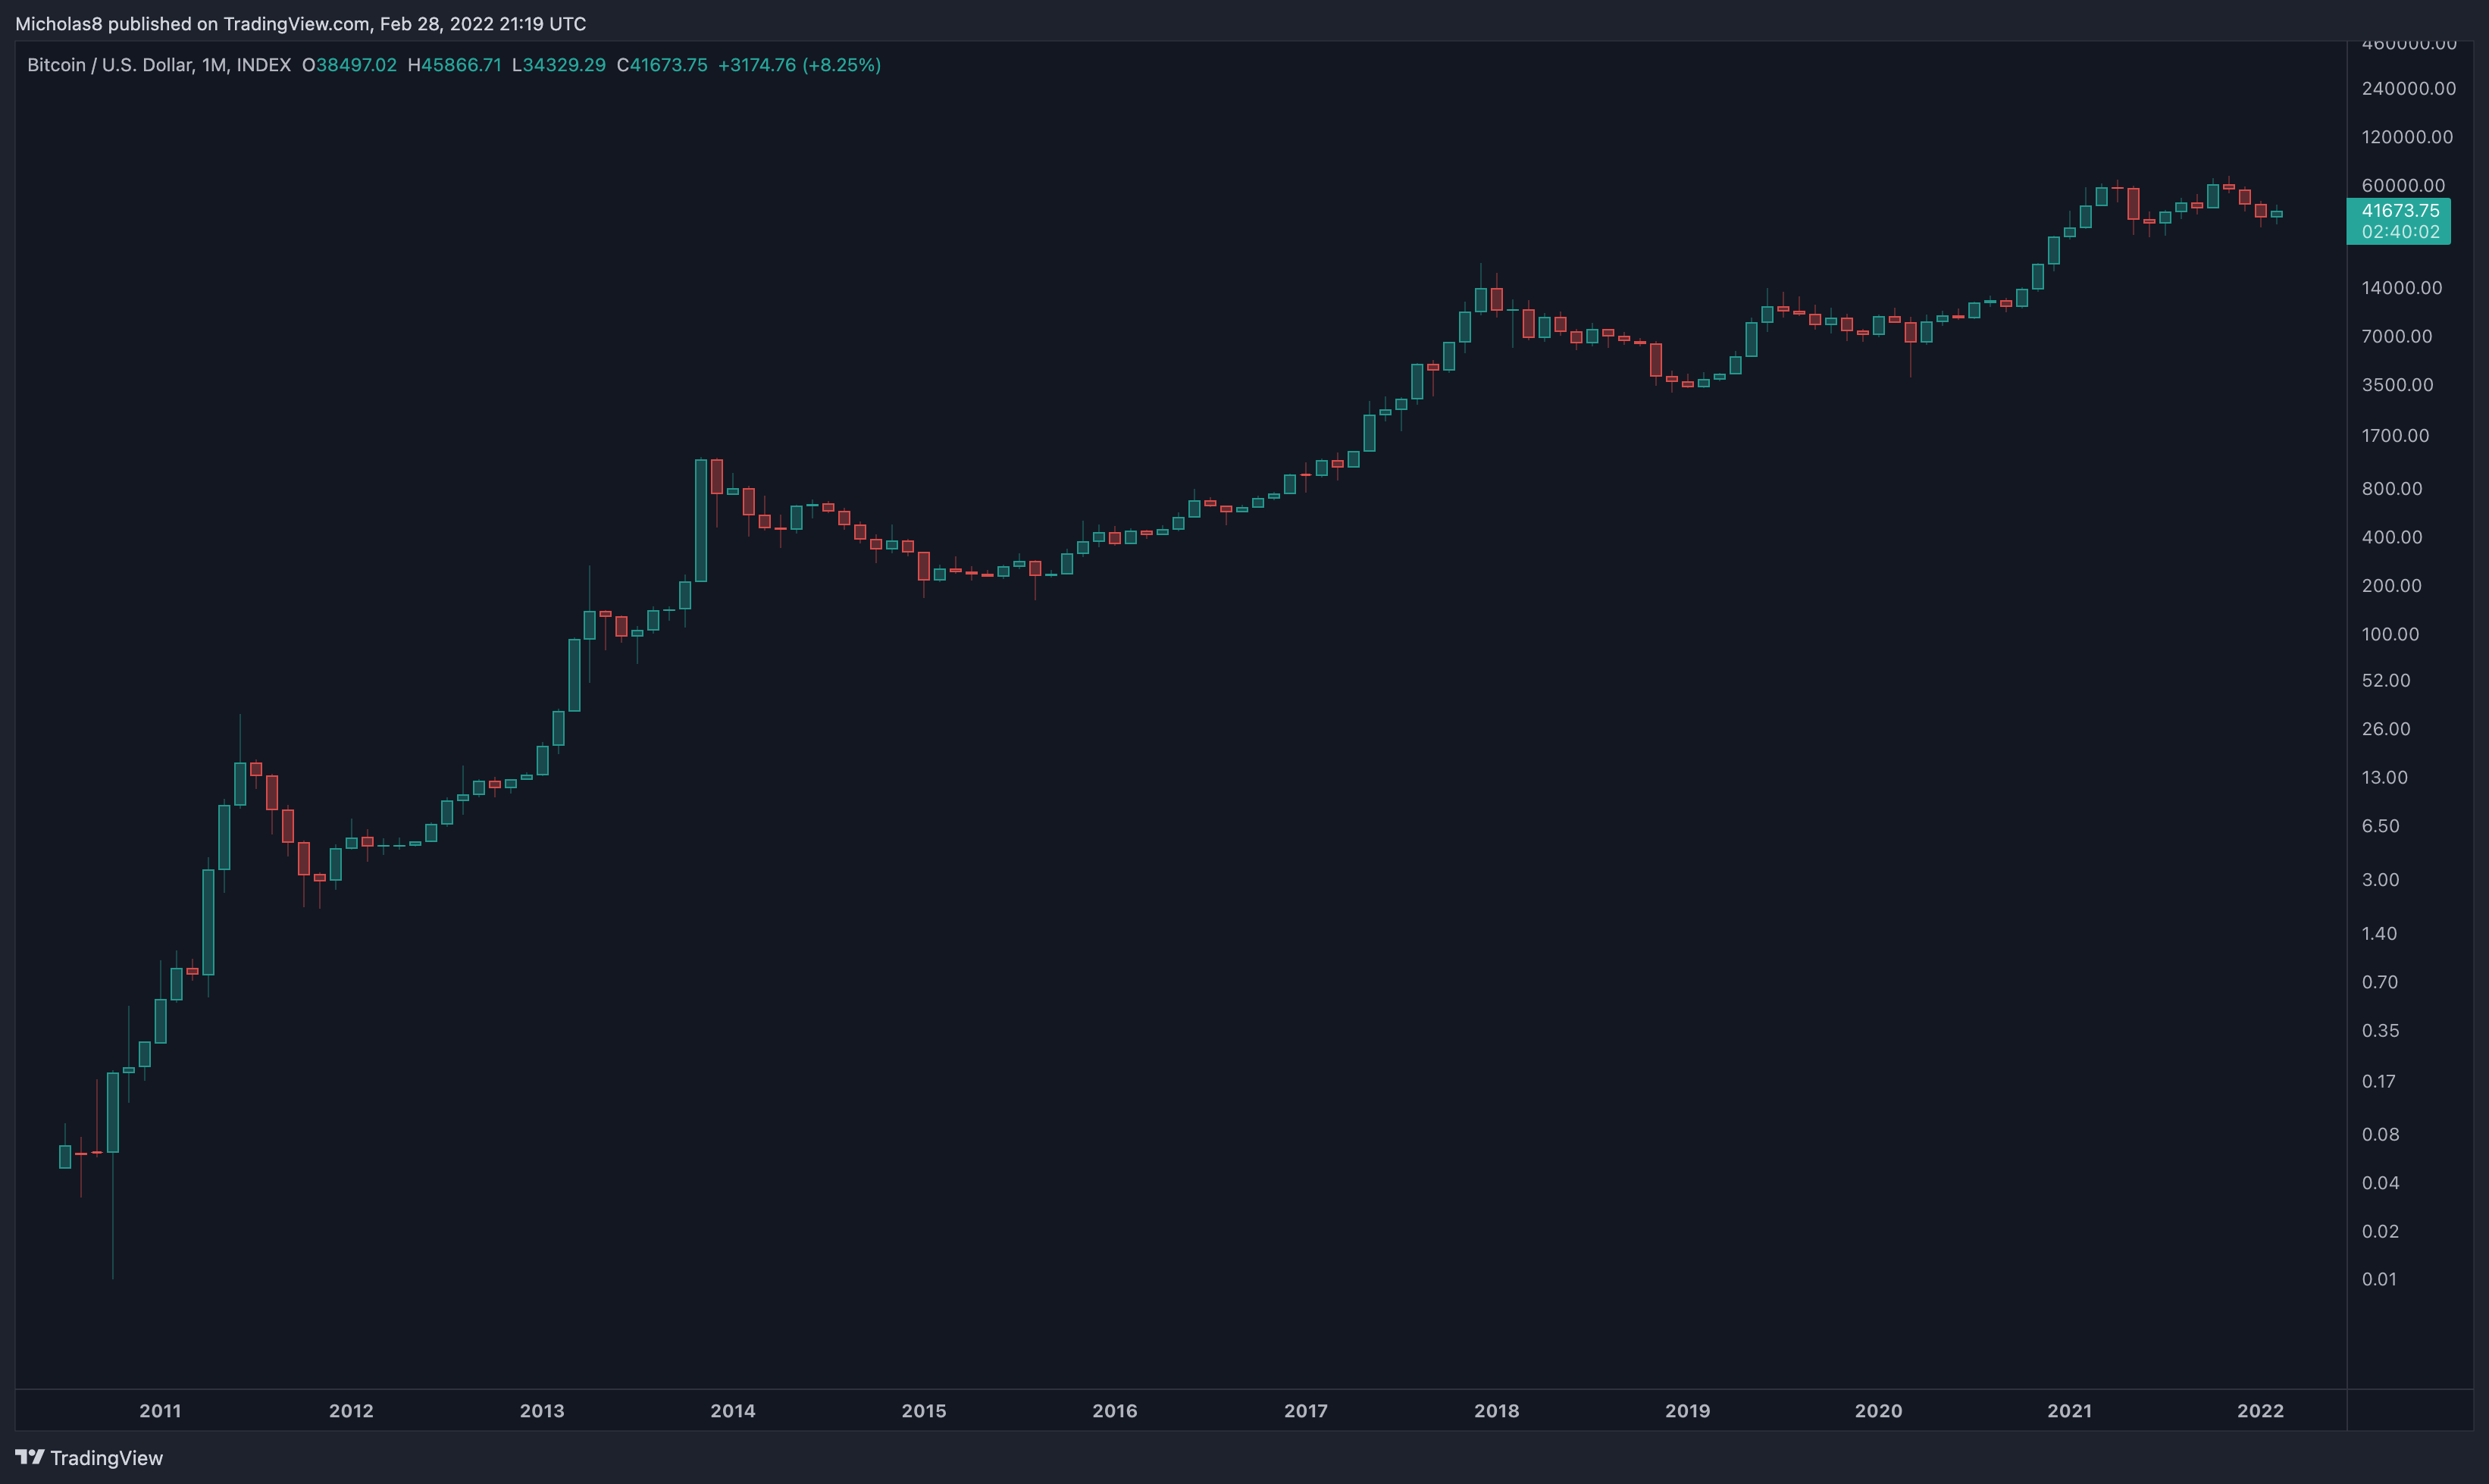
Relative Strength Index (RSI)
Bitcoin will close again in the "Neutral Zone" between 40-60.
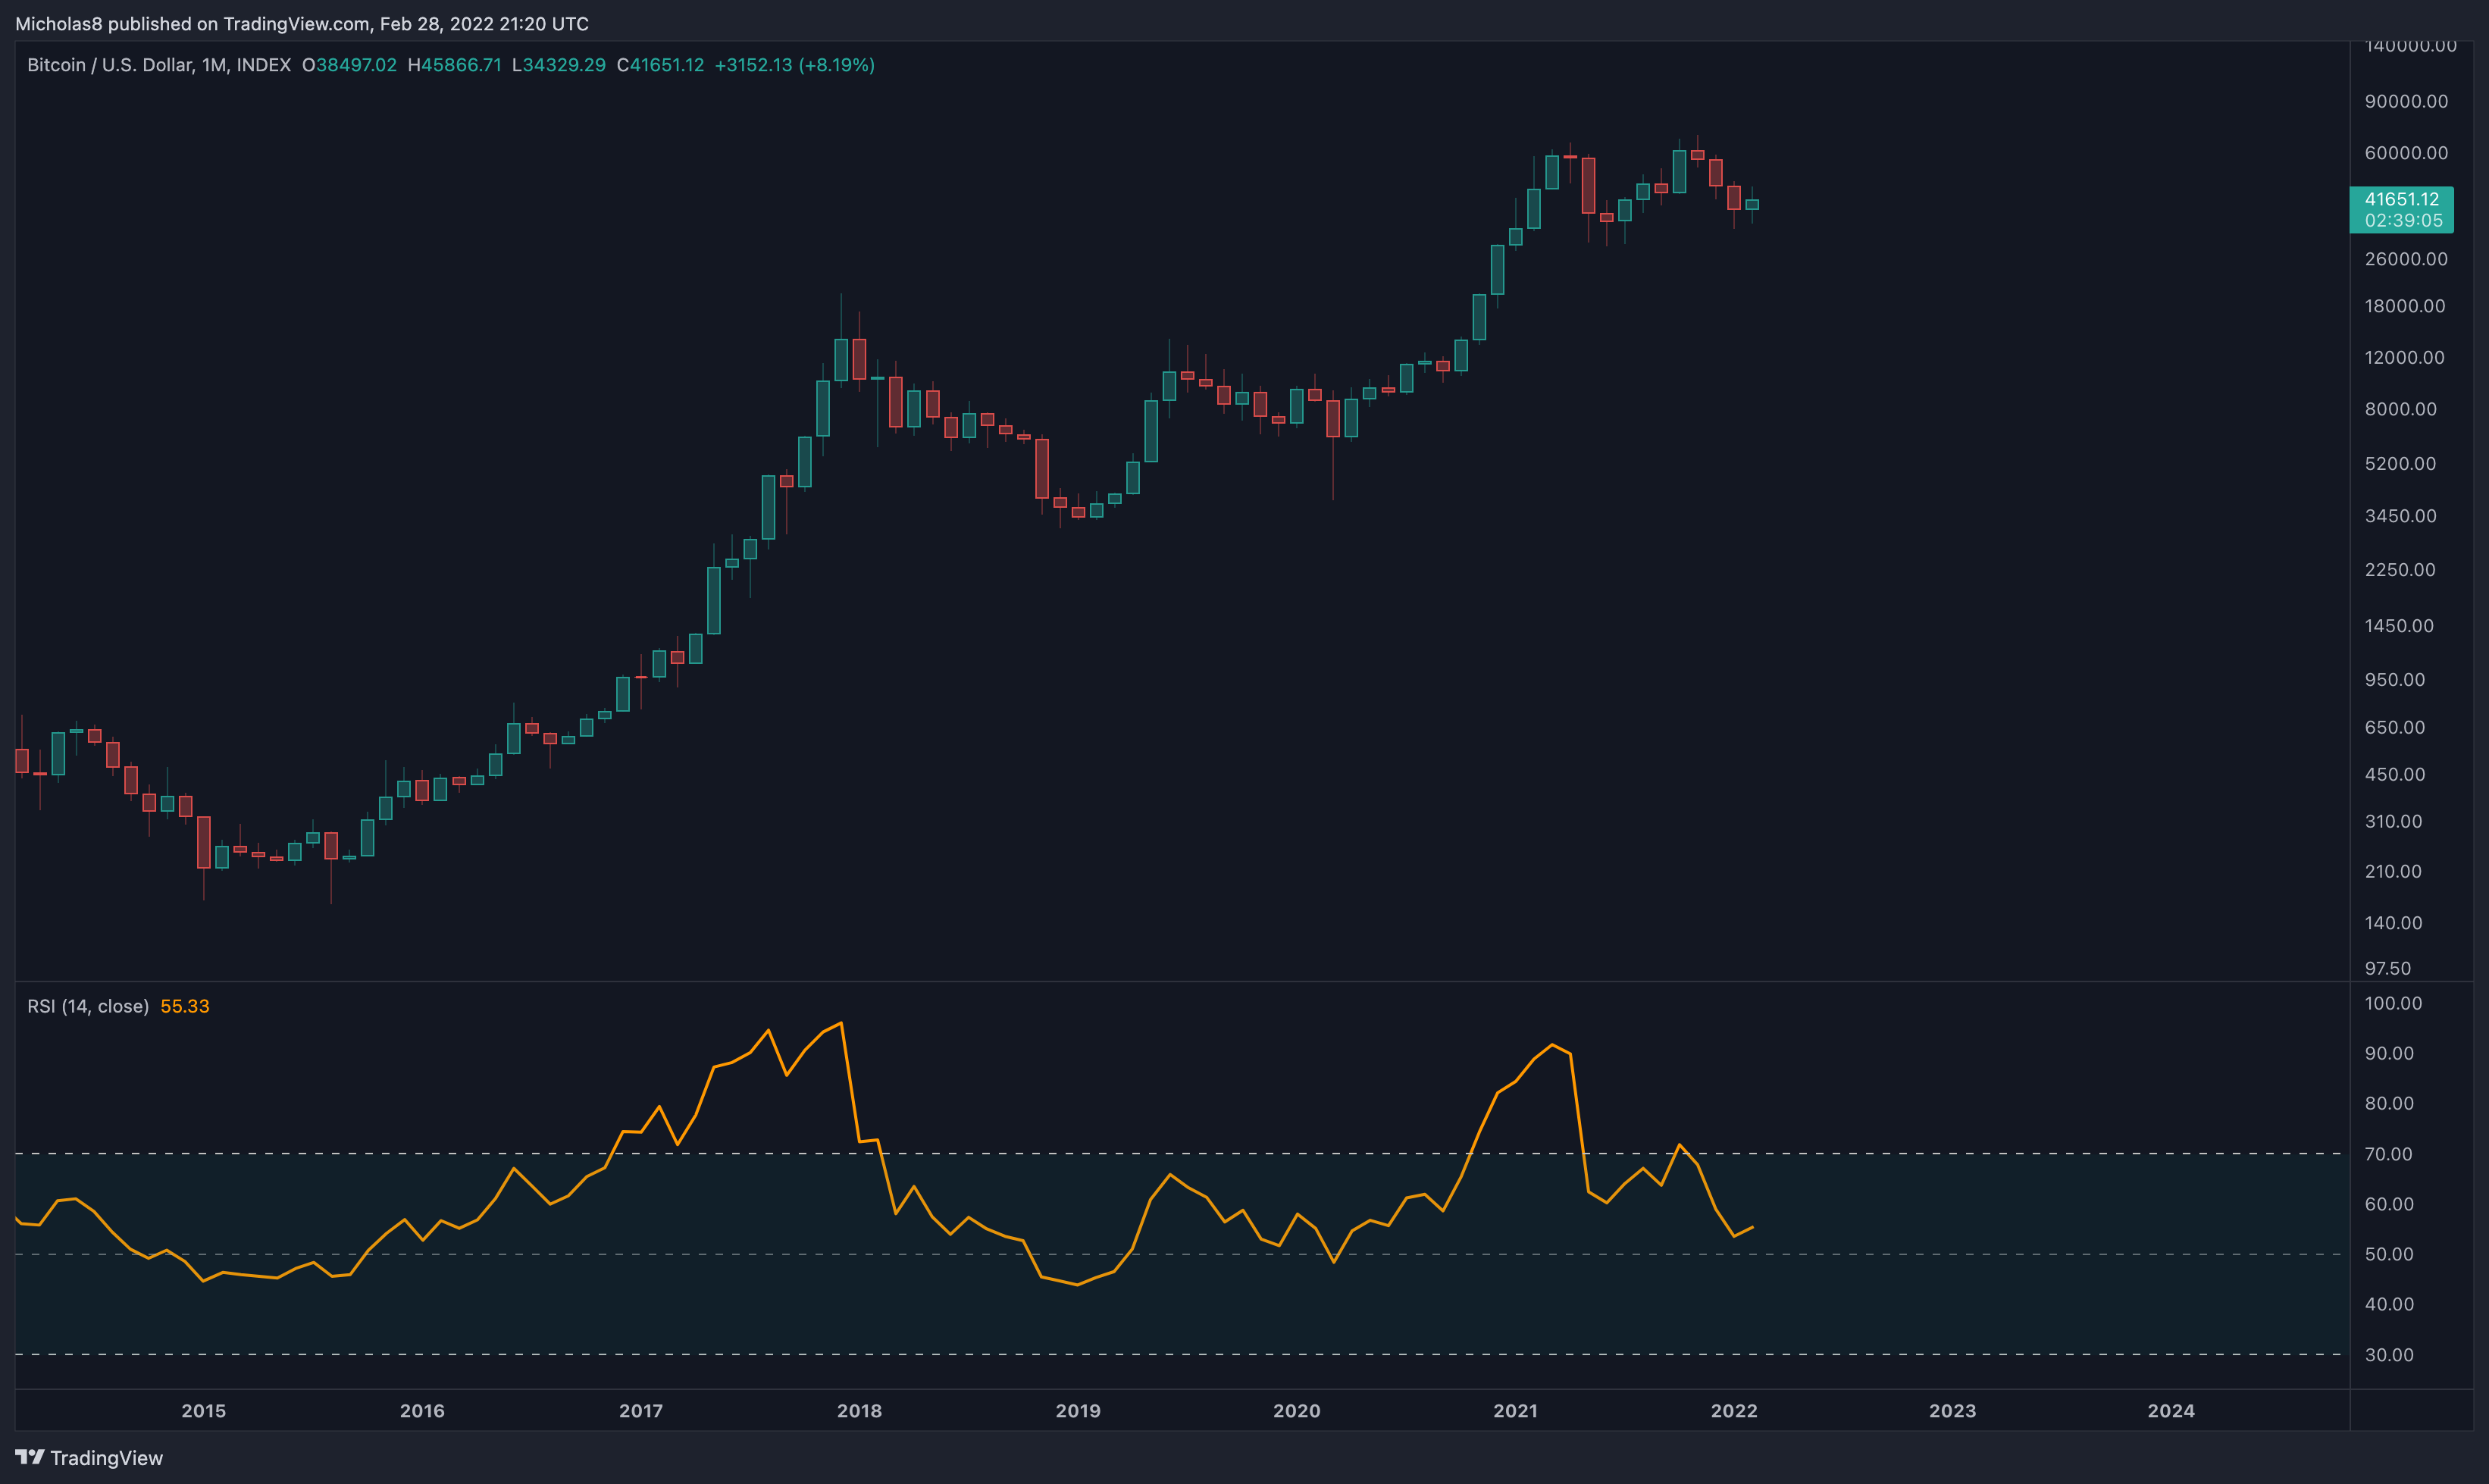
Moving Average Convergence Divergence (MACD)
The MACD will yet again print a red histogram bar. This implies that momentum is still bearish on a macro level.
Bearish Divergence
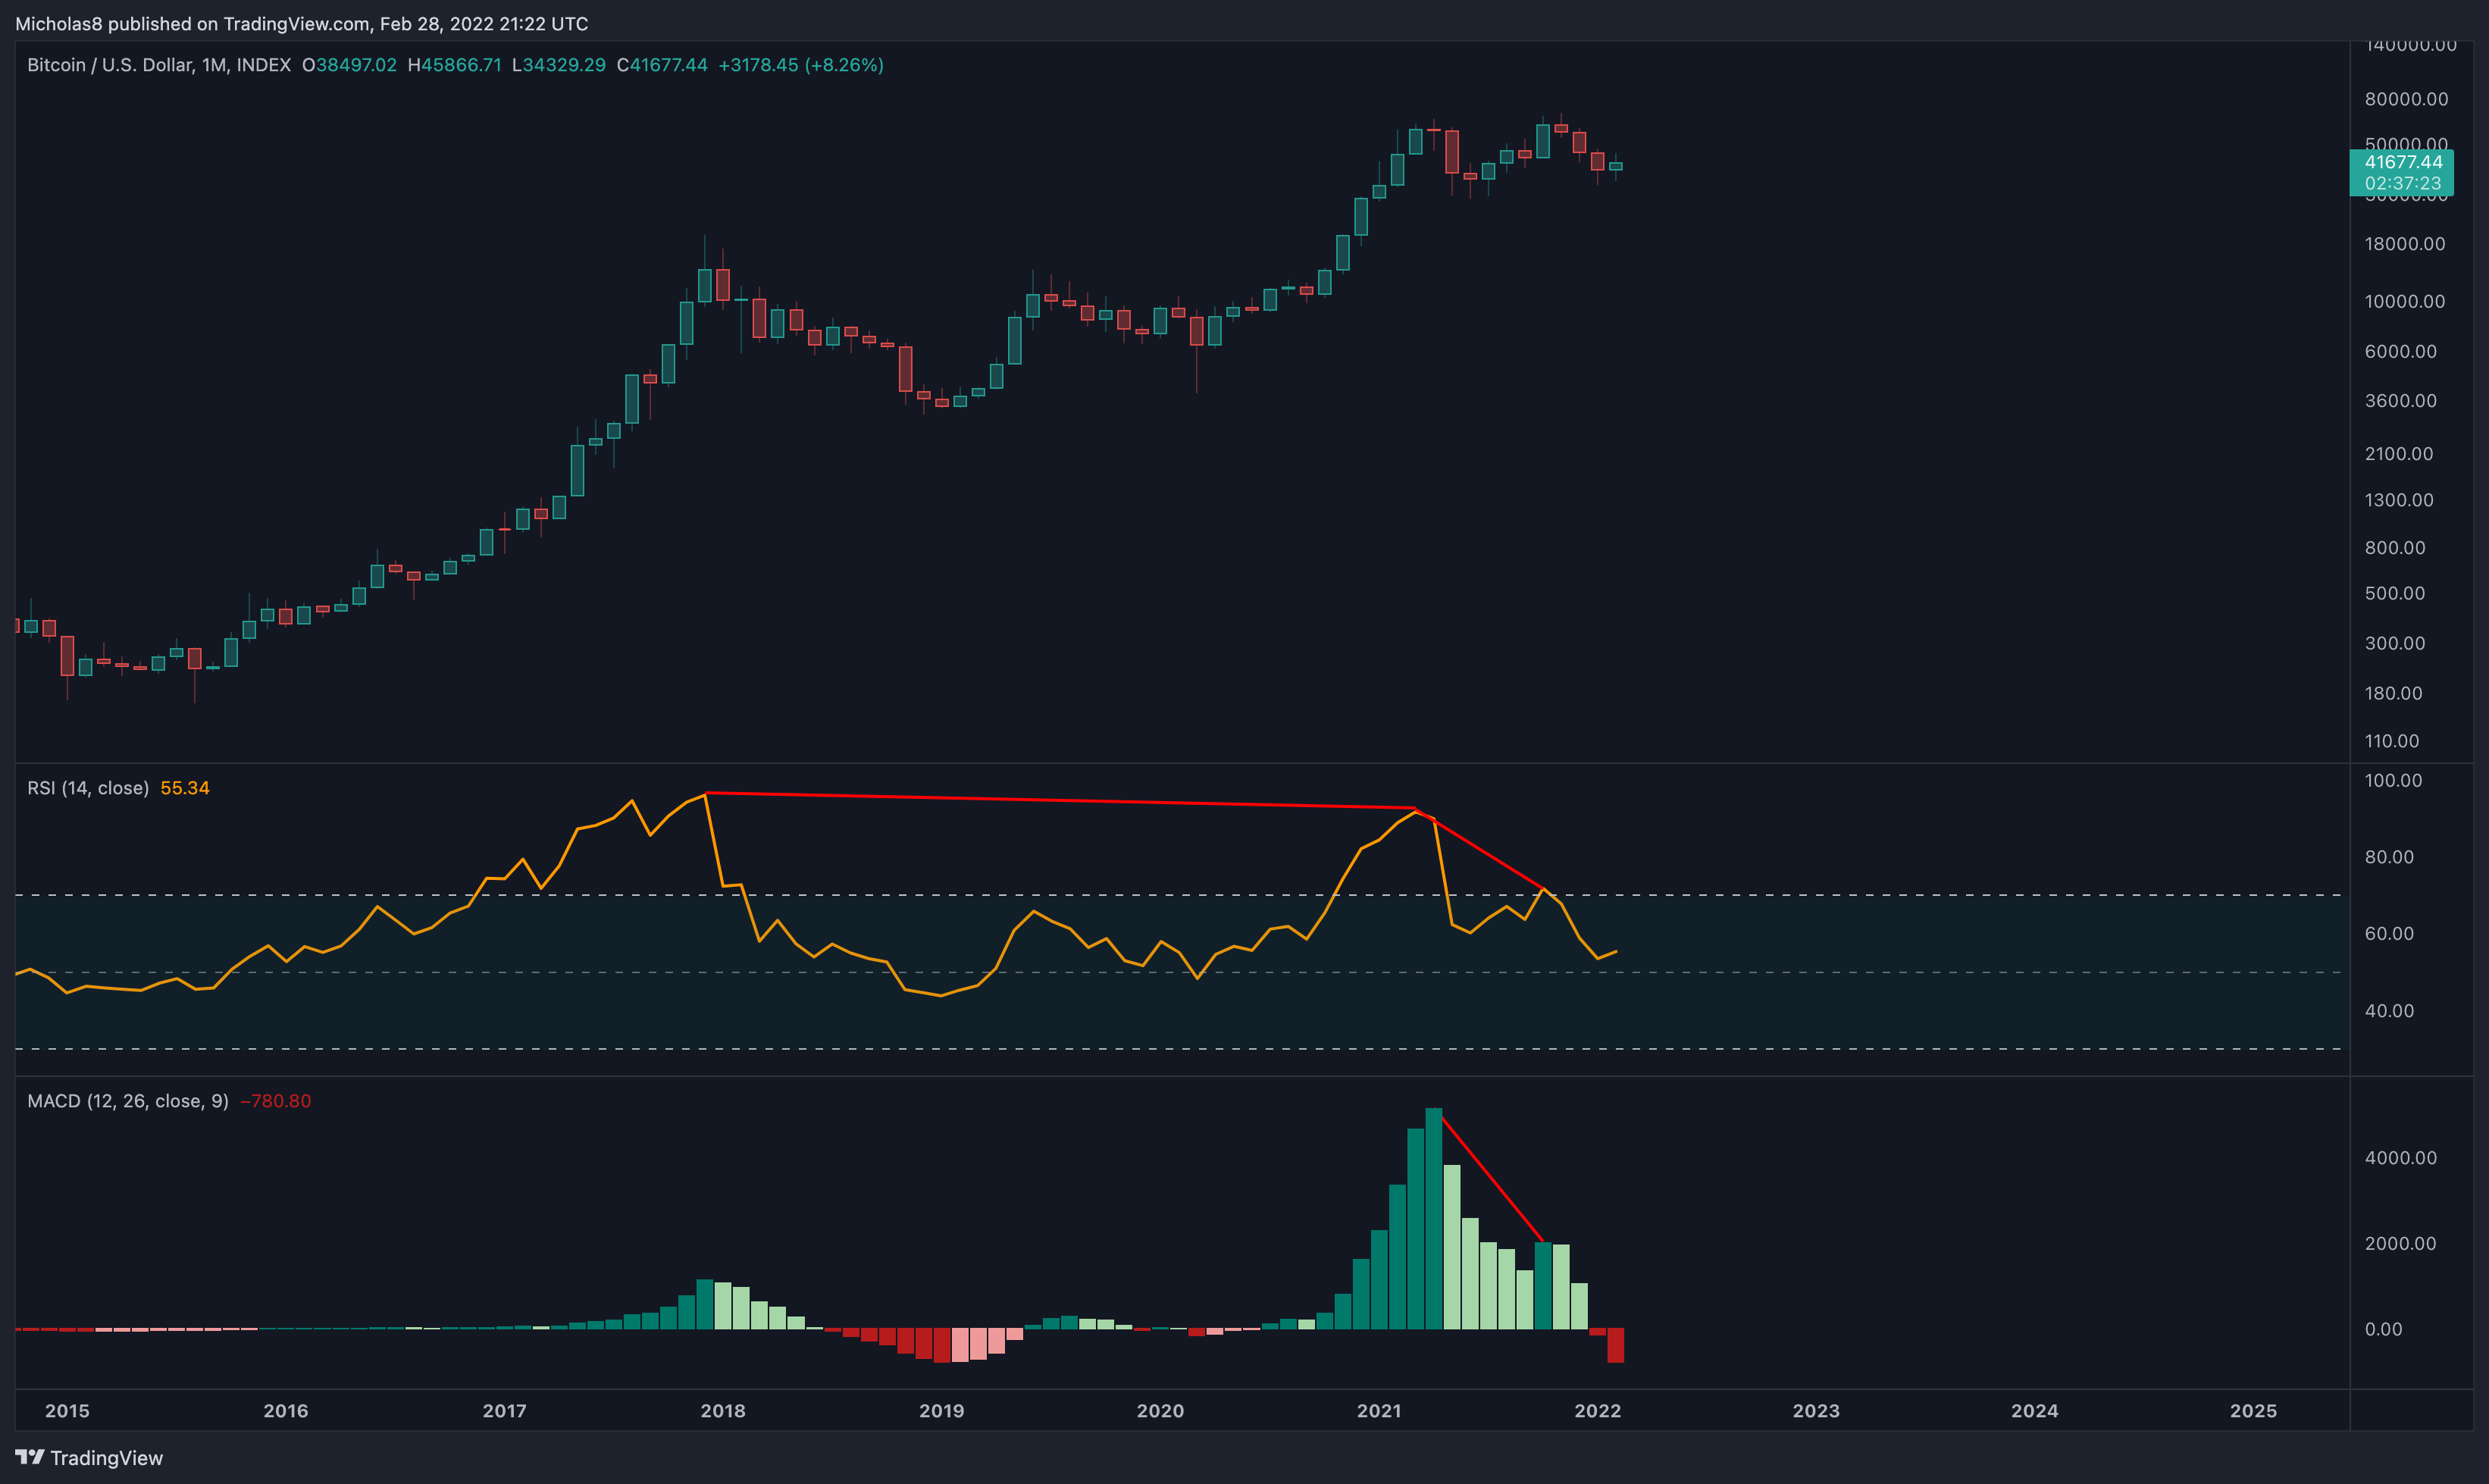
Bitcoin has a higher high in price, with a lower high on the RSI/MACD. This is a bearish divergence, which signals a possible trend reversal down.
Note: This is a very high timeframe and it can take months for this to fully play out. Given that it is such a high timeframe, it also offers a lot more opportunity to invalidate this divergence.
Invalidation: Higher high in price and the oscillators.
Potential Hidden Bullish Divergence
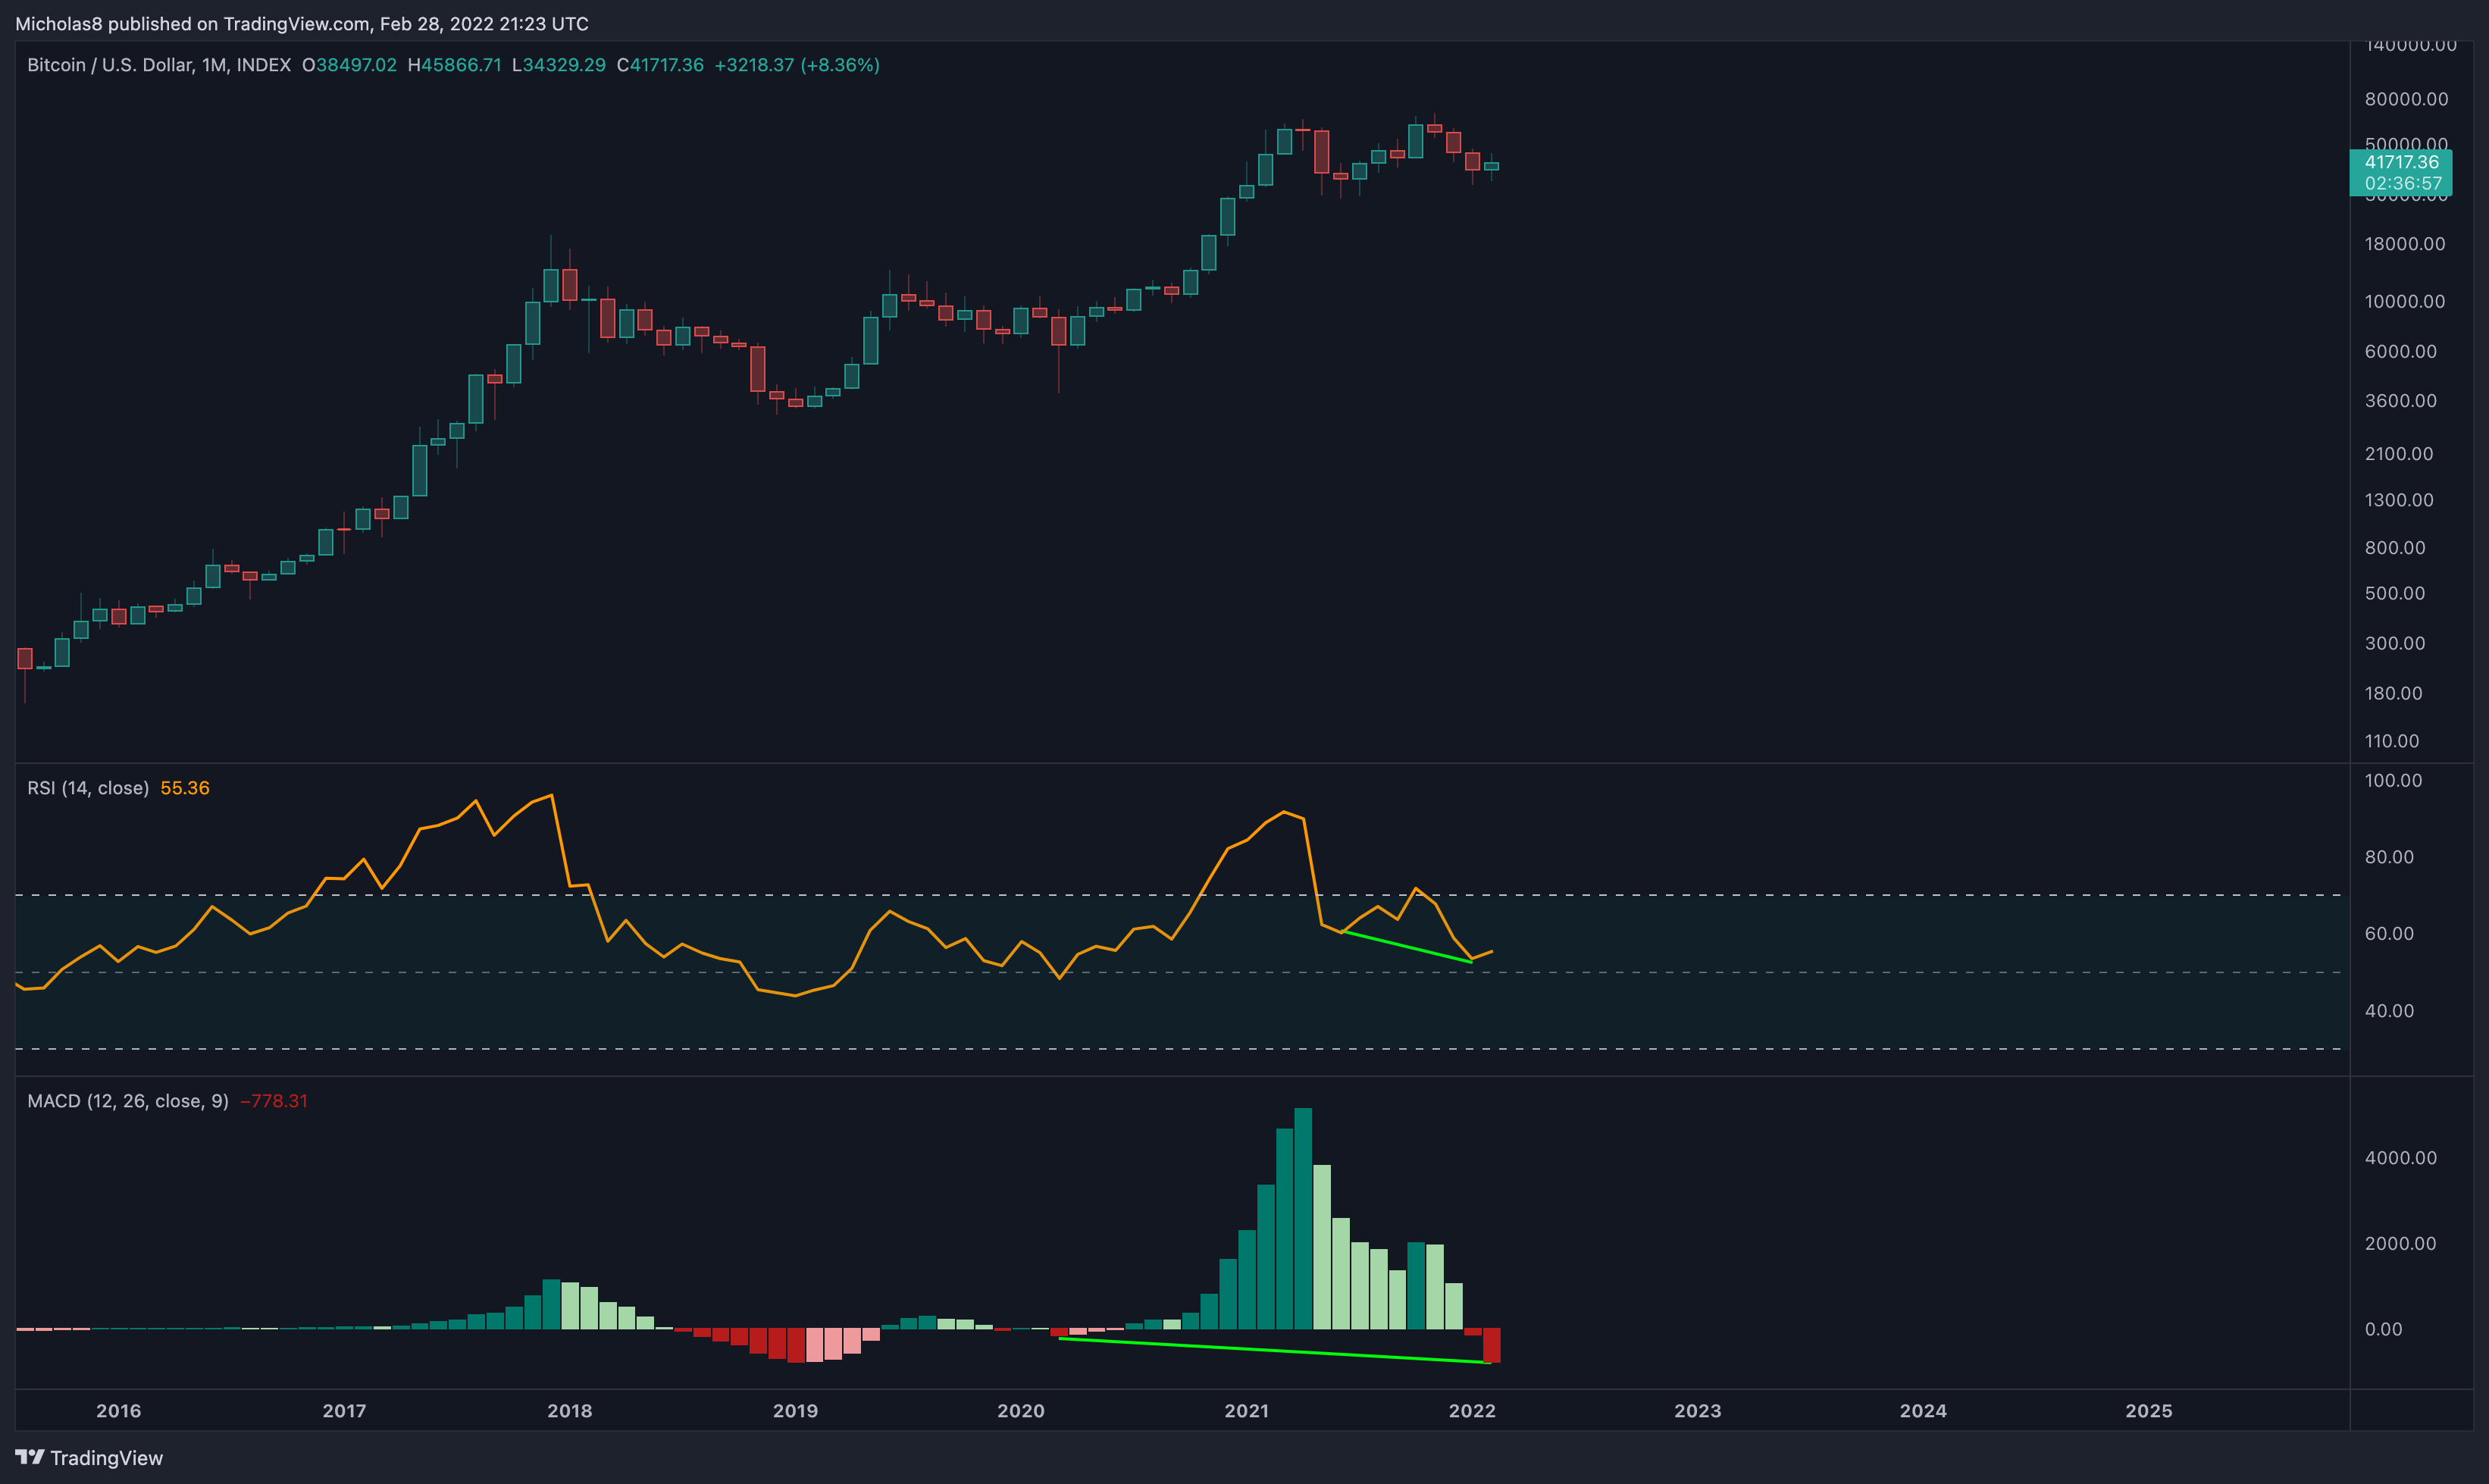
Bitcoin has a higher low in price, with a lower low on the RSI/MACD. This is a hidden bullish divergence, which signals a possible trend continuation up.
Note: This is a very high timeframe and it can take months for this to fully play out. Given that it is such a high timeframe, it also offers a lot more opportunity to invalidate this divergence.
Invalidation: Lower low in price and the oscillators.
March's Historic Performance
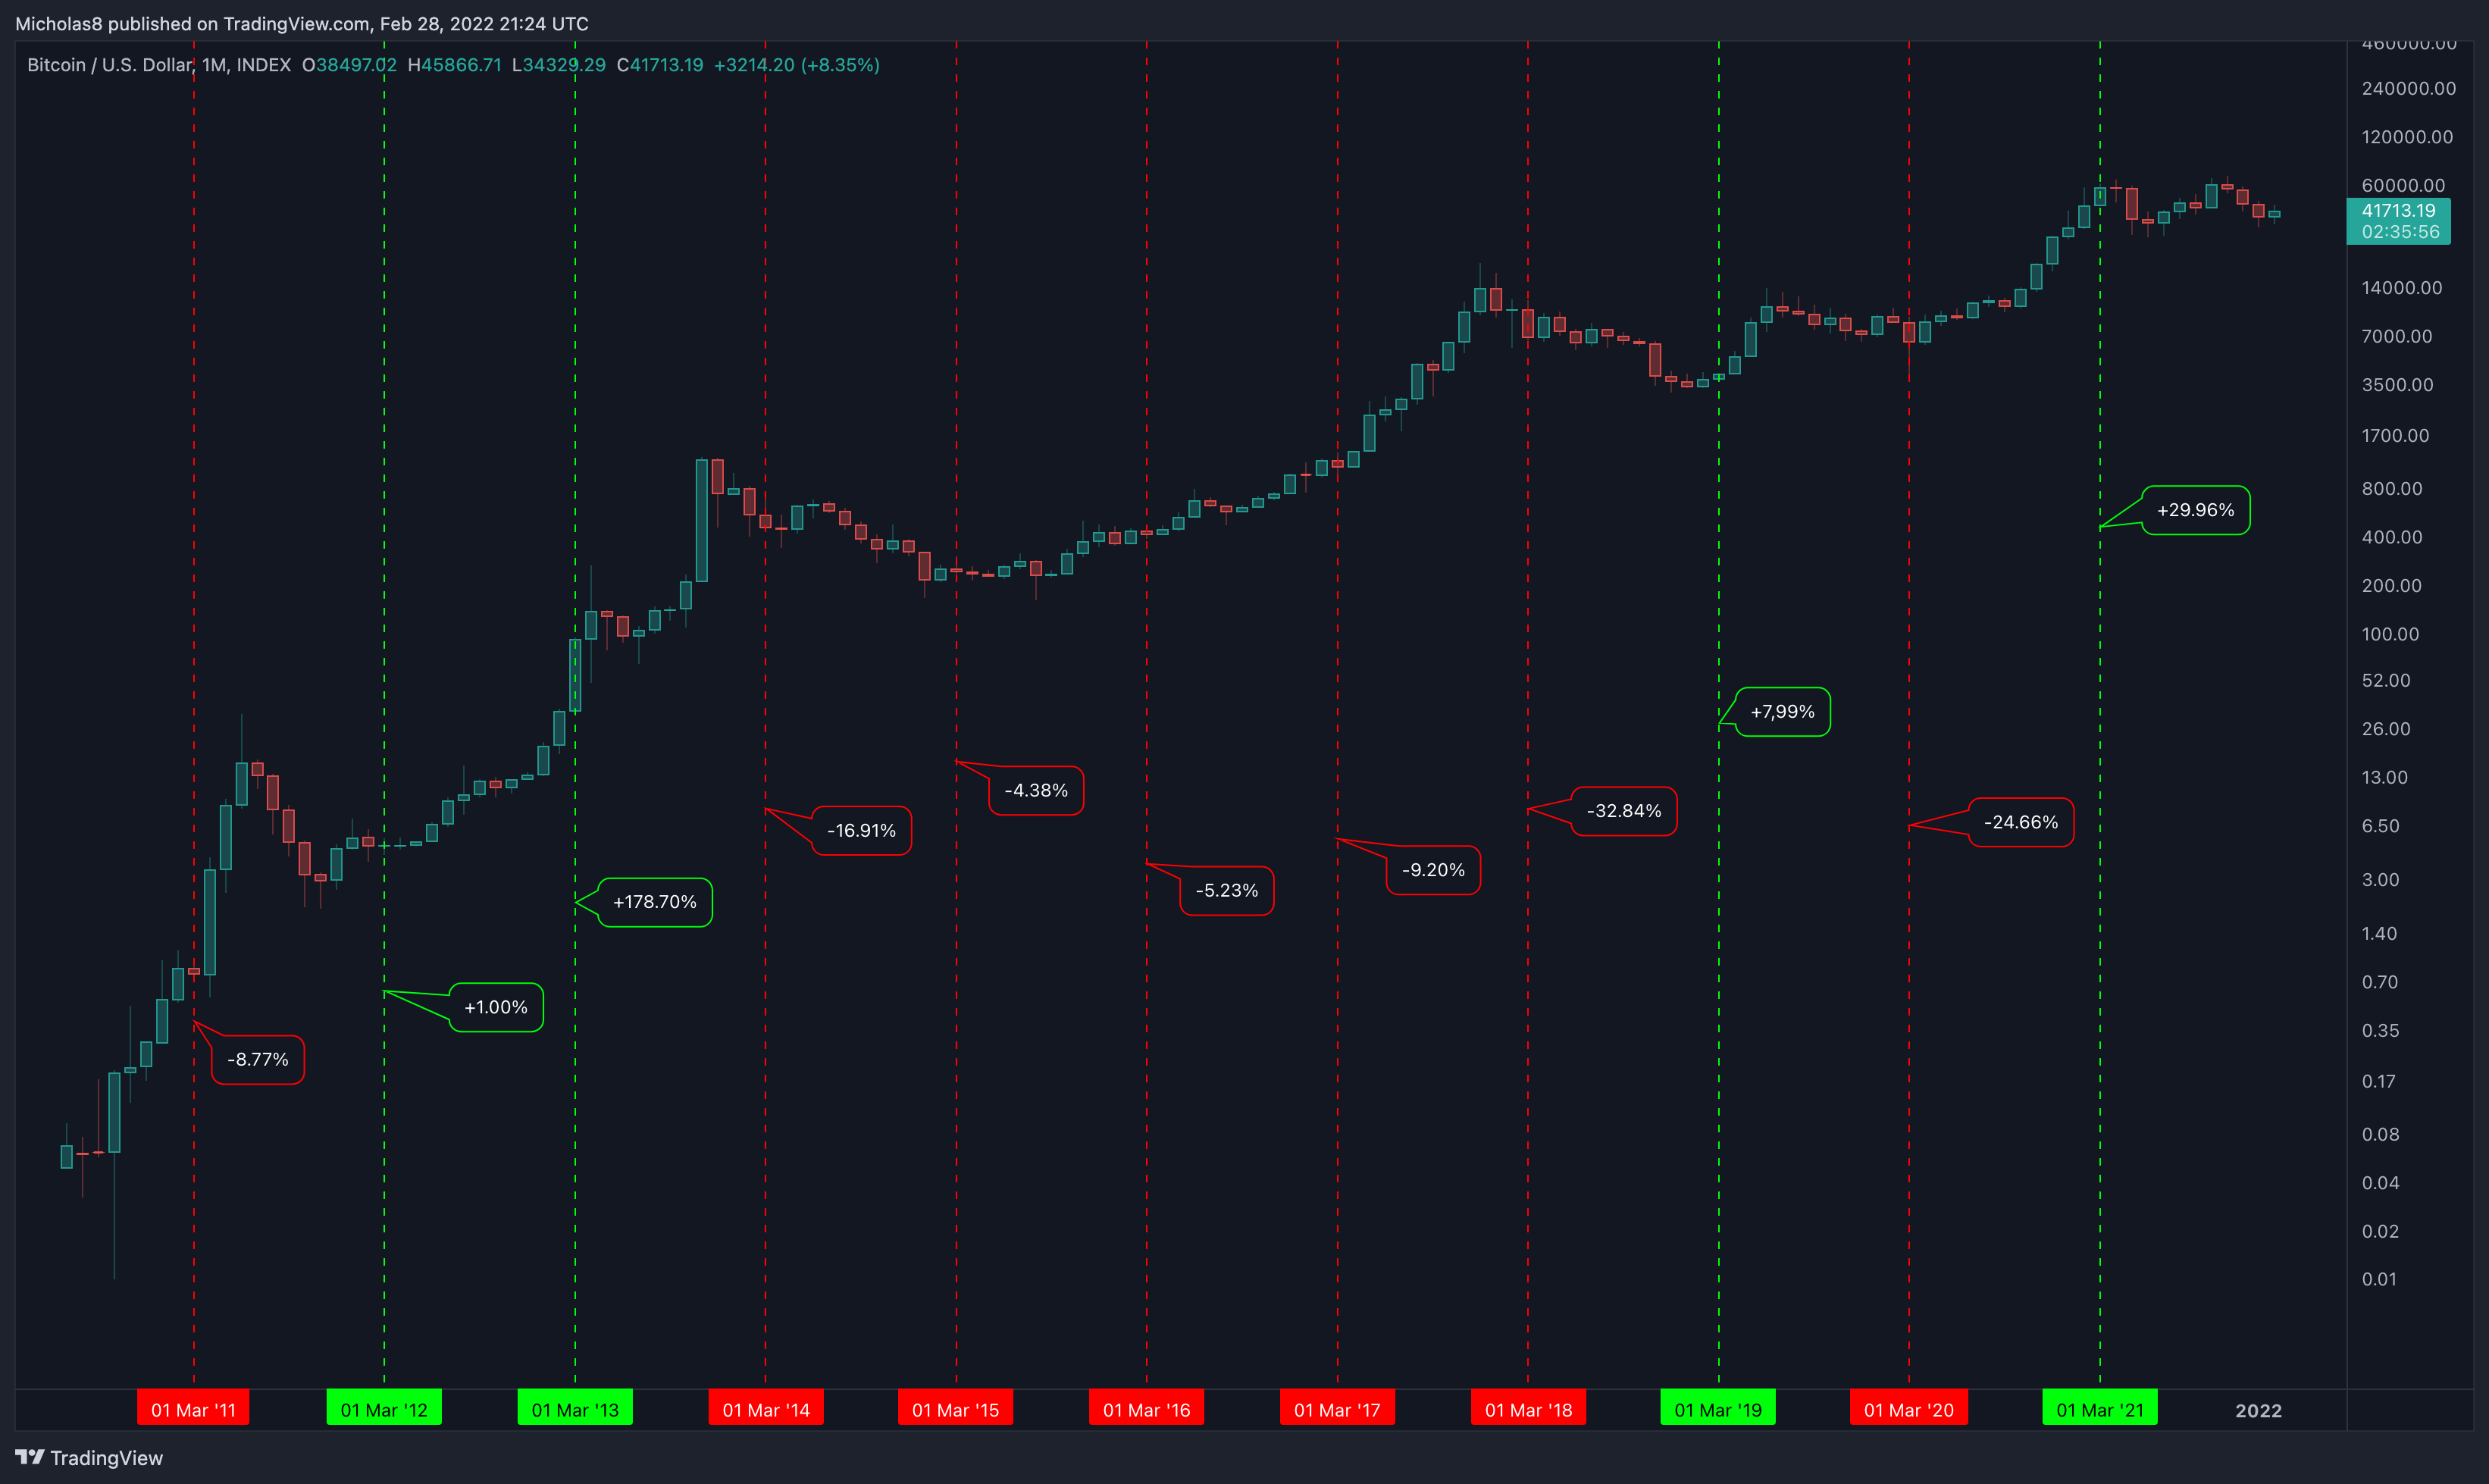
Historically, March has been a red month for Bitcoin. But, since we did have that one +178.70% month, technically, the average performance from open to close, is a positive 15%. If we were to exclude that single data point as an 'outlier', the average performance would sit at -1.25%
If we take the average performance over the last four years, we see an average fall of -4.89%.
Let's say Bitcoin closes tonight at 42k flat. Based on these numbers, it would bring us between 39.9k-41.4k.
If we include the outlier, it would bring us to 48.3k.
Note: Past performance does not indicate future results.
THE GOOD
1D Timeframe
Divergence(s)
Hidden Bullish Divergence
Bitcoin has a higher low in price, with a lower low in the MACD. This is a hidden bullish divergence, which signals a possible trend continuation up.
Invalidation: Lower low in price and in the MACD.
Network Value to Transaction (NVT)
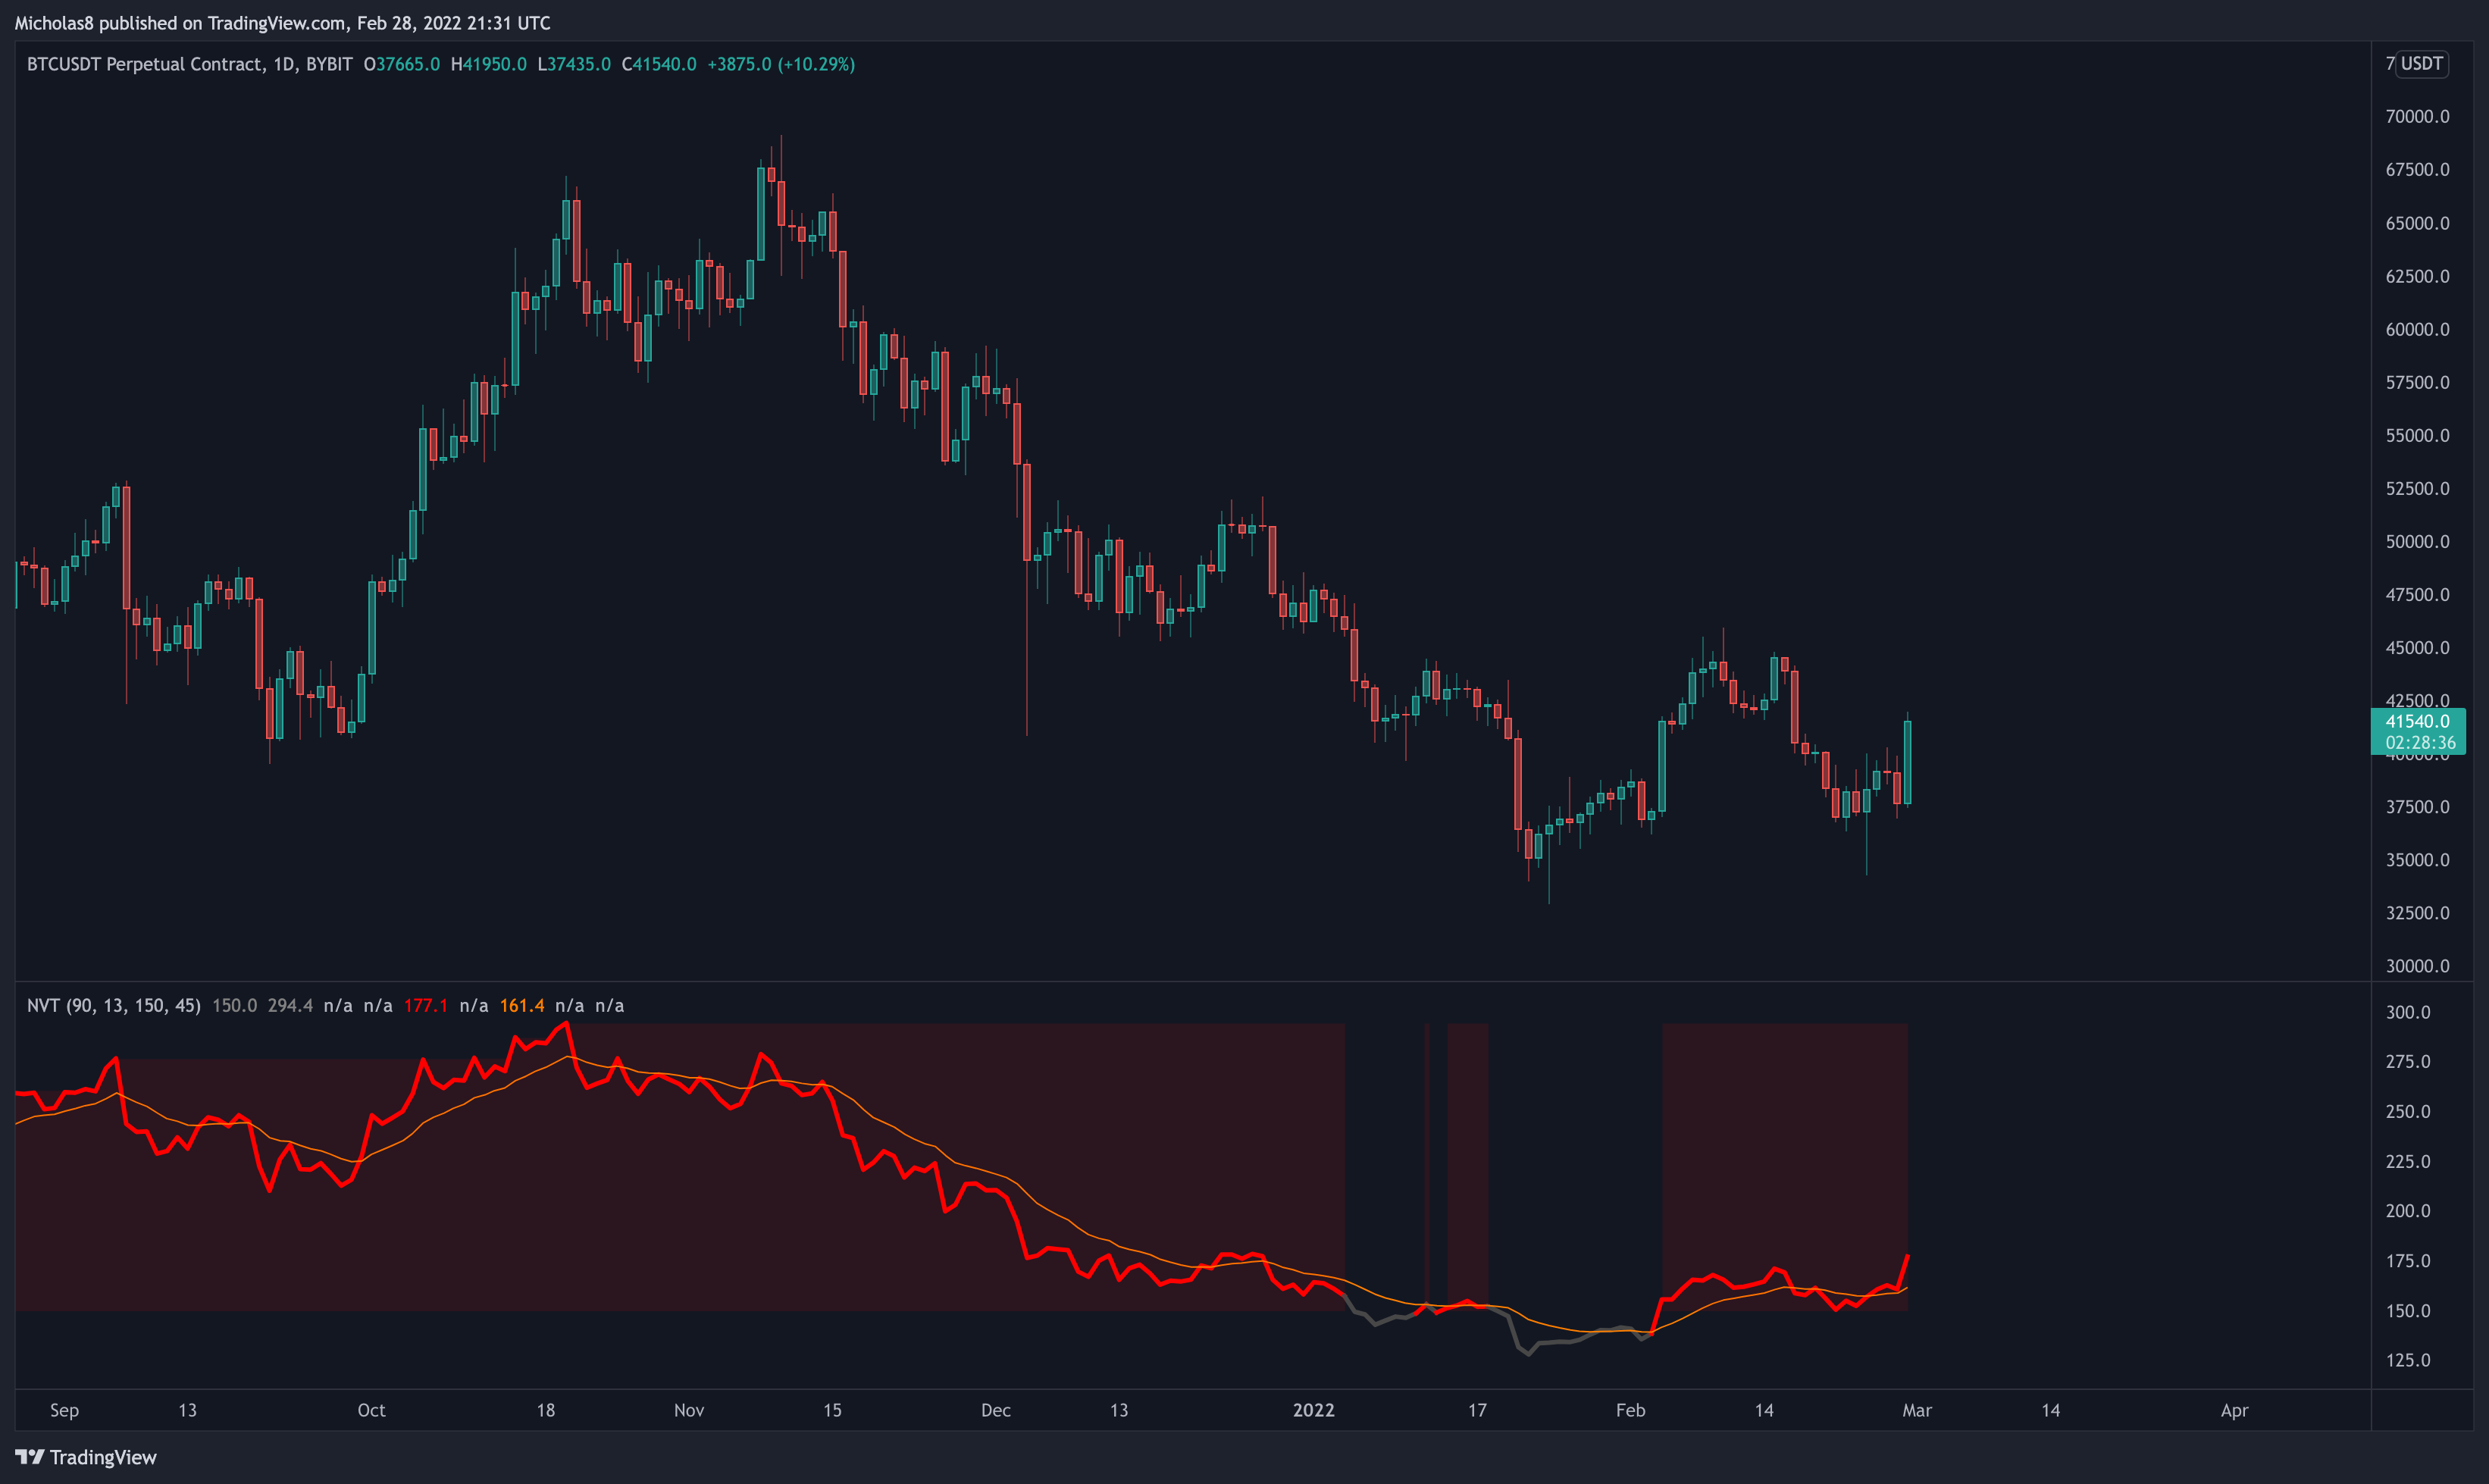
*This indicator describes the relationship between market cap and transfer volumes.
Bitcoin has reclaimed the NVT Signal Line as support.
Implication(s): Bullish price action typically follows after holding the NVT Signal Line as support.
Exponential Moving Average (EMA): 8 and 21
Bitcoin has risen above the 8/21-day EMAs.
Implication(s): Ideally, they serve as a level of support.
4H Timeframe
Key Liquidity Zone(s)
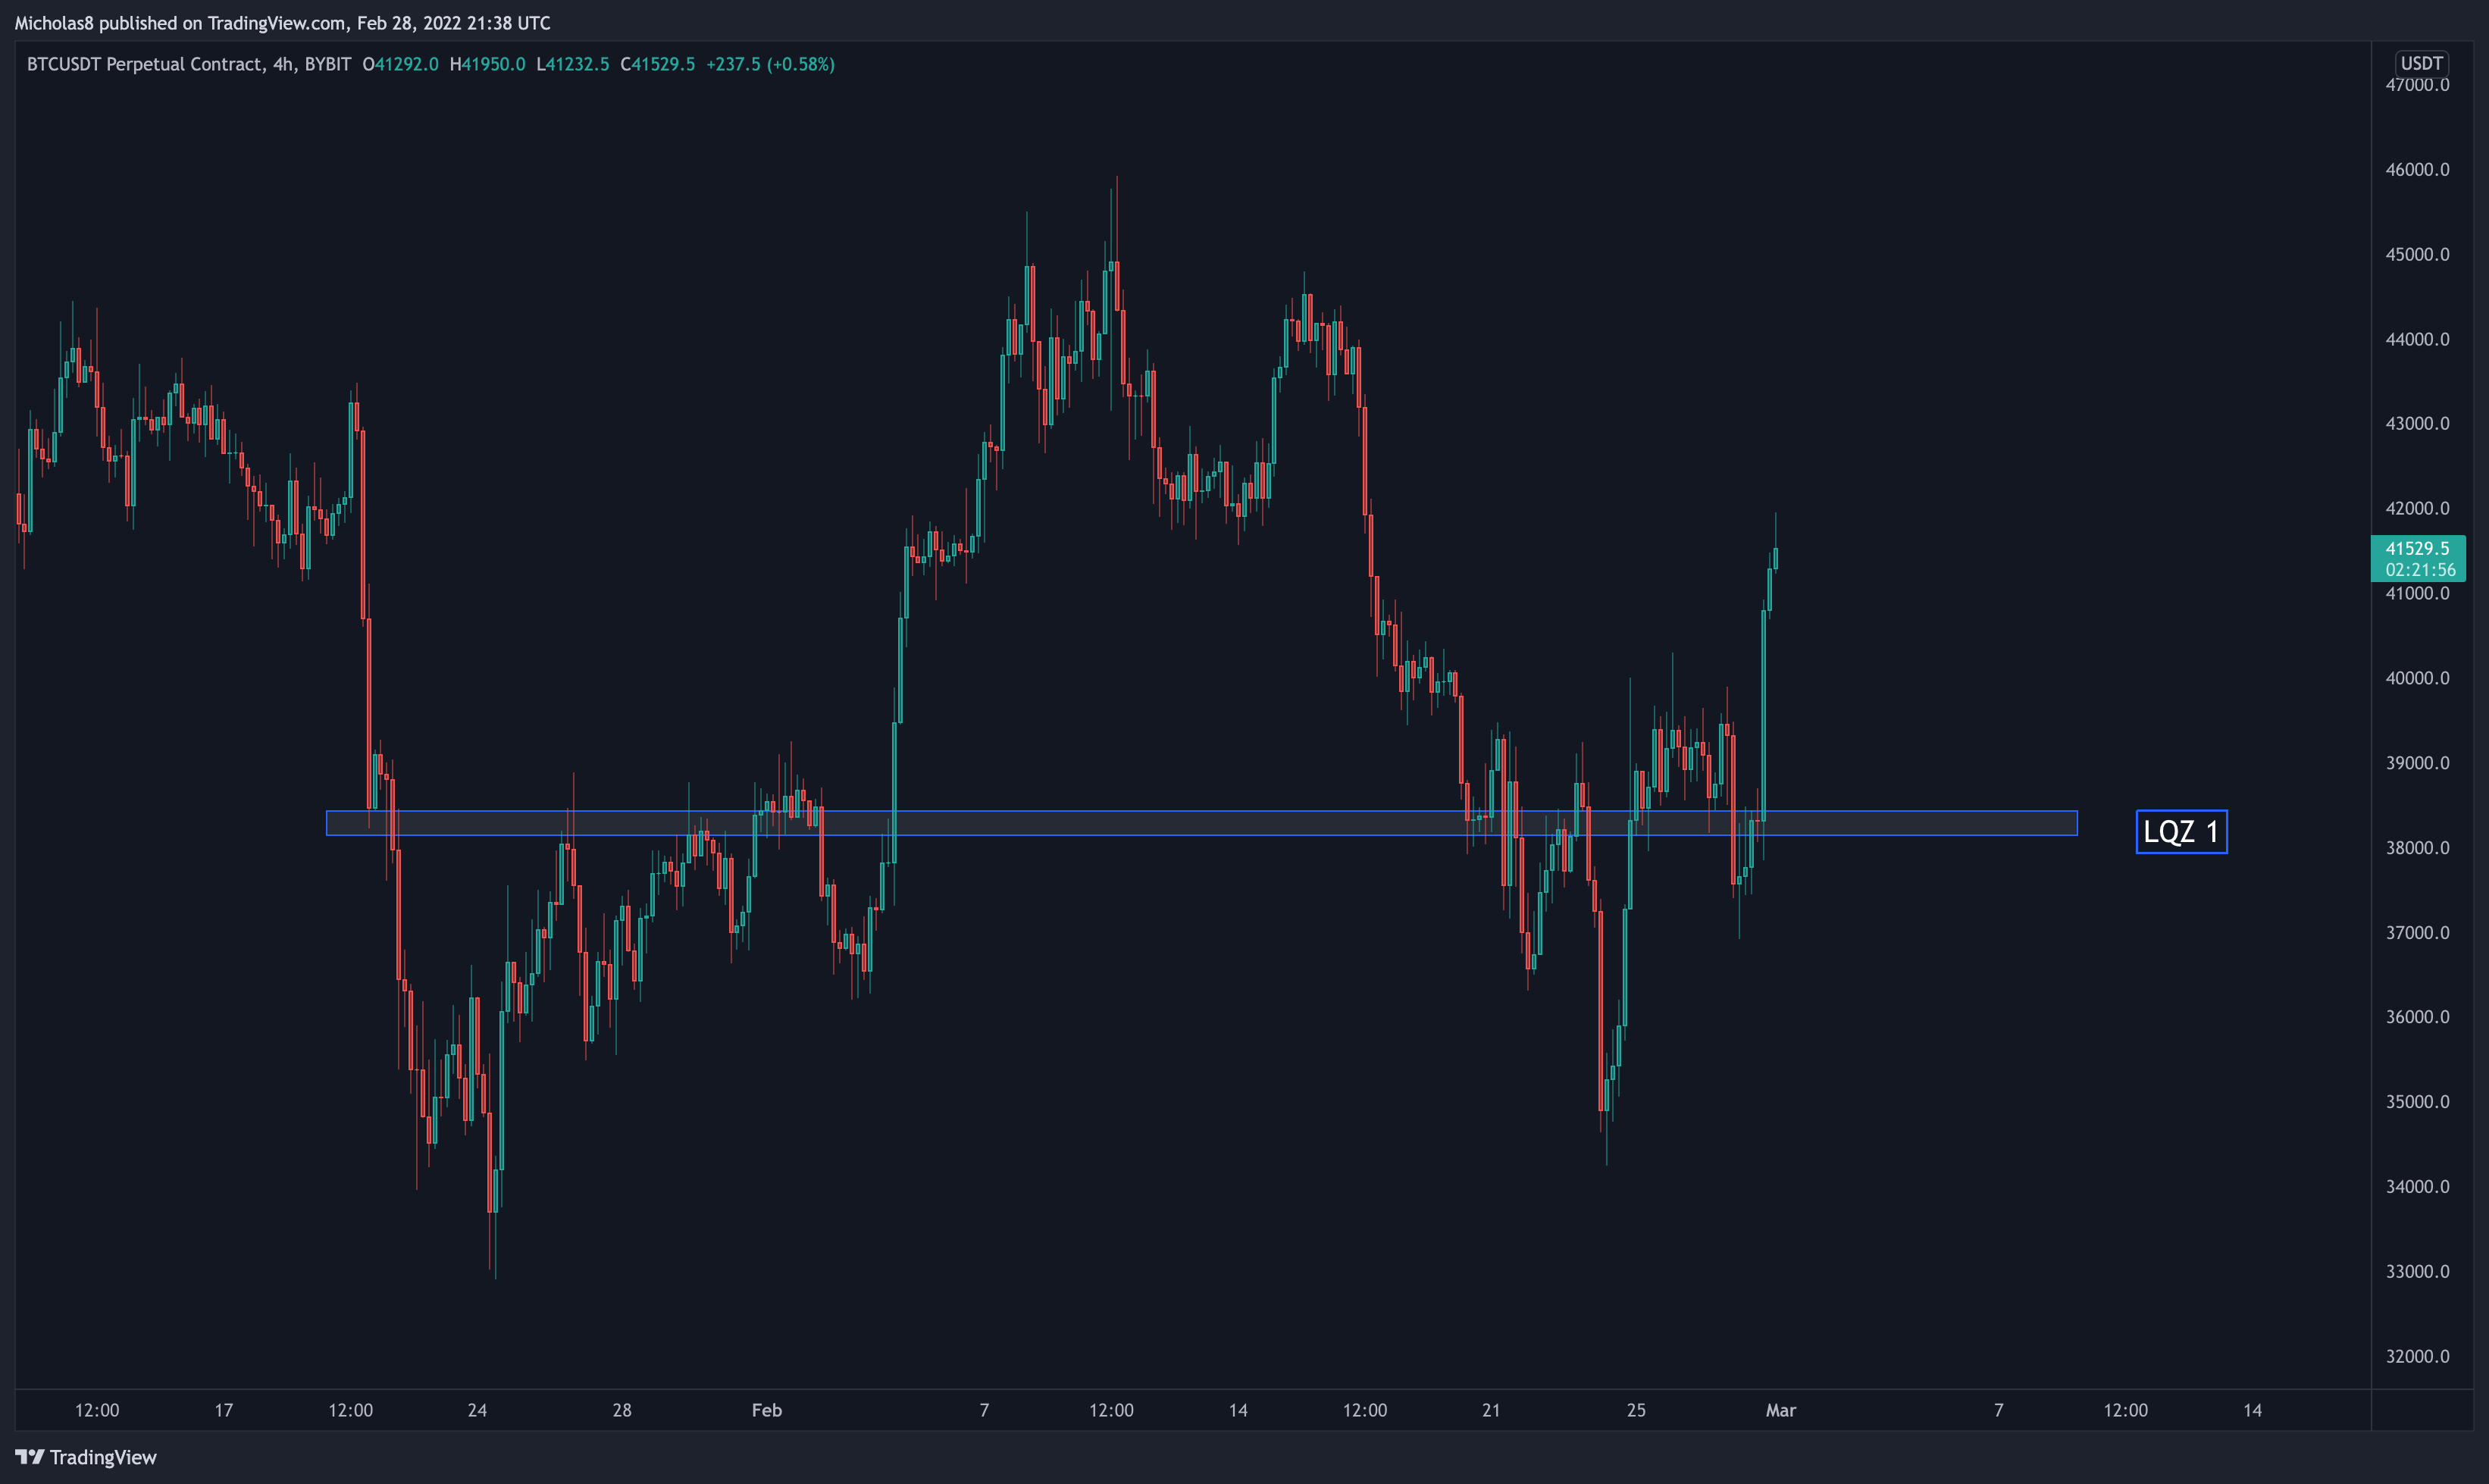
Zone 1: This LQZ sits at 38.1k-38.4k, which Bitcoin has reclaimed as support.
Implication(s): Ideally, it continues to serve as support.
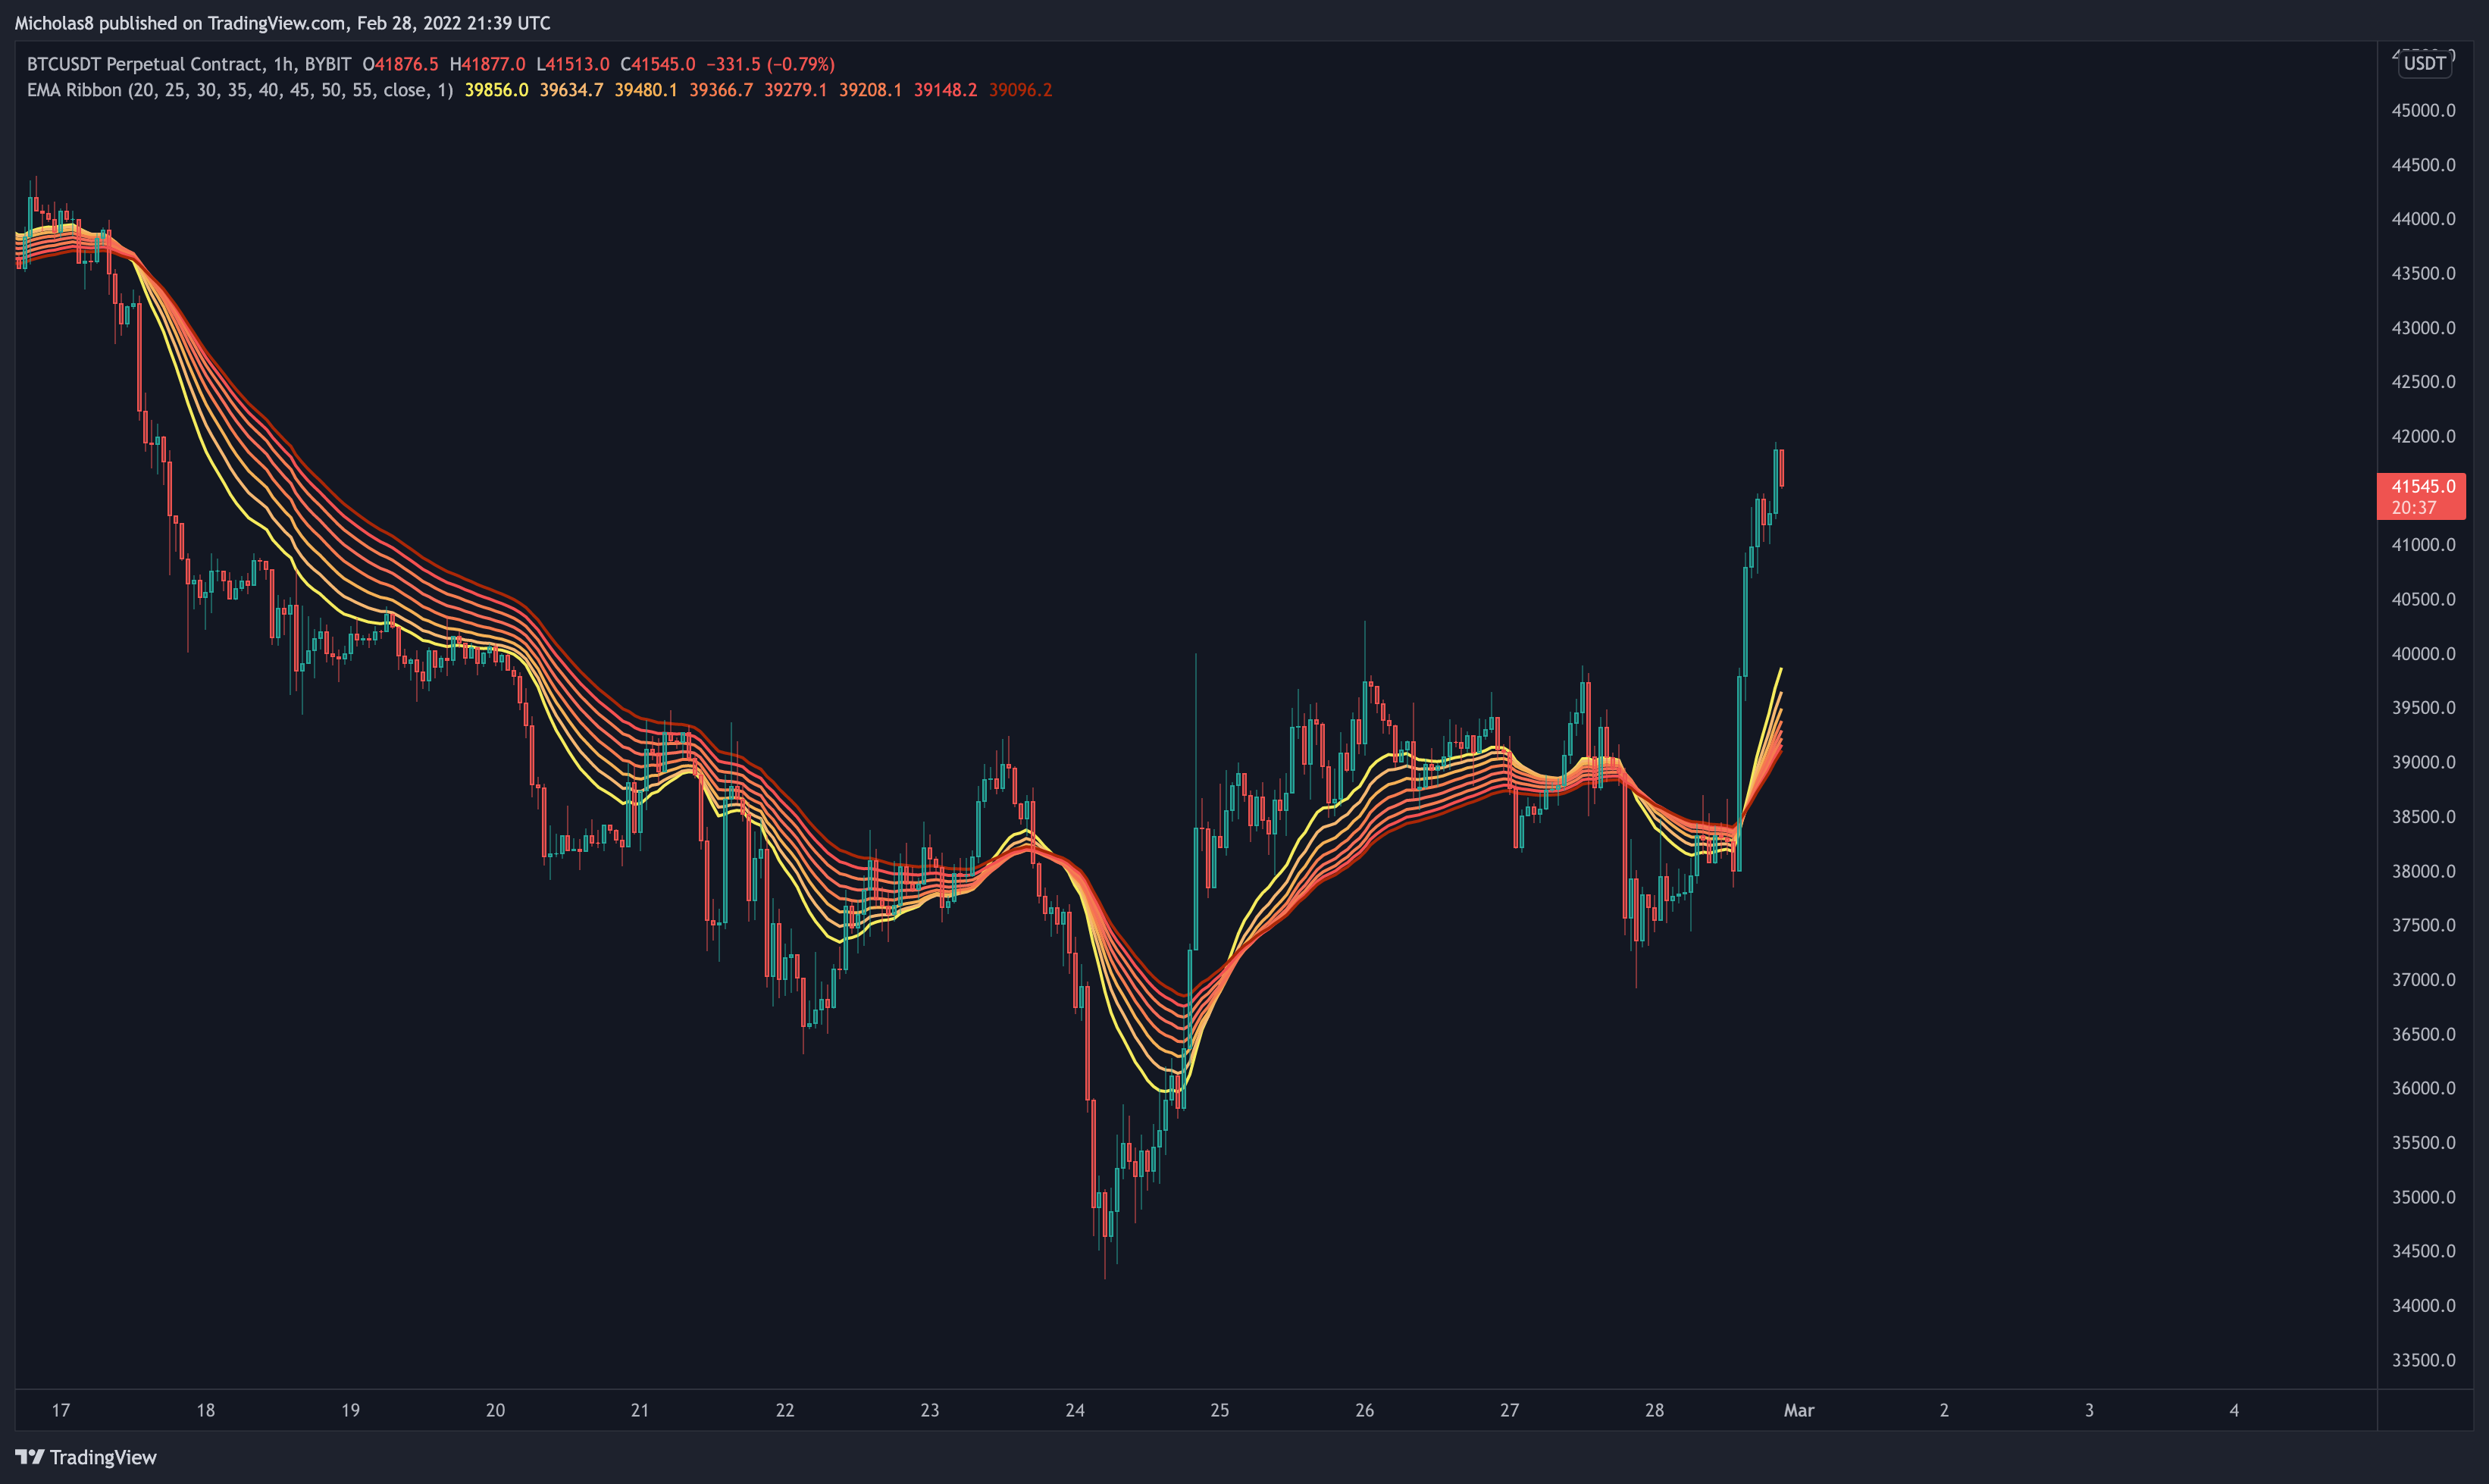
EMA Ribbon
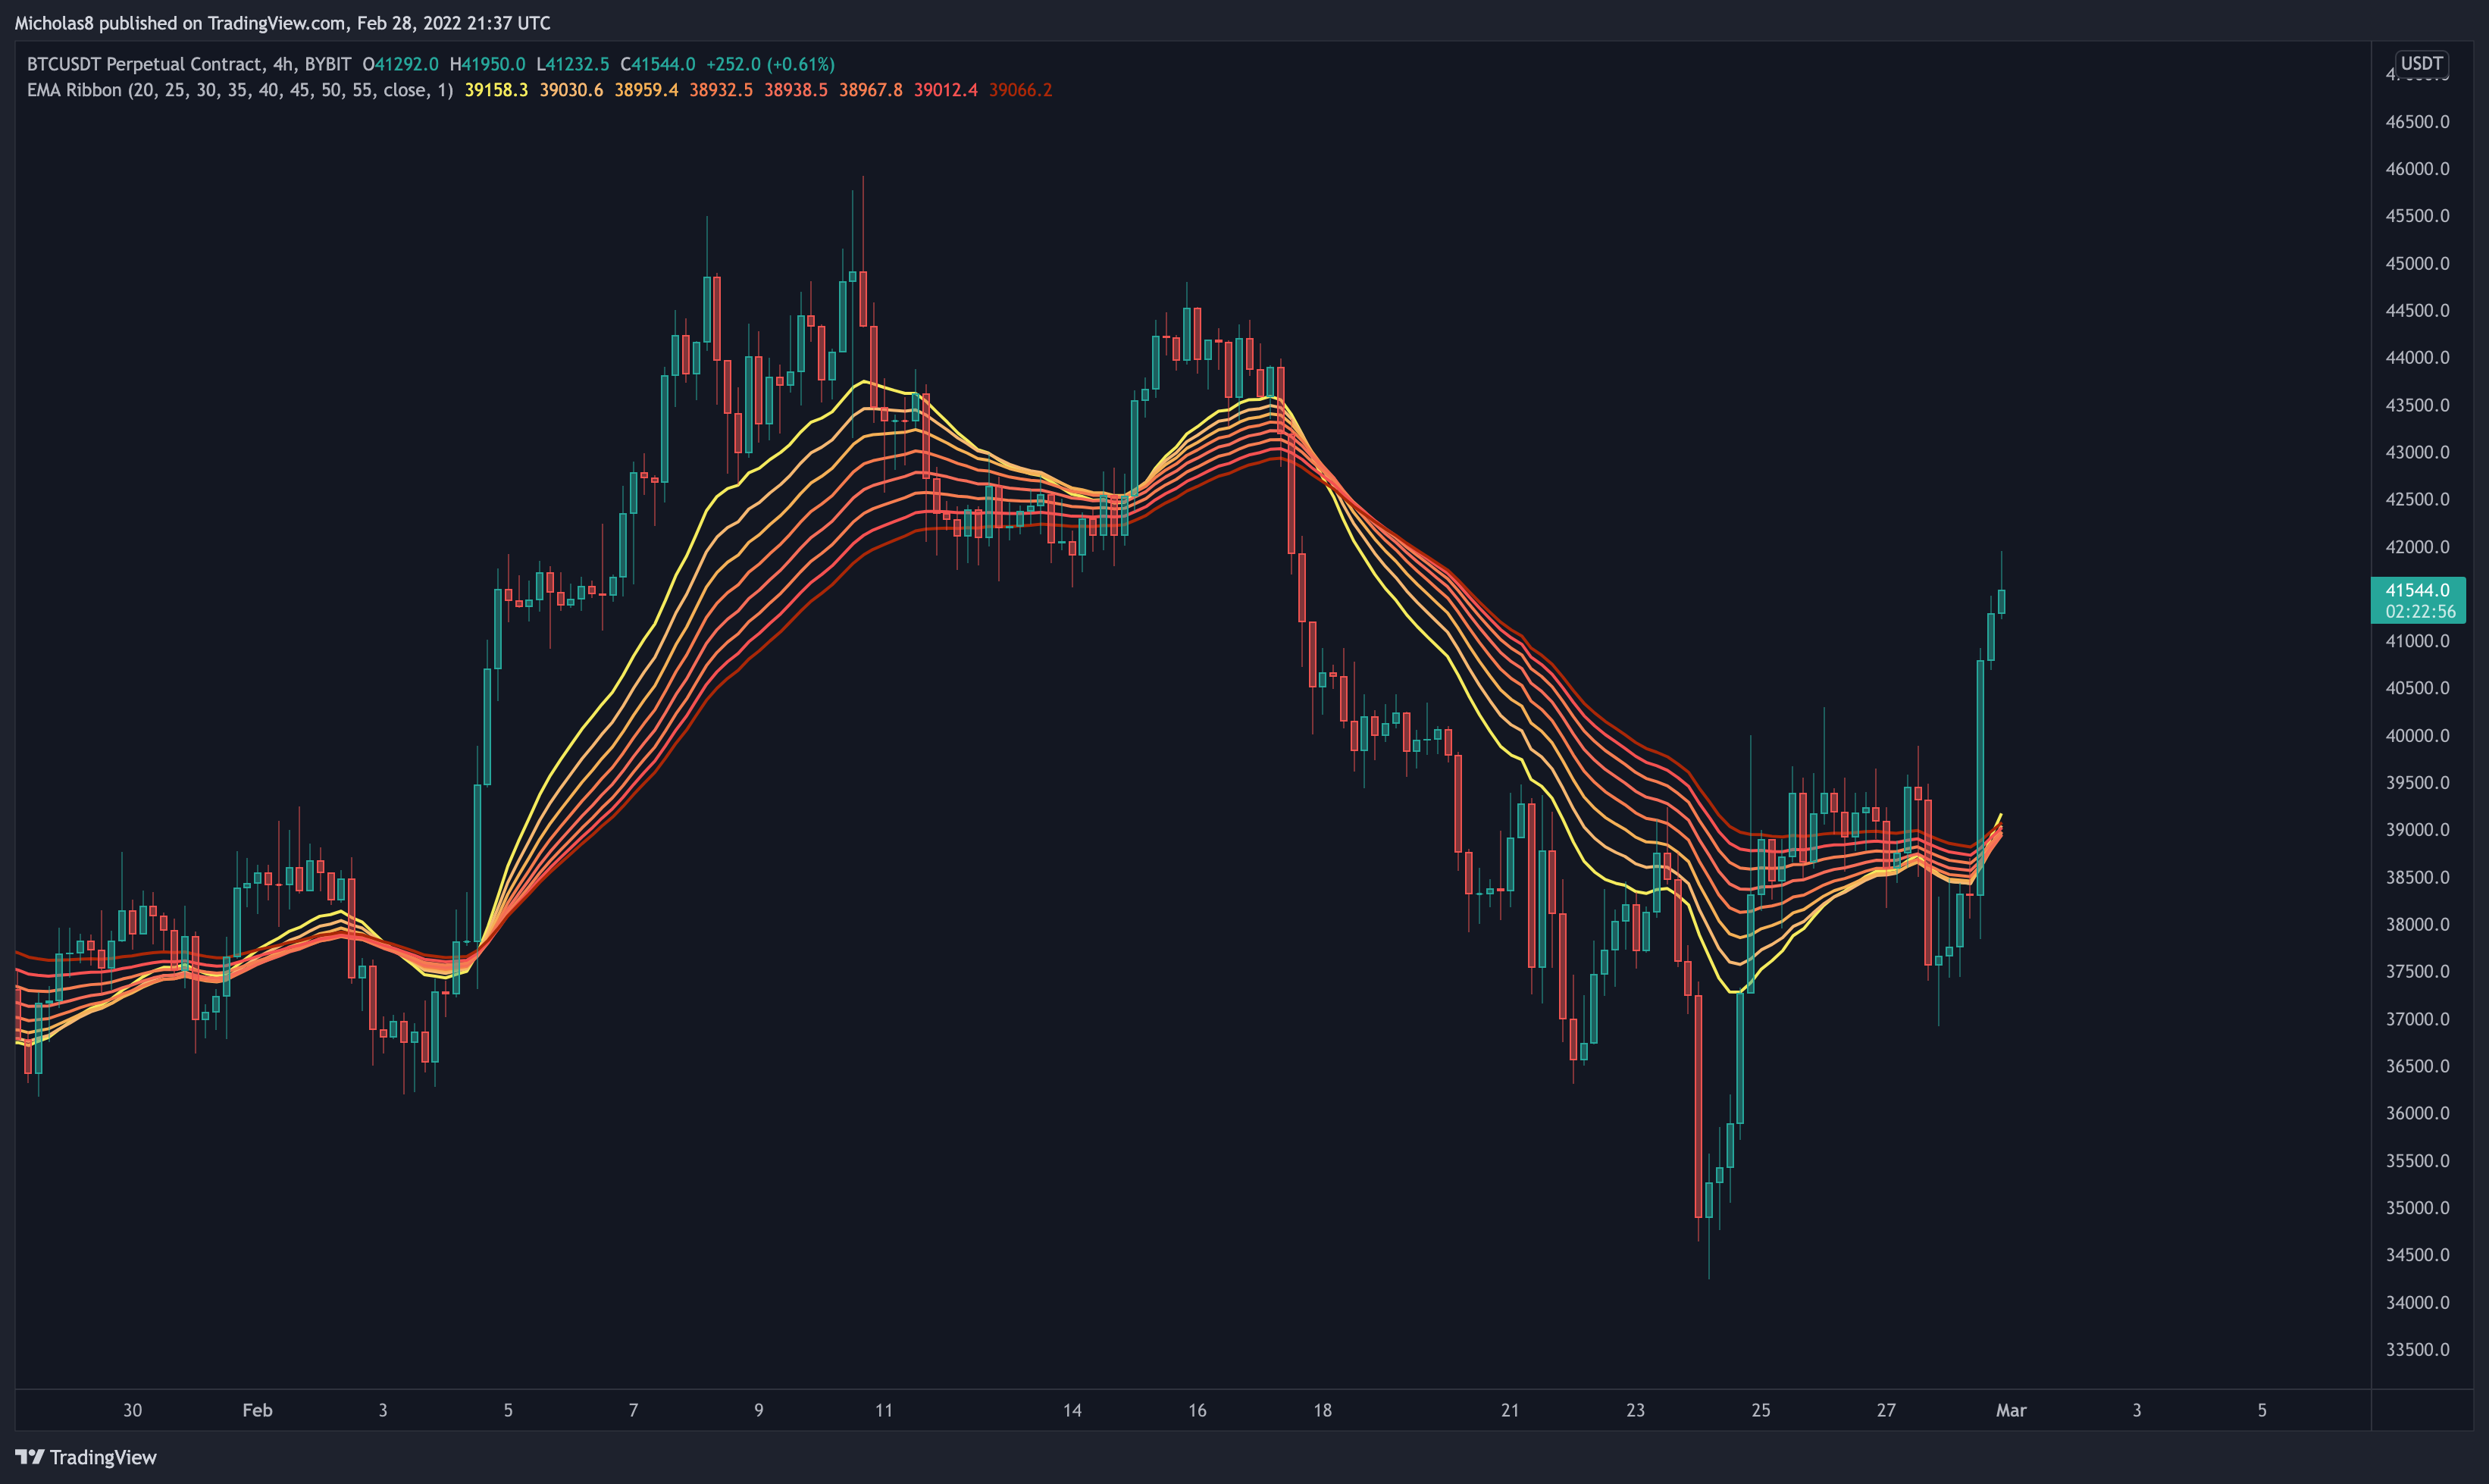
Bitcoin has risen above the EMA ribbon on this timeframe.
Implication: Ideally, it serves as a level of support.
What is an EMA ribbon? A 'ribbon' of EMAs that together indicate bearish and bullish momentum in the market. When an asset is trading is above the ribbon, it's considered bullish. Vice-versa.
Simple Moving Averages (SMA): 20, 50 and 200
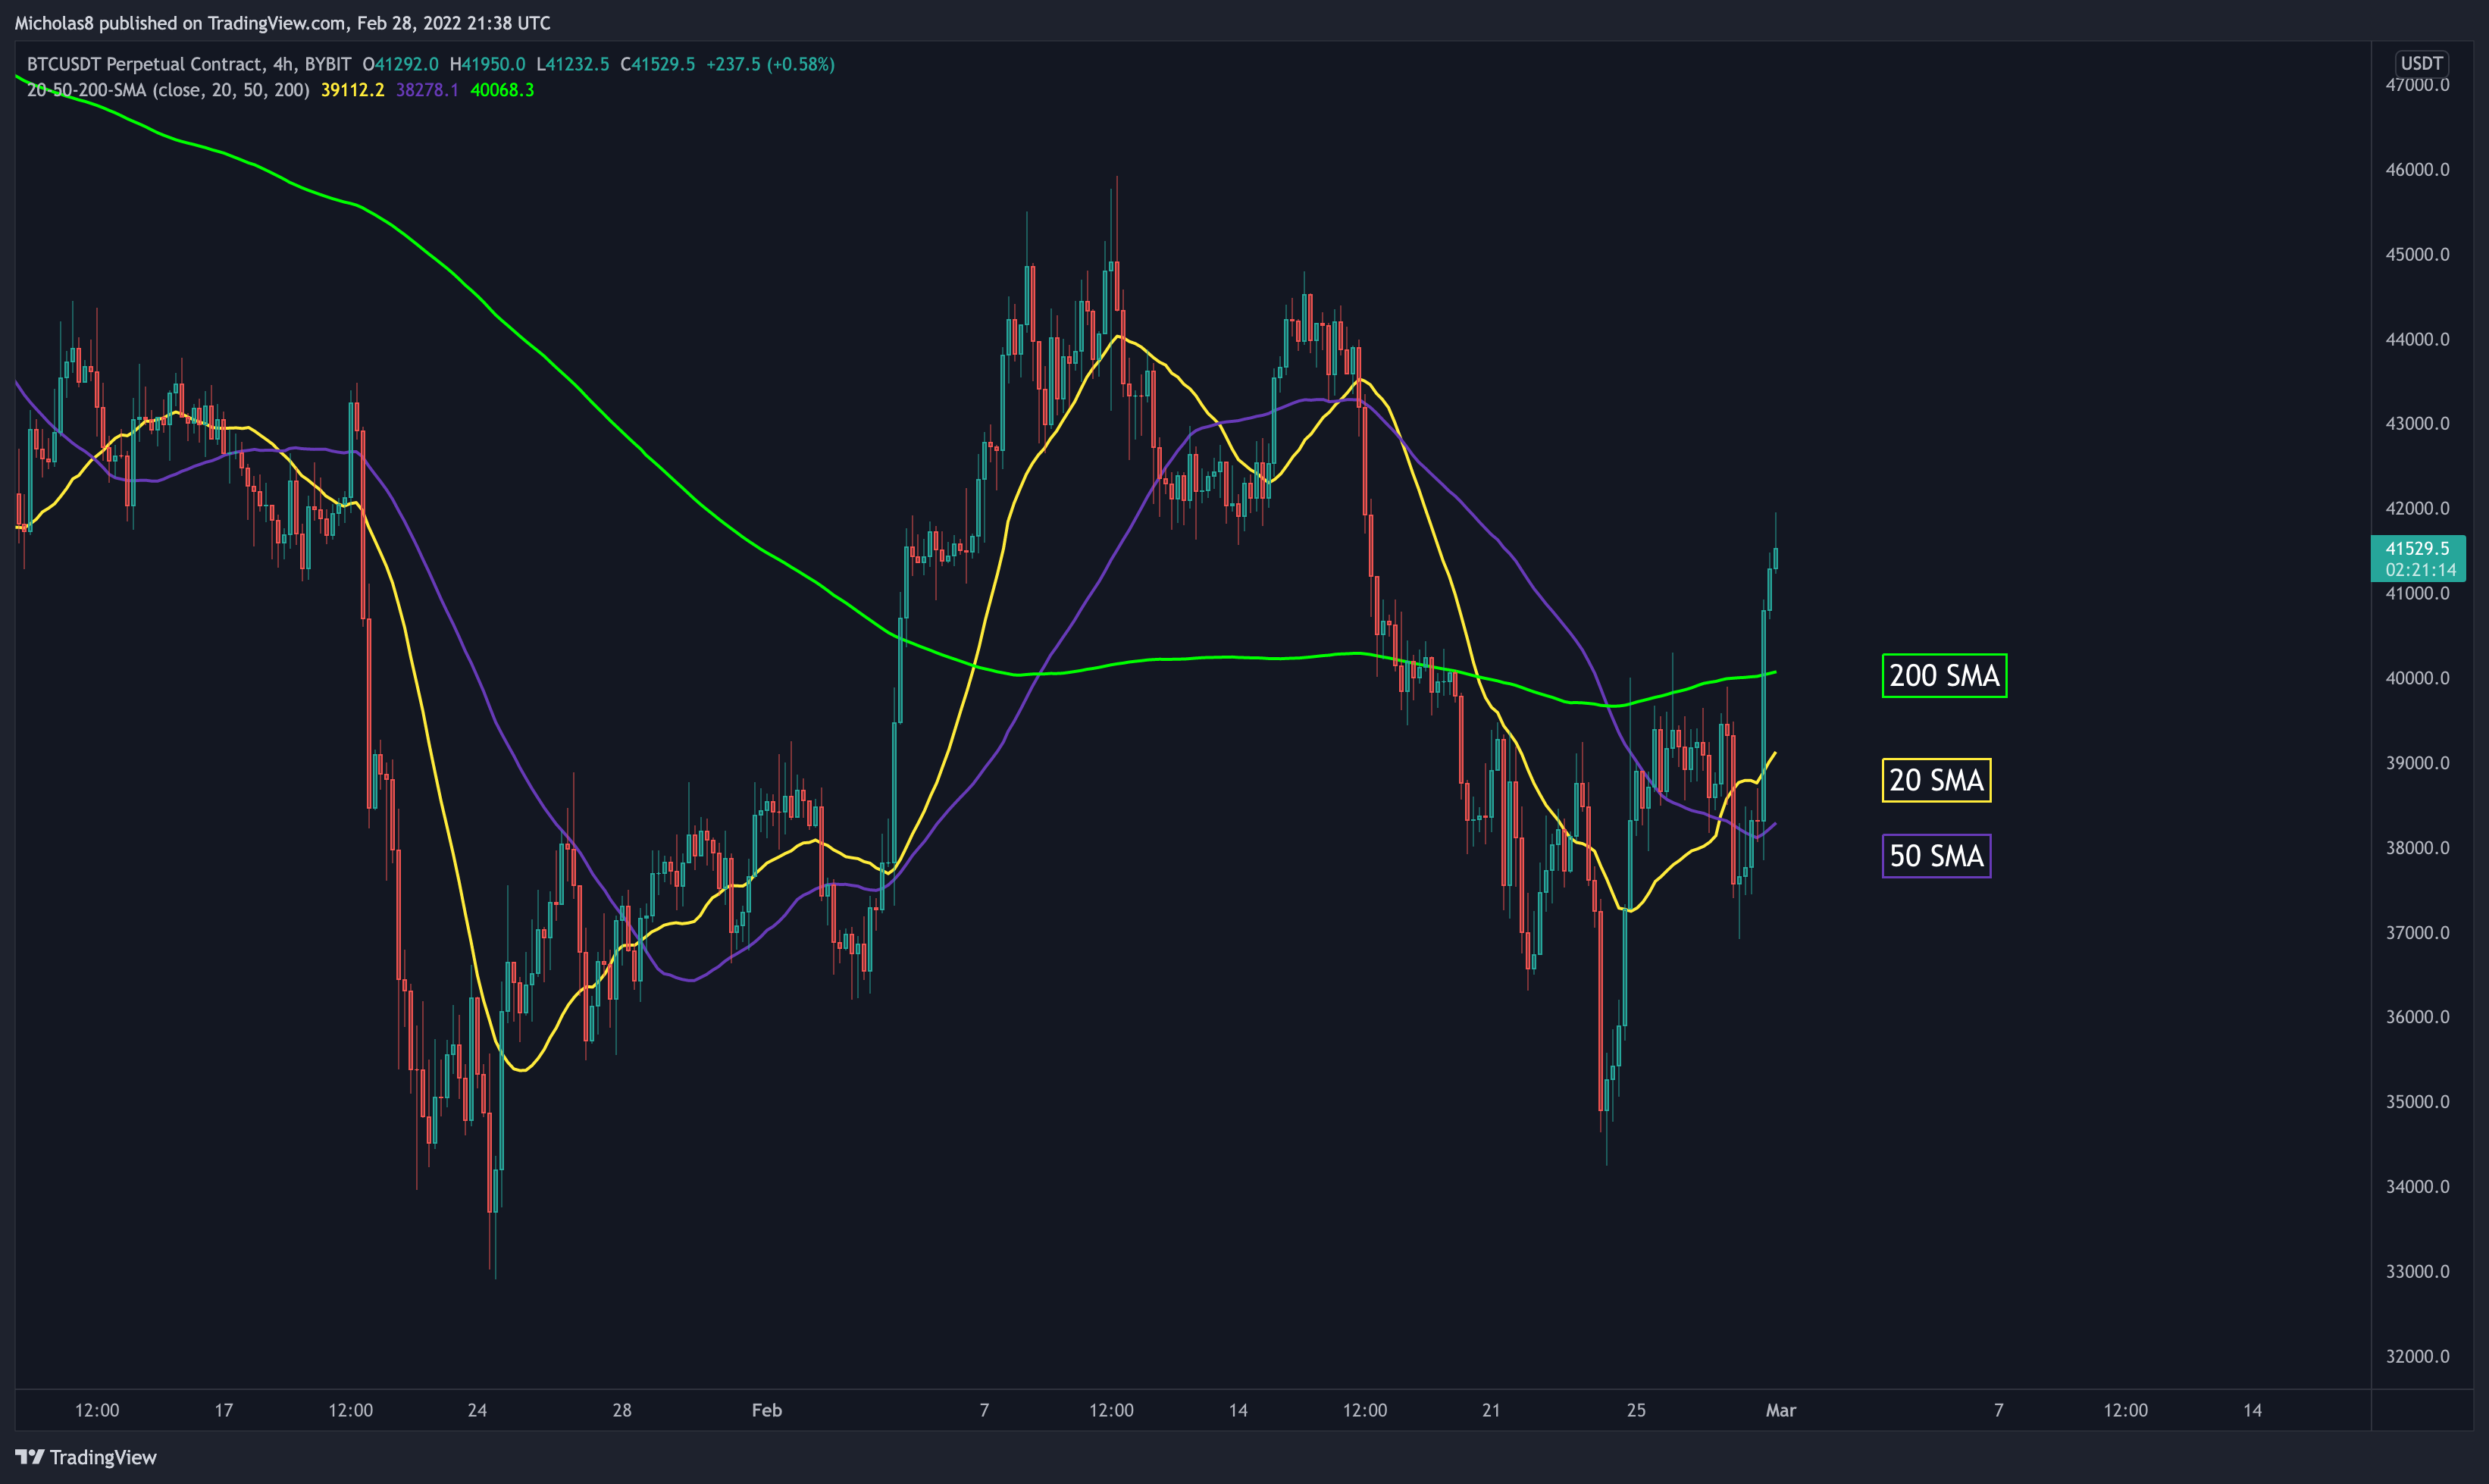
Bitcoin has risen above these SMAs.
Implication(s): Ideally, they serve as a level of support.
1H Timeframe
EMA Ribbon
Bitcoin has risen above the EMA ribbon on this timeframe.
Implication: Ideally, it serves as a level of support.
What is an EMA ribbon? A 'ribbon' of EMAs that together indicate bearish and bullish momentum in the market. When an asset is trading is above the ribbon, it's considered bullish. Vice-versa.
THE BAD
Daily Timeframe
Bearish Market Structure
Bitcoin continues to print lower highs and lower lows, thus, maintaining its bearish market structure. Until we start to see new higher highs and higher lows form, we can expect this macro trend to continue.
Logarithmic Curve
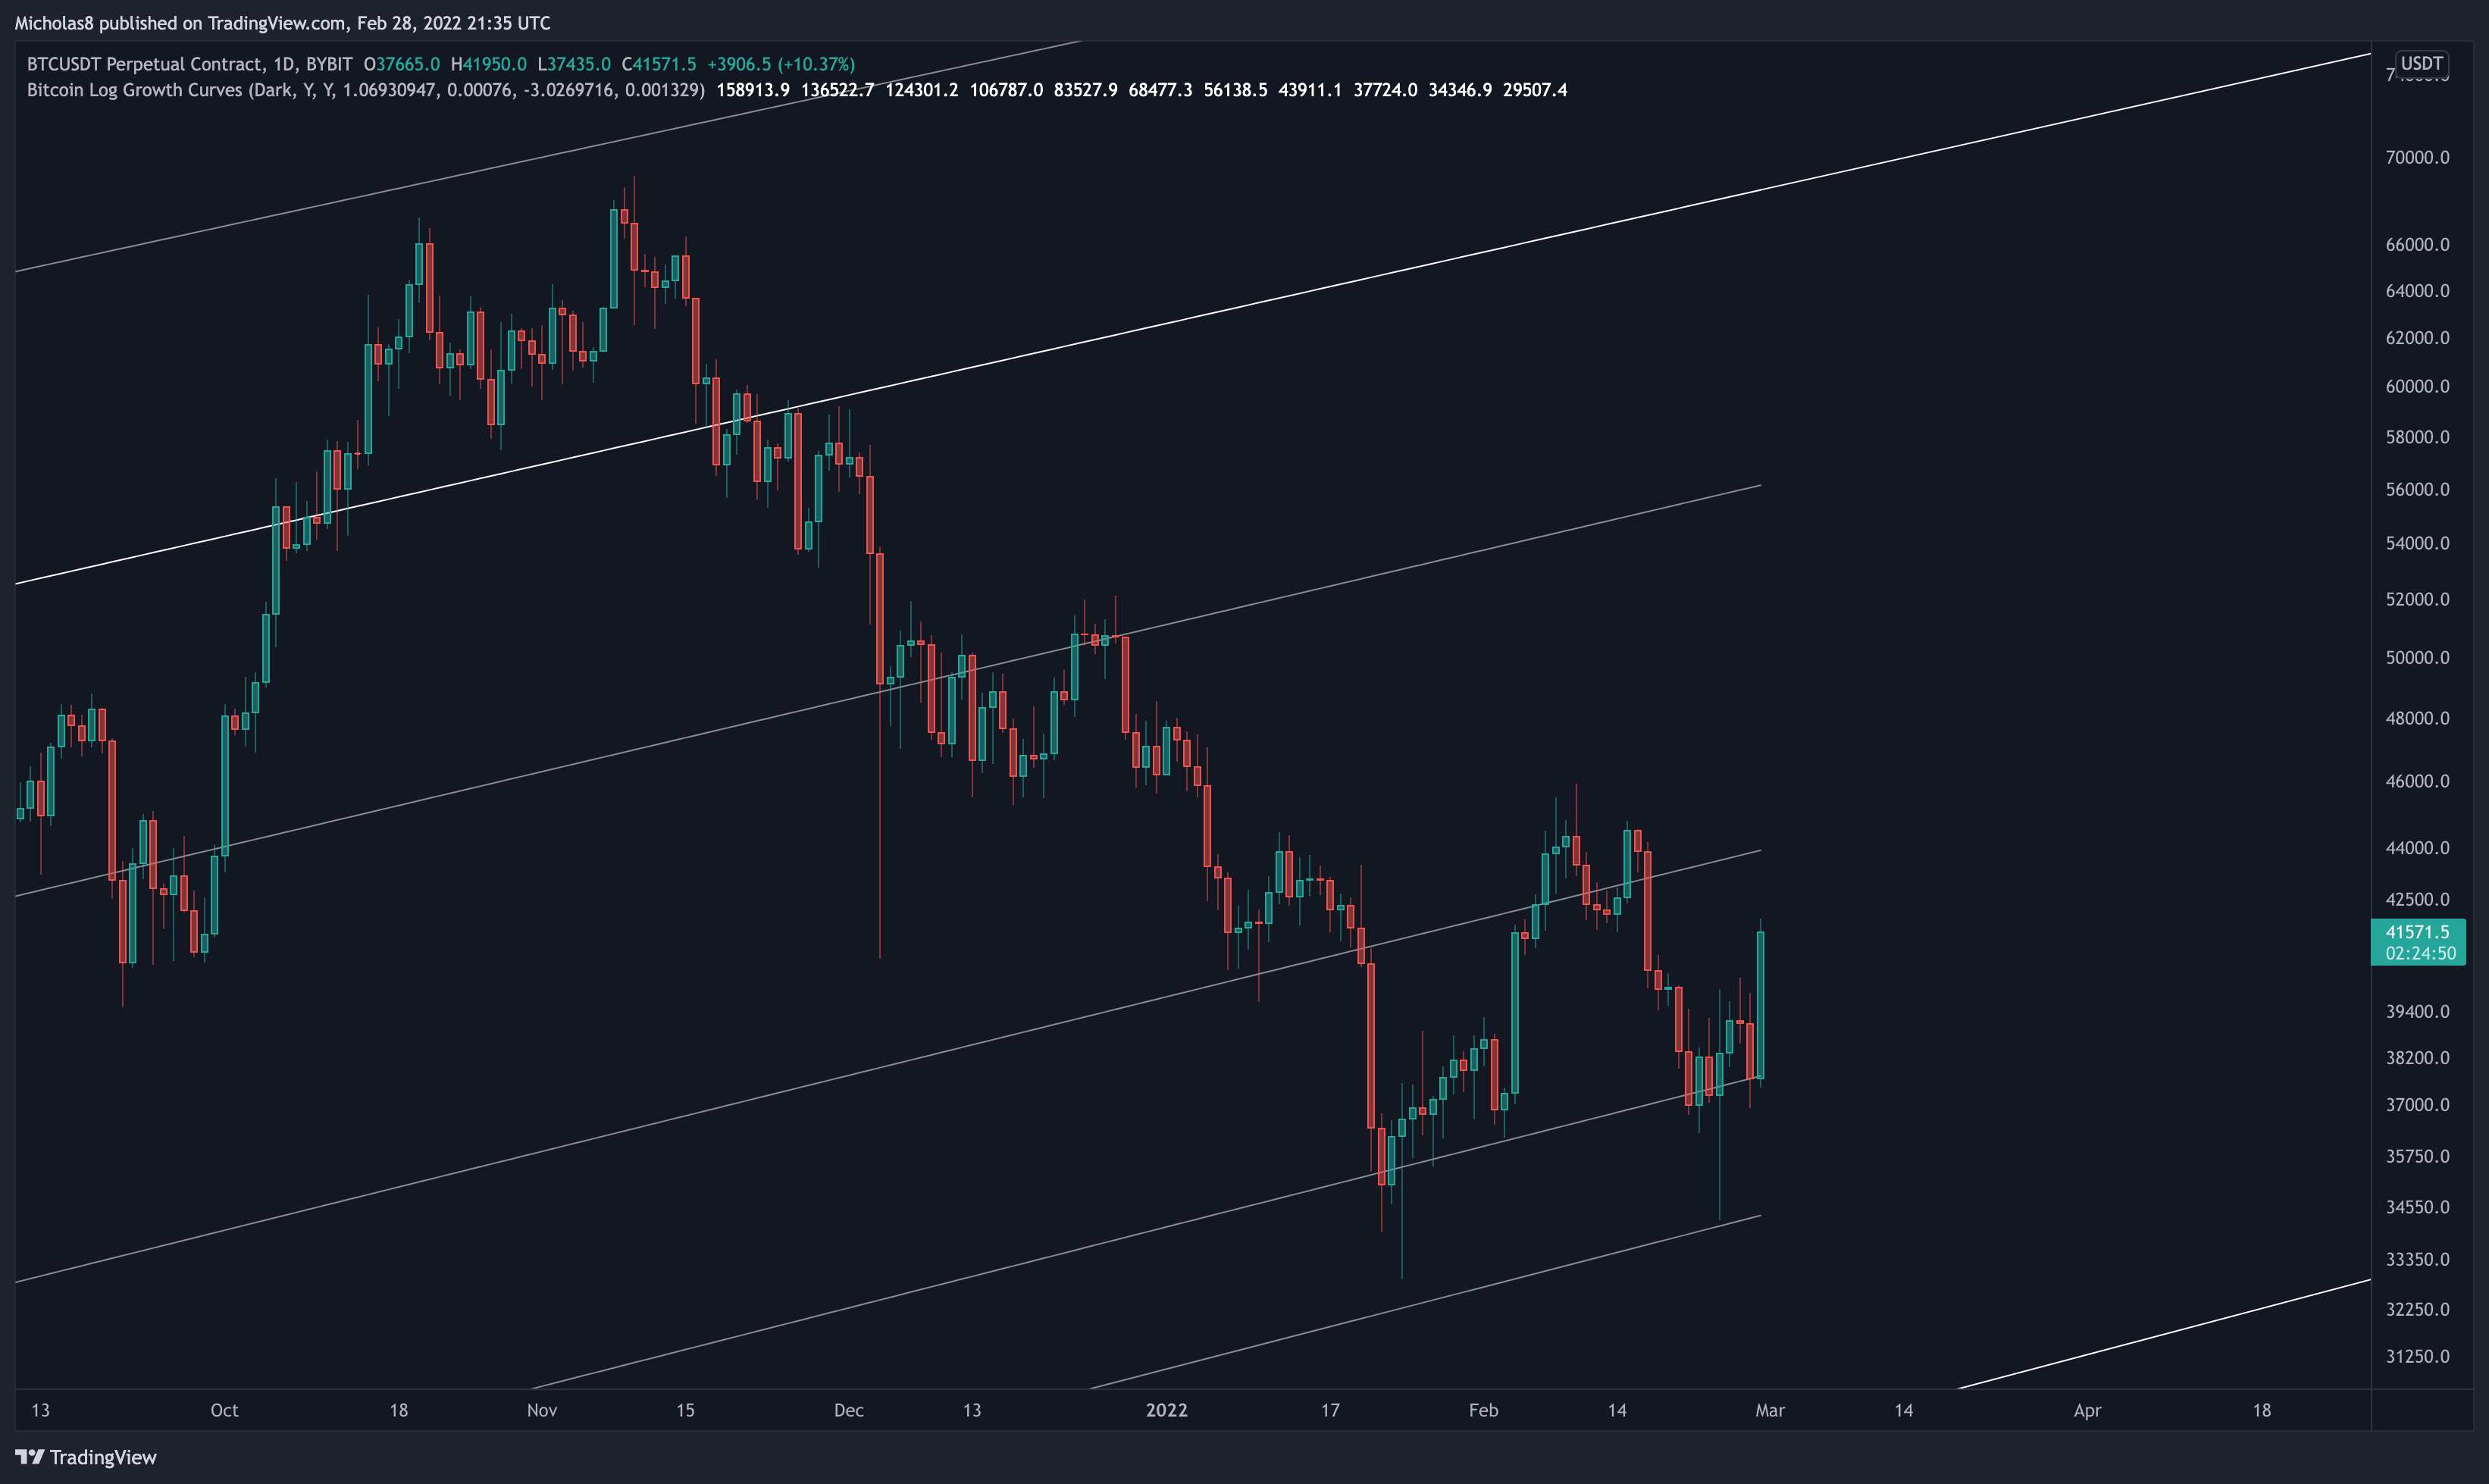
Bitcoin has failed to breakthrough and hold the 0.236 Fibonacci Level as support.
Once Bitcoin fell below the median line, it became bearish. We can treat this curve as we do with ranges – the upper half = bullish, the bottom half = bearish.
Key Liquidity Zone (LQZ)
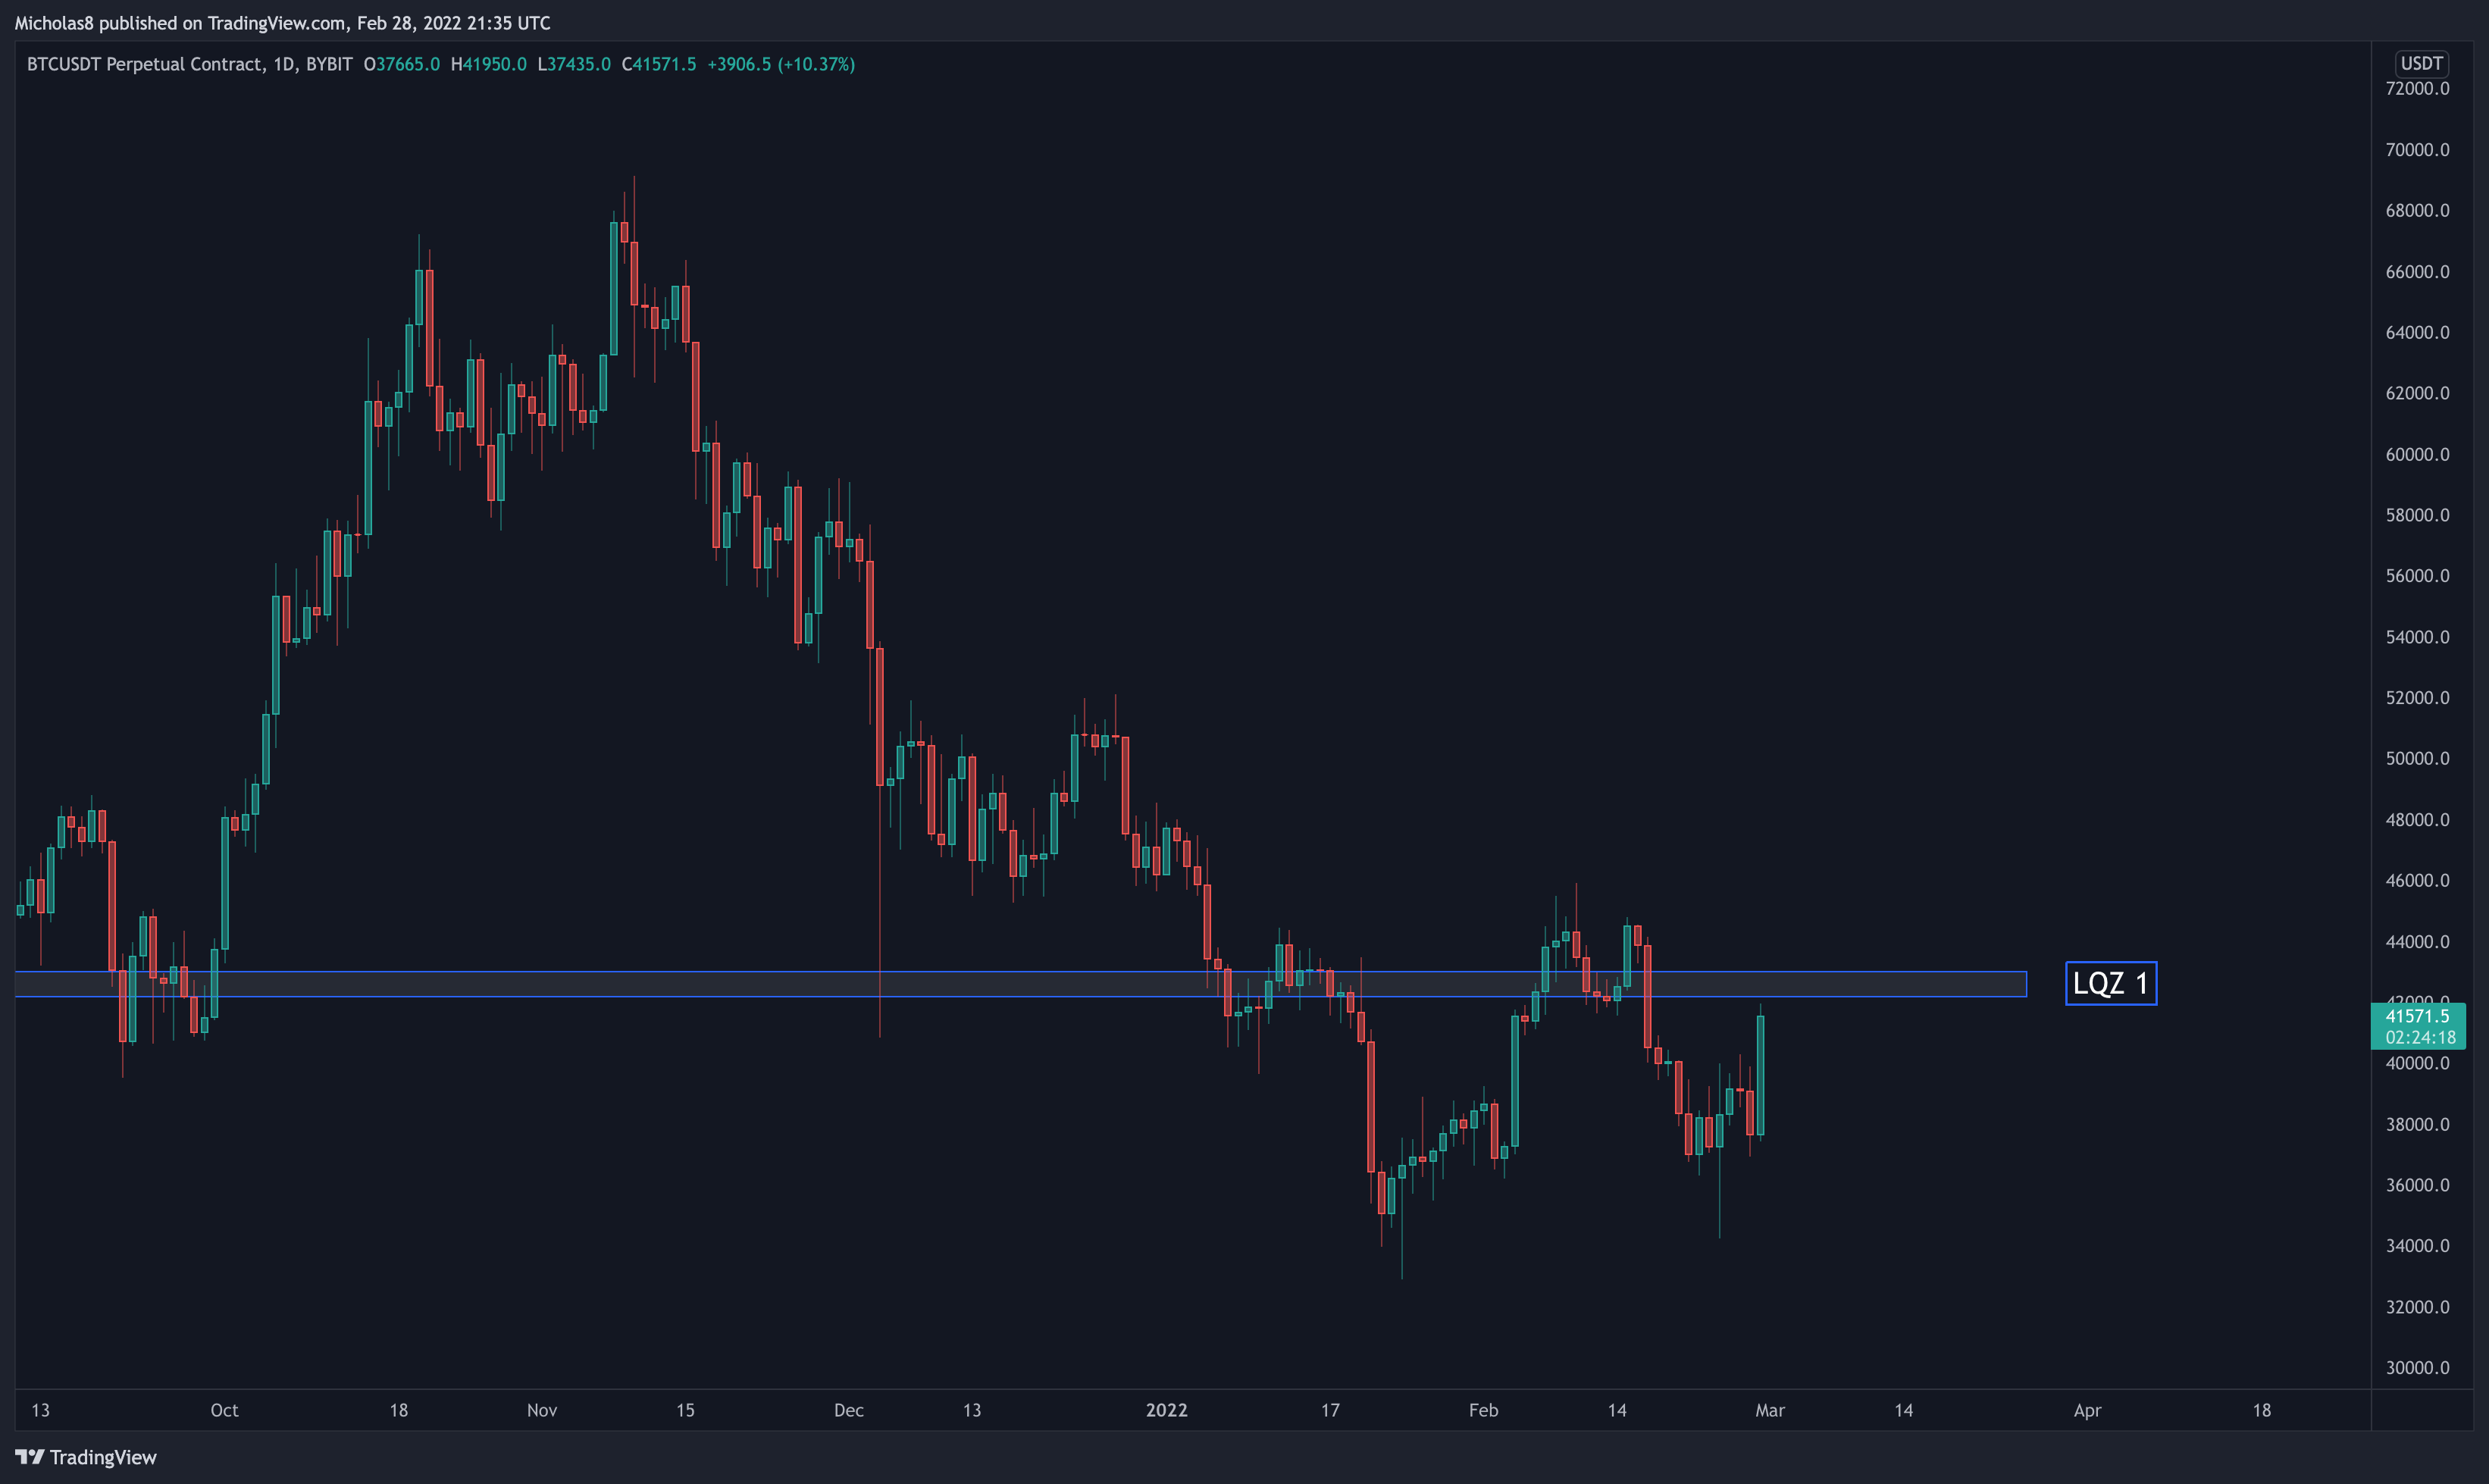
Zone 1: Bitcoin has lost the LQZ sitting at 42.2k - 43k.
Implication(s): We may see this serve as a level of resistance moving forward.
Directional Movement Index (DMI)
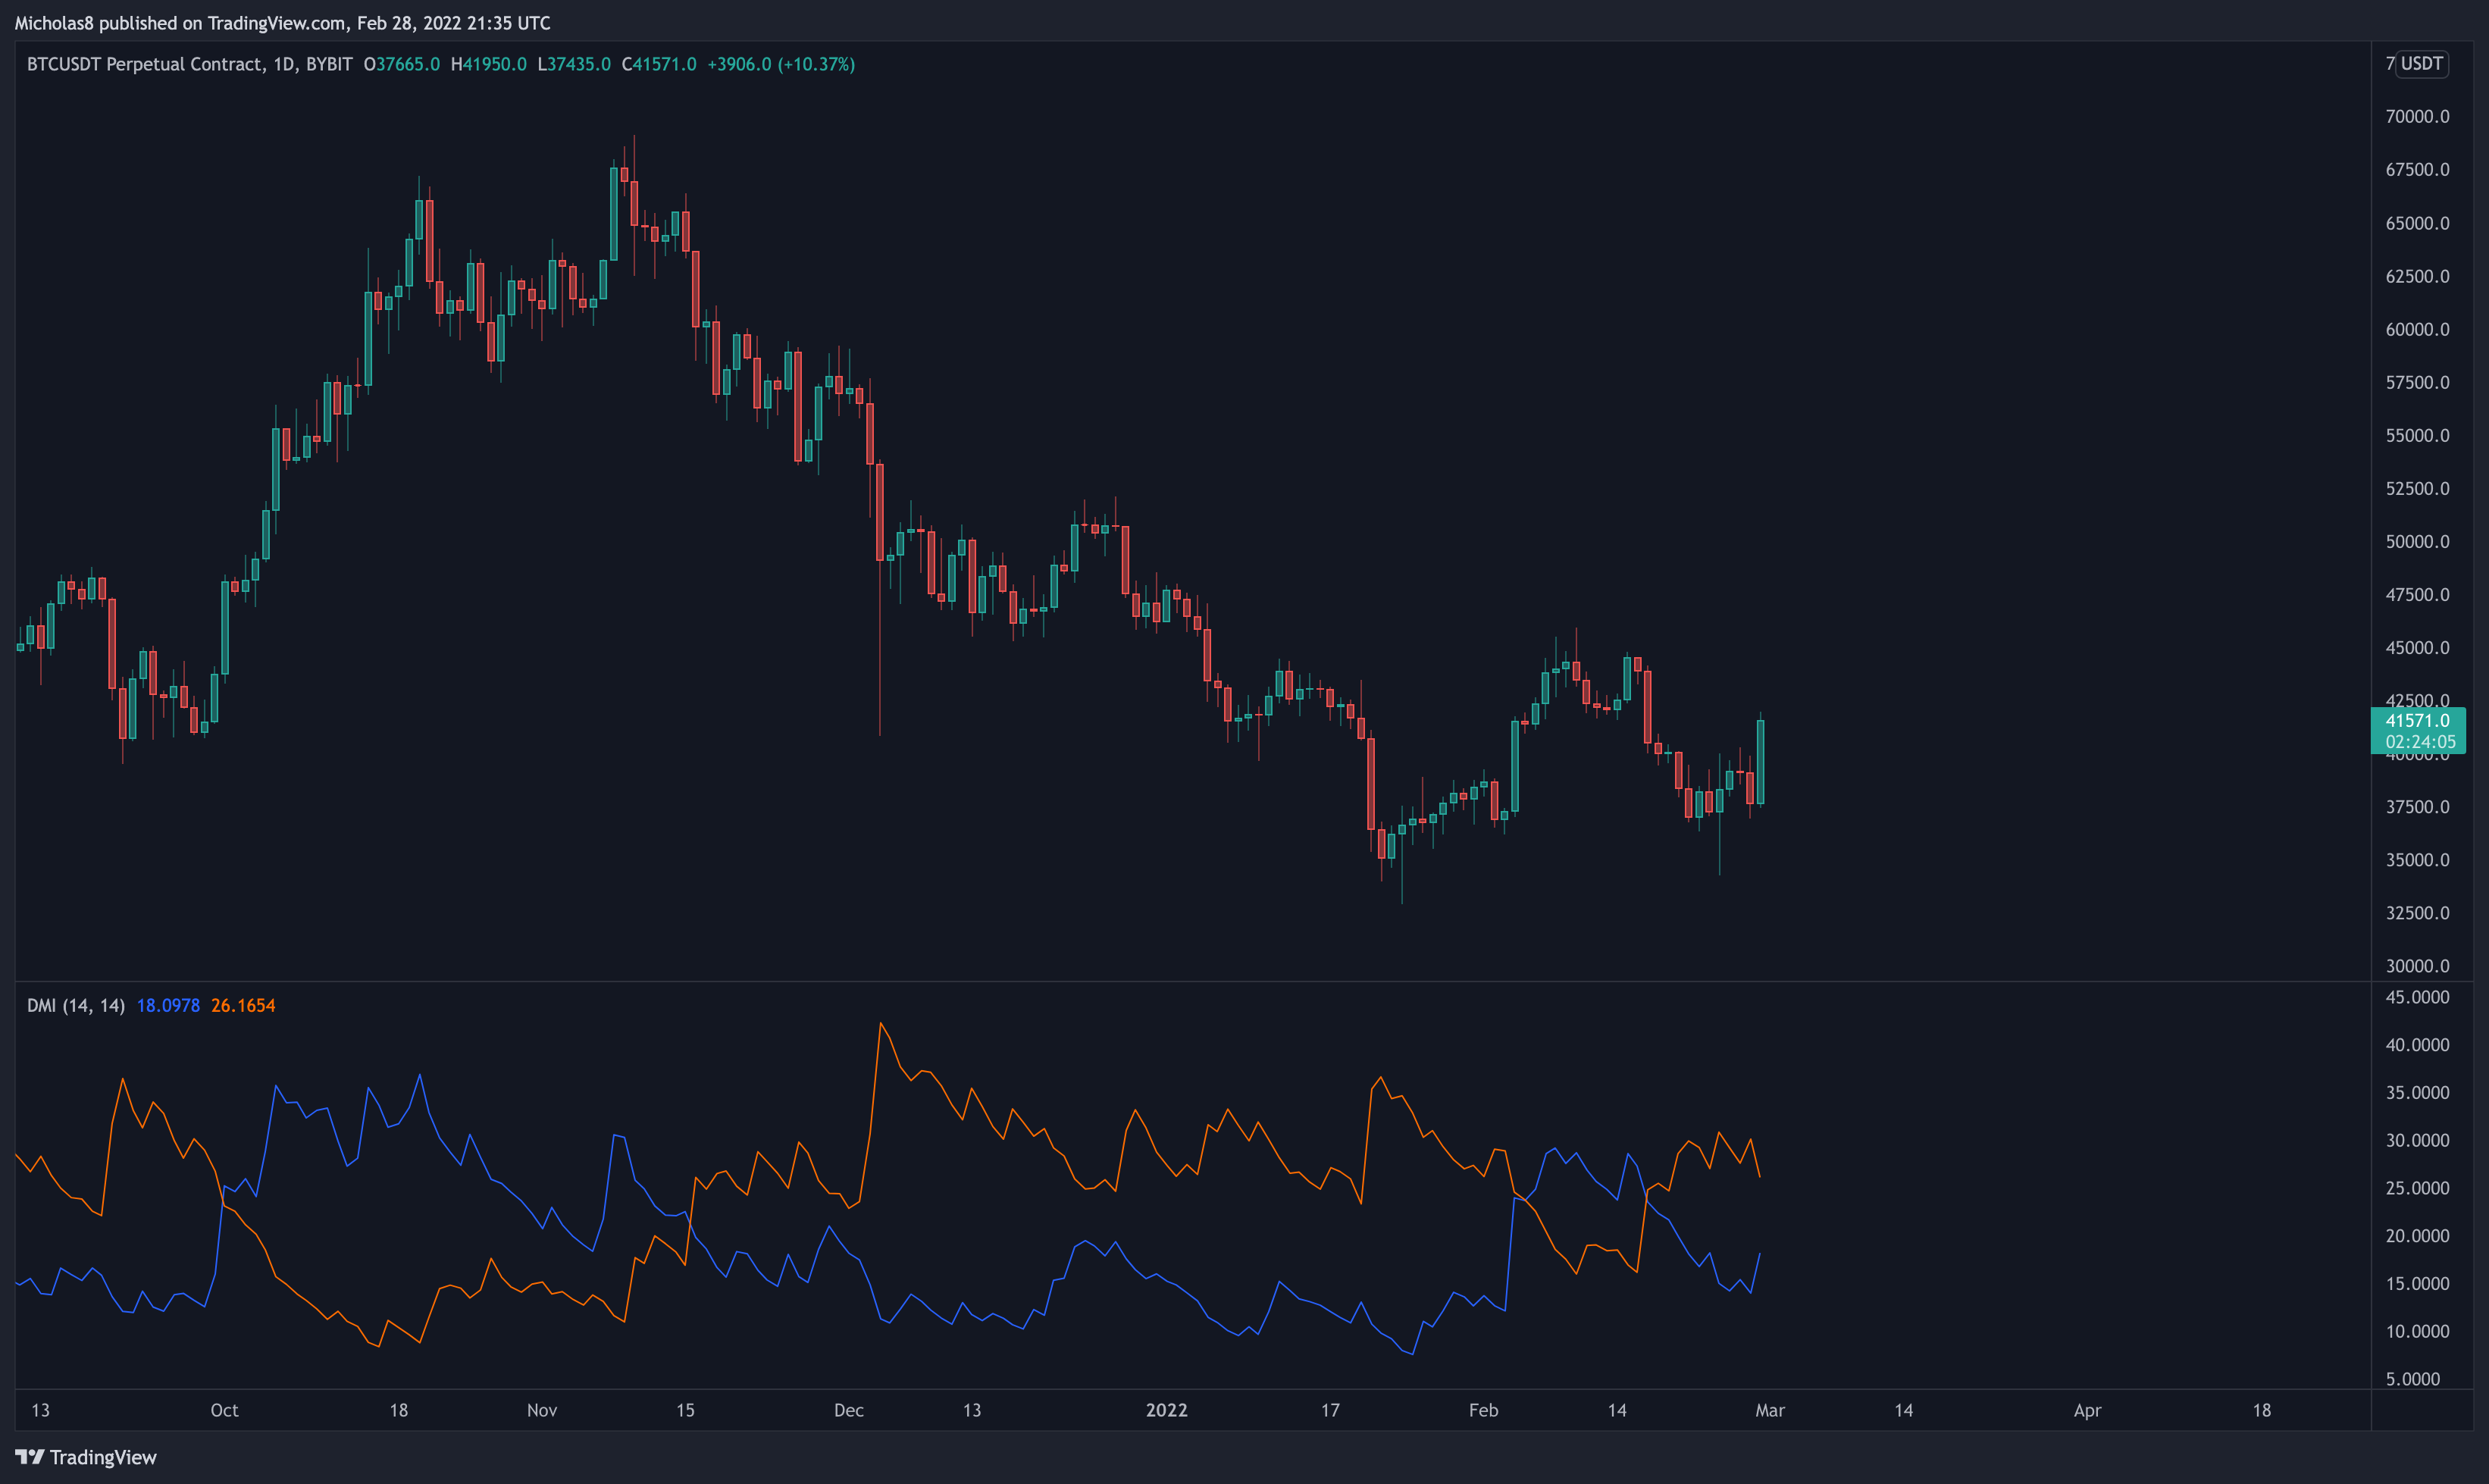
*This is another momentum indicator.
Generally speaking, when the blue line (bullish) crosses below the orange line (bearish), it signals a potential shift in momentum to the bears. Given that the orange line still trends above the blue line, Bitcoin's momentum remains negative.
Implication(s): As we have seen a bearish cross between these two signal lines, momentum is now with the bears on a macro level.
EMA Ribbon
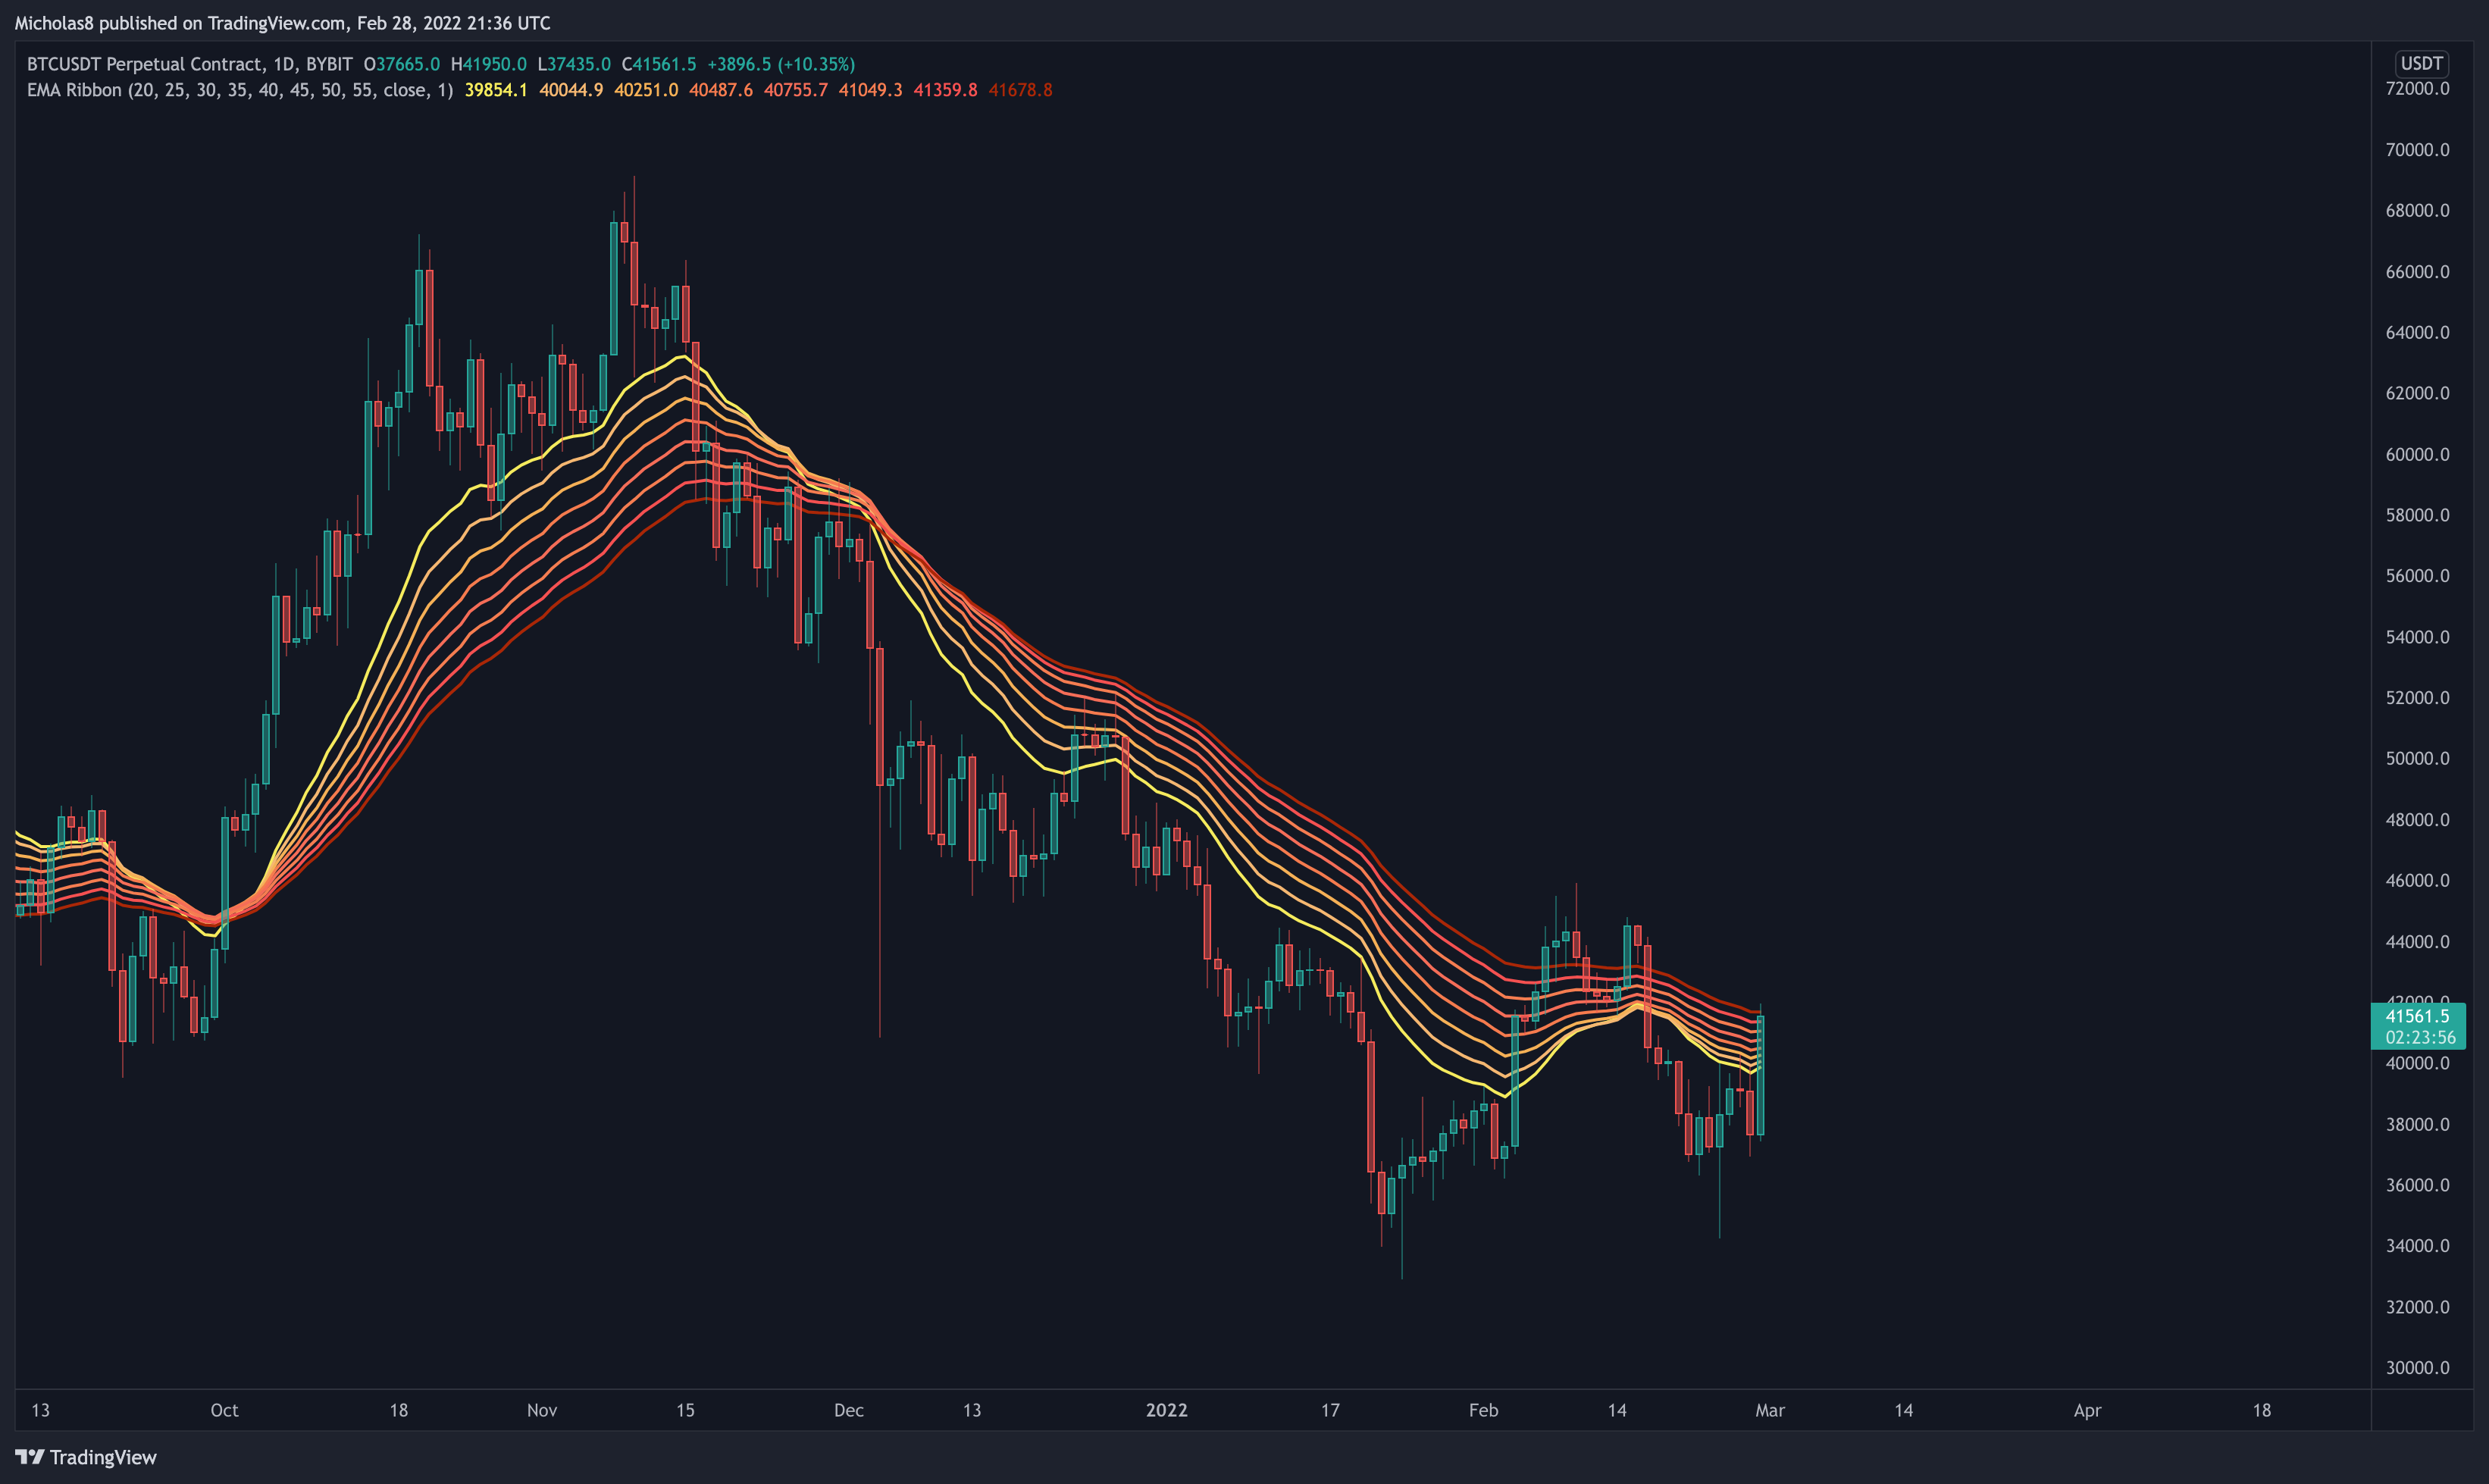
Bitcoin has lost the EMA ribbon as support in this timeframe.
Implication: Momentum is now with the bears on a macro level.
What is an EMA ribbon? A 'ribbon' of EMAs that together indicate bearish and bullish momentum in the market. When an asset is trading is above the ribbon, it's considered bullish. Vice-versa.
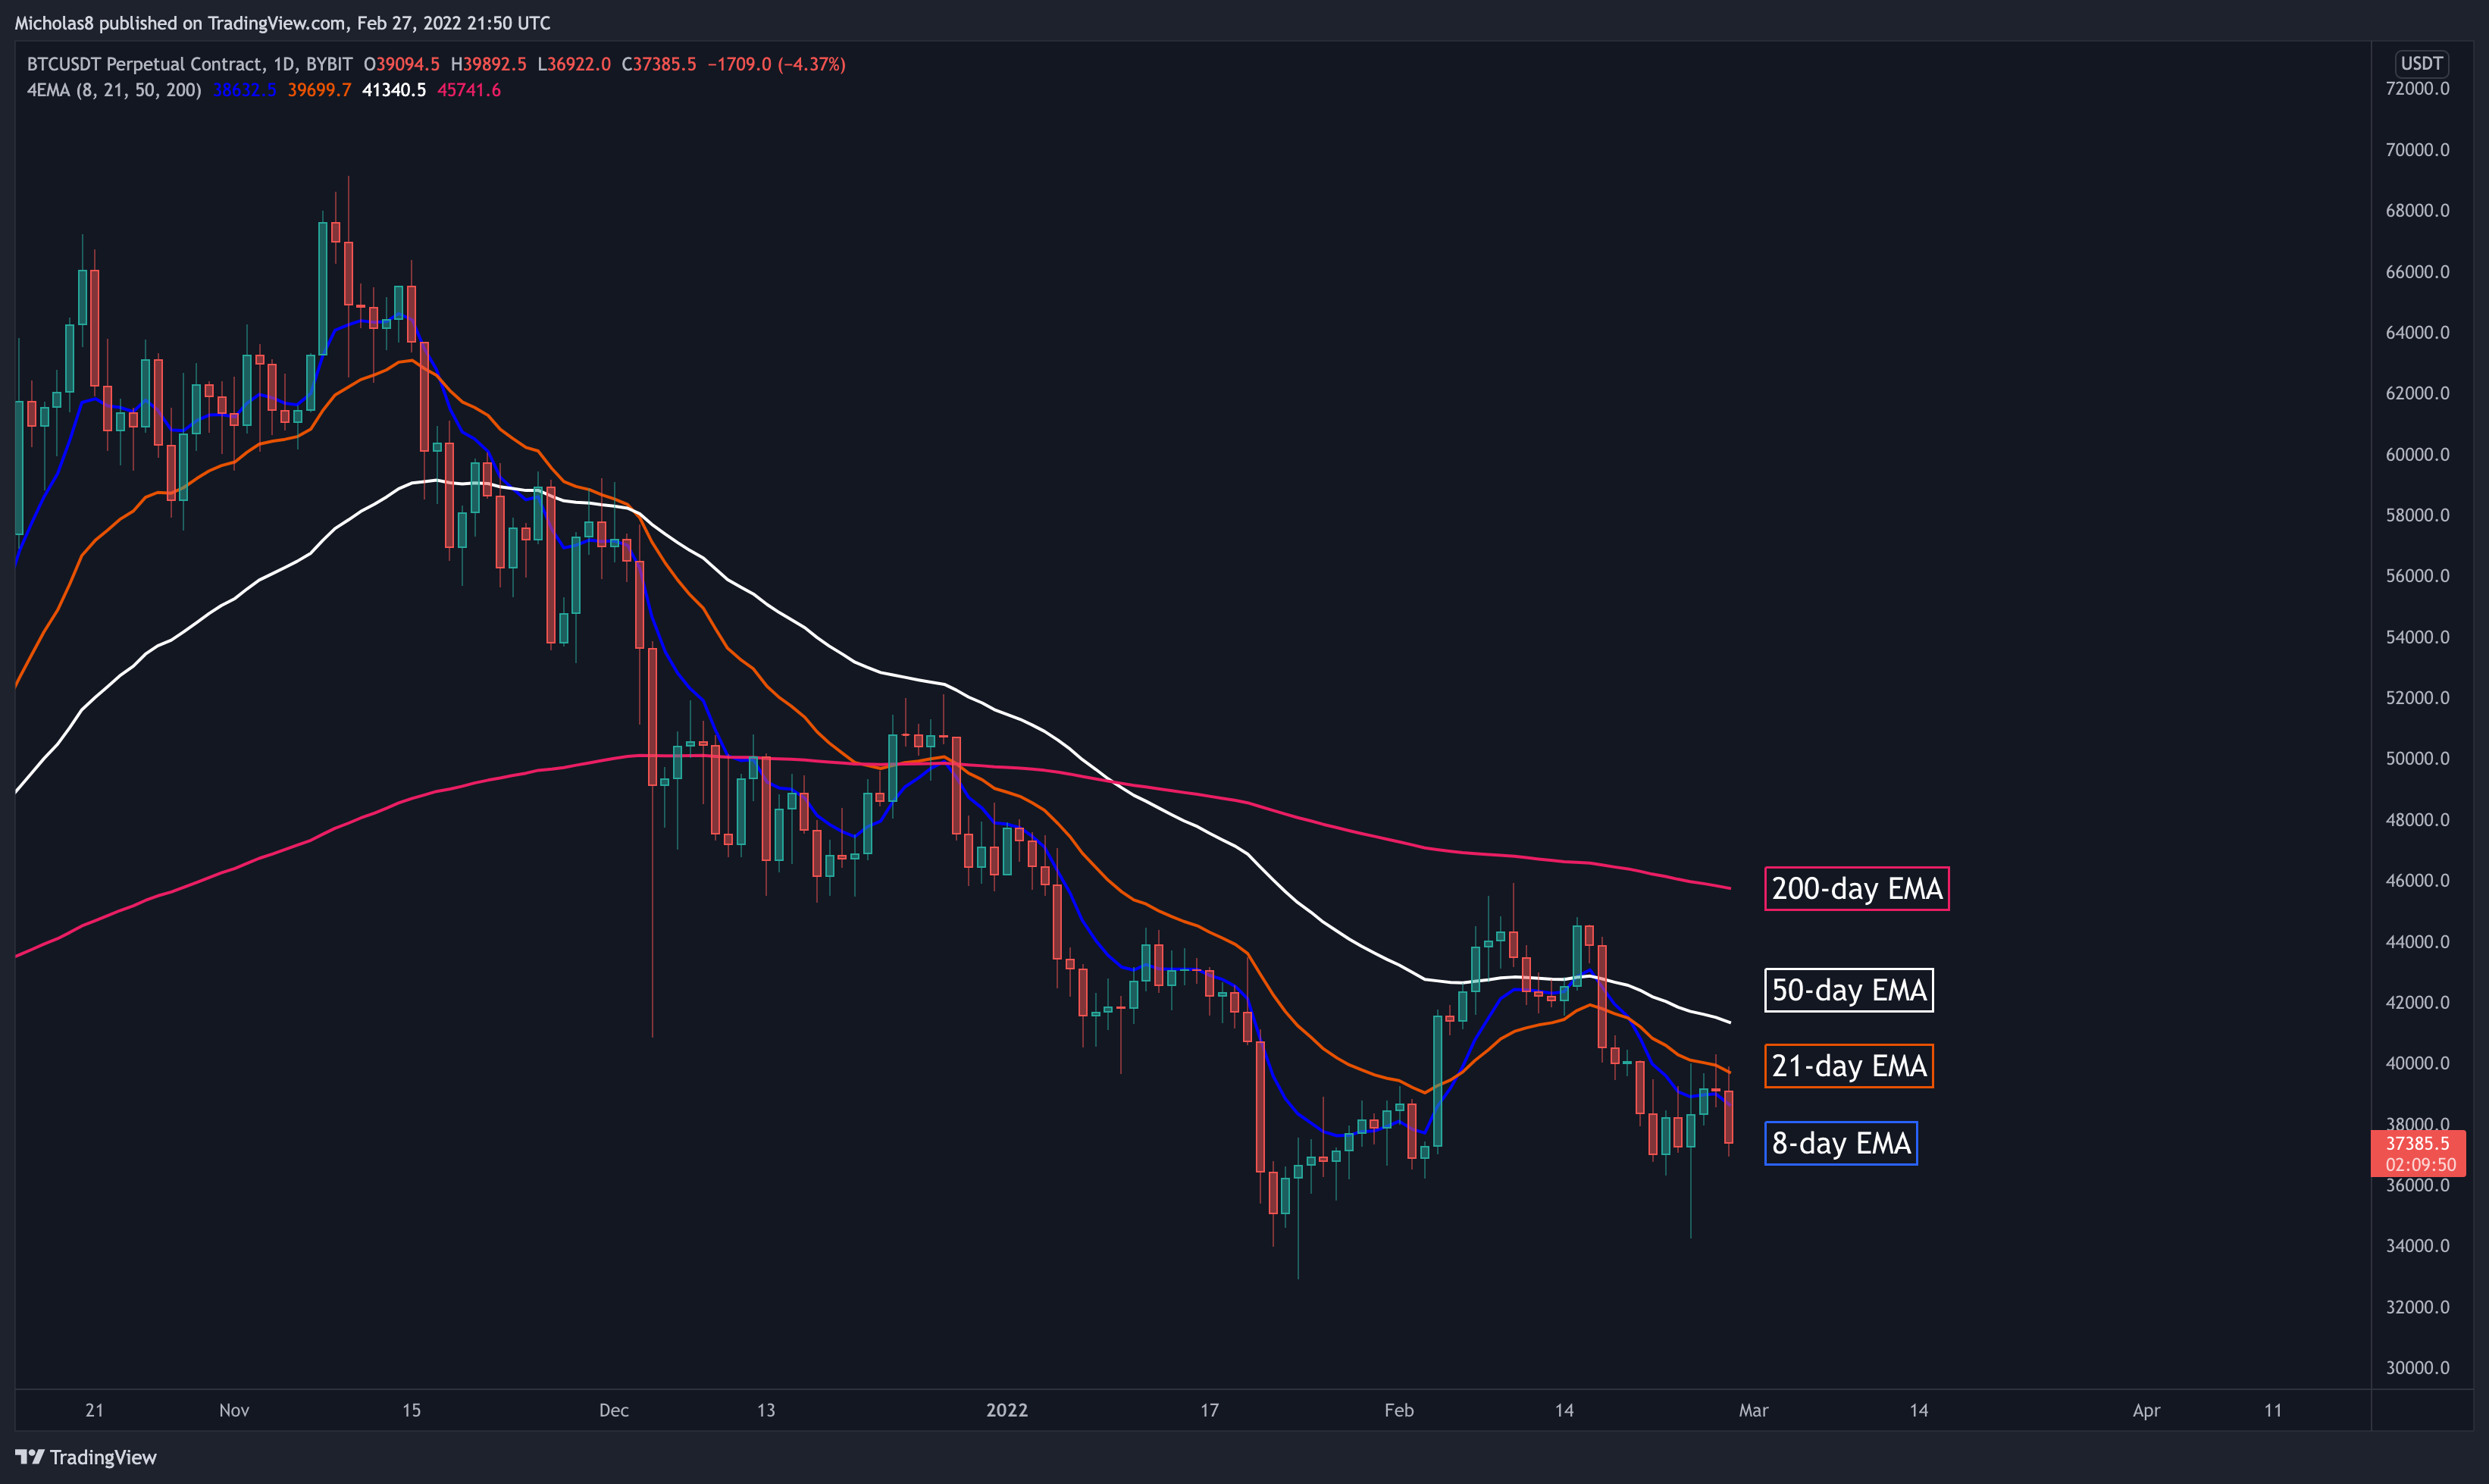
Simple Moving Average (SMA): 20, 50, 100 and 200
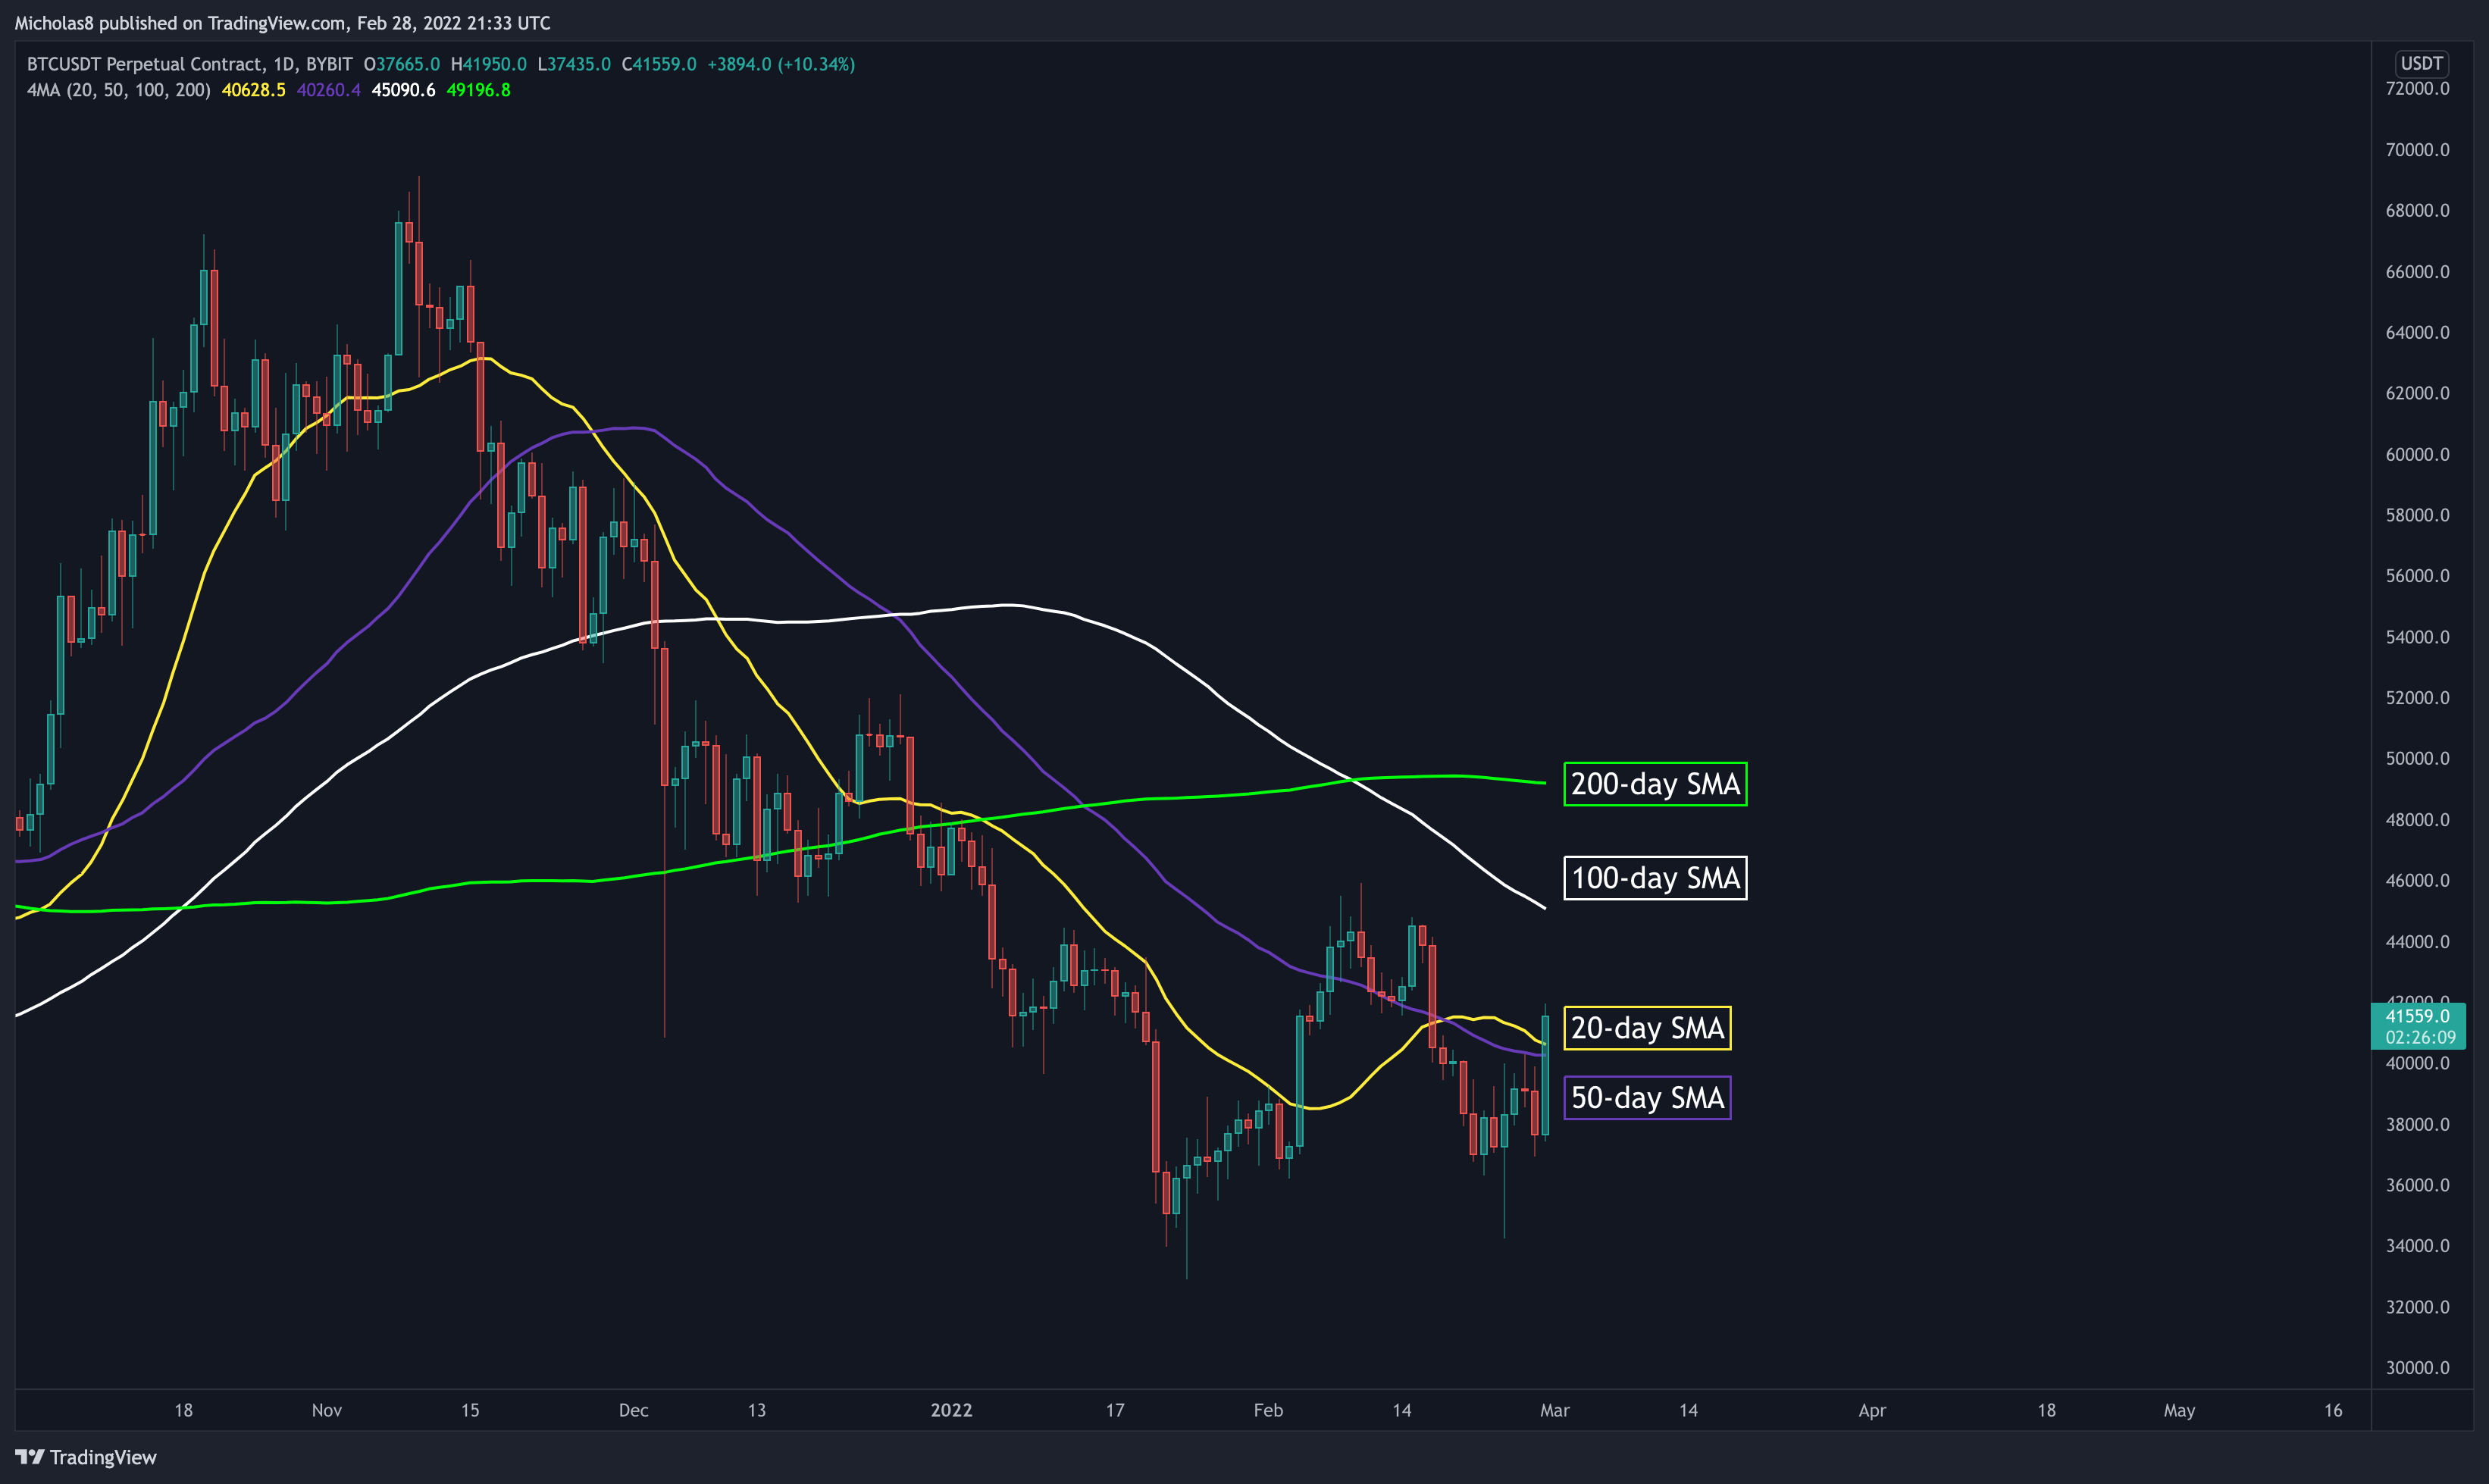
Bitcoin continues to trade below the 100/200-day SMAs, and is finding resistance from the 20/50-day SMAs.
Implication(s): They may serve as levels of resistance moving forward.
Exponential Moving Average (EMA): 50 and 200
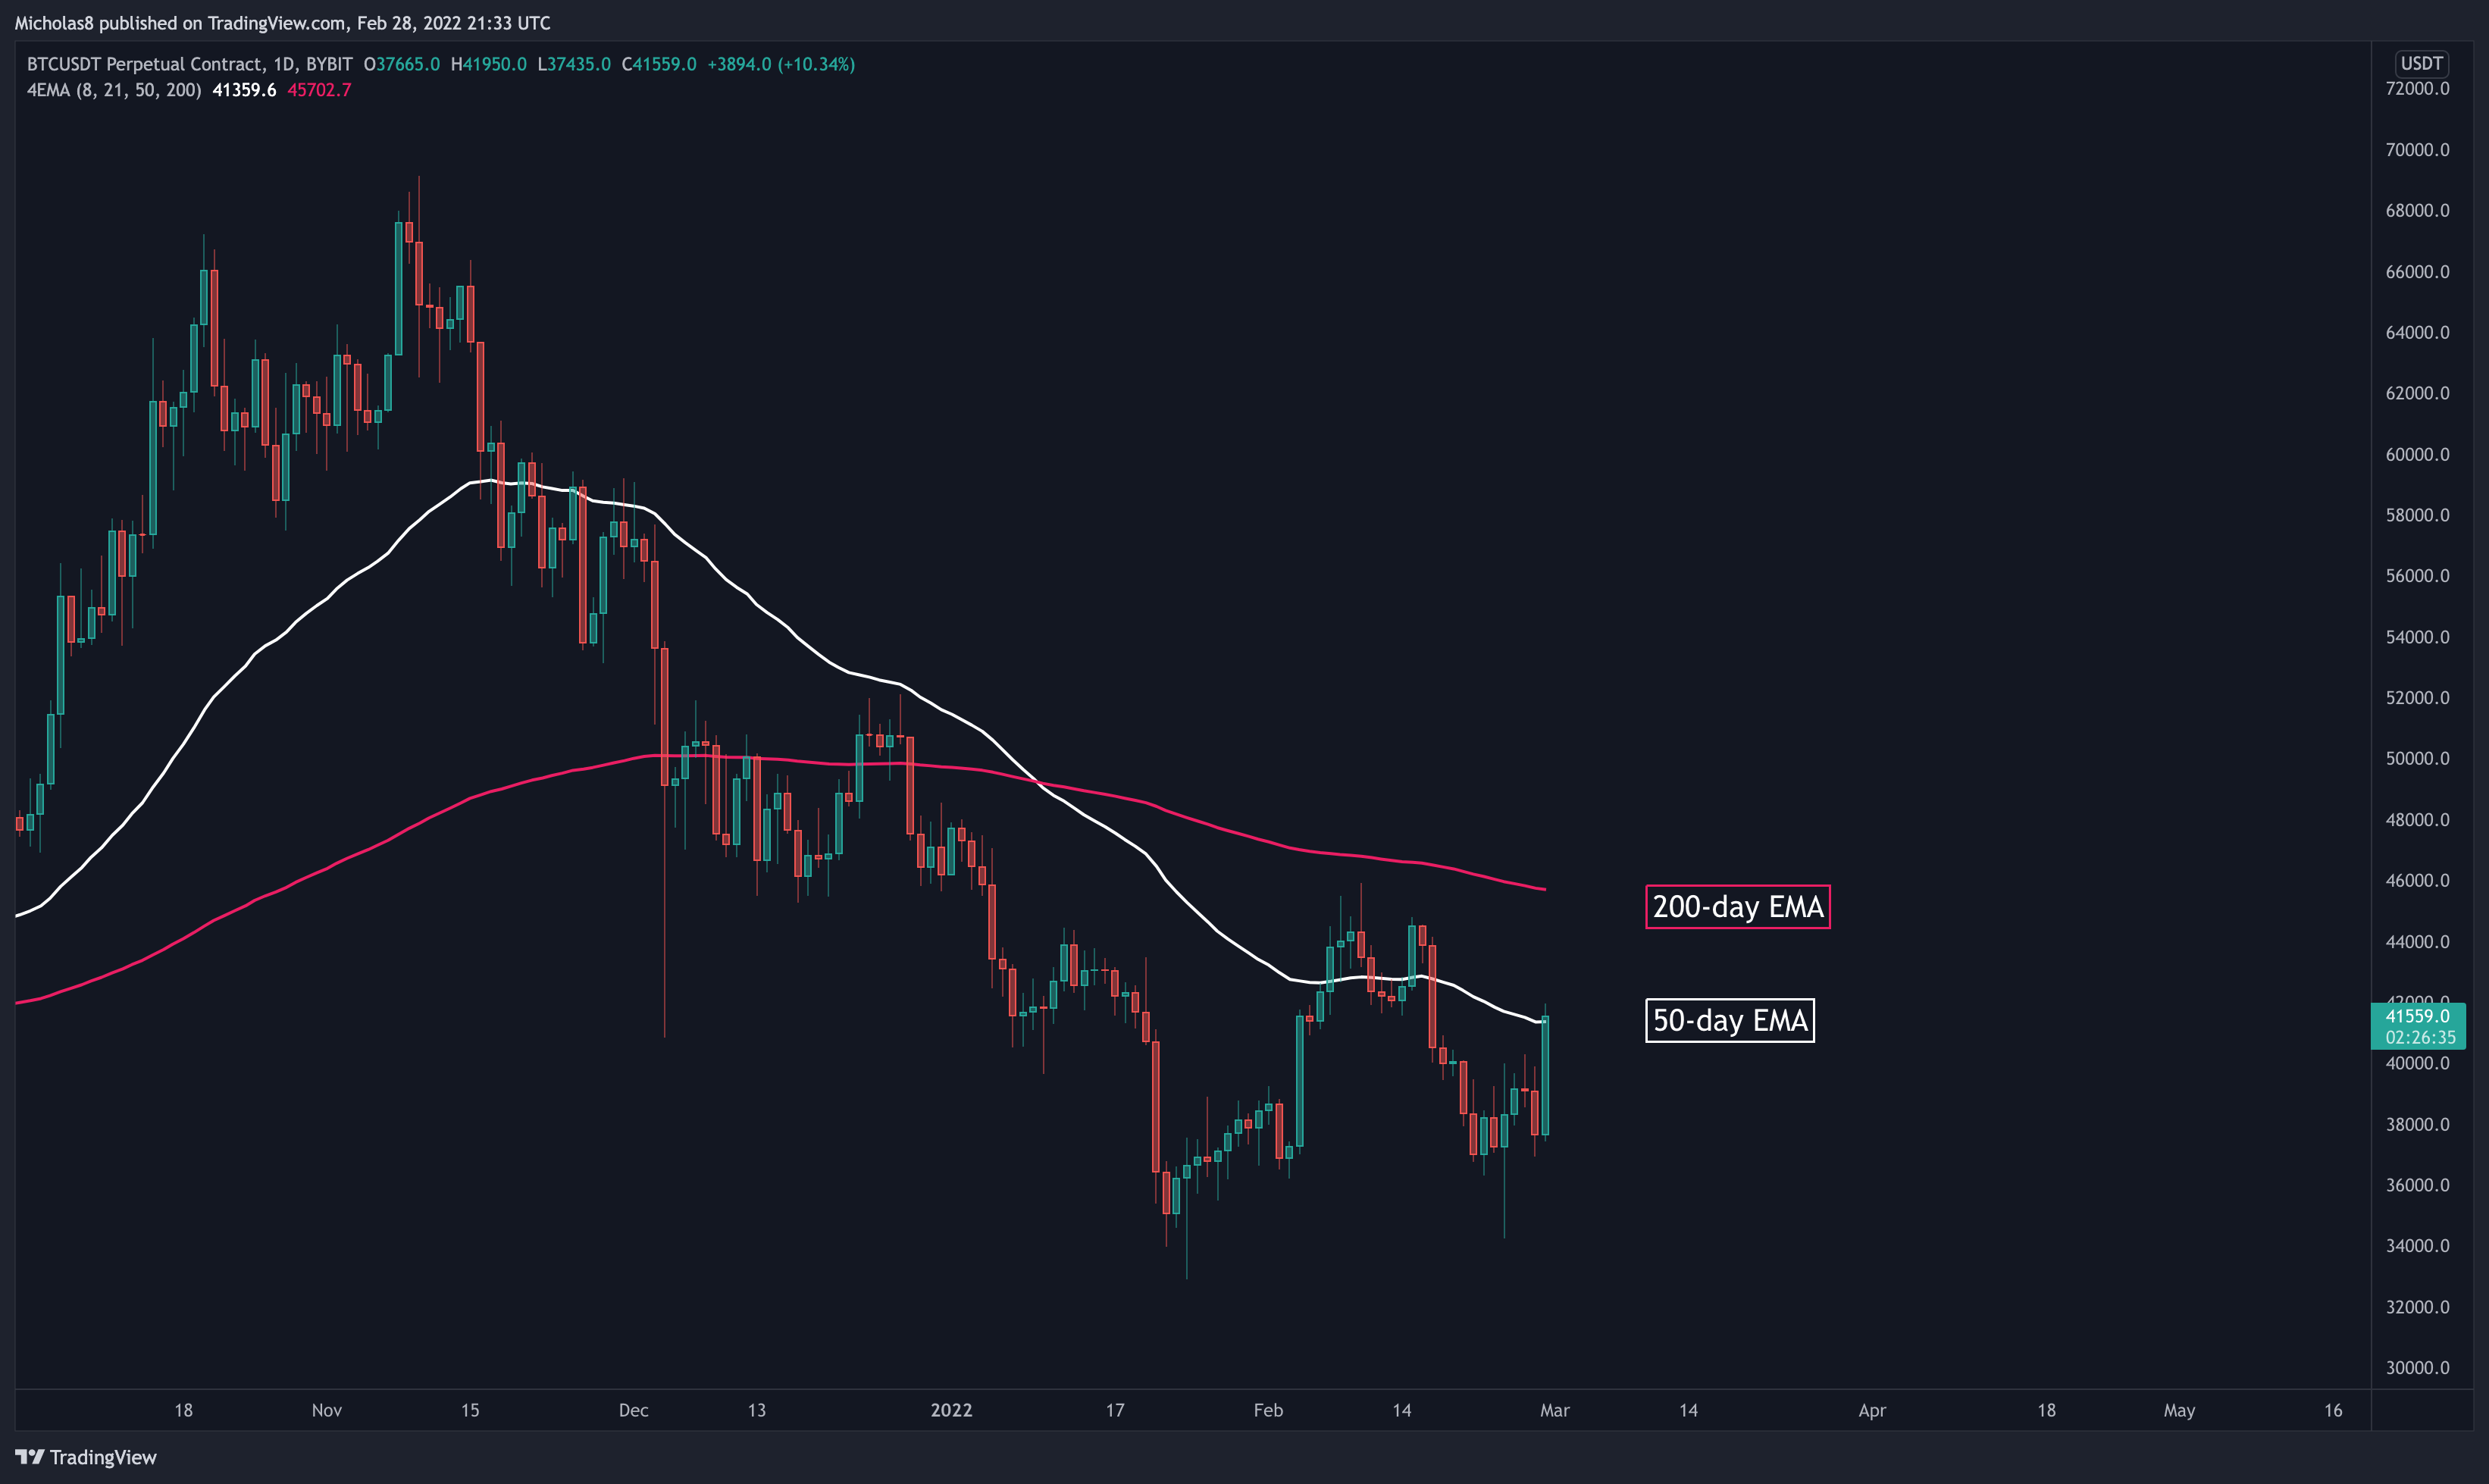
Bitcoin continues to trade below the 50/200-day EMAs.
Implication(s): They may serve as levels of resistance moving forward.
4H Timeframe
Divergence(s)
Bearish Divergence
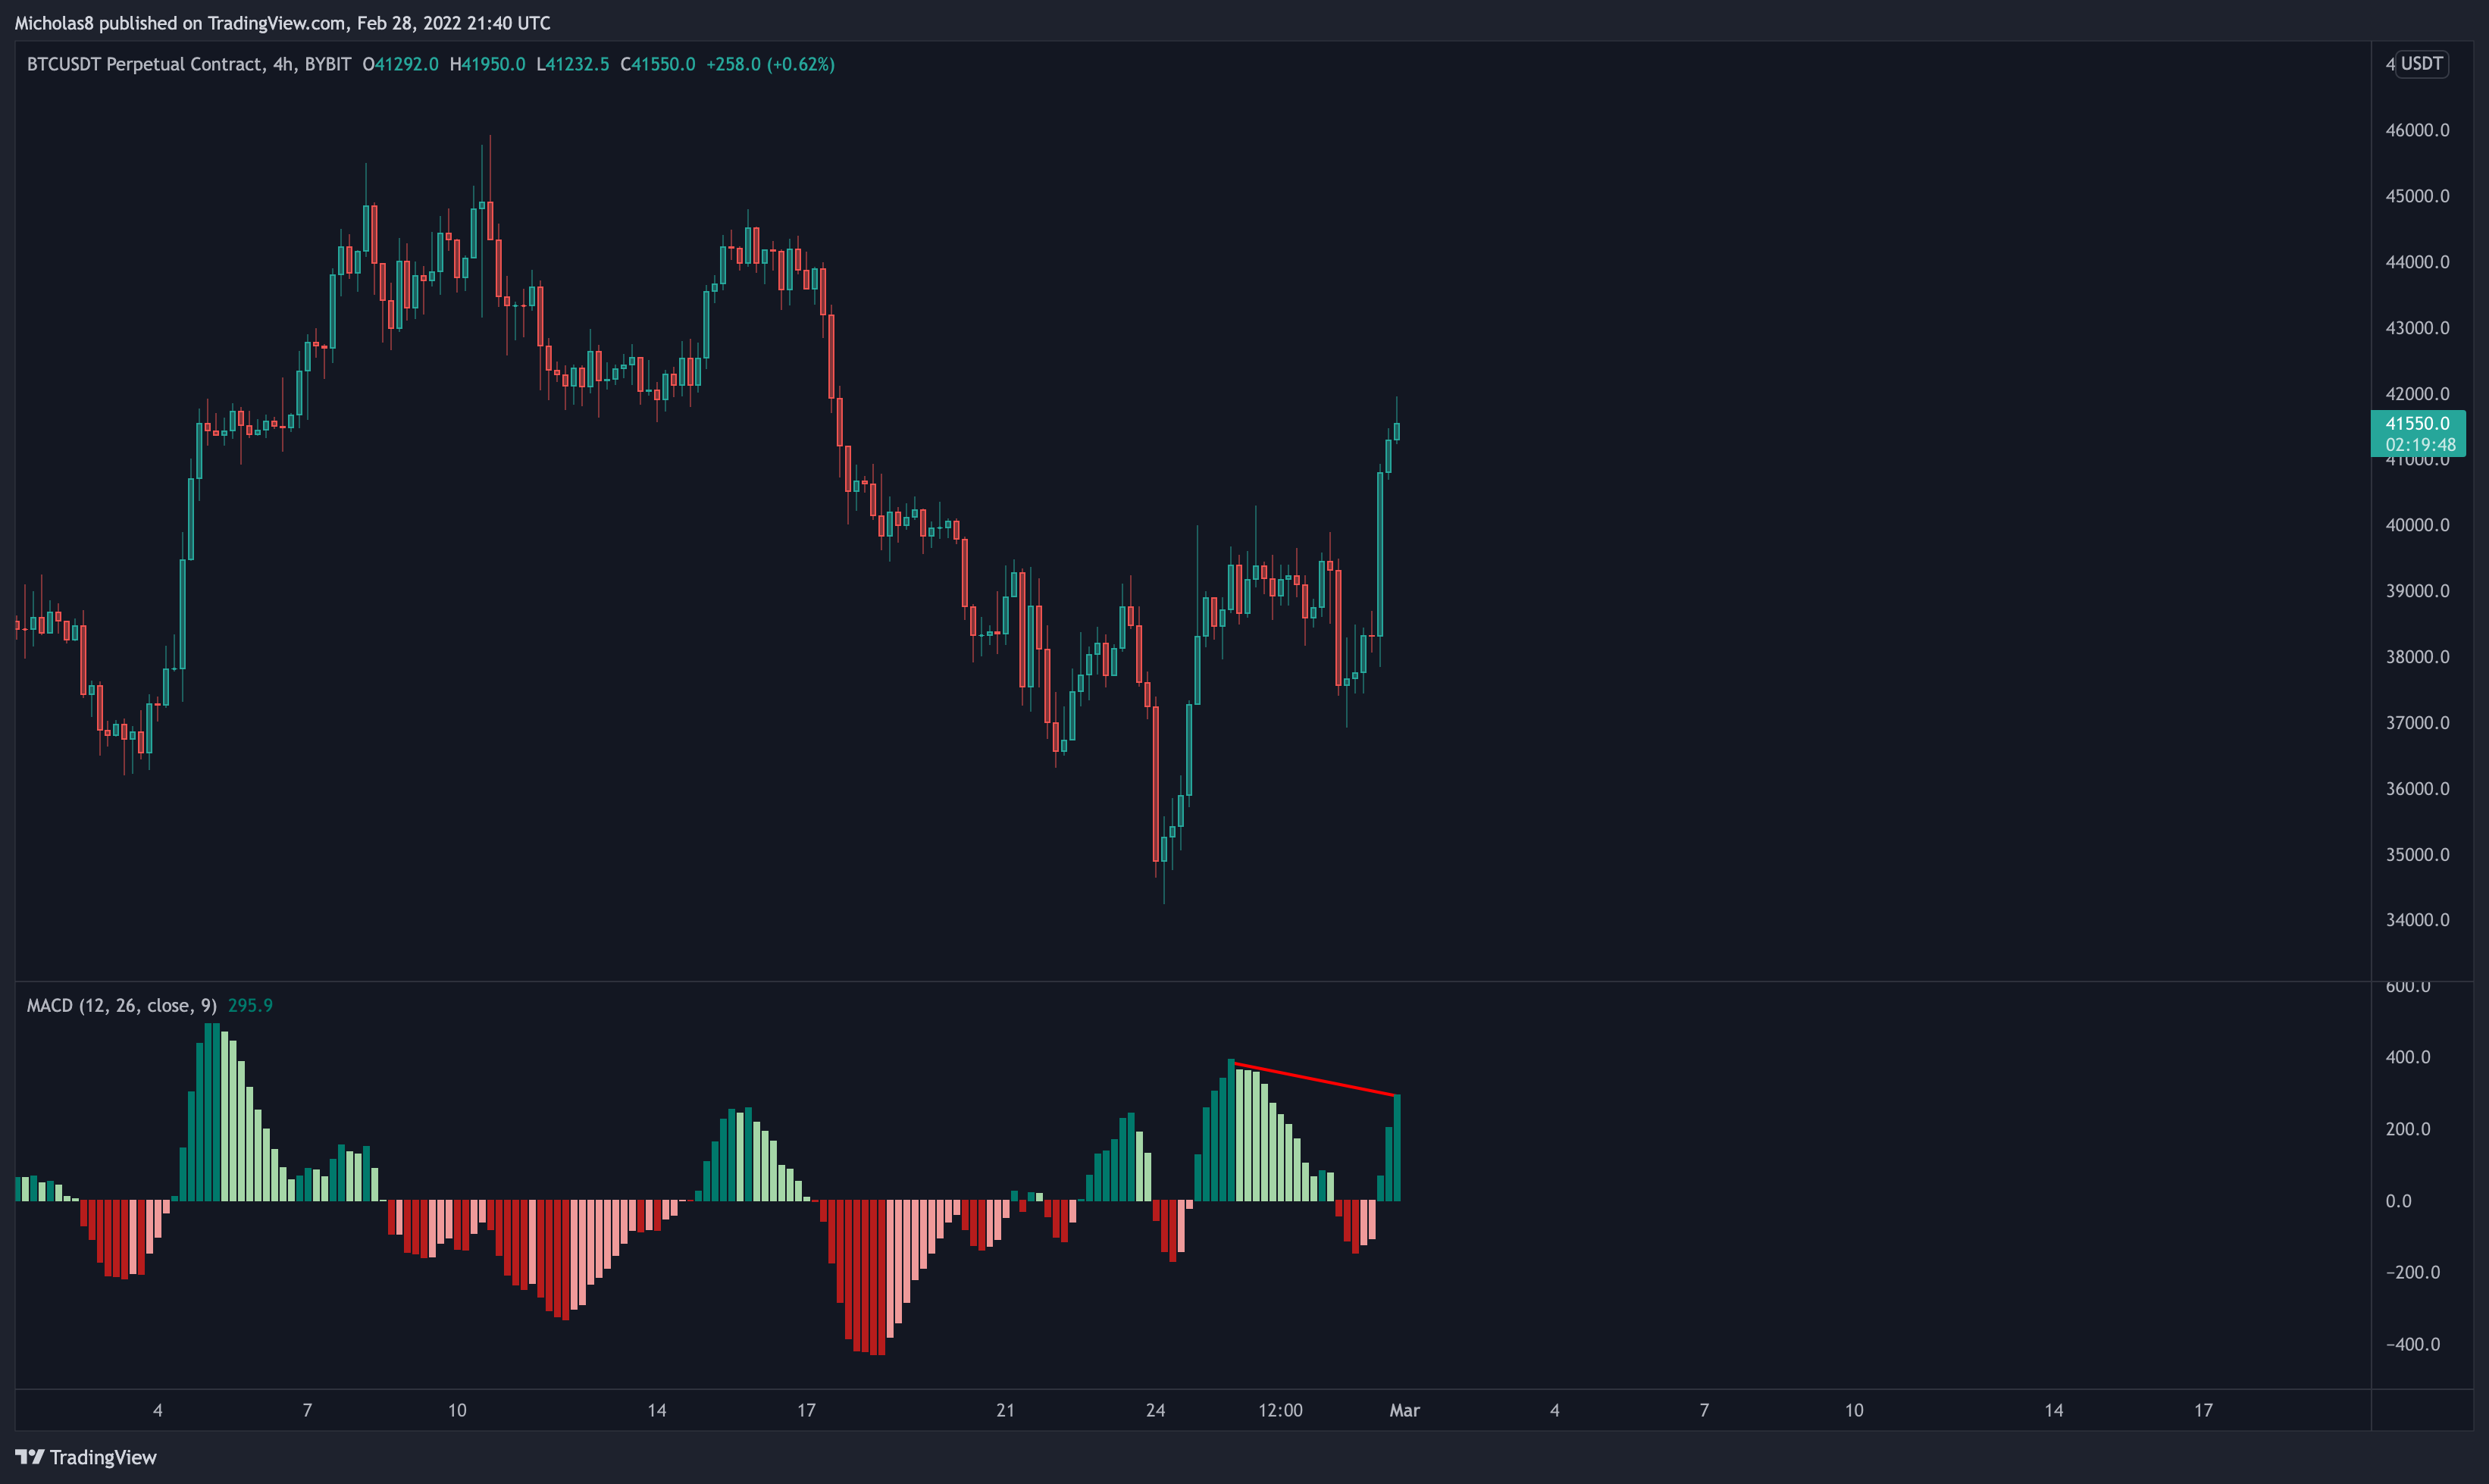
Bitcoin has a higher high in price, with a lower high in the MACD. This is a bearish divergence, which signals a possible trend reversal down.
Invalidation: Higher high in price and in the MACD.
Hidden Bearish Divergence
Bitcoin has a lower high in price, with a higher high in the RSI. This is a hidden bearish divergence, which signals a possible trend continuation down.
Invalidation: Higher high in price with a higher high in the RSI.
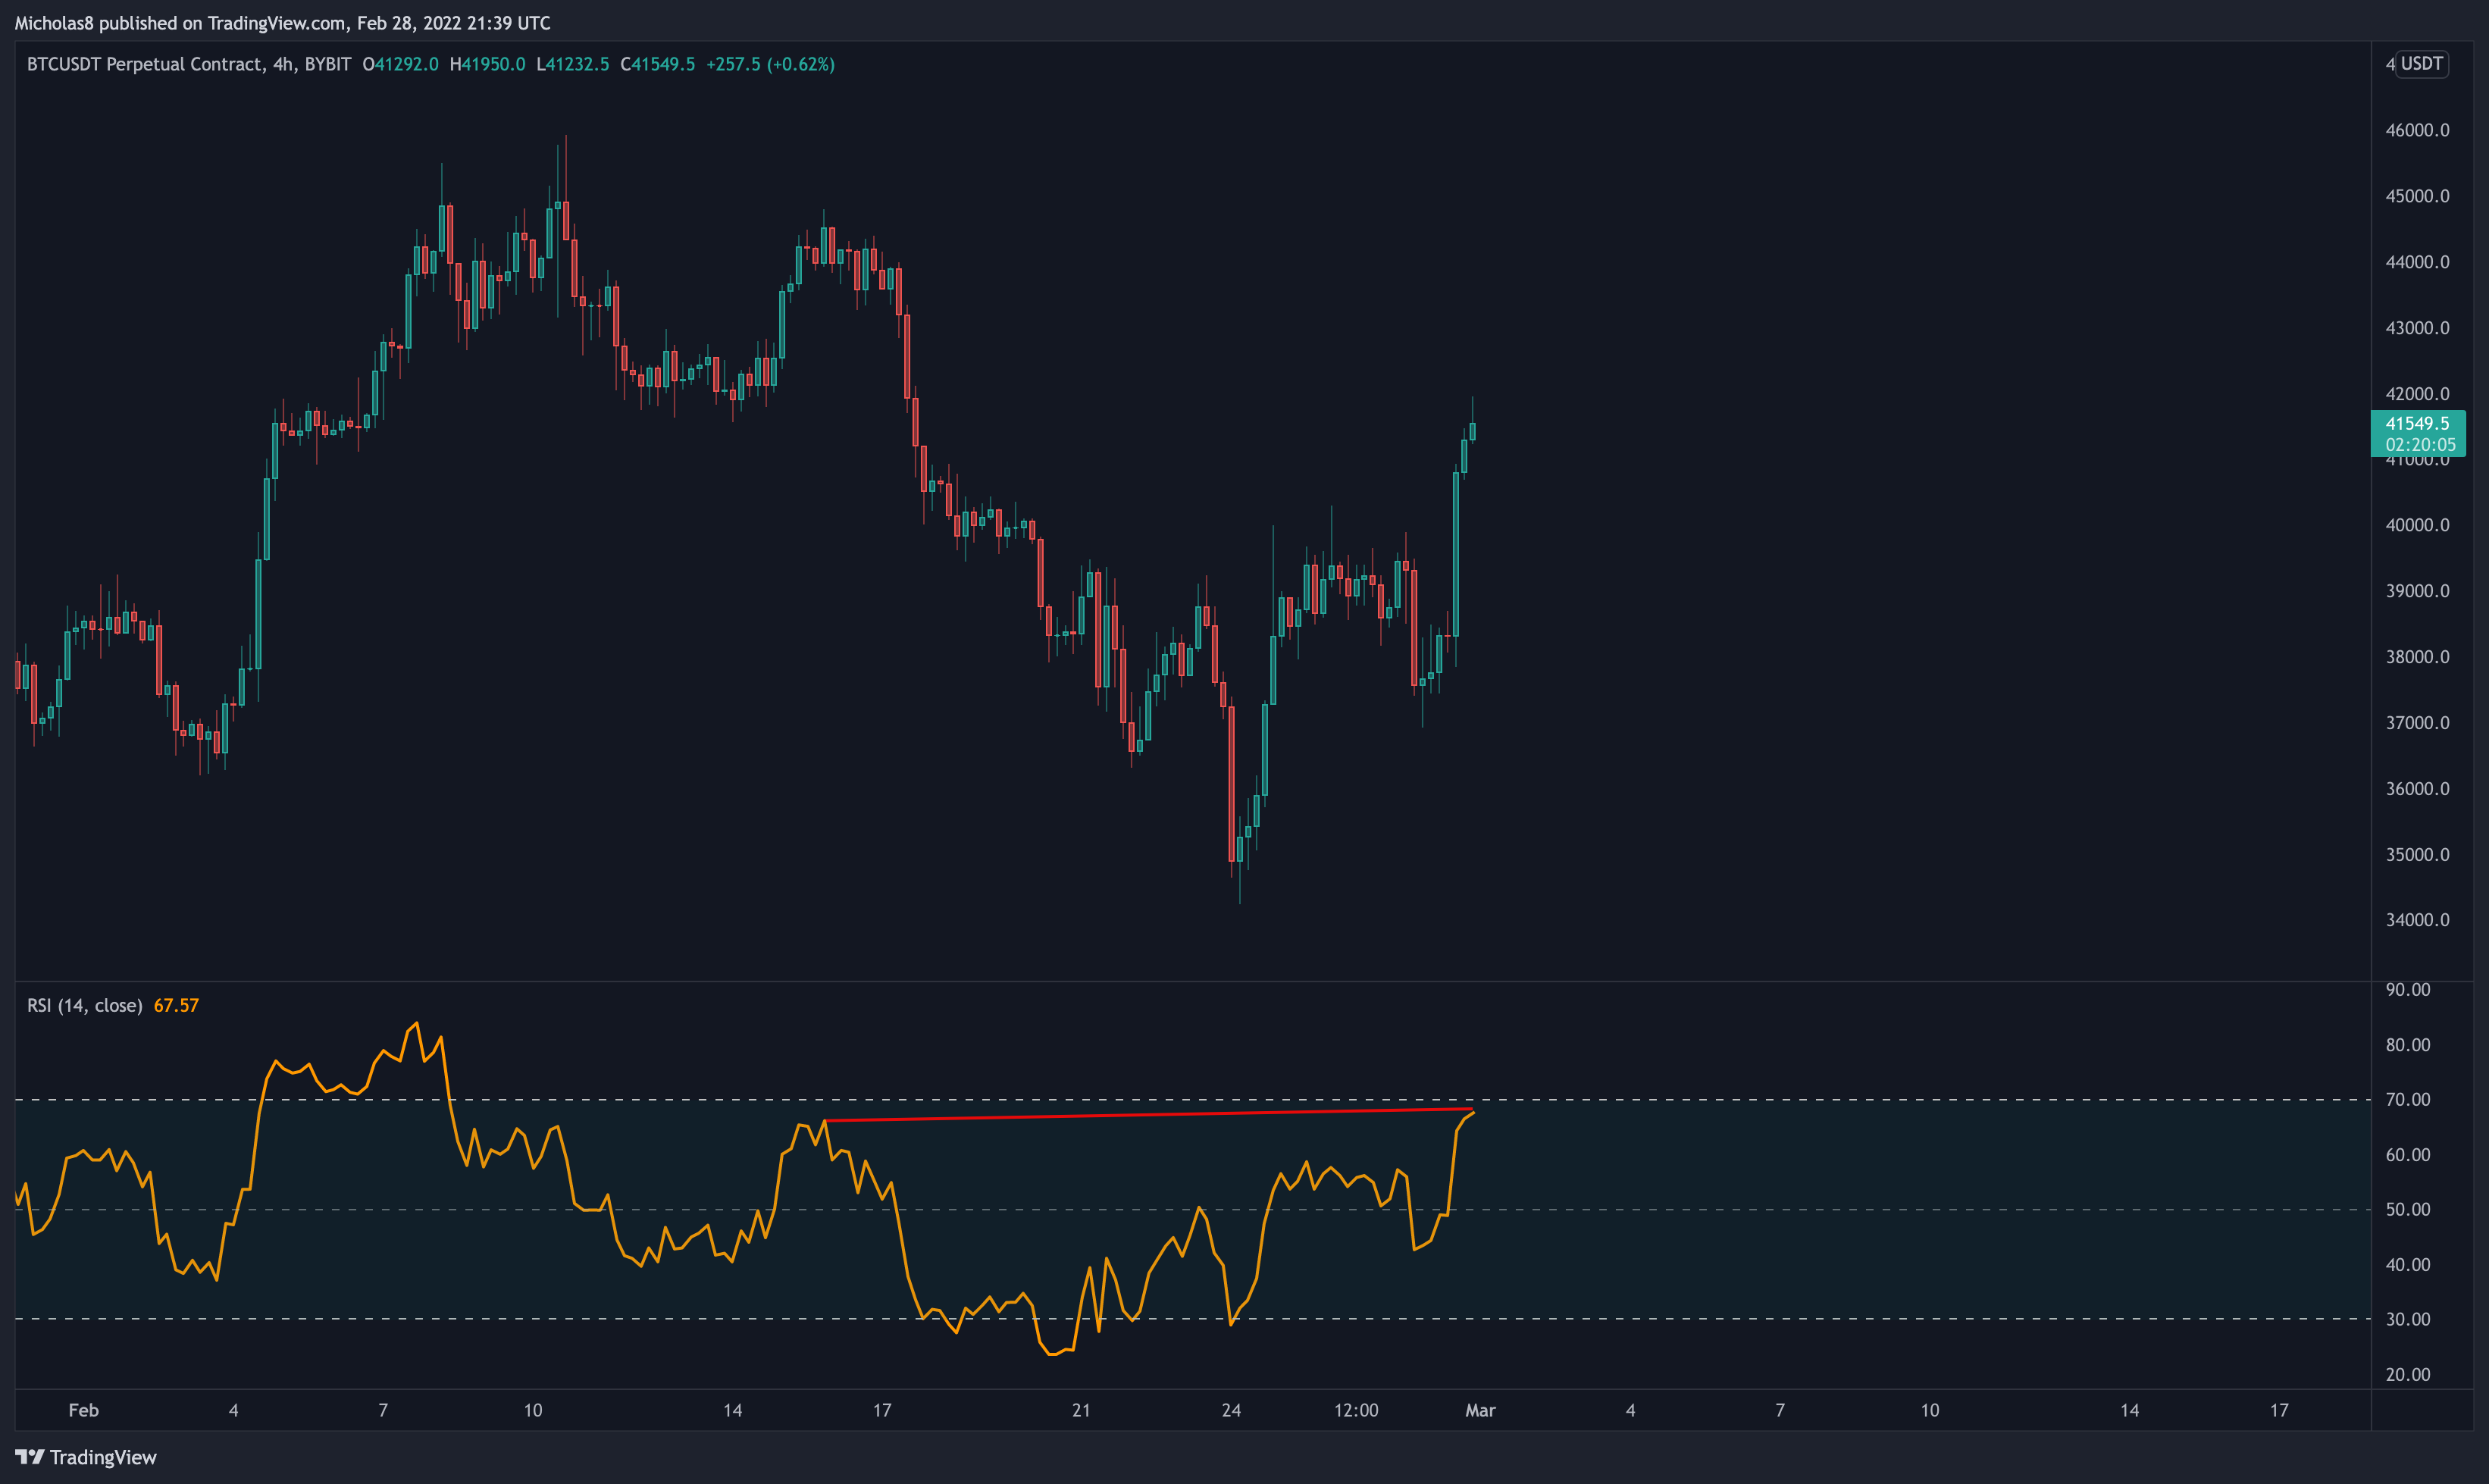
1H Timeframe
Divergence(s)
Bearish Divergence
Bitcoin has a higher high in price, with a lower high in the MACD. This is a bearish divergence, which signals a possible trend reversal down.
Invalidation: Higher high in price and in the MACD.
CME GAPS
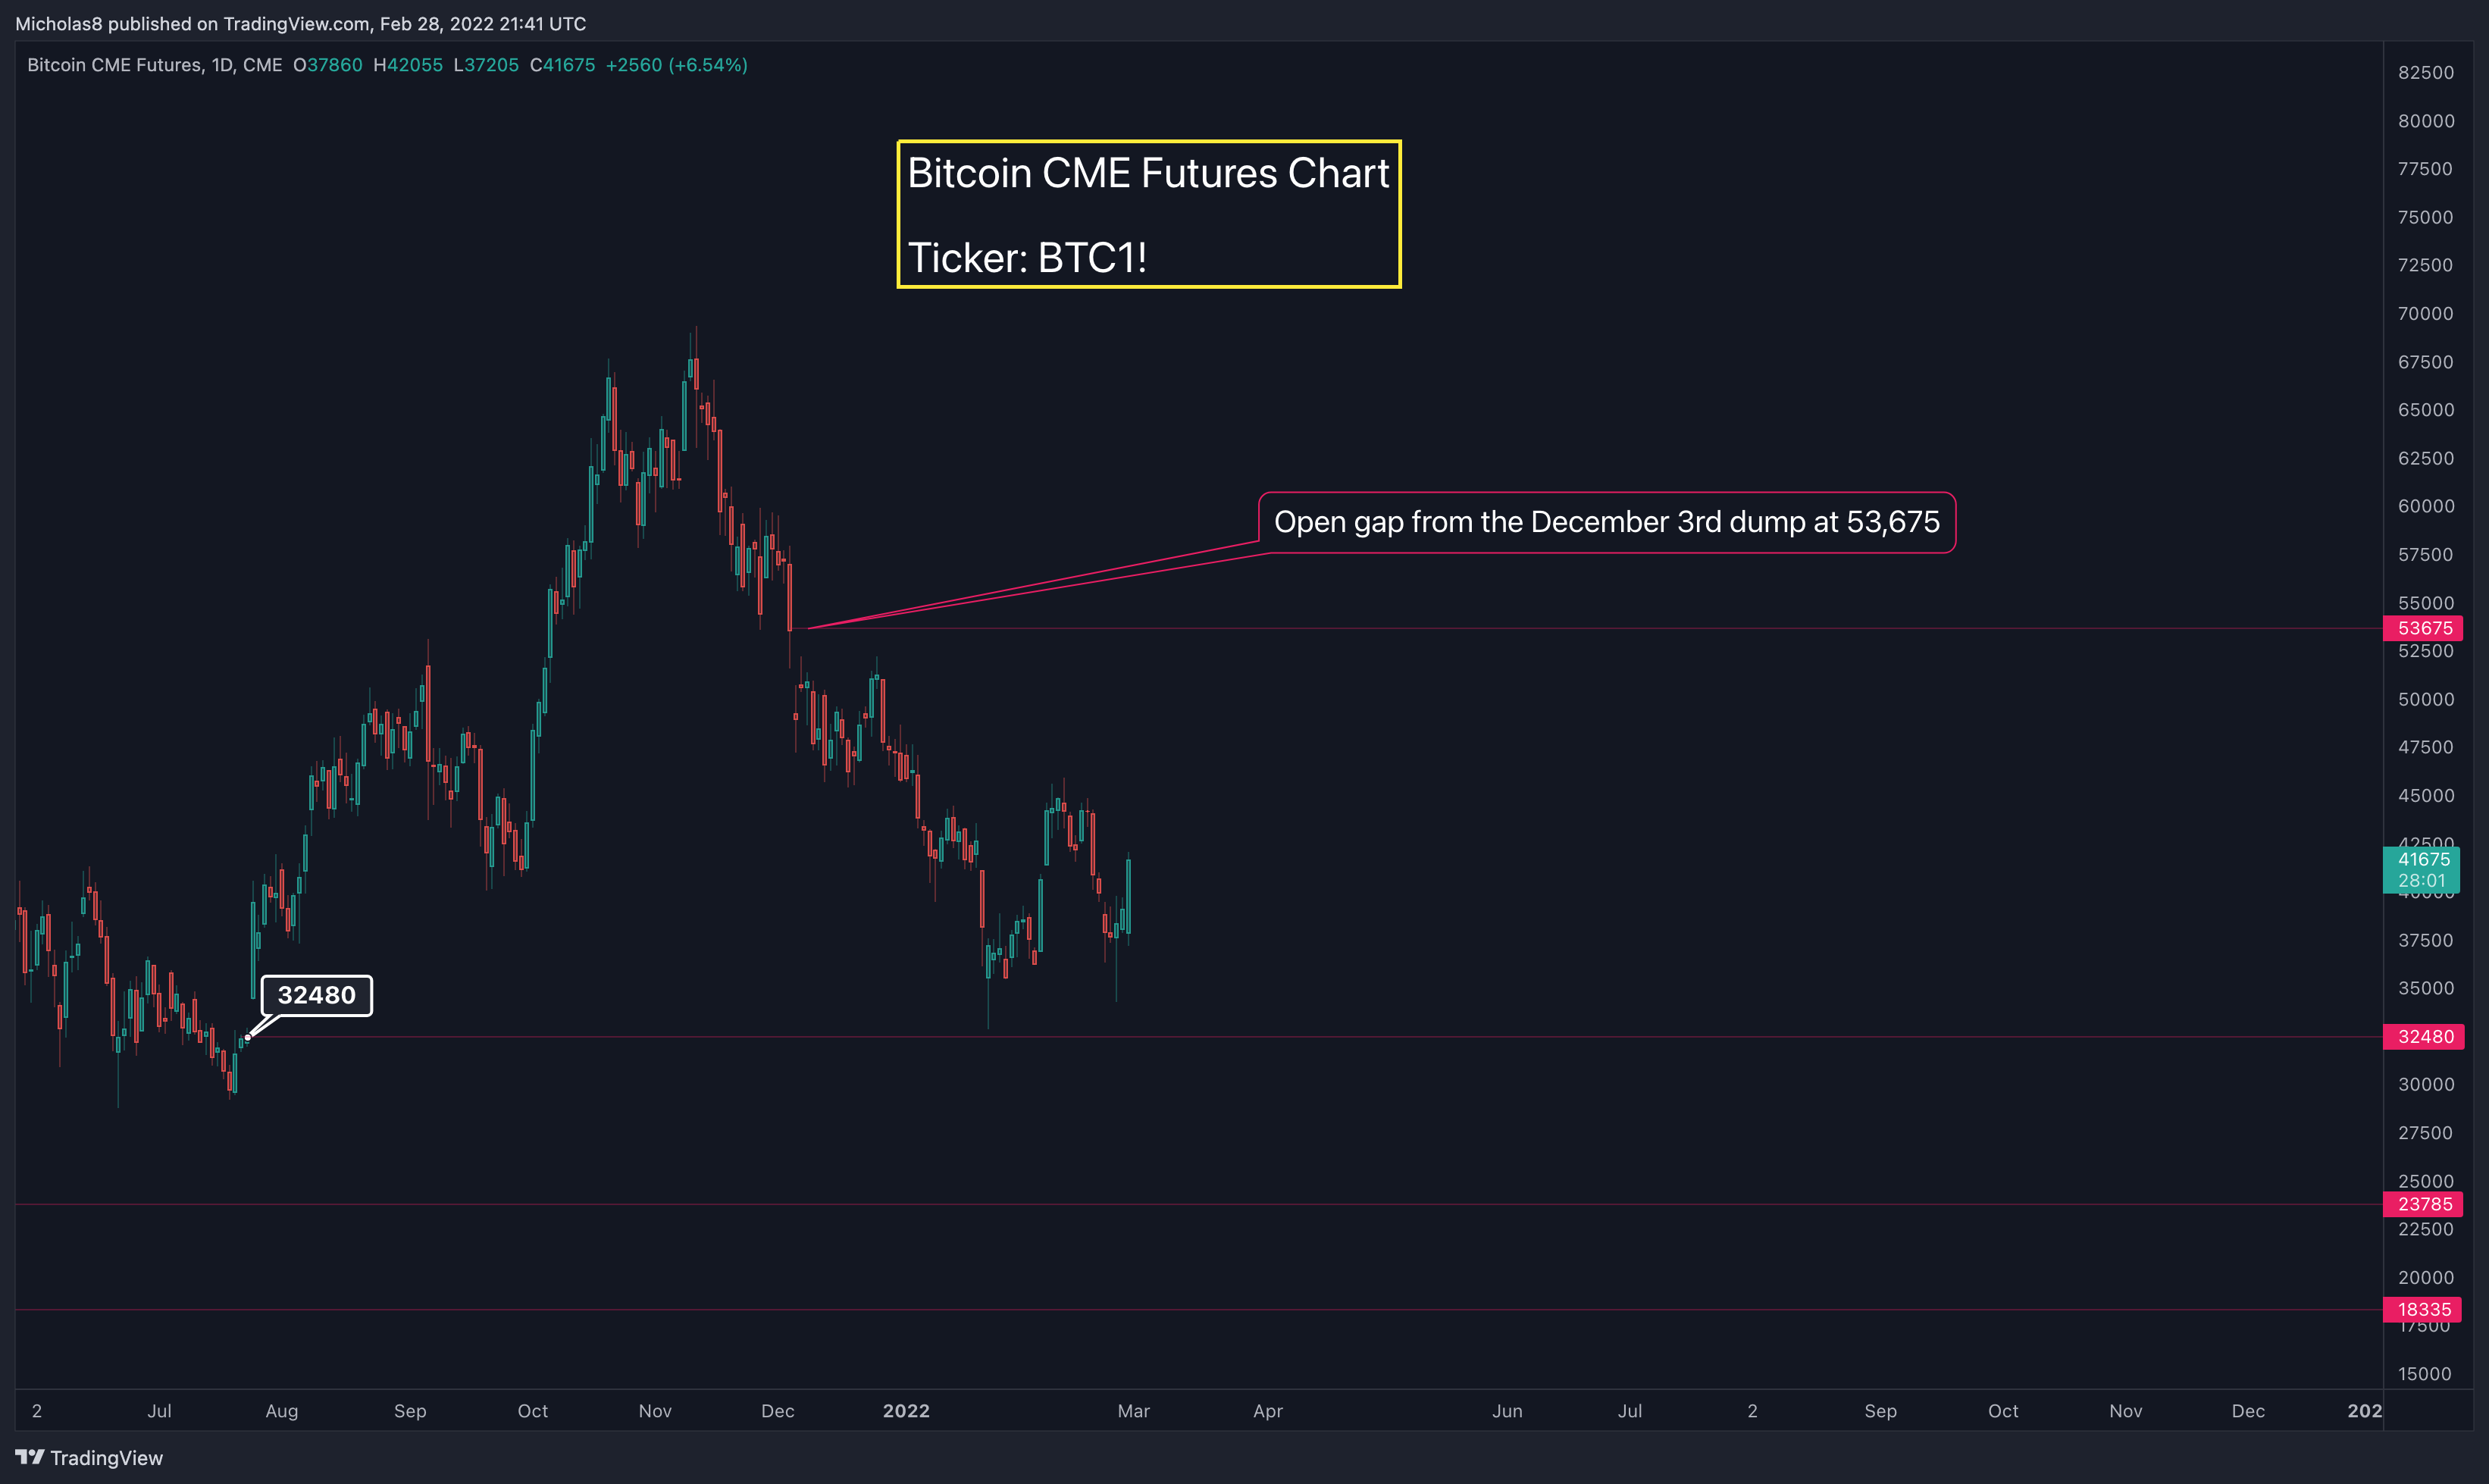
GAP: 32,480 – This gap has nearly been completely filled!
GAP: 39,935 – Filled!
GAP: 53,675 – As mentioned when the gap first formed, this is a "breakaway gap". These are gaps that form when there's a dramatic shift in market structure. Typically these gaps take much longer to fill than the normal gaps. This is comparable to the gap at 32,480.
Key Levels
Monthly Timeframe
35018
38440
41445
46200
47180
56965
58860
61340
Daily Timeframe
29765
35060
37000
38680
39175
40725
42210
44525
46150
50765
51800
53800
57785
58480
61310
63590
65530
67600
Fibonacci Levels
4H Timeframe
32905
33960
35490
36200
36630
37550
39250
40350
40830
41555
42745
43495
44450
45280
45925
46730
48555
50490
52120
Fibonacci levels
1-hour Timeframe
34240
35850
36315
37165
37920
38600
38900
39440
40010
40430
40925
42835
43265
44375
44800
Fibonacci levels
FINAL THOUGHTS
RECAP FROM FRIDAY NIGHT
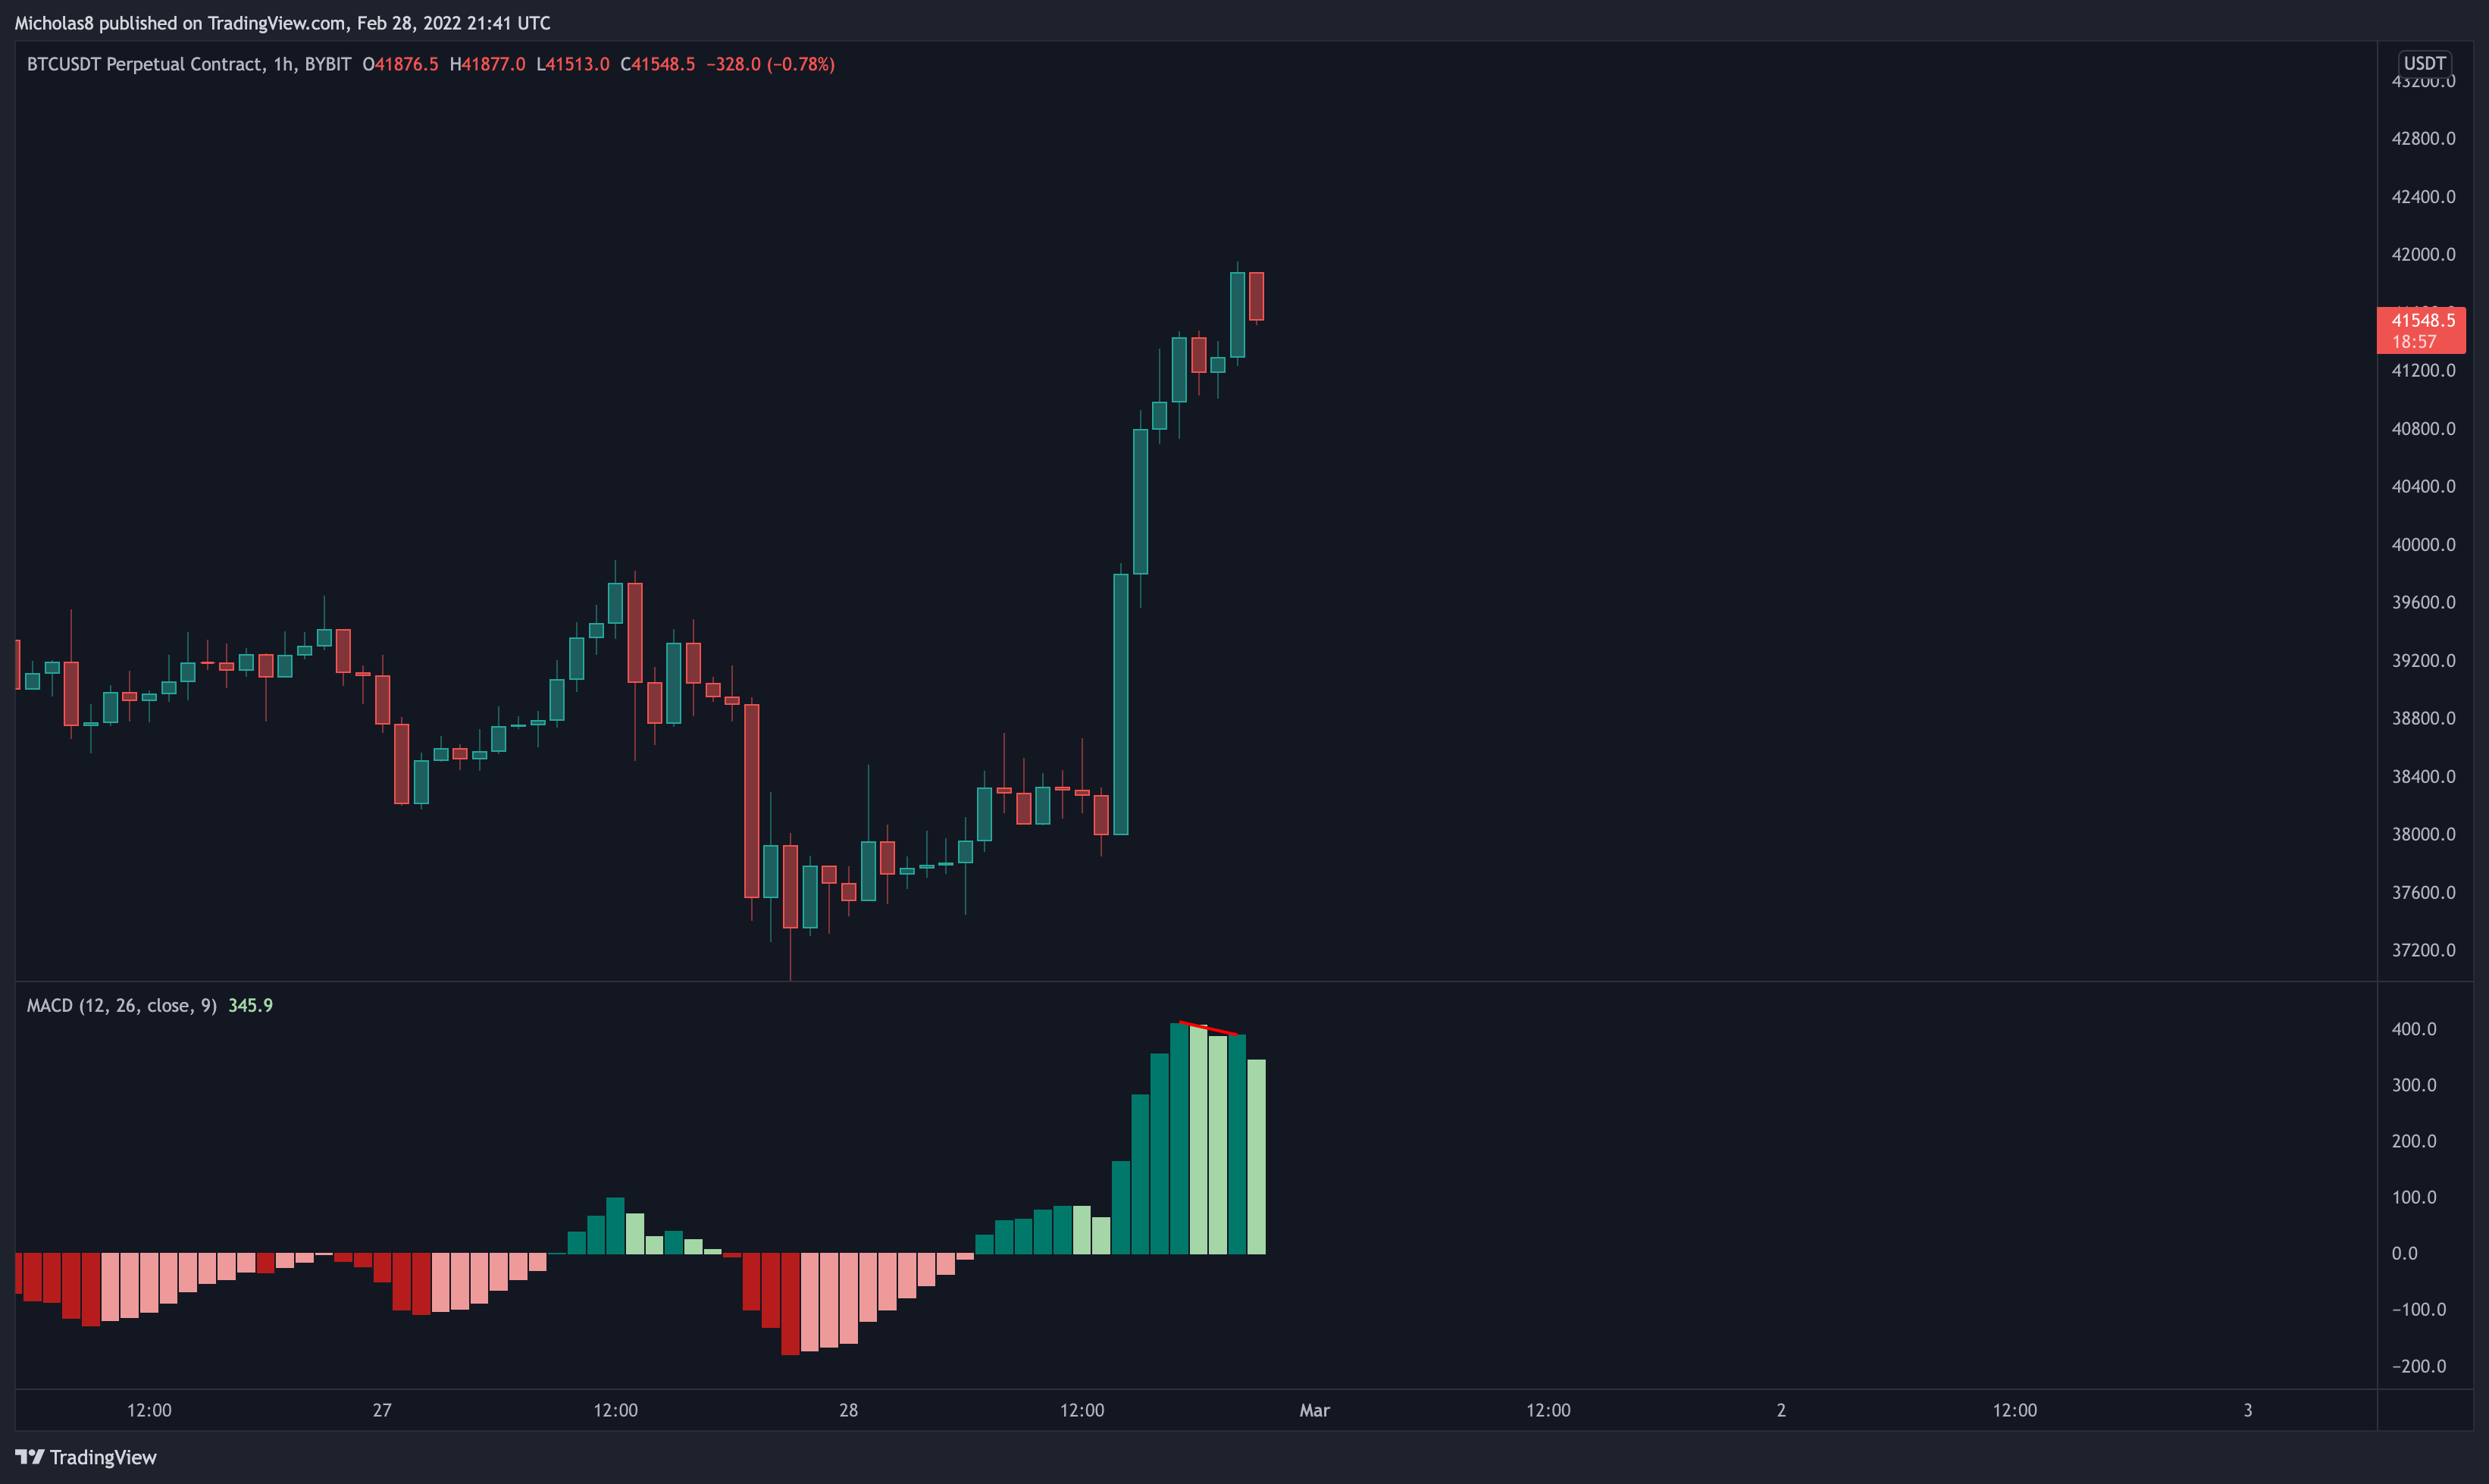
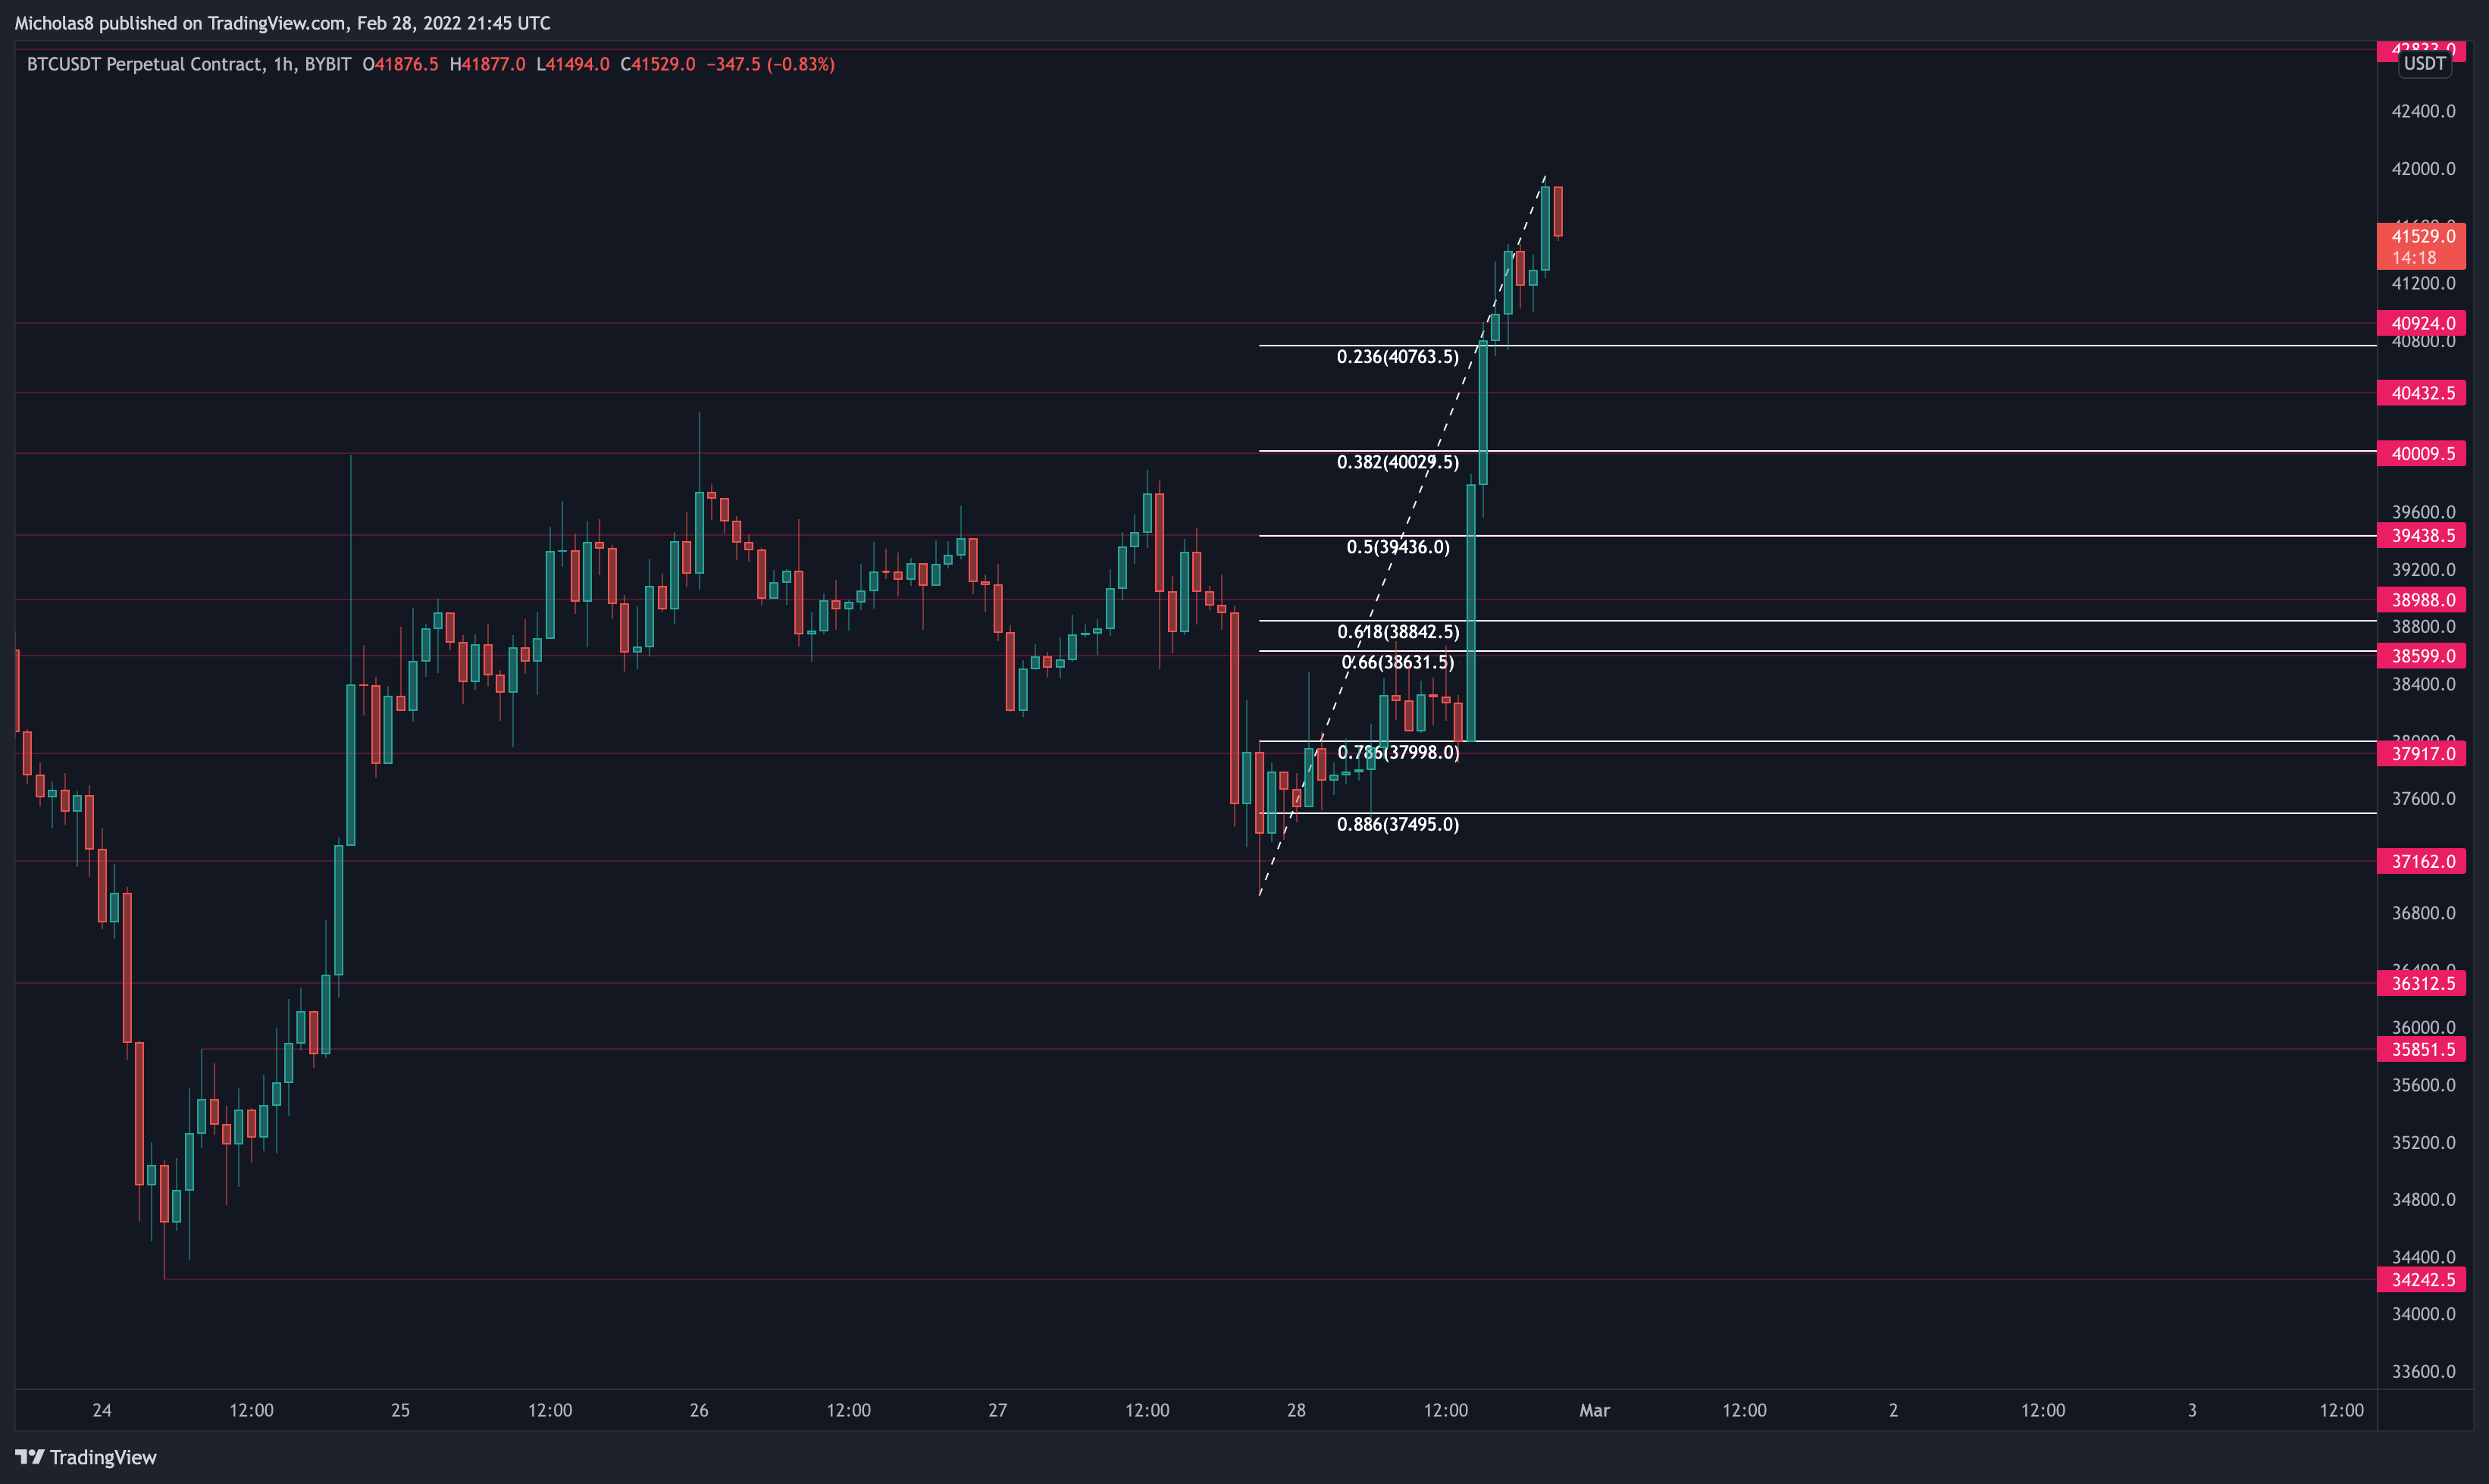
Bitcoin continues to see volume-supported upside.
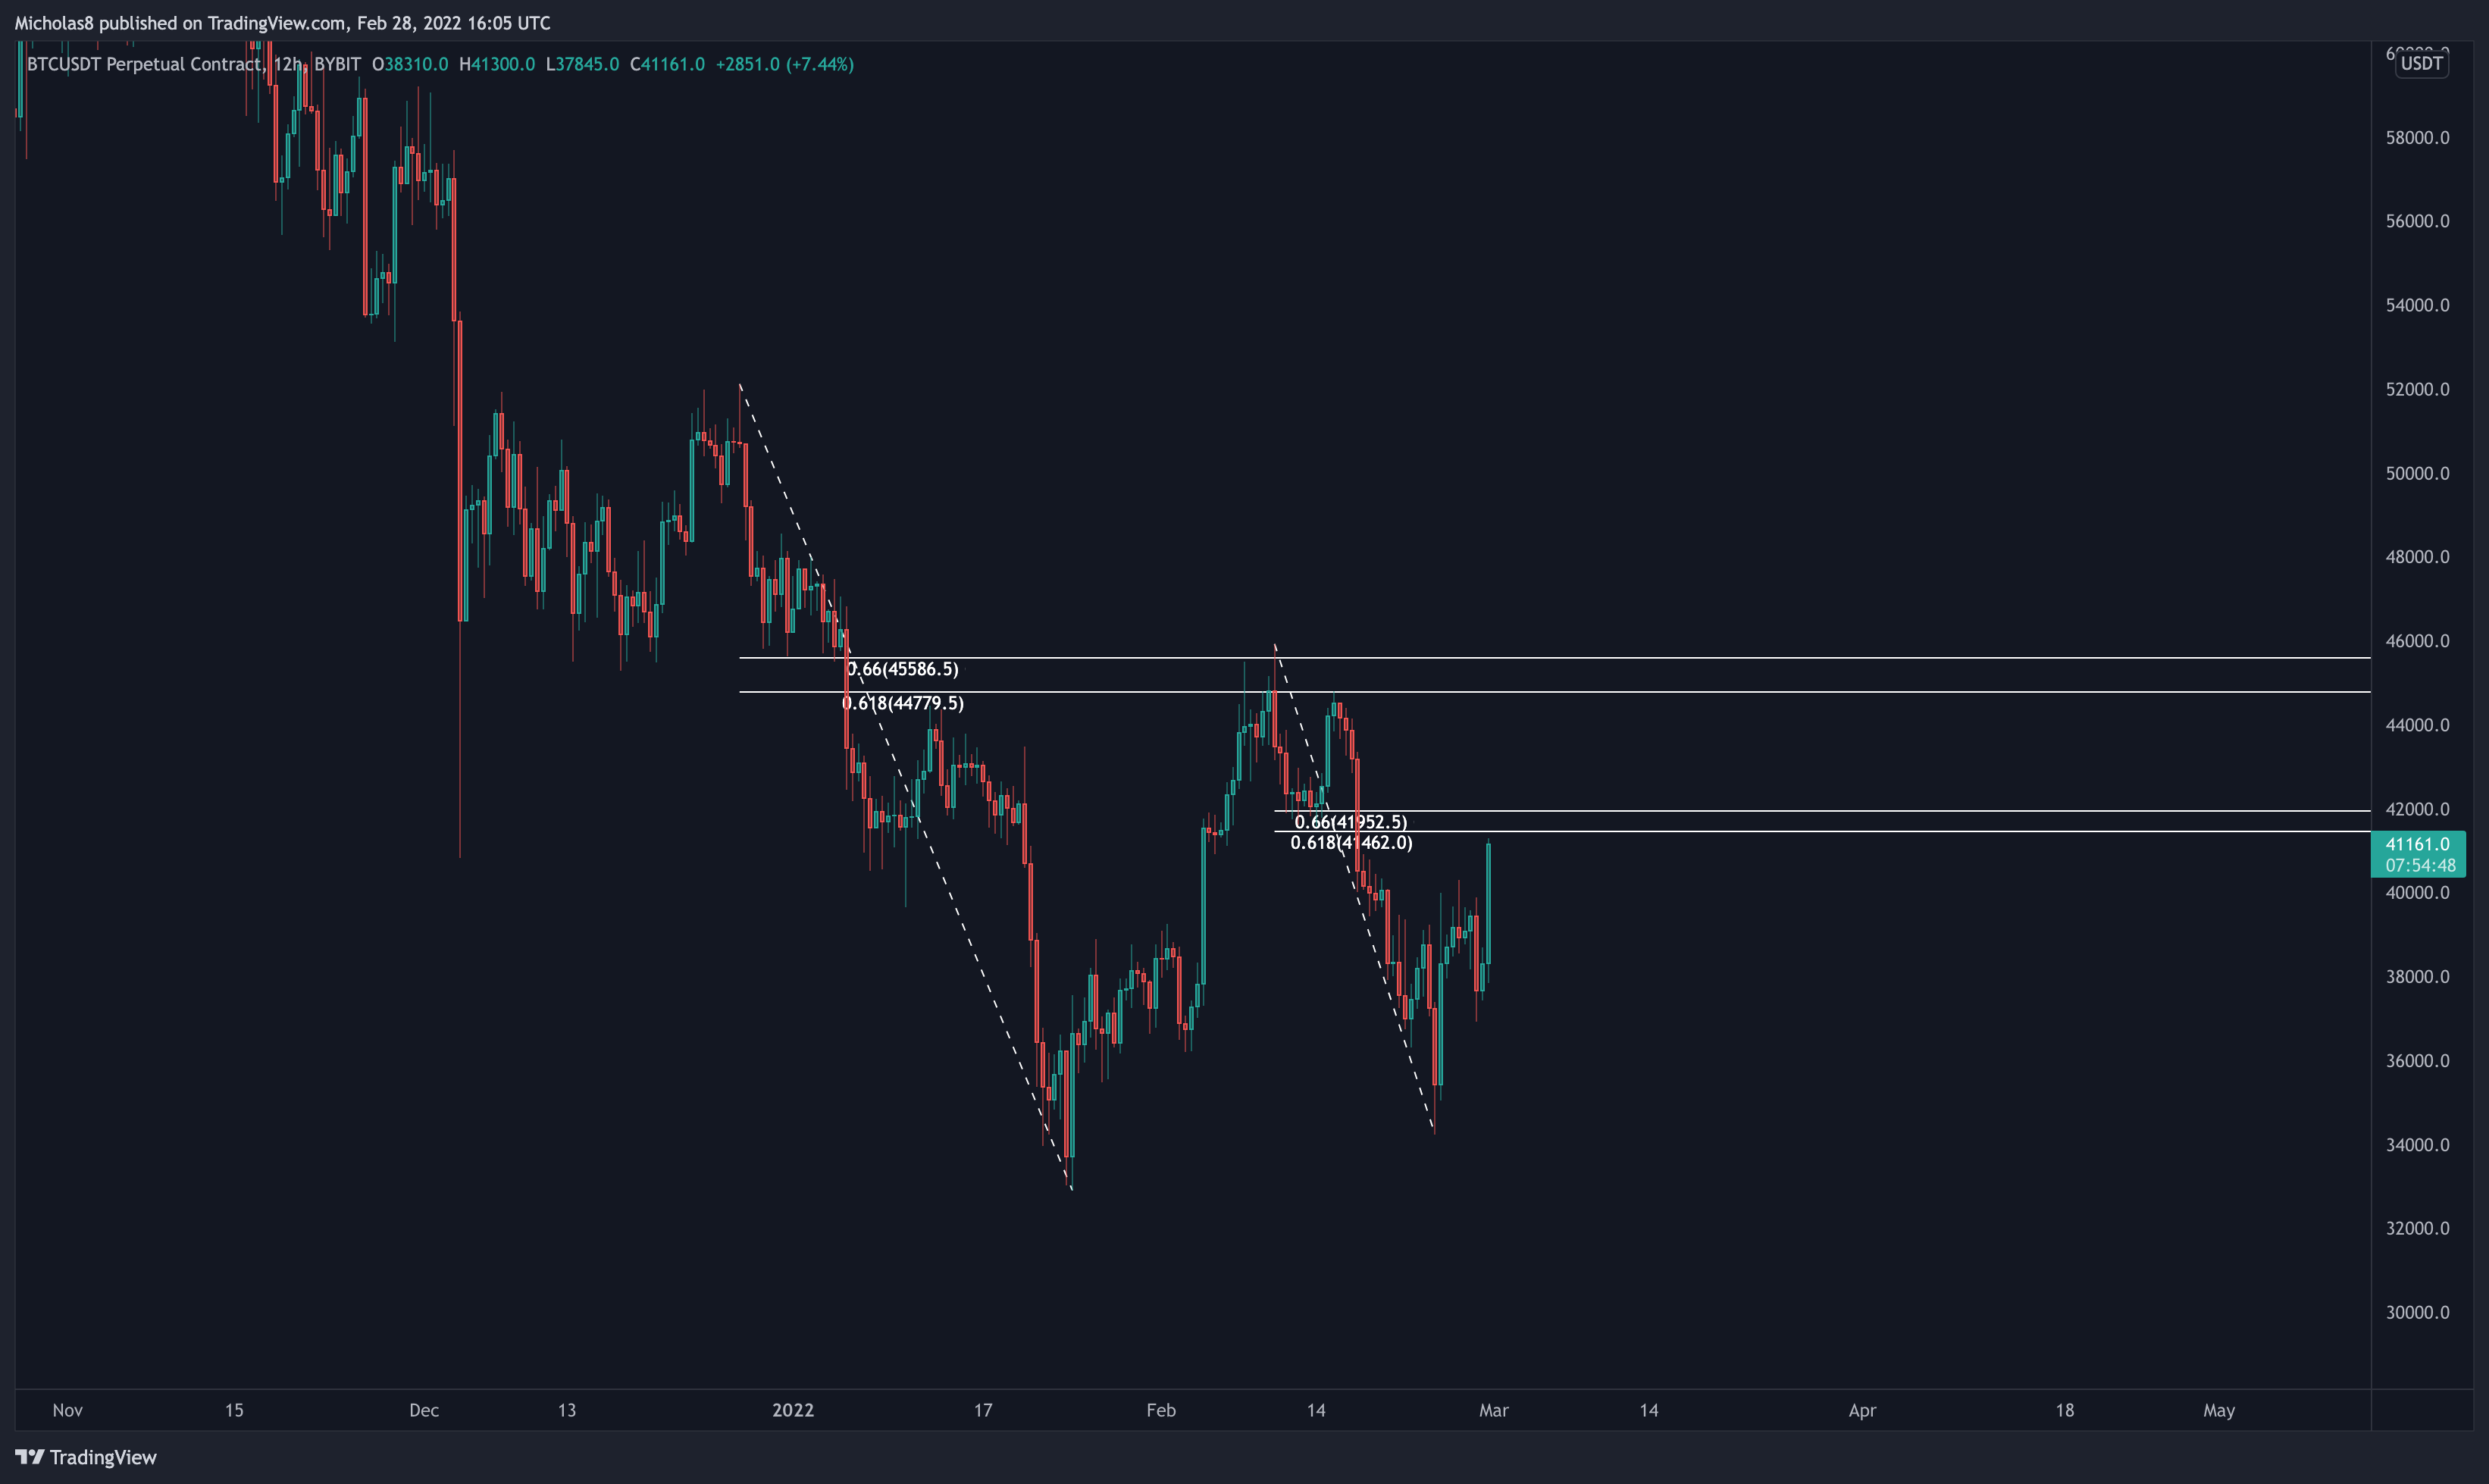
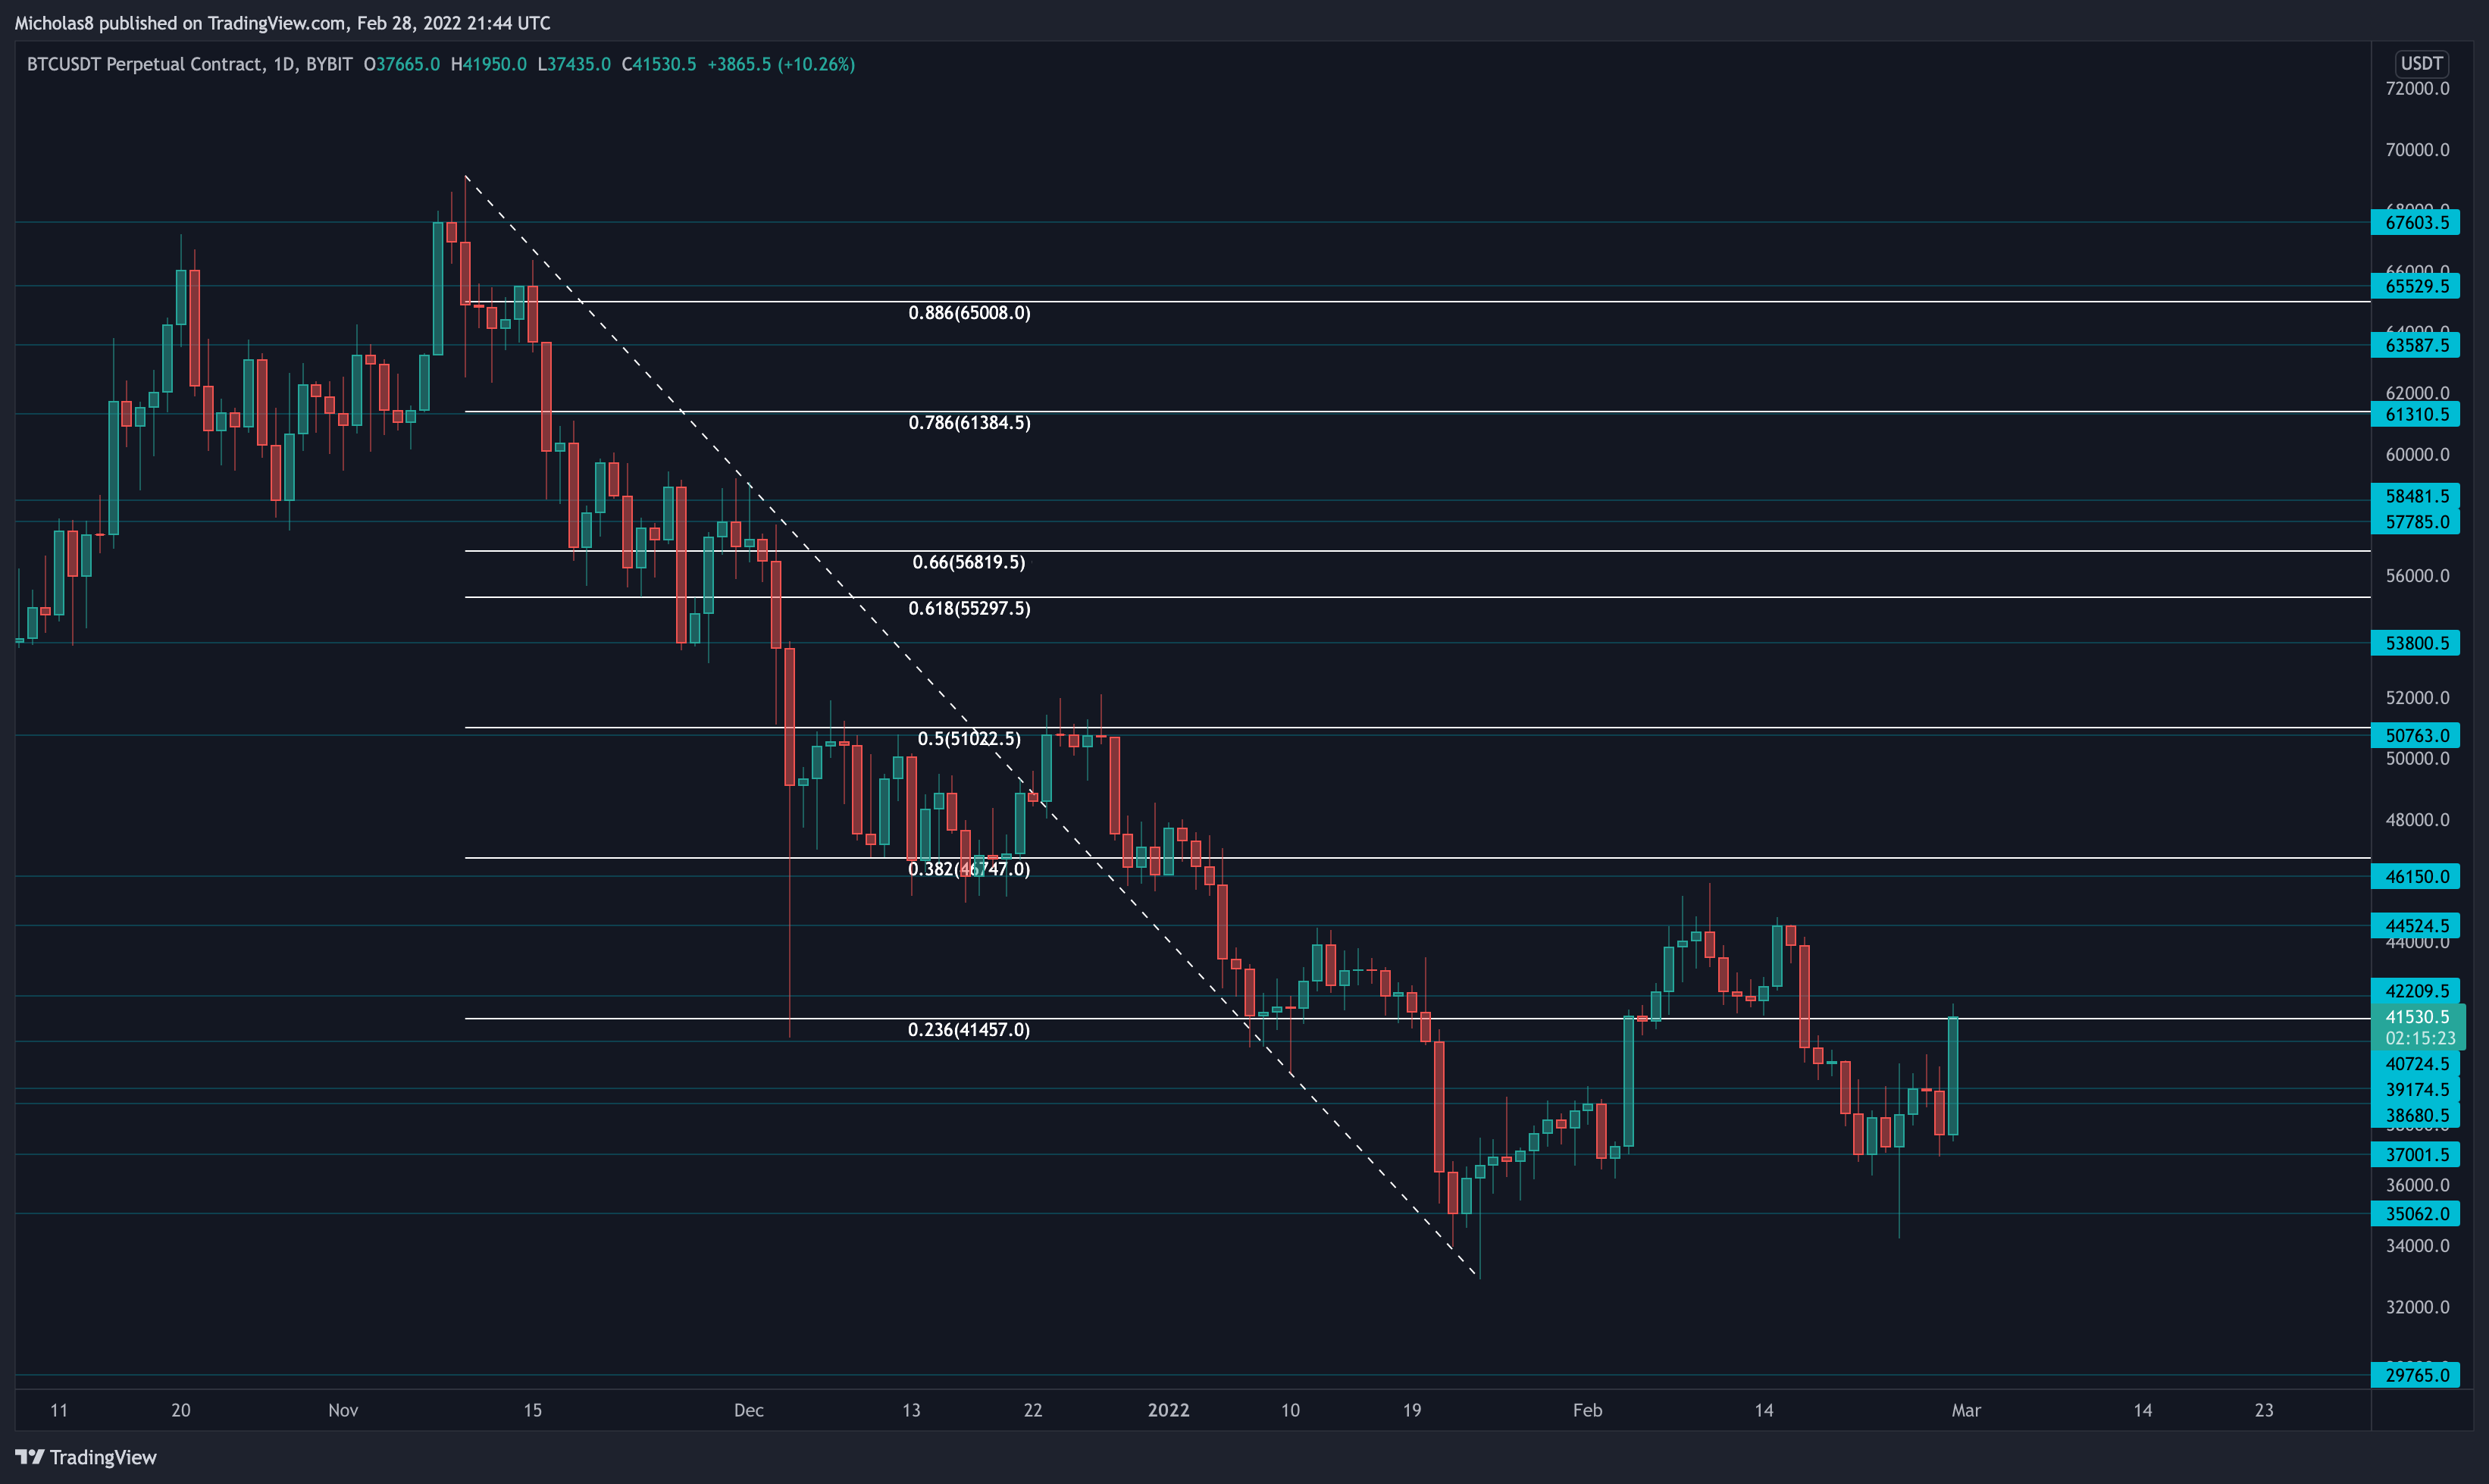
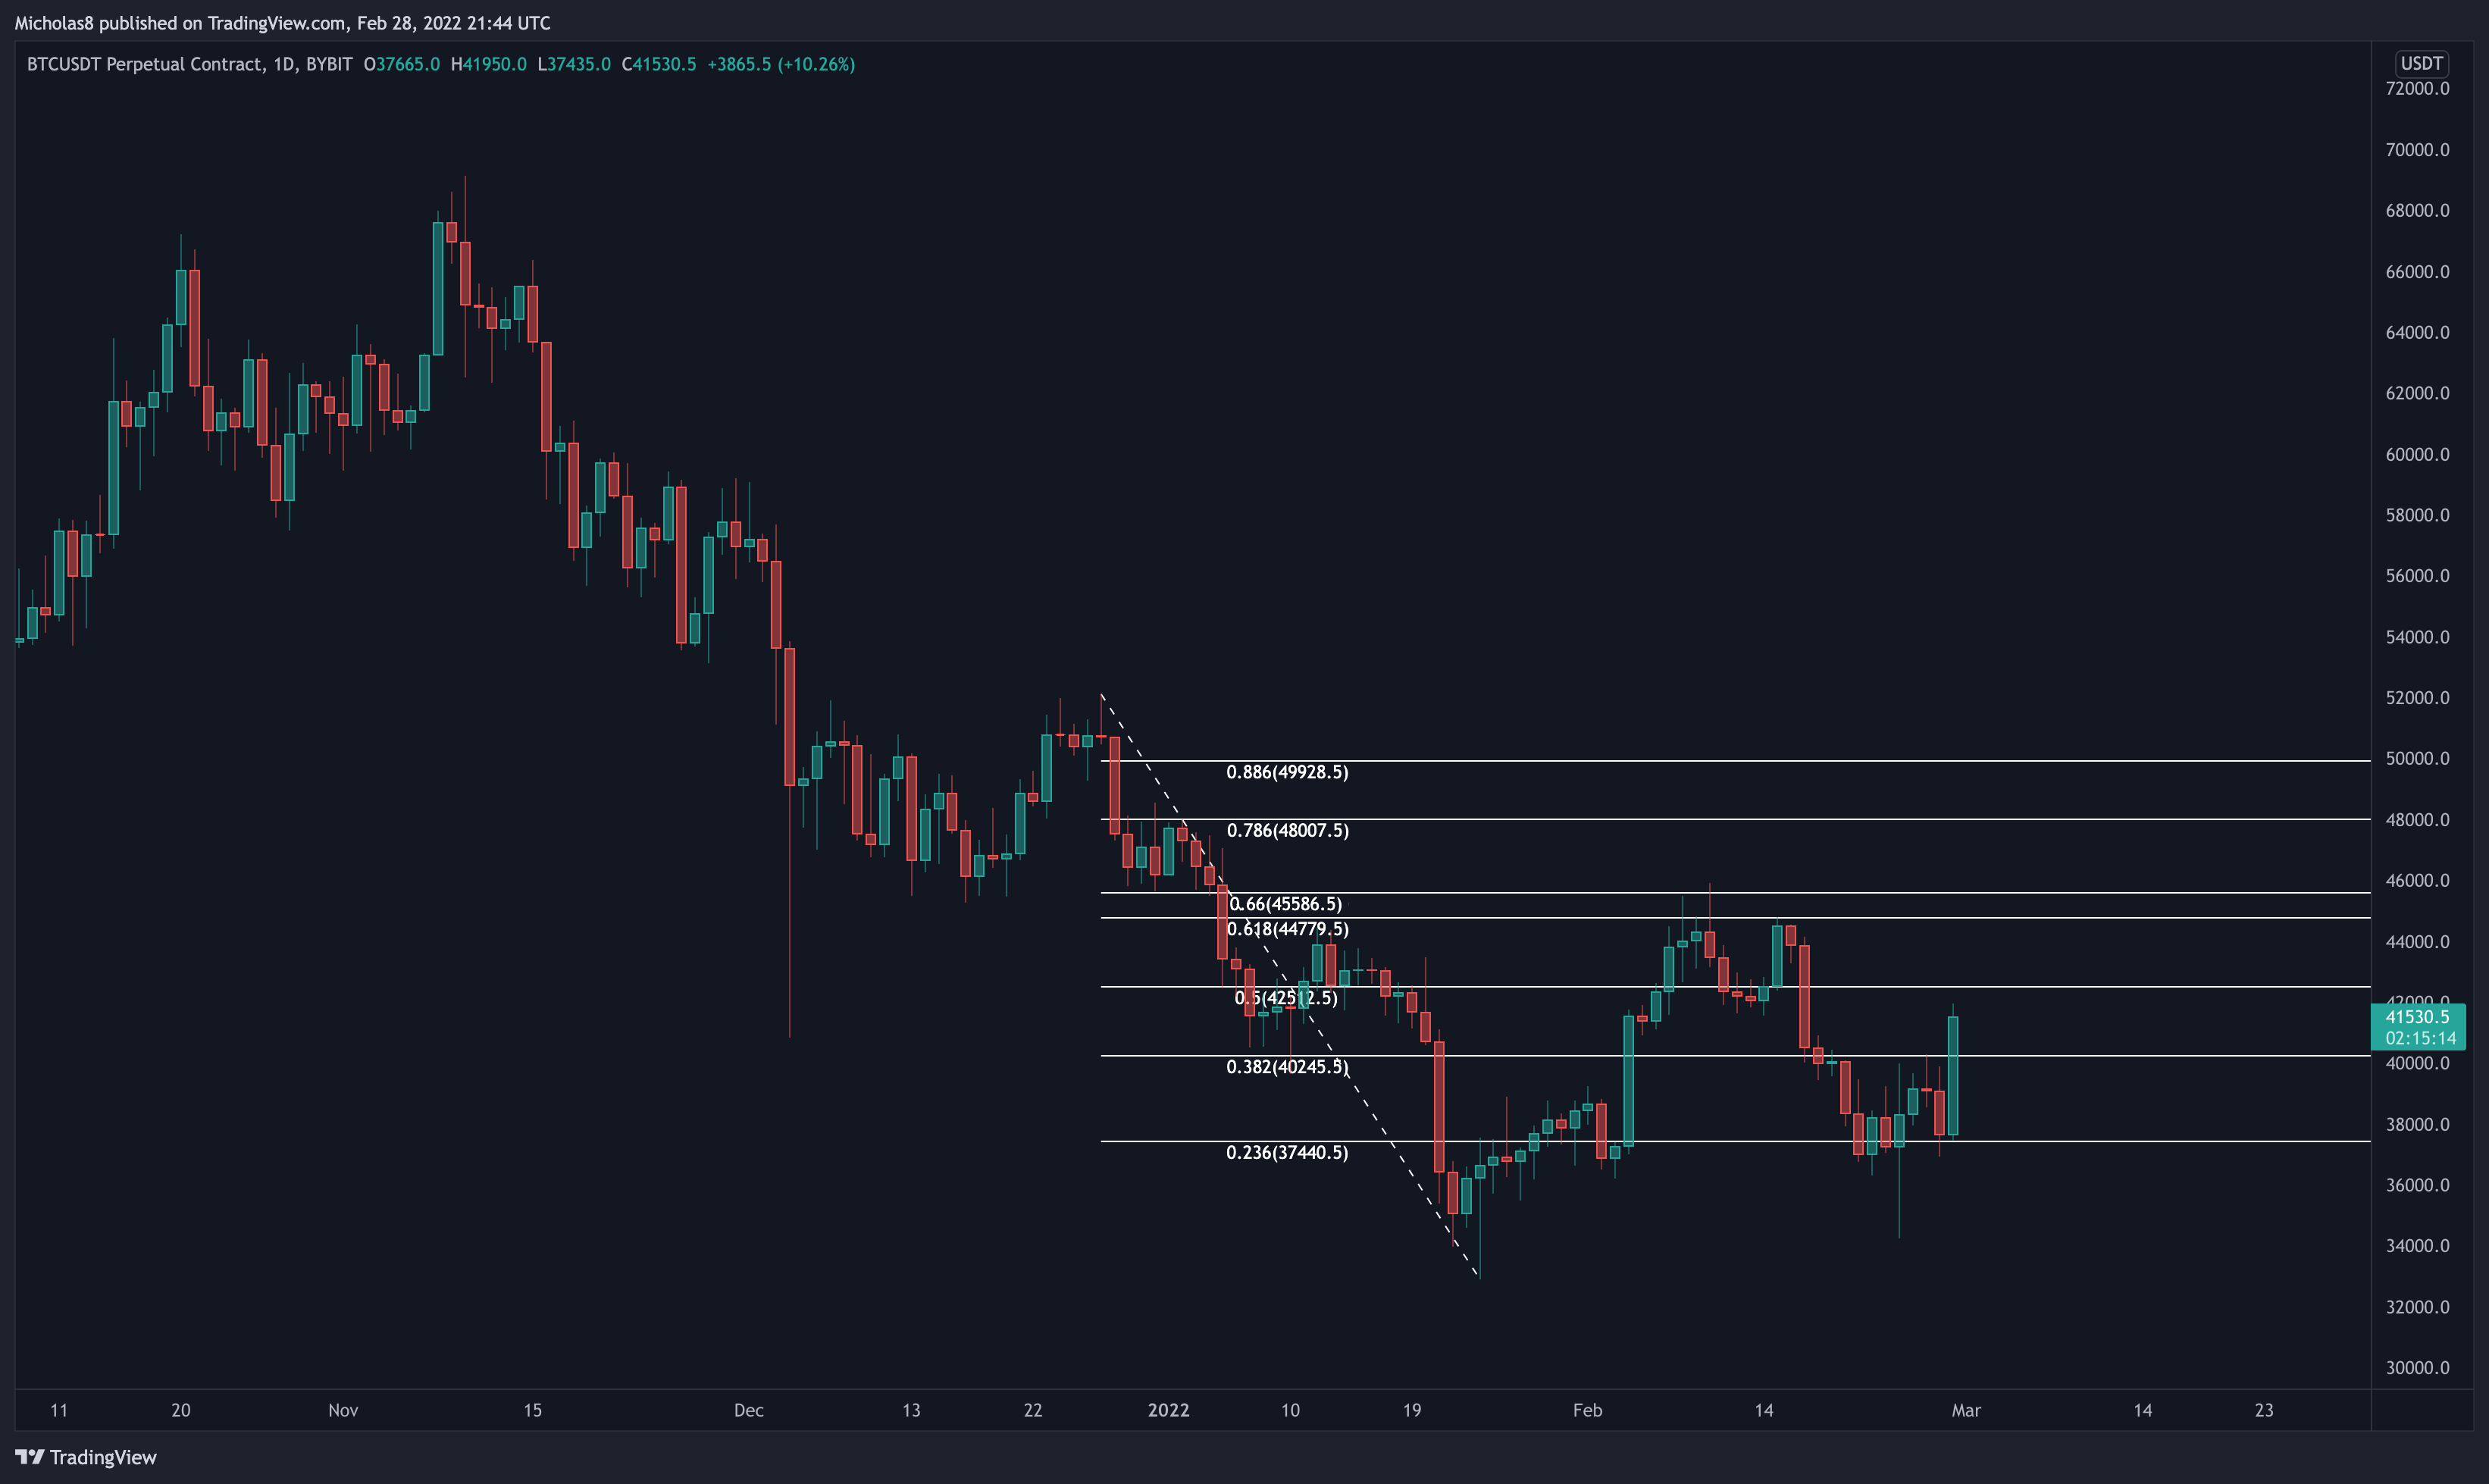
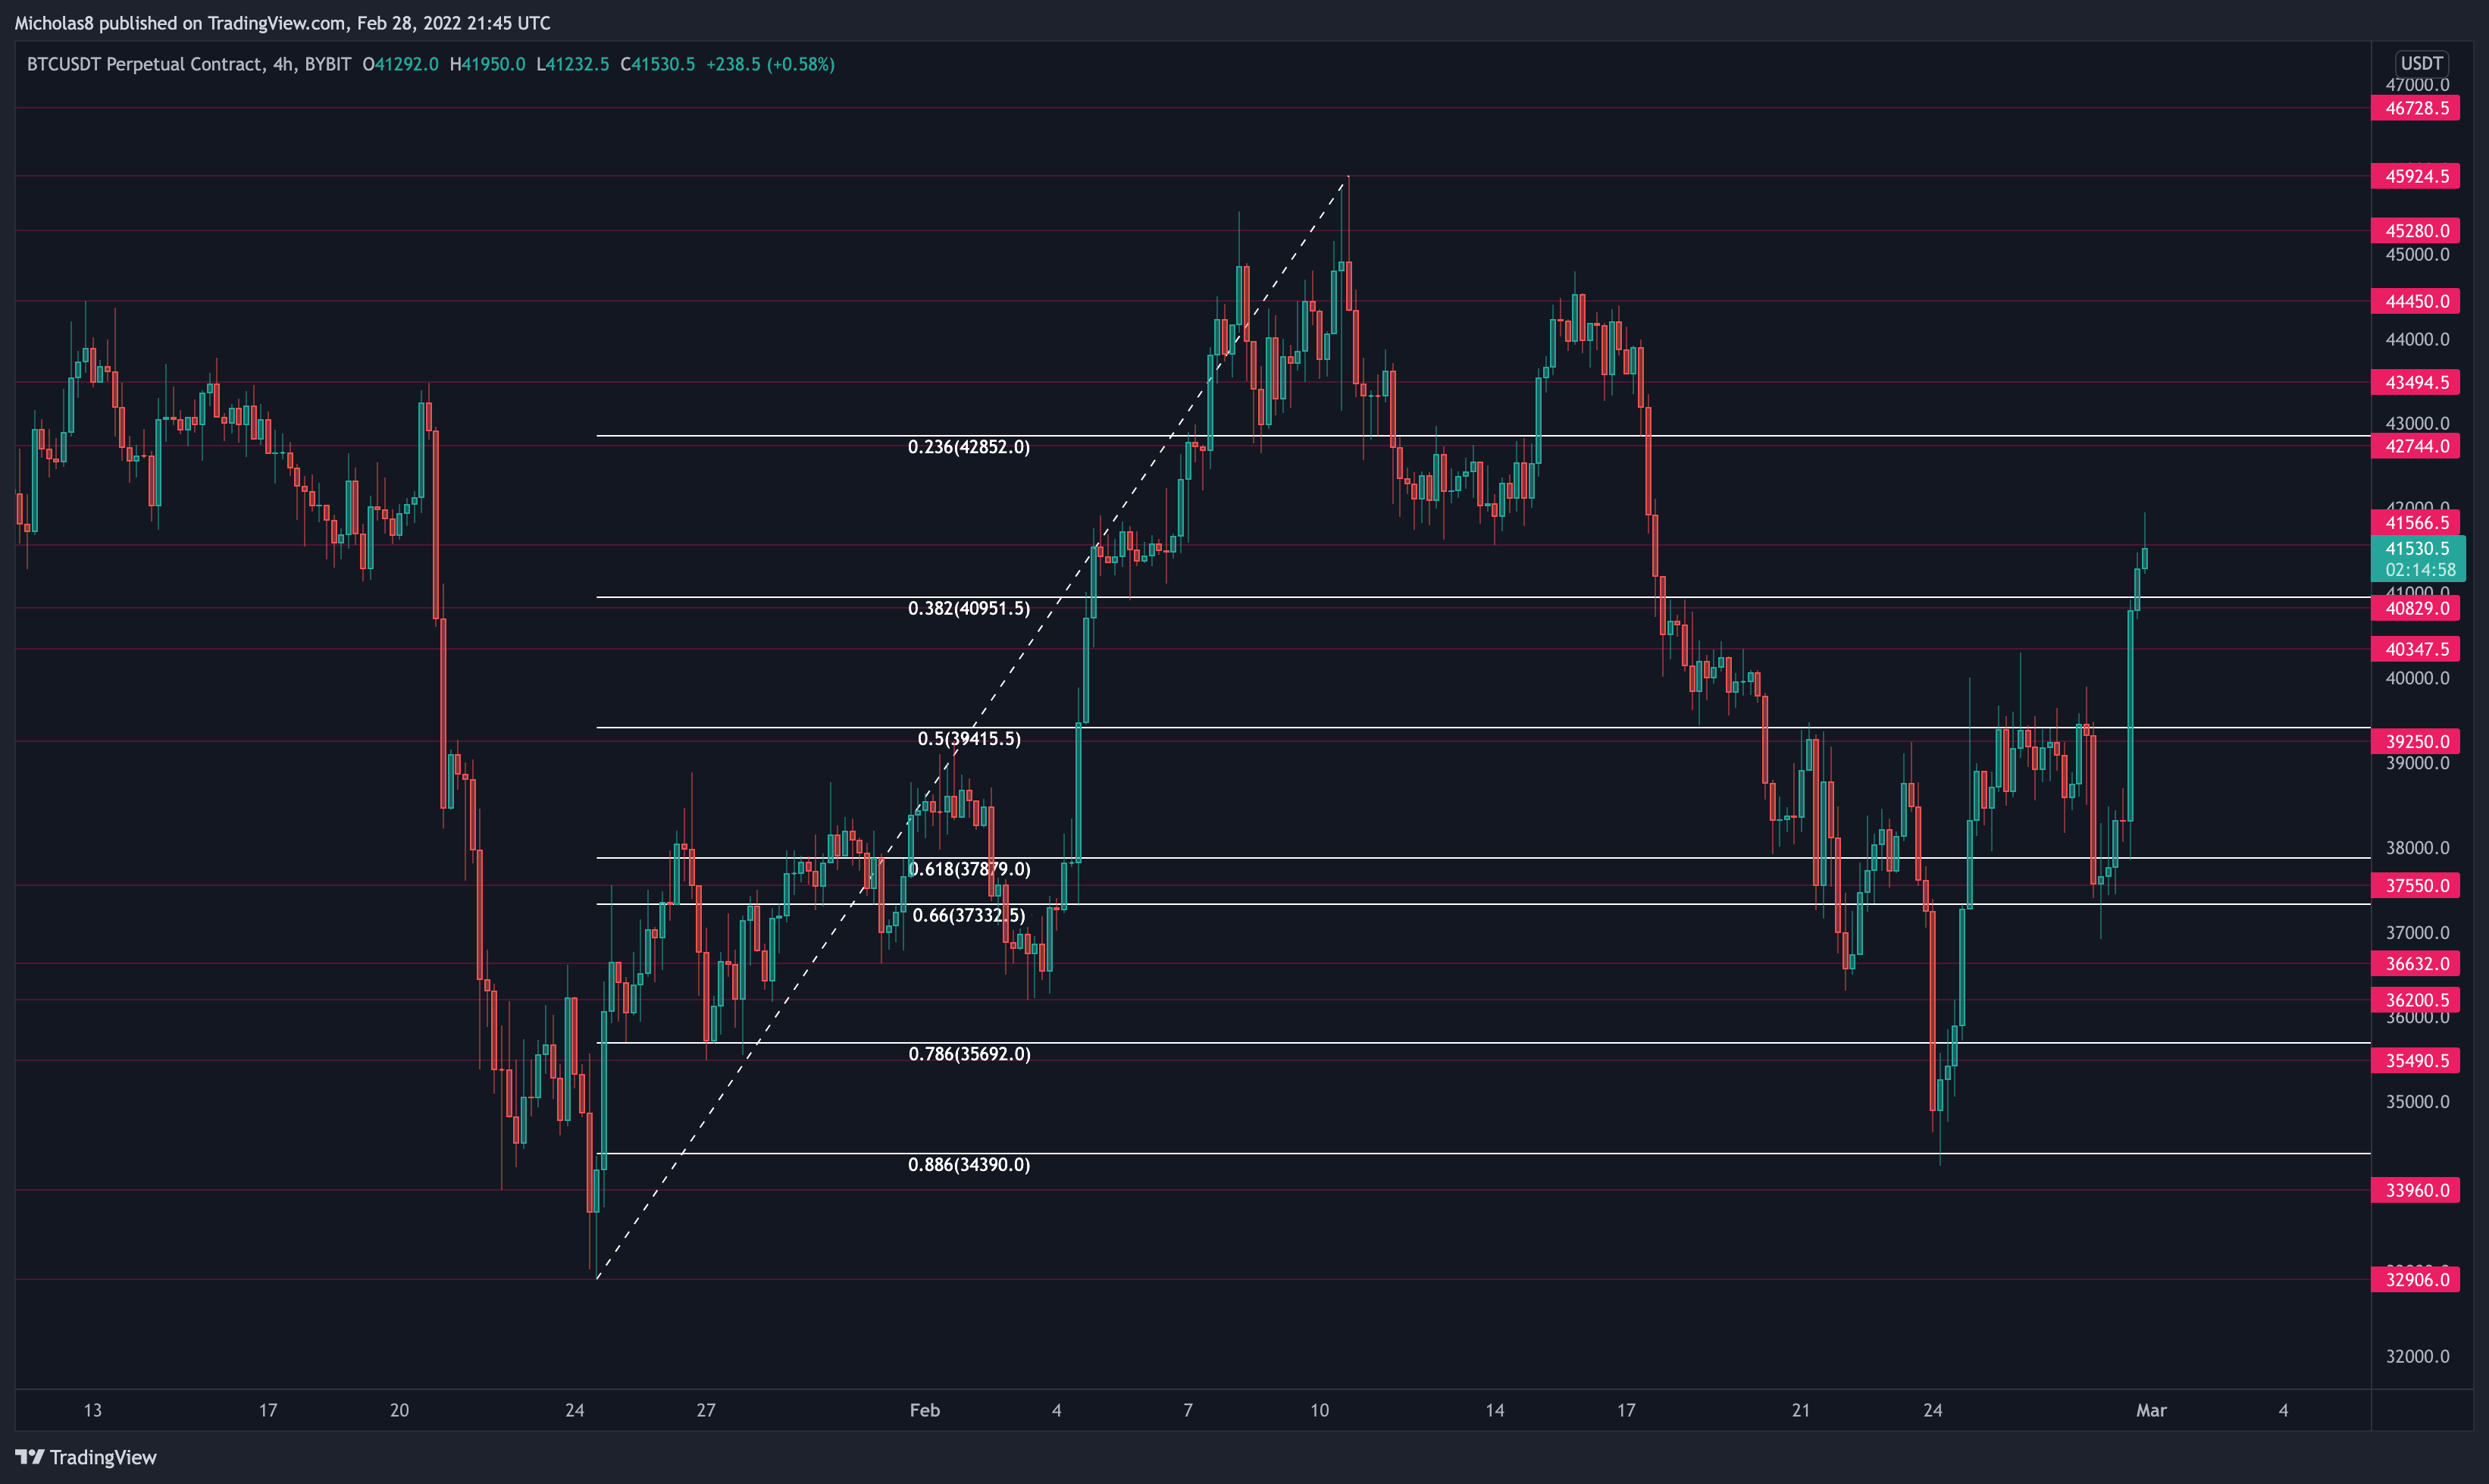
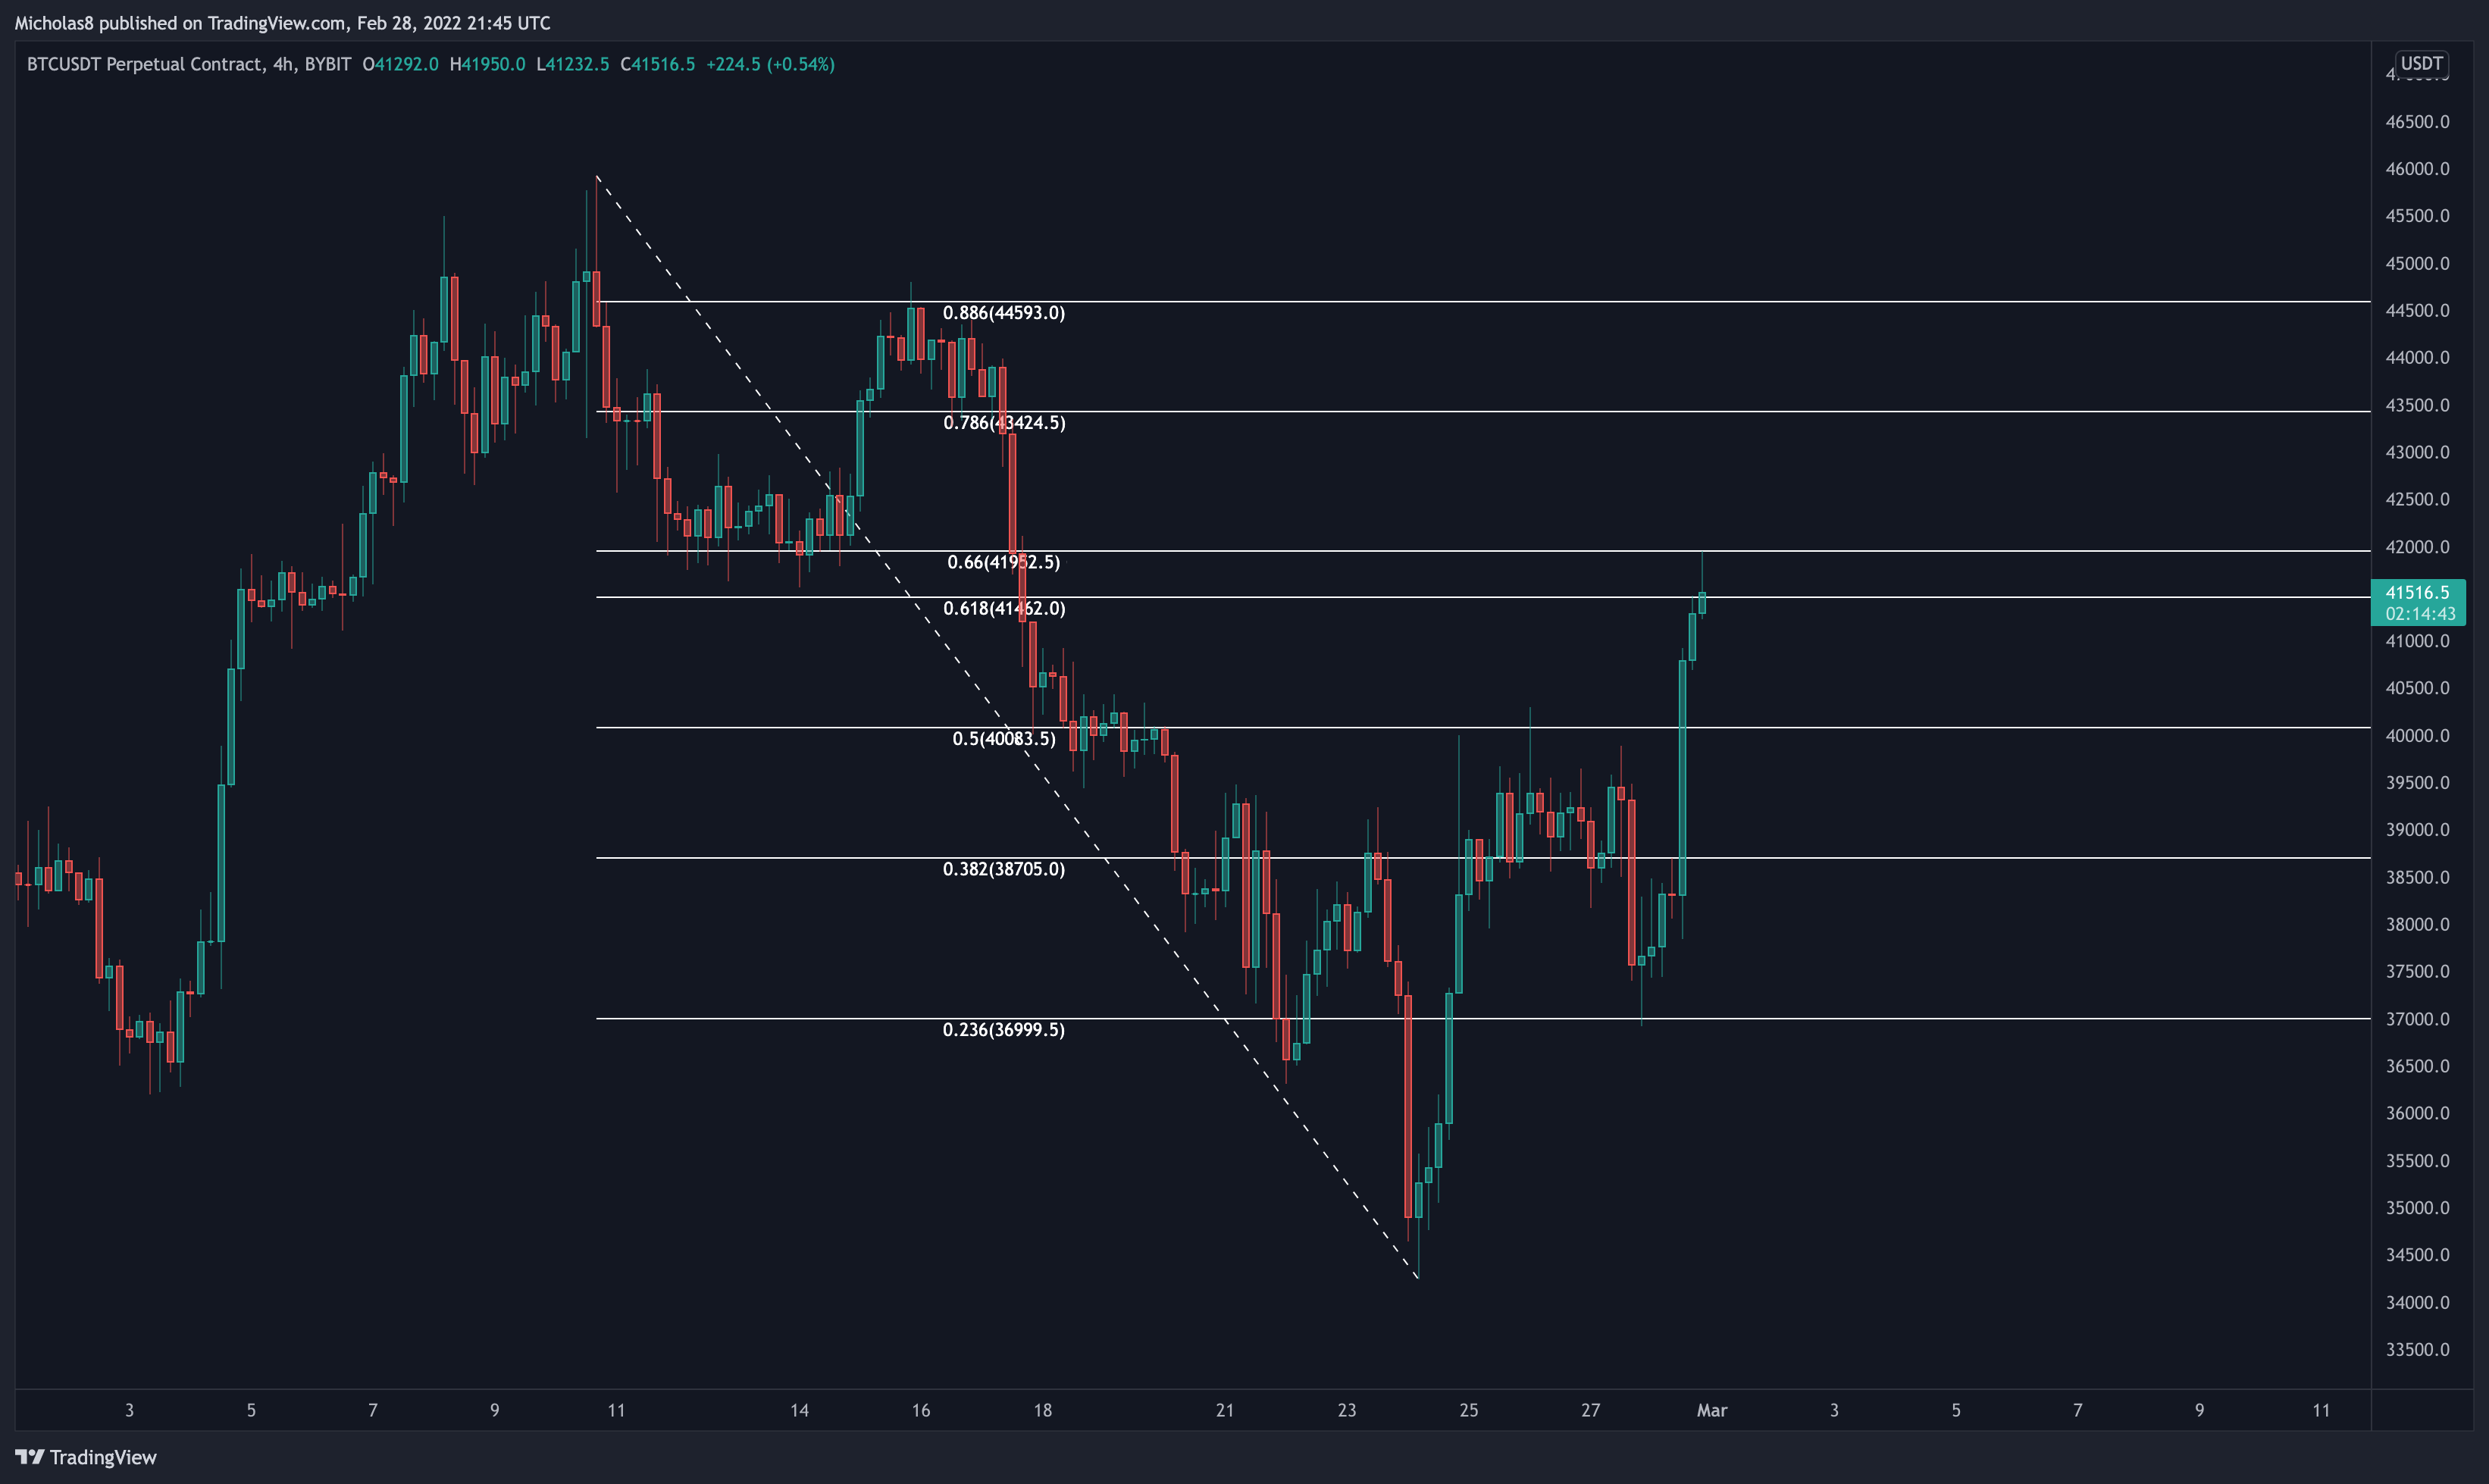
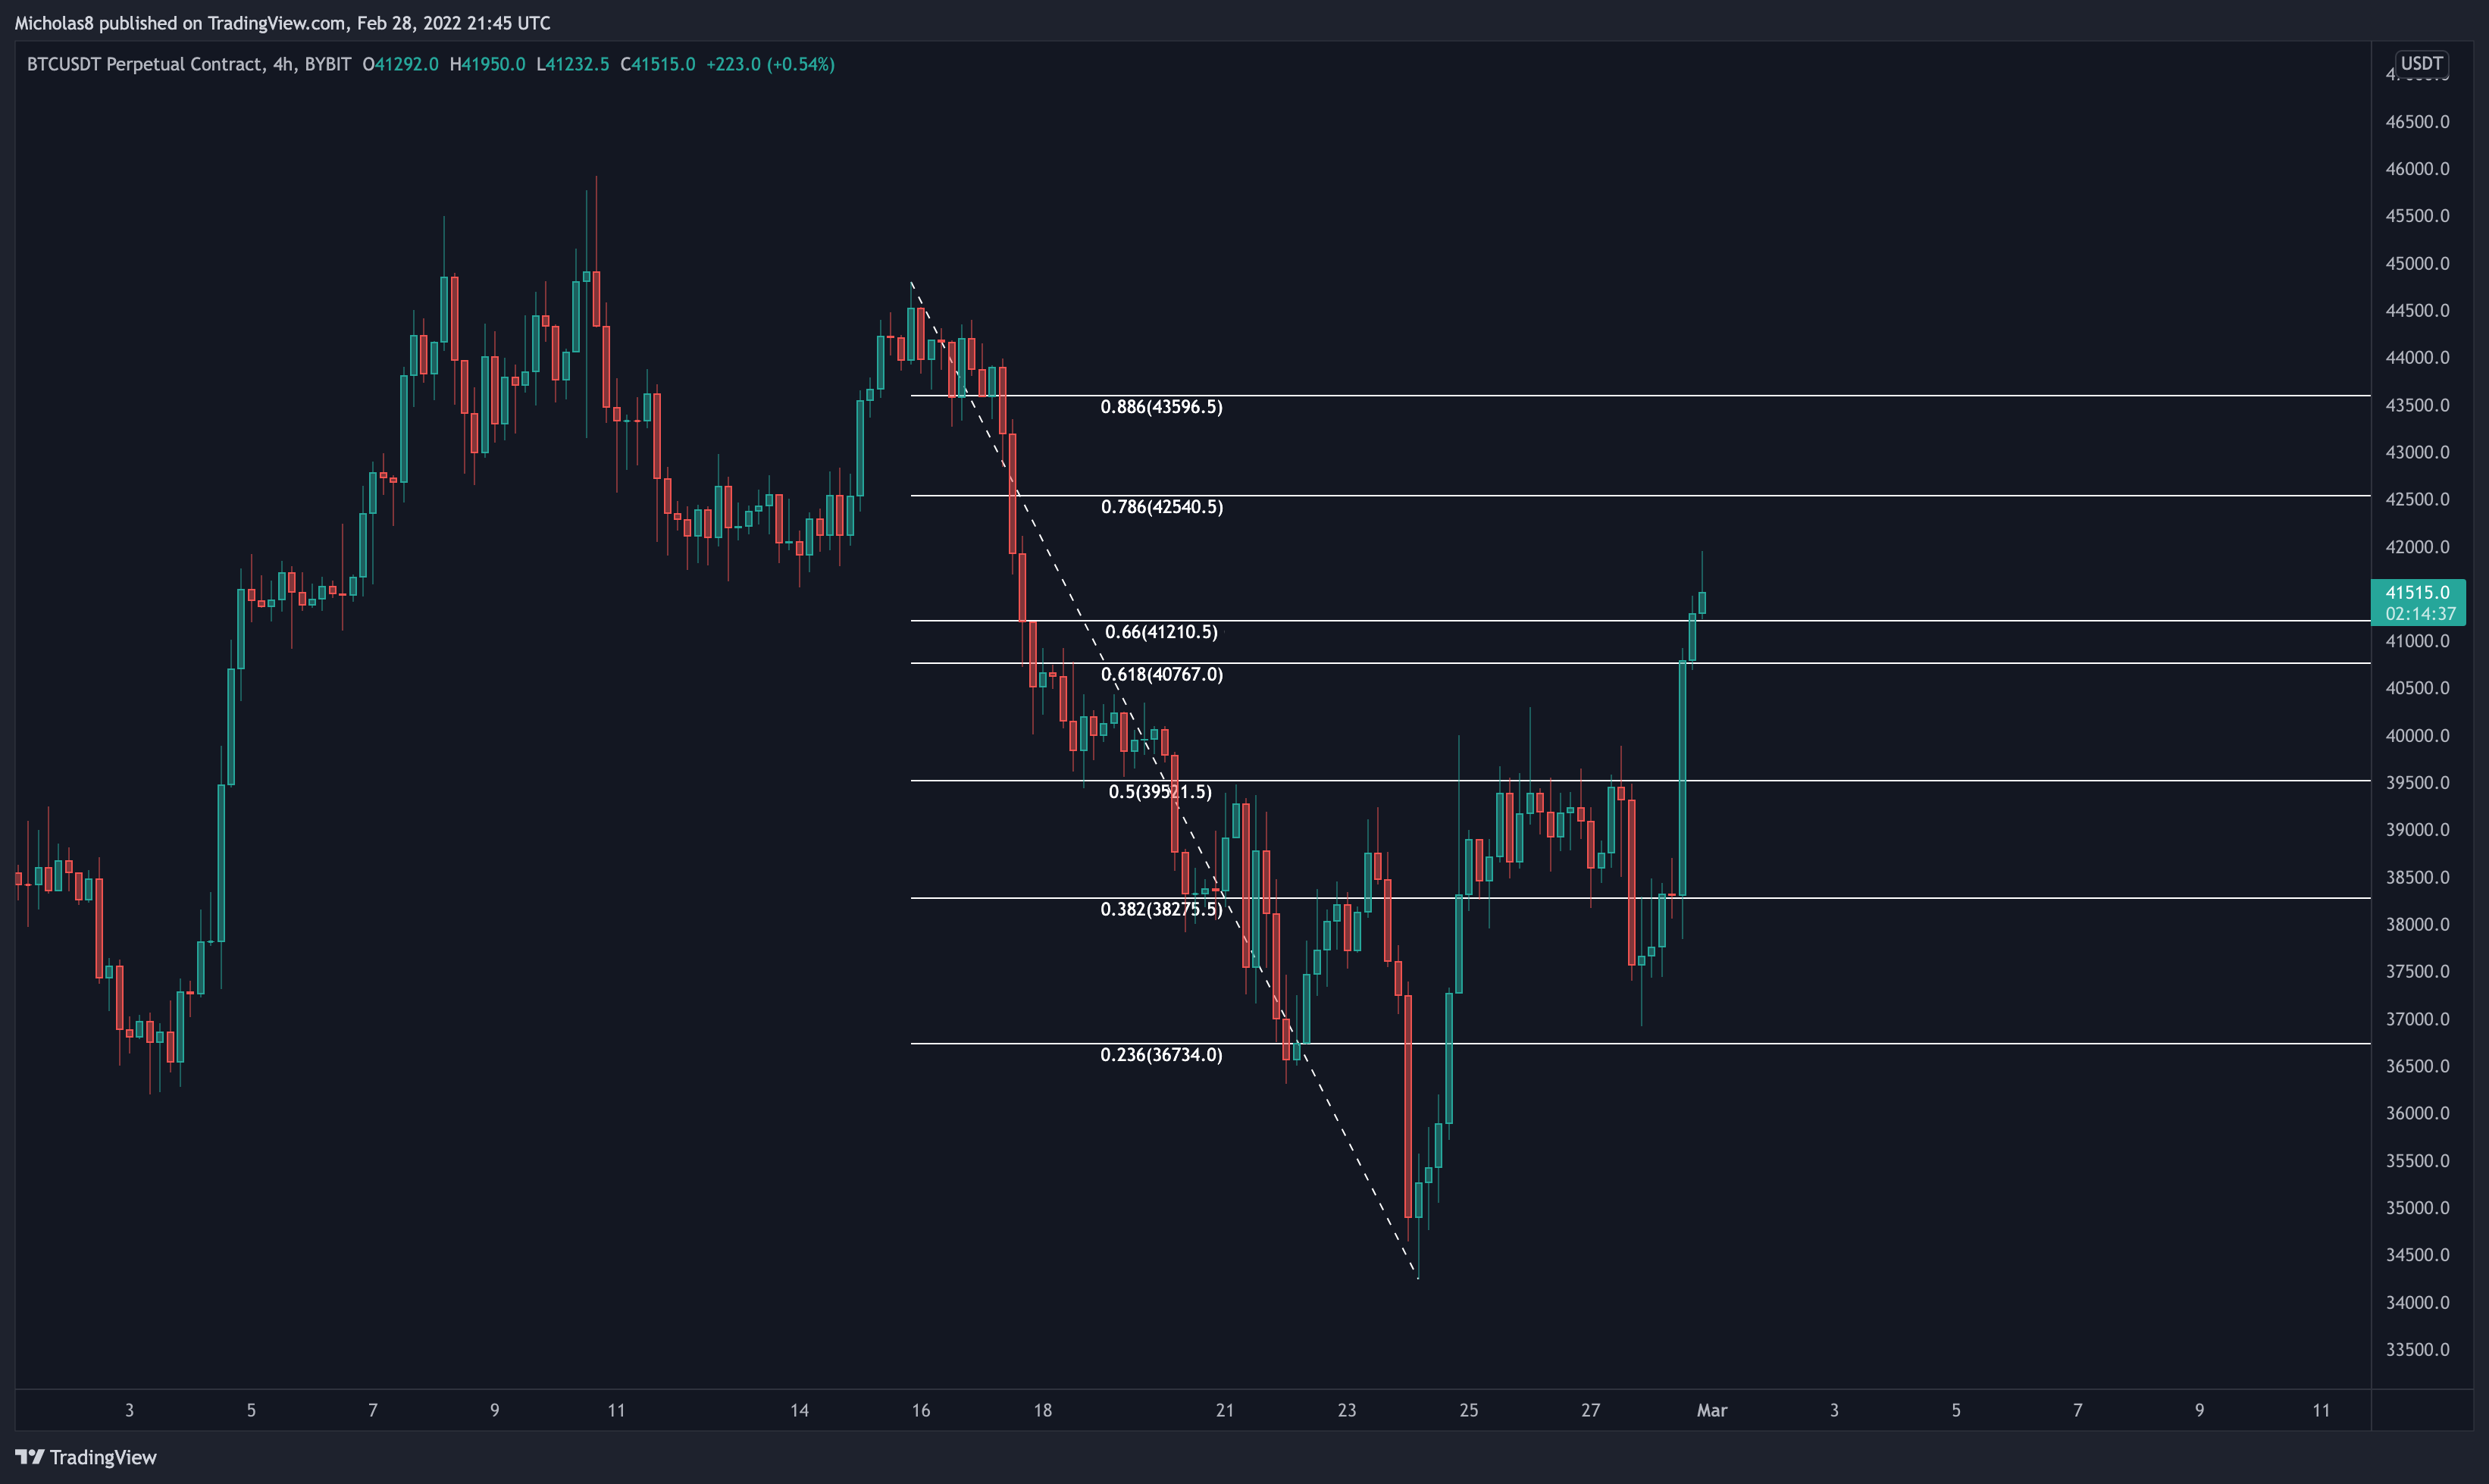
If we continue to see upside PA, these are the two Golden Pockets that I have my eye on here – from where I will be looking to potentially enter short positions/TP from my longs. And if we do continue up, I will also be looking for potential long entries on the LTFs to ride the wave up.
All in all, Bitcoin still does remain in a bearish position on a macro level for a multitude of reasons. However, there is a lot of strength with this move, and we may be in store for continued upside PA this week.
_
TONIGHT
The Good
1D/1W Hidden Bullish Divergence
CME Gaps at 39,935 and 53,665
Bullish NVT
_
The Bad
Lost the 1H/4H/1D/1W EMA Ribbons
Lost the Bull Market Support Band
Lost the 20/50/100/200-week SMAs
1H/4H/1D Hidden Bearish Divergence
1W/1M Bearish Divergence
Bearish Market Structure (1D timeframe)
Trading below the 8/21/50/200-day EMAs
Trading below the 20/50/200 4H SMAs
Trading below the Daily LQZ 1
Resistance from the Bitcoin Logarithmic Curve Median Line
20/50-day SMA Death Cross
20/100-day SMA Death Cross
50/100-day SMA Death Cross
20/200-day SMA Death Cross
50/200-day EMA Death Cross
50/200-day SMA Death Cross
100/200-day SMA Death Cross
_
TONIGHT
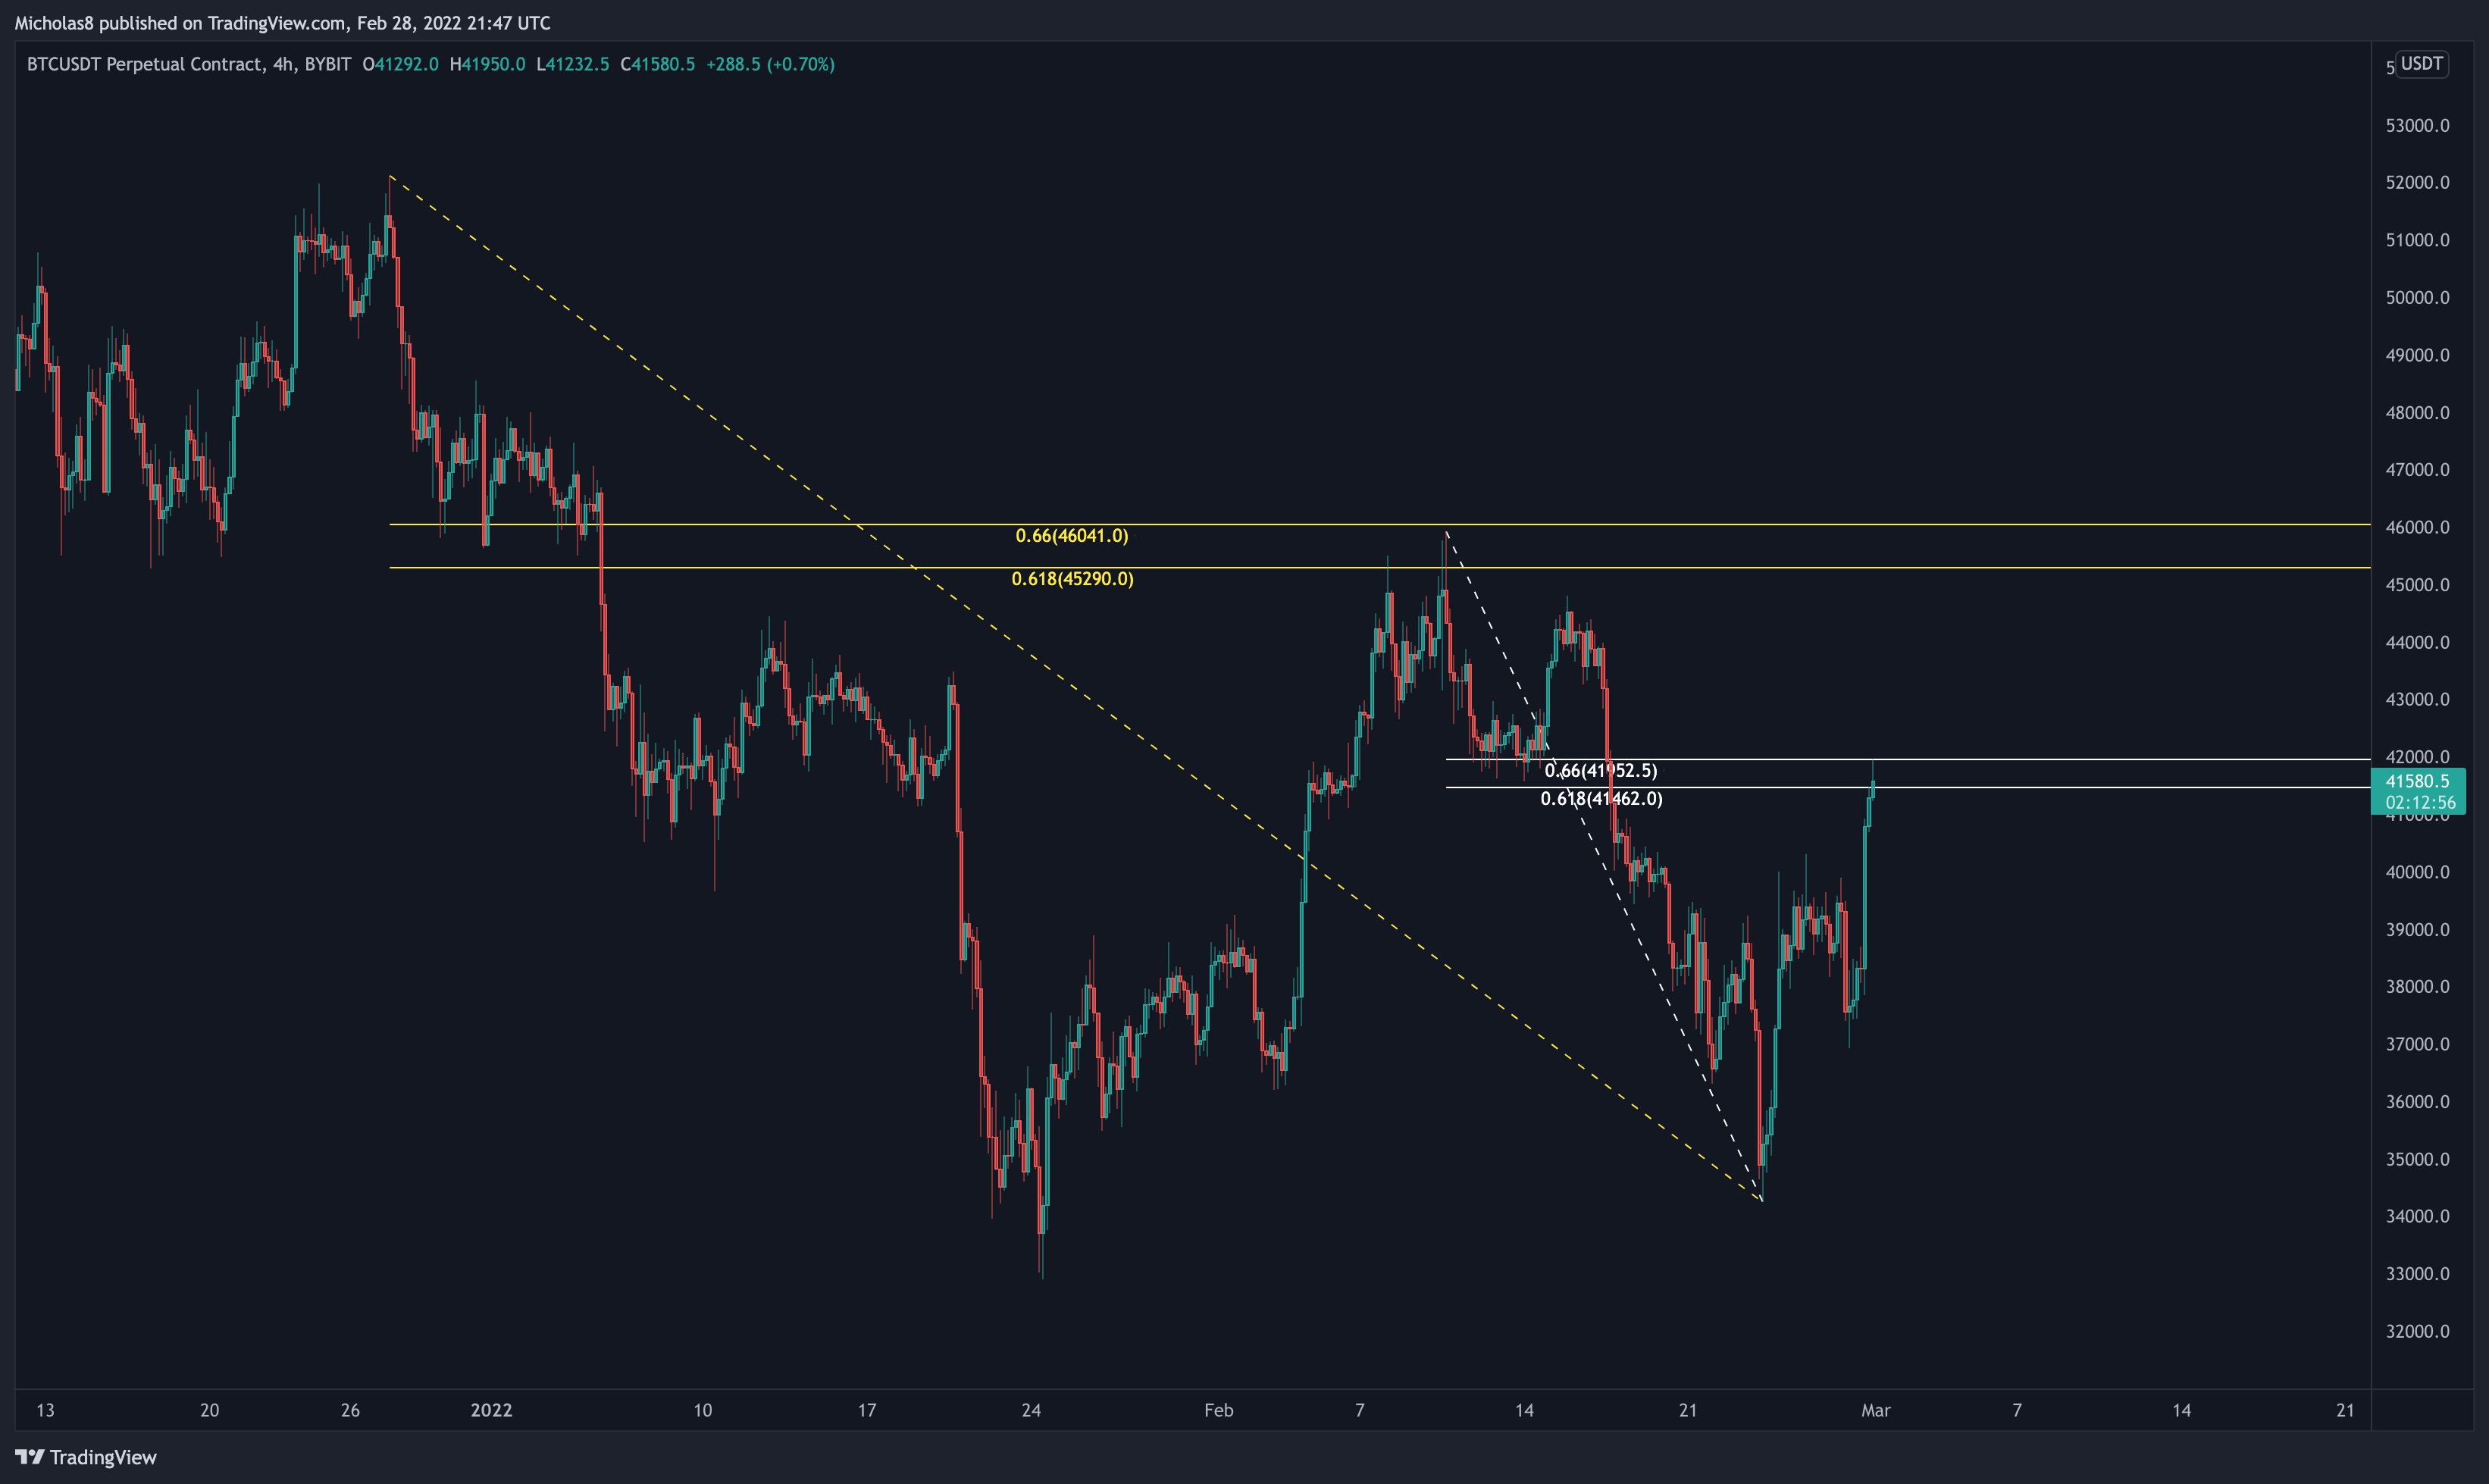
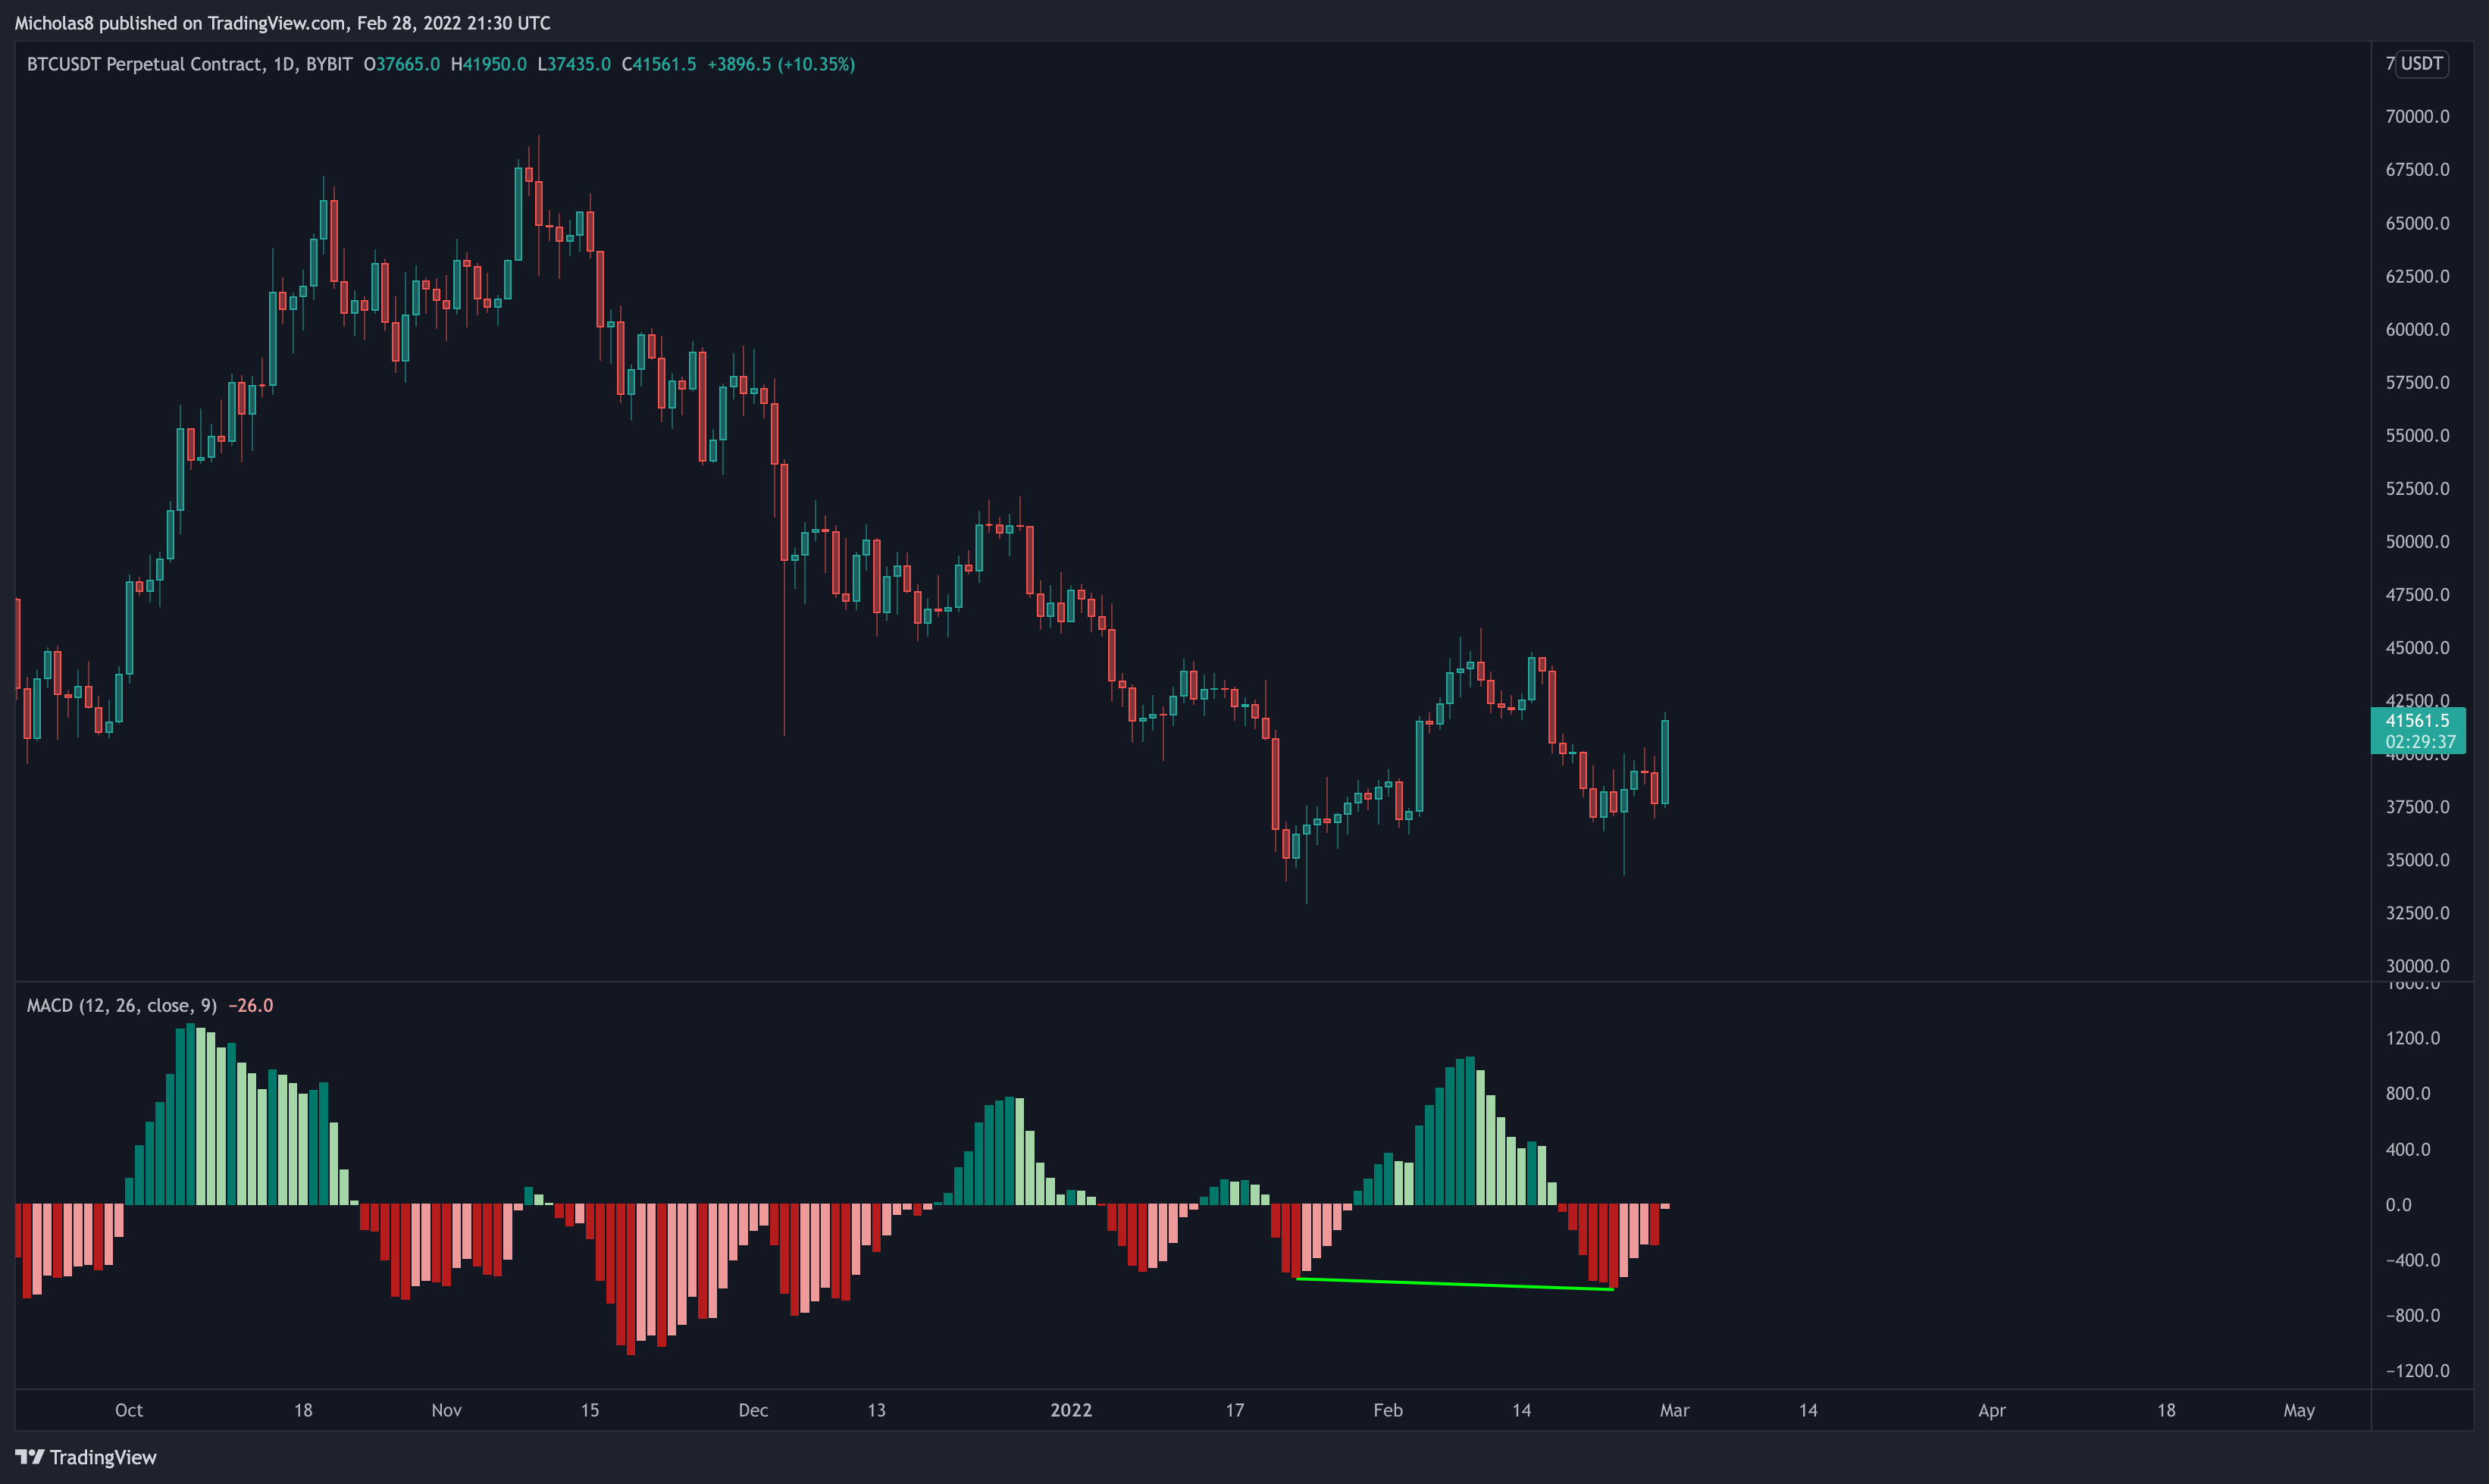
As discussed earlier today, we were looking for resistance at the white Golden Pocket, and currently, that's what we're seeing.
We are starting to form bearish divergences on the MTFs/LTFs, which implies that we're likely to see either bullish consolidation and create a new sideways range, or a move to the downside.
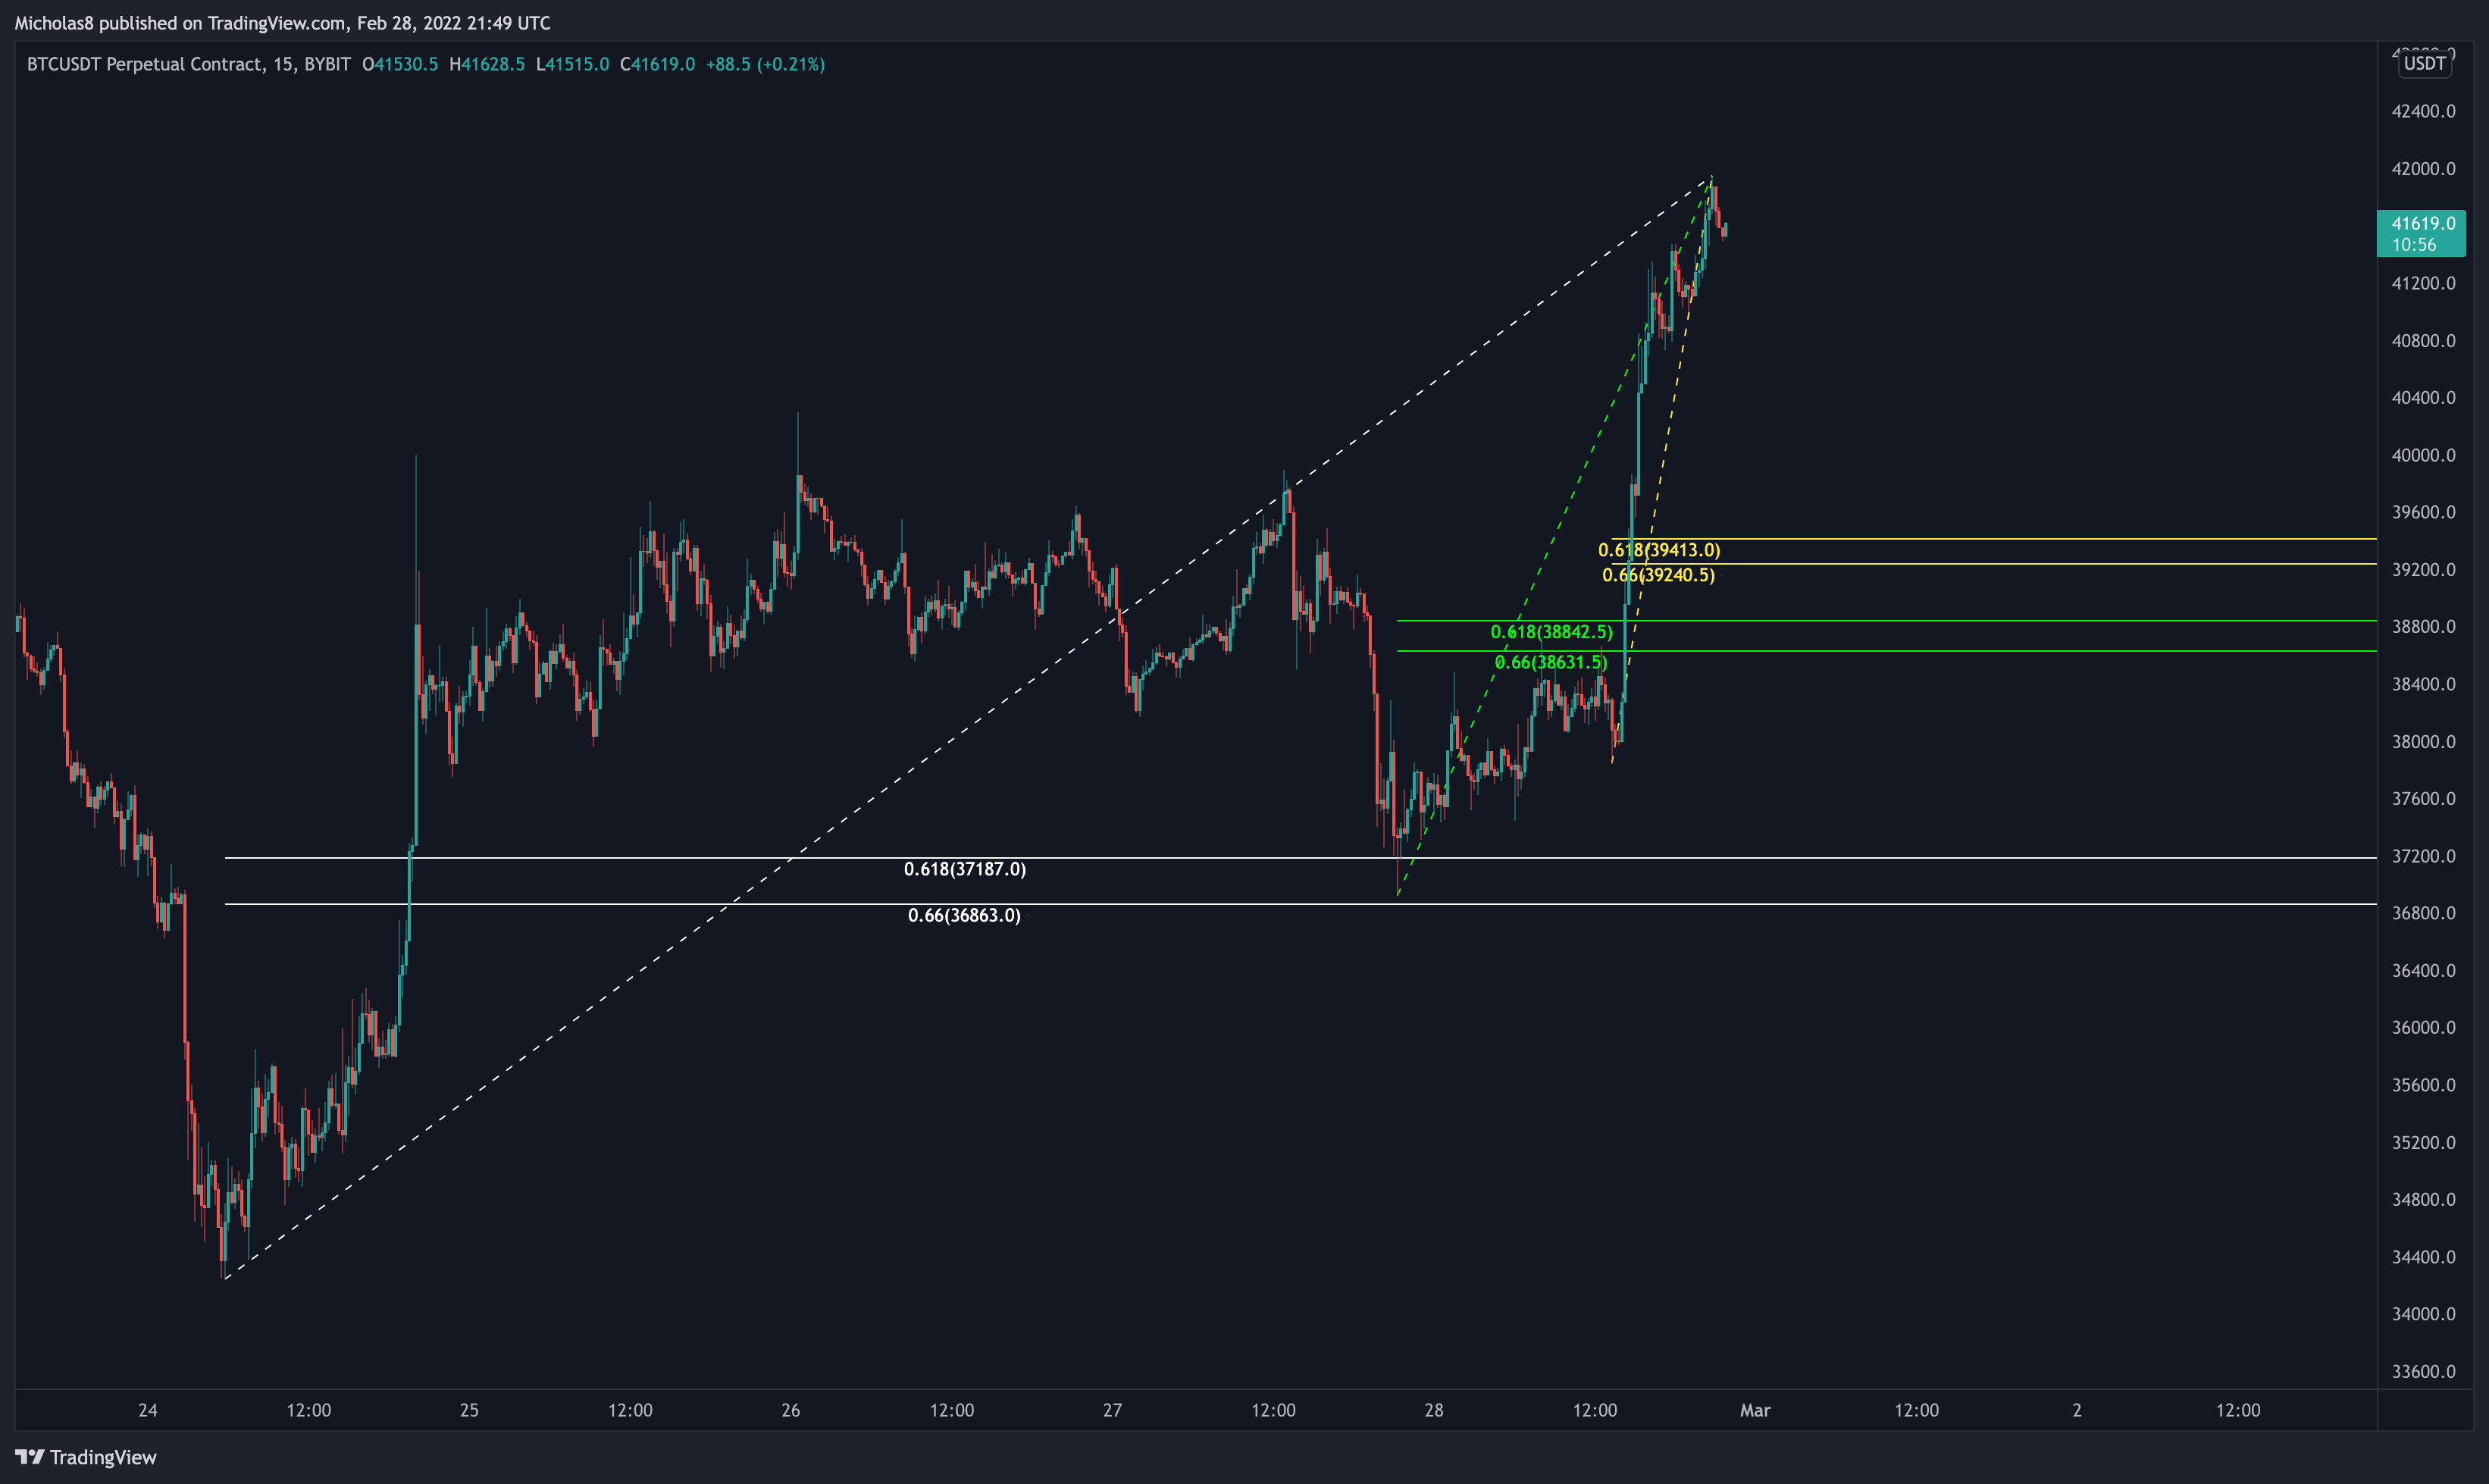
If we do see that move to the downside, these are the Golden Pockets that we can keep an eye out for.
All in all, Bitcoin still does remain in a bearish position on a macro level for a multitude of reasons. But on a medium-term level, we may be in store for some more upside and/or bullish consolidation at the highs.
Thank you for your continued support, and I hope you have a great start to your week!
Cheers!