

About Systematic Trade-Invest
outperforming/ optimizing returns/ managing downside risk
_________
TRADING MODELS - (05/01/25 - 09/09/26):
--Basic Trader x1: +51.47 % vs SPY: +41.93 %
--Alpha Trader x2: +165.19 % vs SPY: +41.93 %
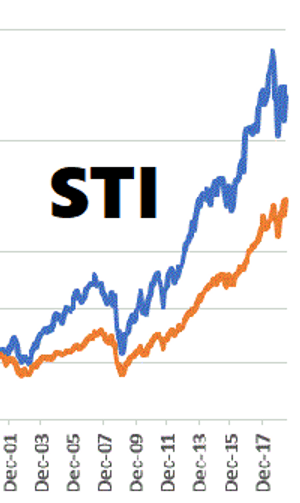
*Above: Performance comparison of STI trading models vs. the S&P 500 ETF (SPY), based on actual % returns in M1 Finance portfolios tracking real-world results.
_________
ELITE INVESTOR PORTFOLIO (EIP) - (02/26/24 - 06/25/26):
--Stock A: +882.58 % (buy date: 06/25/25)
--Stock B: +707.16 % (buy date: 09/04/25)
--Stock C: +200.22 % (buy date: 09/18/24)
--Stock D: +167.06 % (buy date: 04/02/26)
--Stock E: +152.72 % (buy date: 02/26/24)
--Stock F: +127.45 % (buy date: 04/10/26)
--Stock G: +86.14 % (buy date: 04/16/26)
--Stock H: +68.08 % (buy date: 04/30/26)
--Stock I: +59.47 % (buy date: 02/13/26)
--Stock J: -0.74 % (buy date: 05/26/26)
--Stock K: -7.56 % (buy date: 05/01/26)
*Above: Performance data for EIP represents actual % returns of open positions (currently 11) held in the Fidelity account used to track real-world results.
**Unlock access to actual stock names and buy/sell signals for EIP holdings by joining the Full Access Trader + Investor membership.
_______________________________________
INTRODUCTION
Systematic Trade-Invest (STI) builds systematic, rules-based trading models & investing portfolios designed to outperform the market over time. For each trading model, members have access to corresponding weekly ETF &/or individual stock trade signals, allowing them to follow along in real time during each 1-week holding period. STI uses the S&P 500 Index as its benchmark, with each model's performance measured against the SPDR S&P 500 ETF Trust (SPY).
***
For trading models, get started here:
==> Start Guide
==> Performance
==> FAQs
***
For Elite Investor Portfolio (EIP), get started here:
==> Introduction
***
Recent supporters