
 You will find the content below in this order:
1. Definitions
2. The Good
3. The Bad
4. Key Levels
5. Final Thoughts
DEFINITIONS
Liquidity zones are high volume levels that offer support and resistance
Hidden bearish divergence: creating a lower high in price, with a higher high on the oscillators. This signals a possible trend continuation down.
Bearish divergence: higher high in price, lower high on the oscillators. This signals a possible trend reversal down.
Hidden bullish divergence: creating a higher low in price, with a lower low on the oscillators. This signals a possible trend continuation up.
Bullish divergence: creating a lower low in price, with a higher low on the oscillators. This signals a possible trend reversal up.
SR flip: turning old resistance into support, and vice-versa.
Fractal: recurring geometric pattern.
Price action (PA): the movement of an asset's price over time.
THE GOOD
4H Timeframe
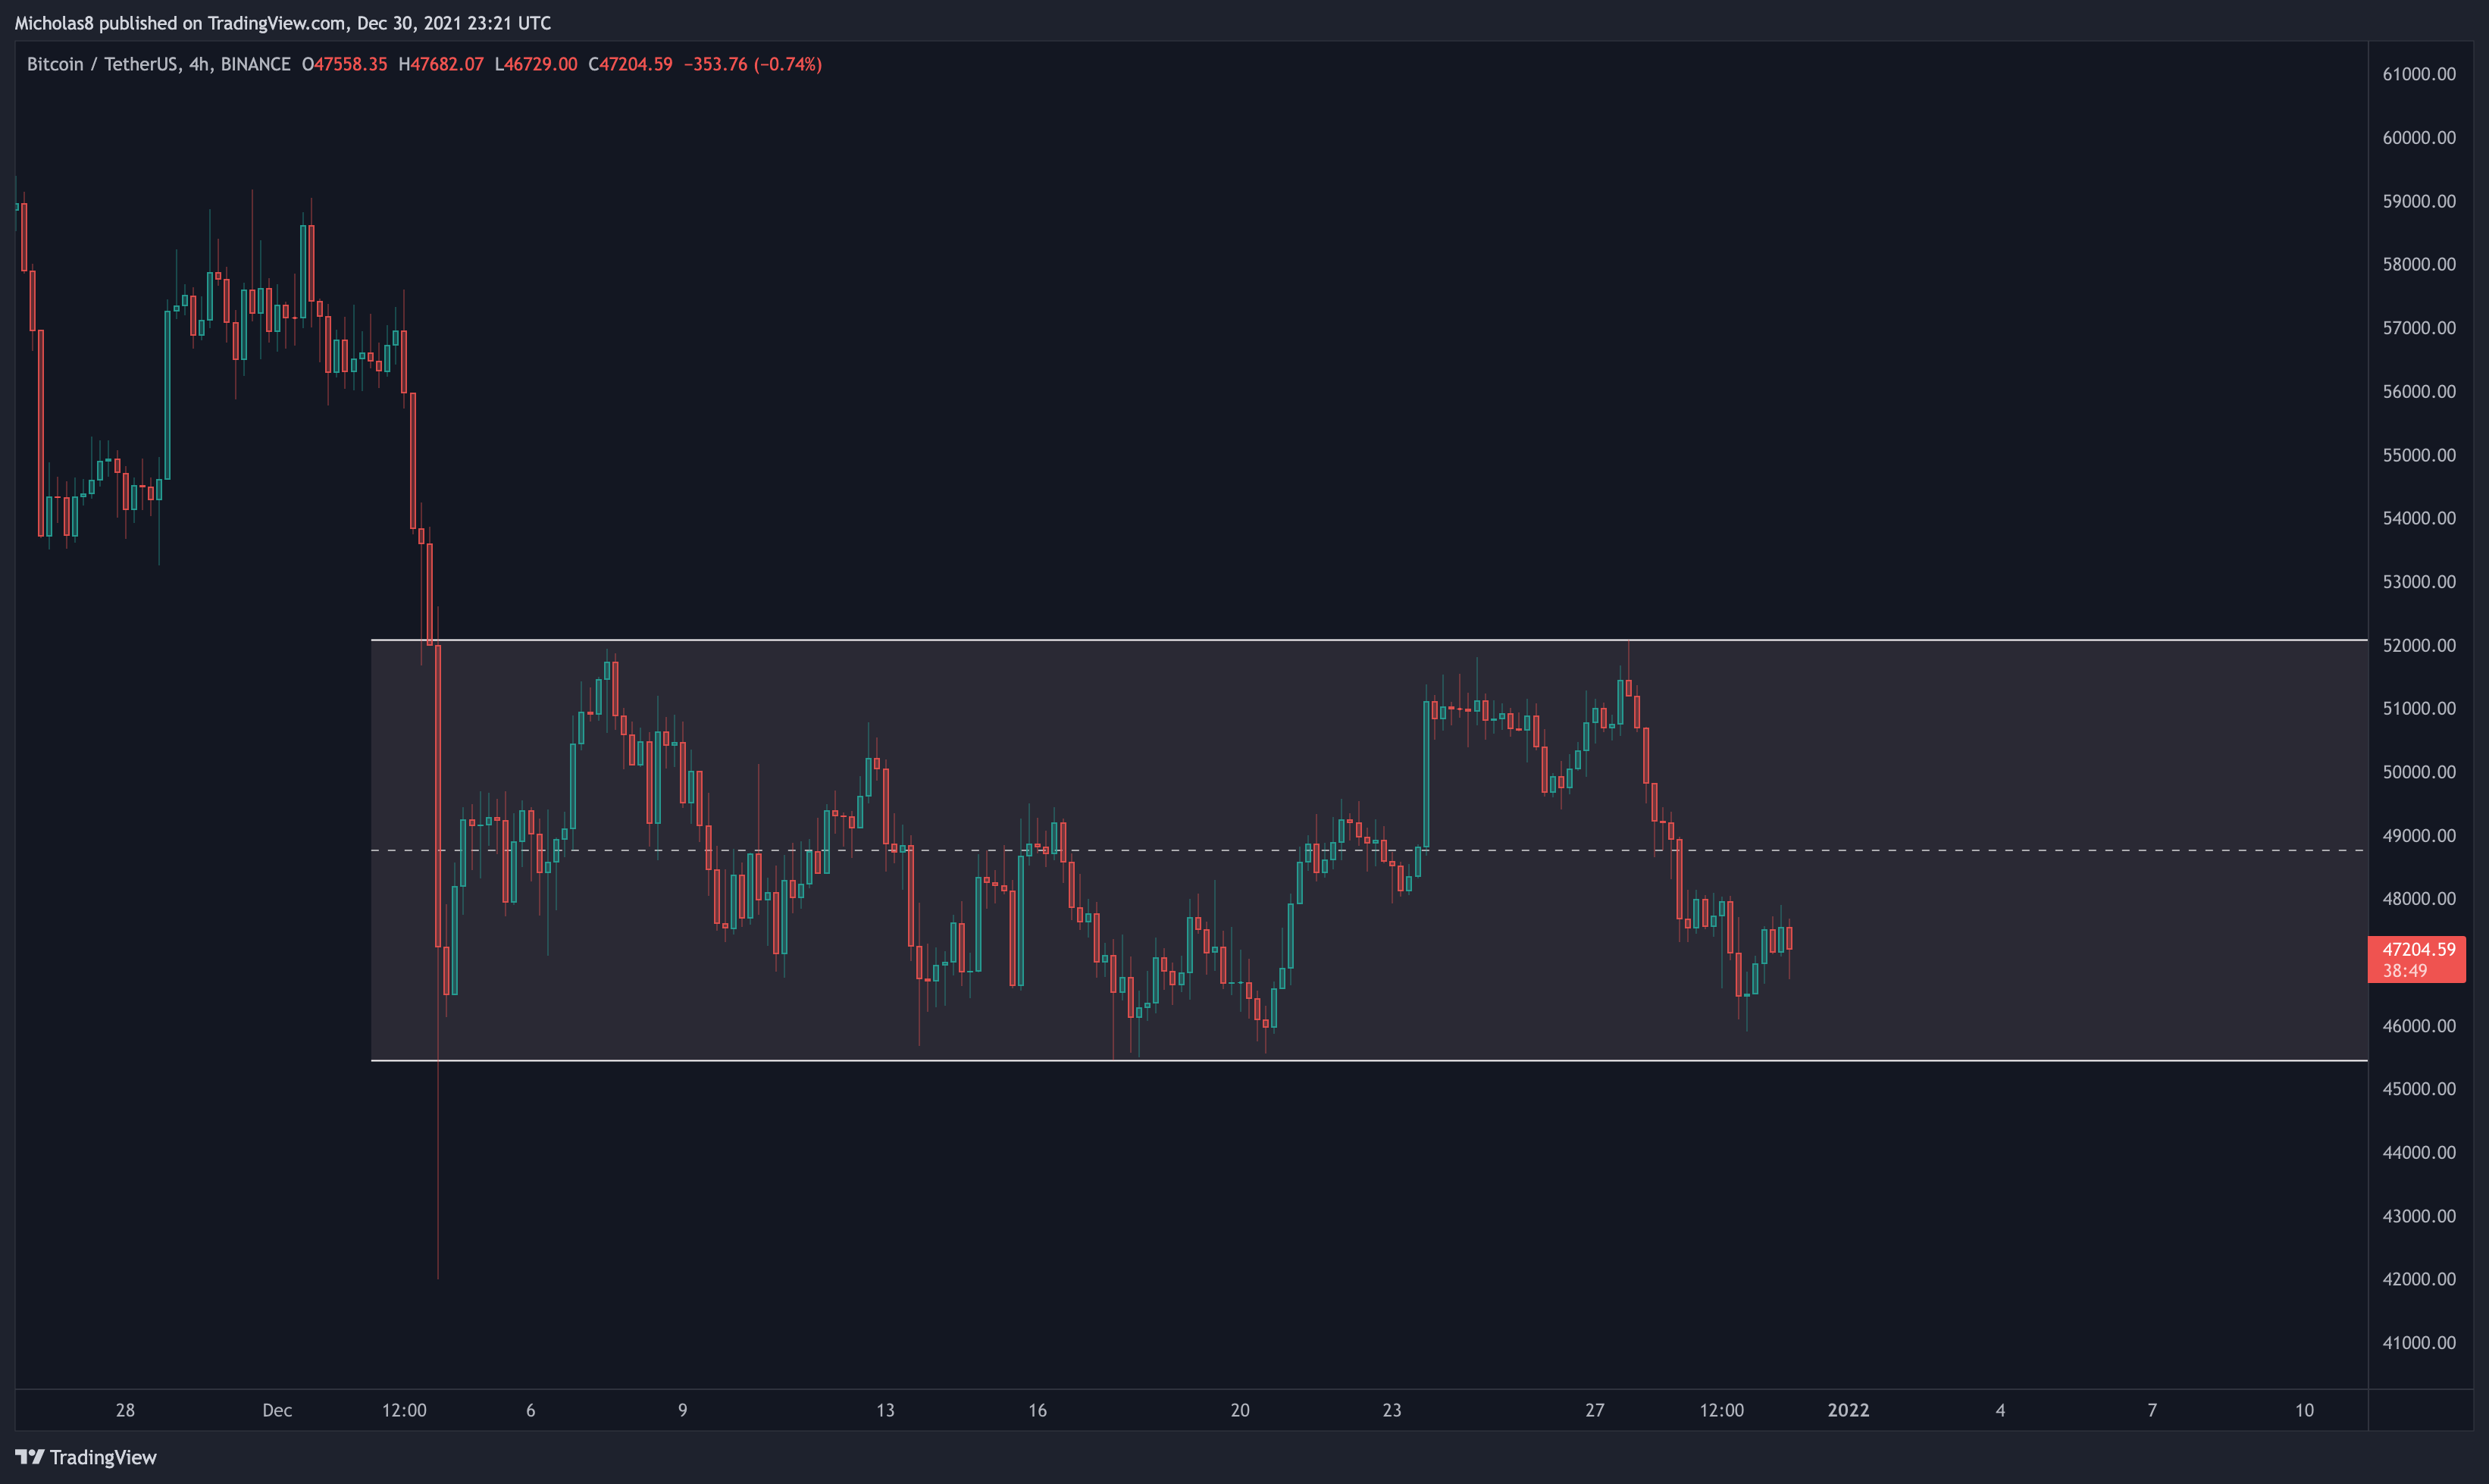
Key Liquidity Zones (LQZ)
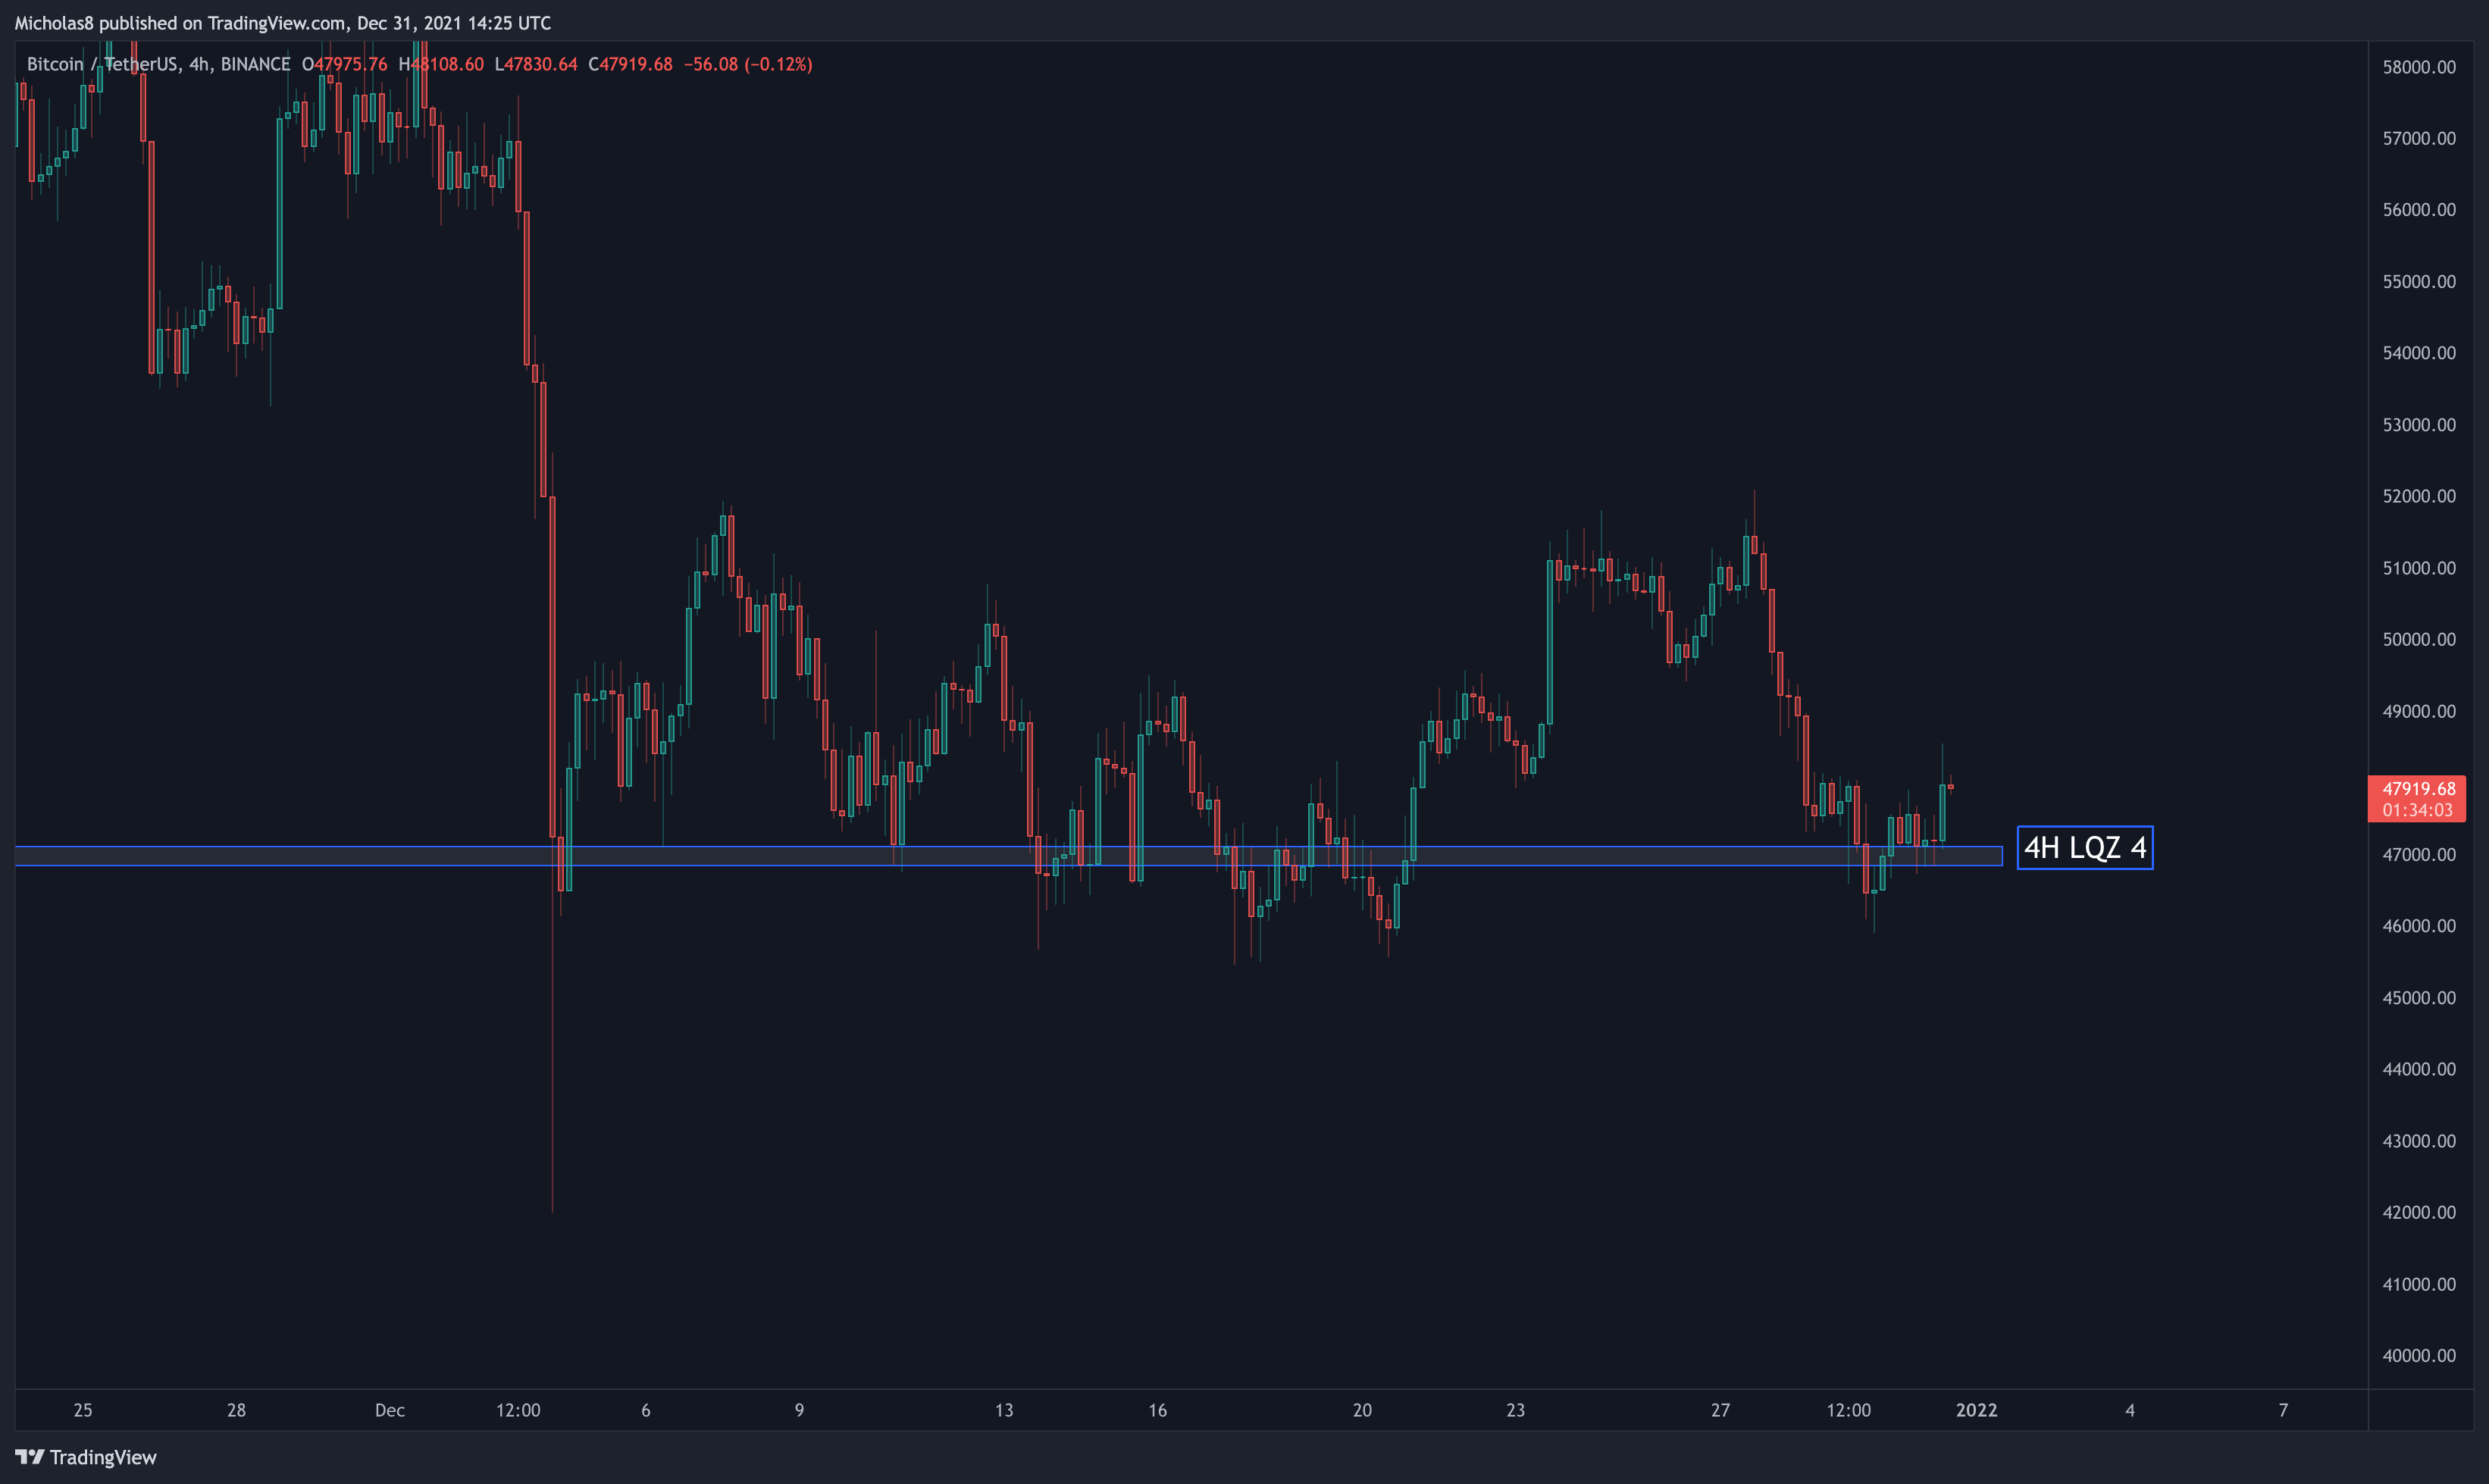
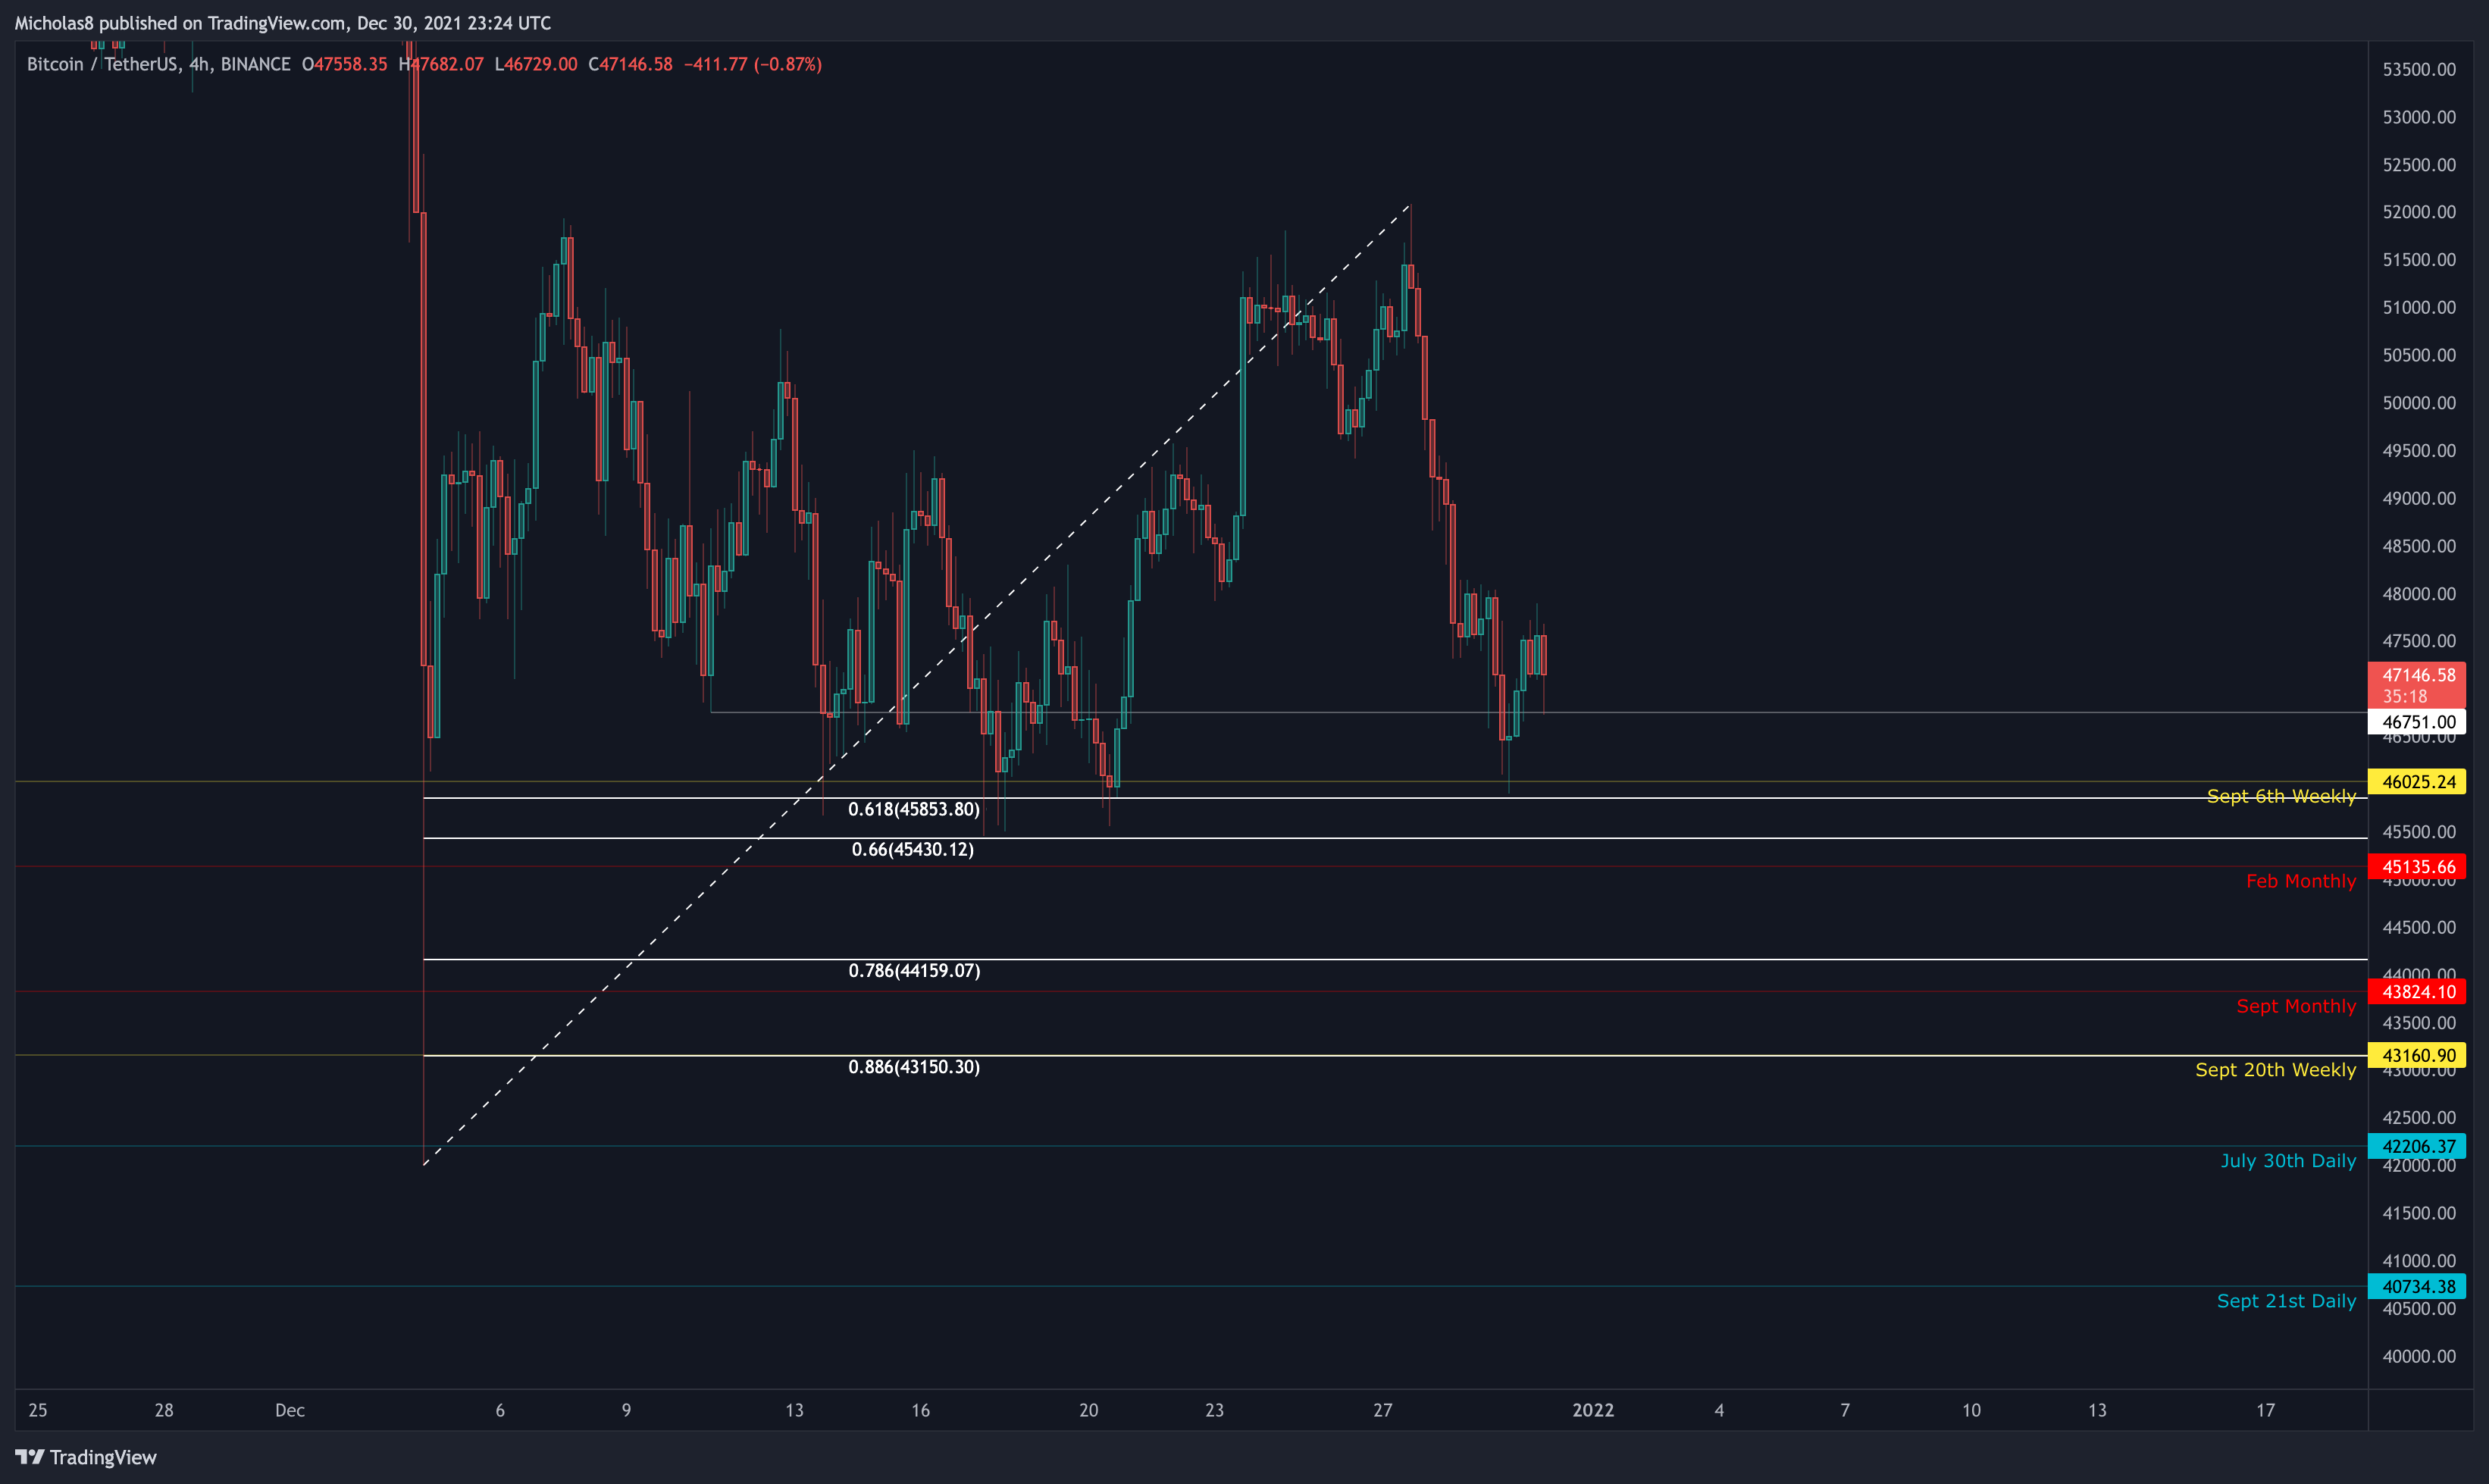
Zone 4: There is a new LQZ sitting at 46.8k - 47.1k.
Implications: There is a bulk of liquidity resting below the current price of Bitcoin. Ideally, this holds as support.
Simple Moving Average (SMA): 20
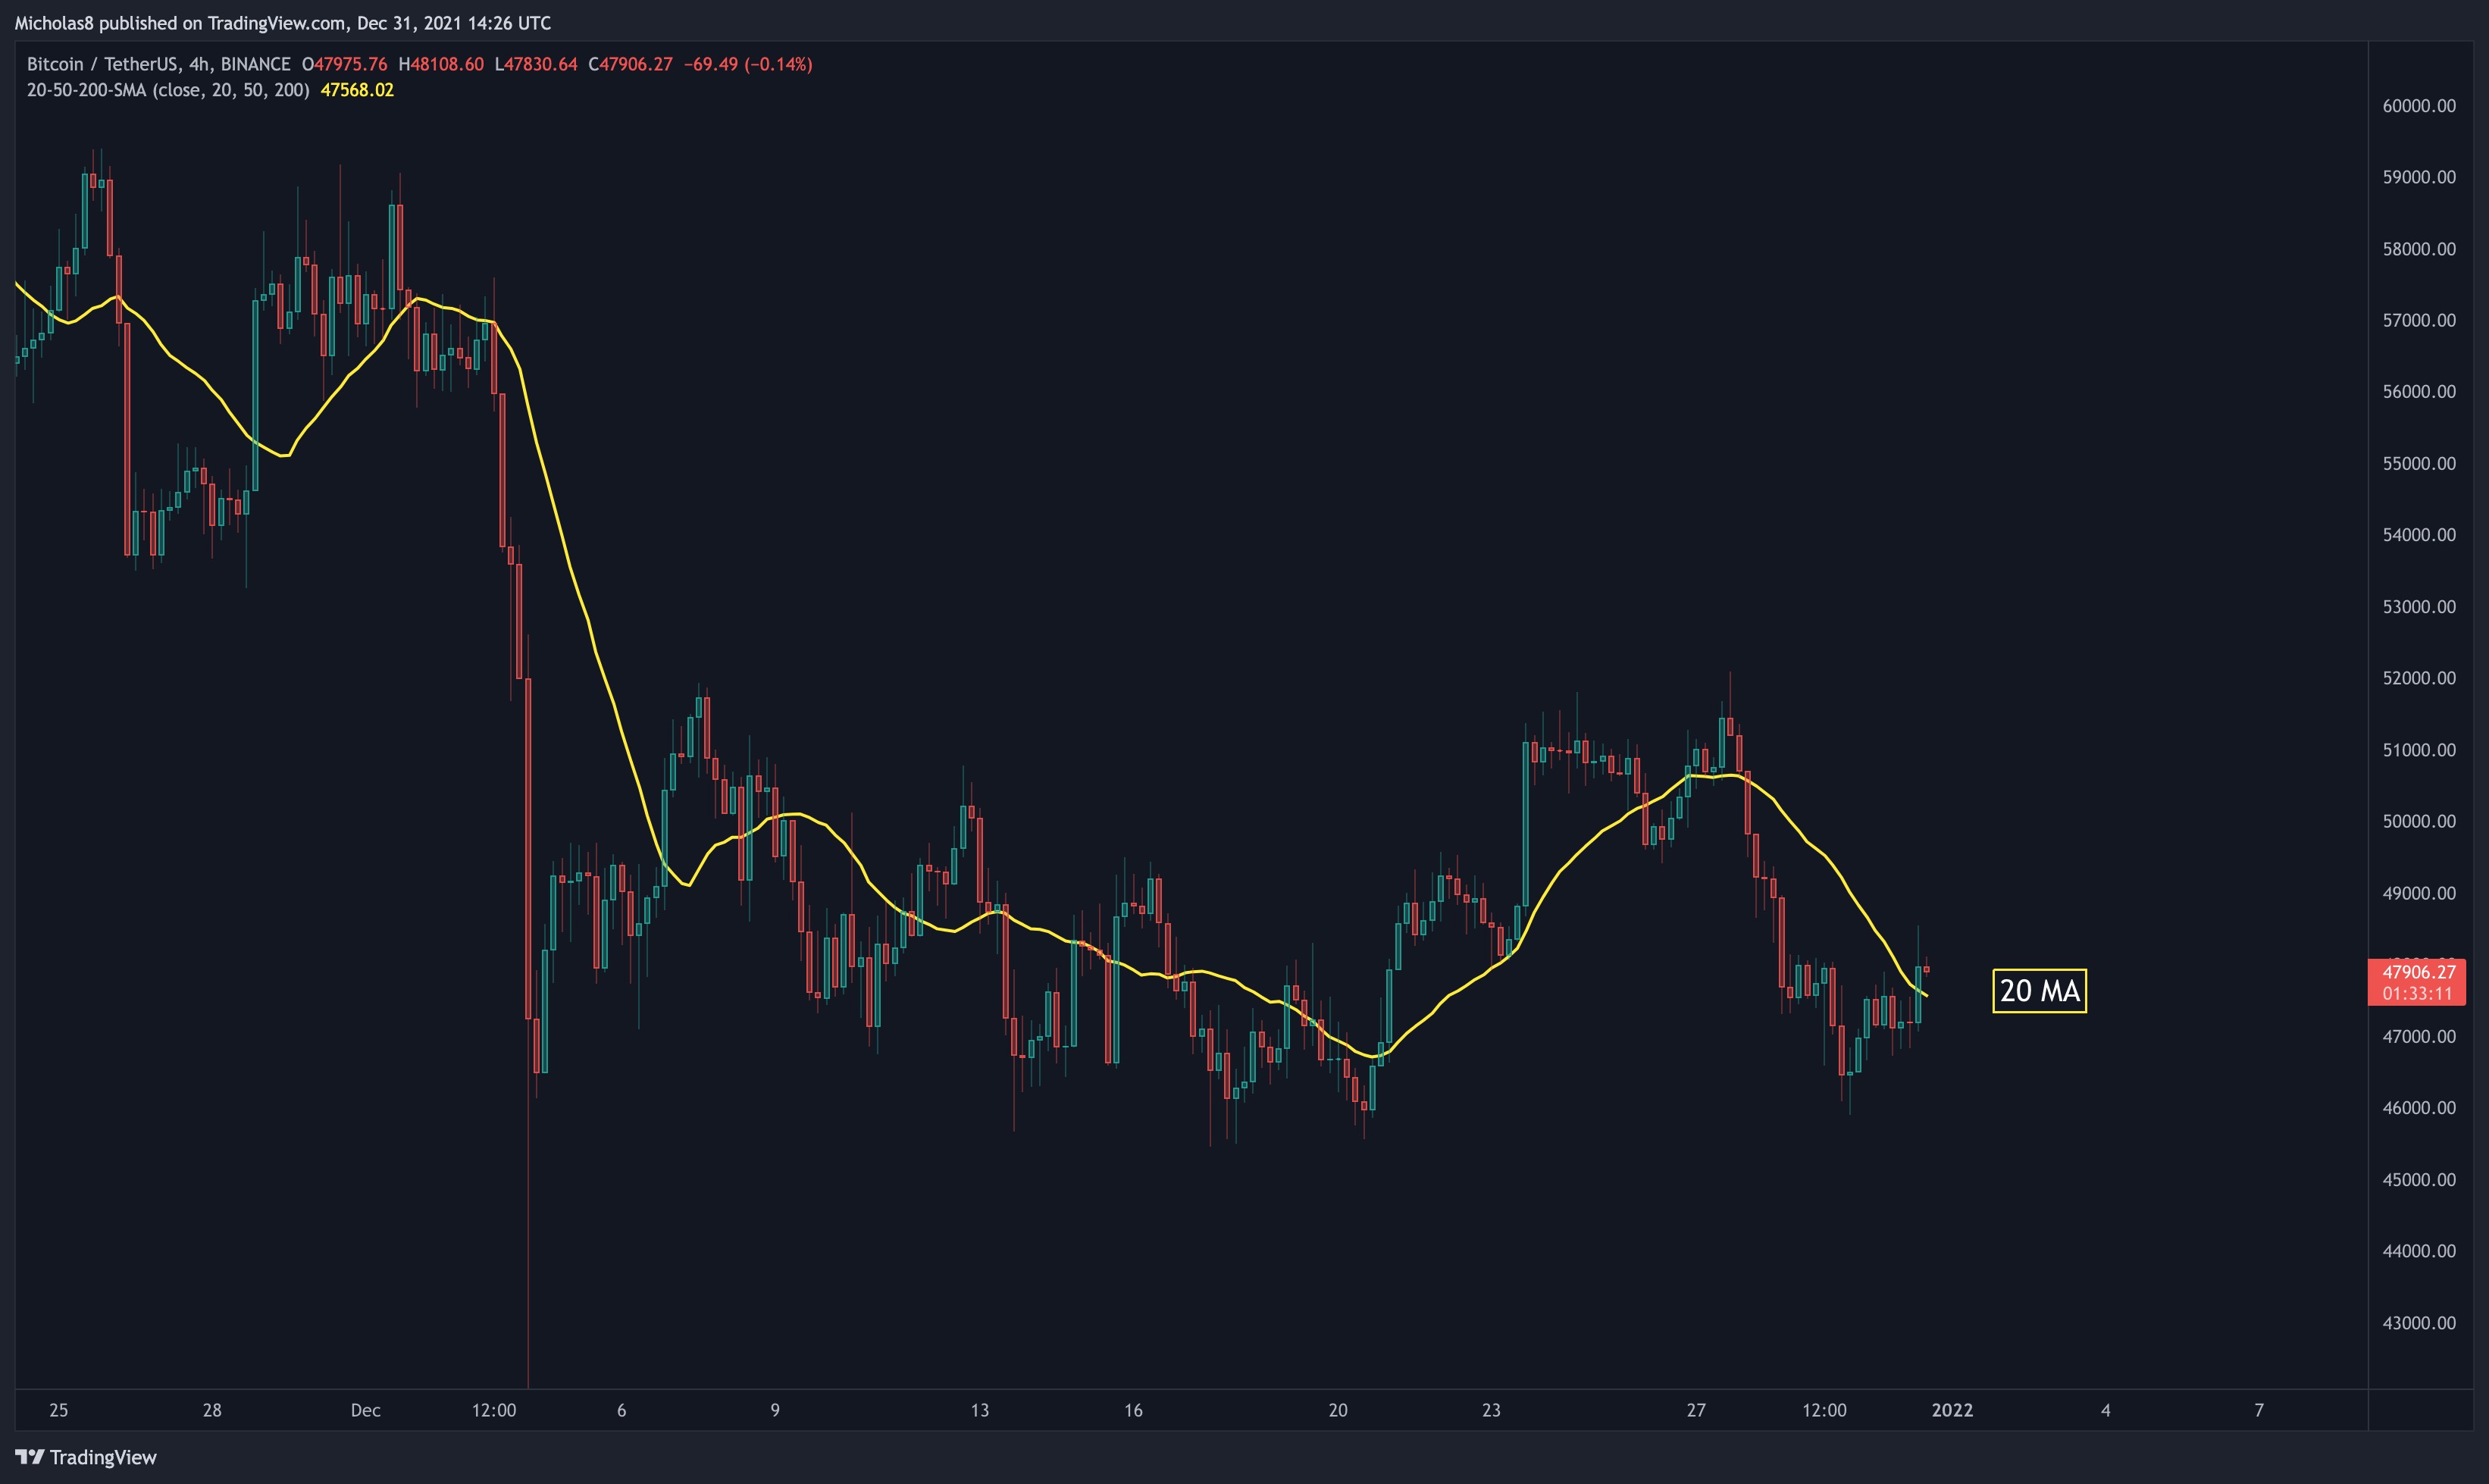
Bitcoin has risen above the 20 SMA on this timeframe.
Implication: Ideally, this serves as a level of support moving forward.
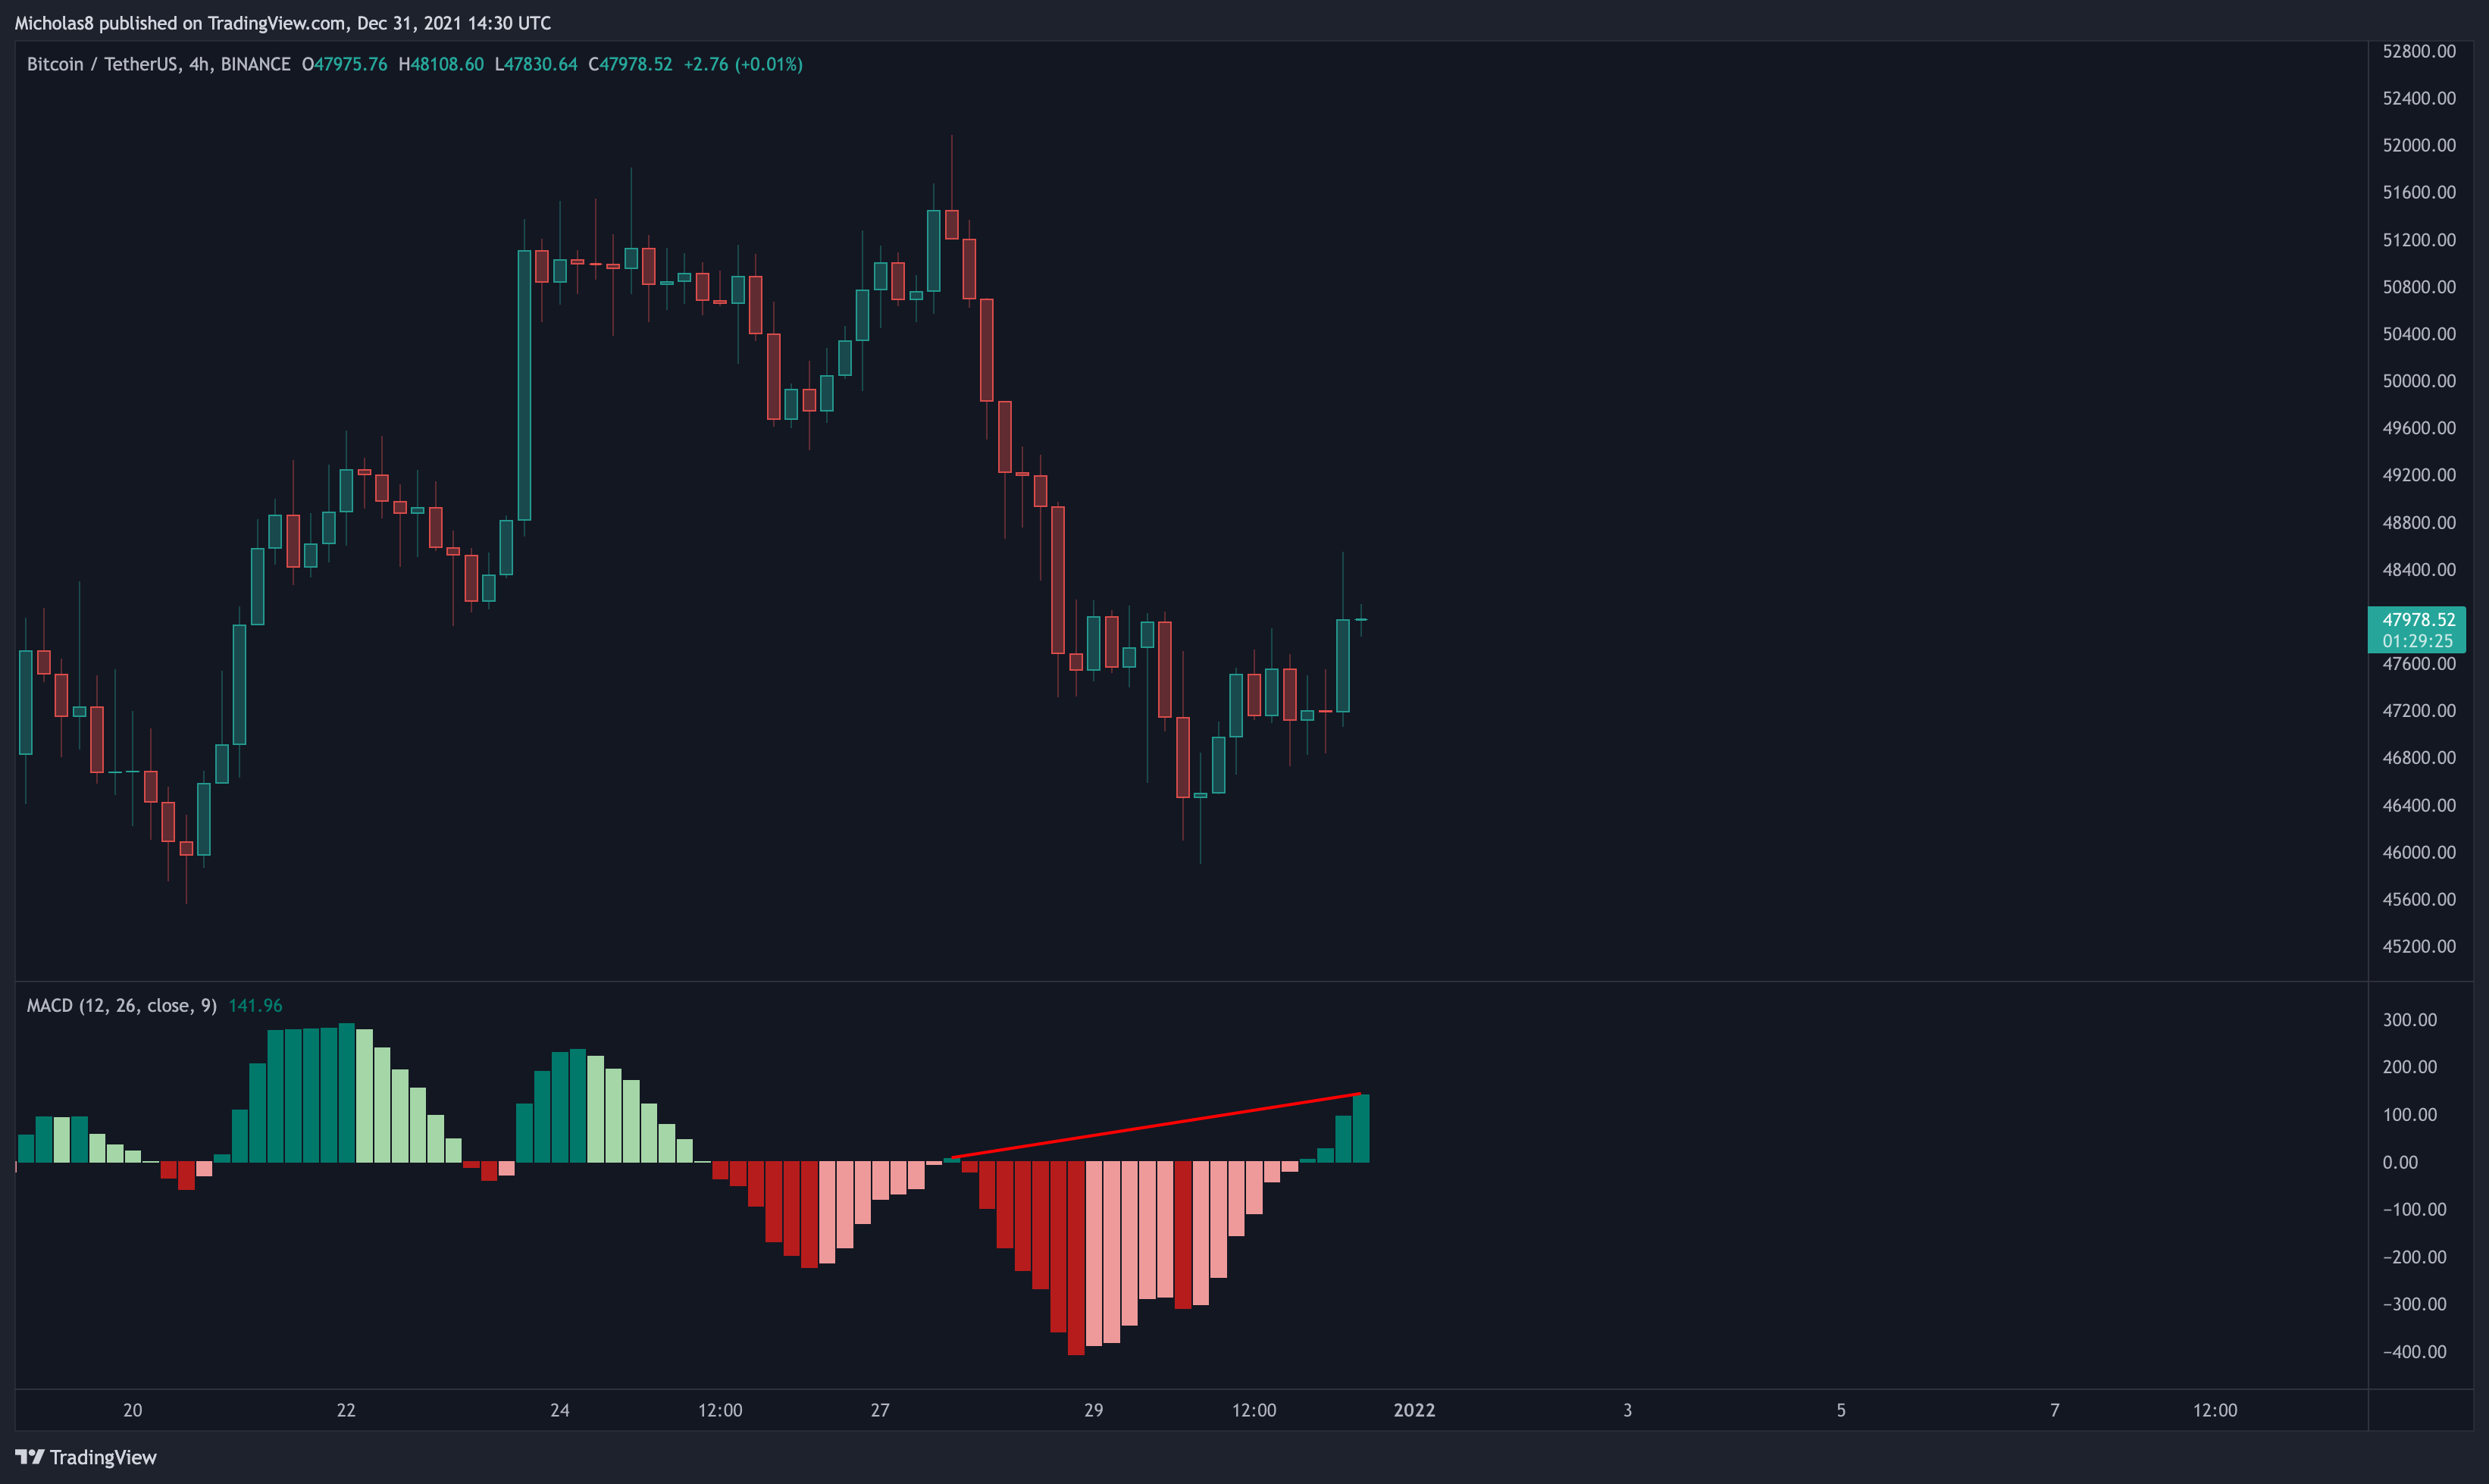
Divergences
Bullish Divergence
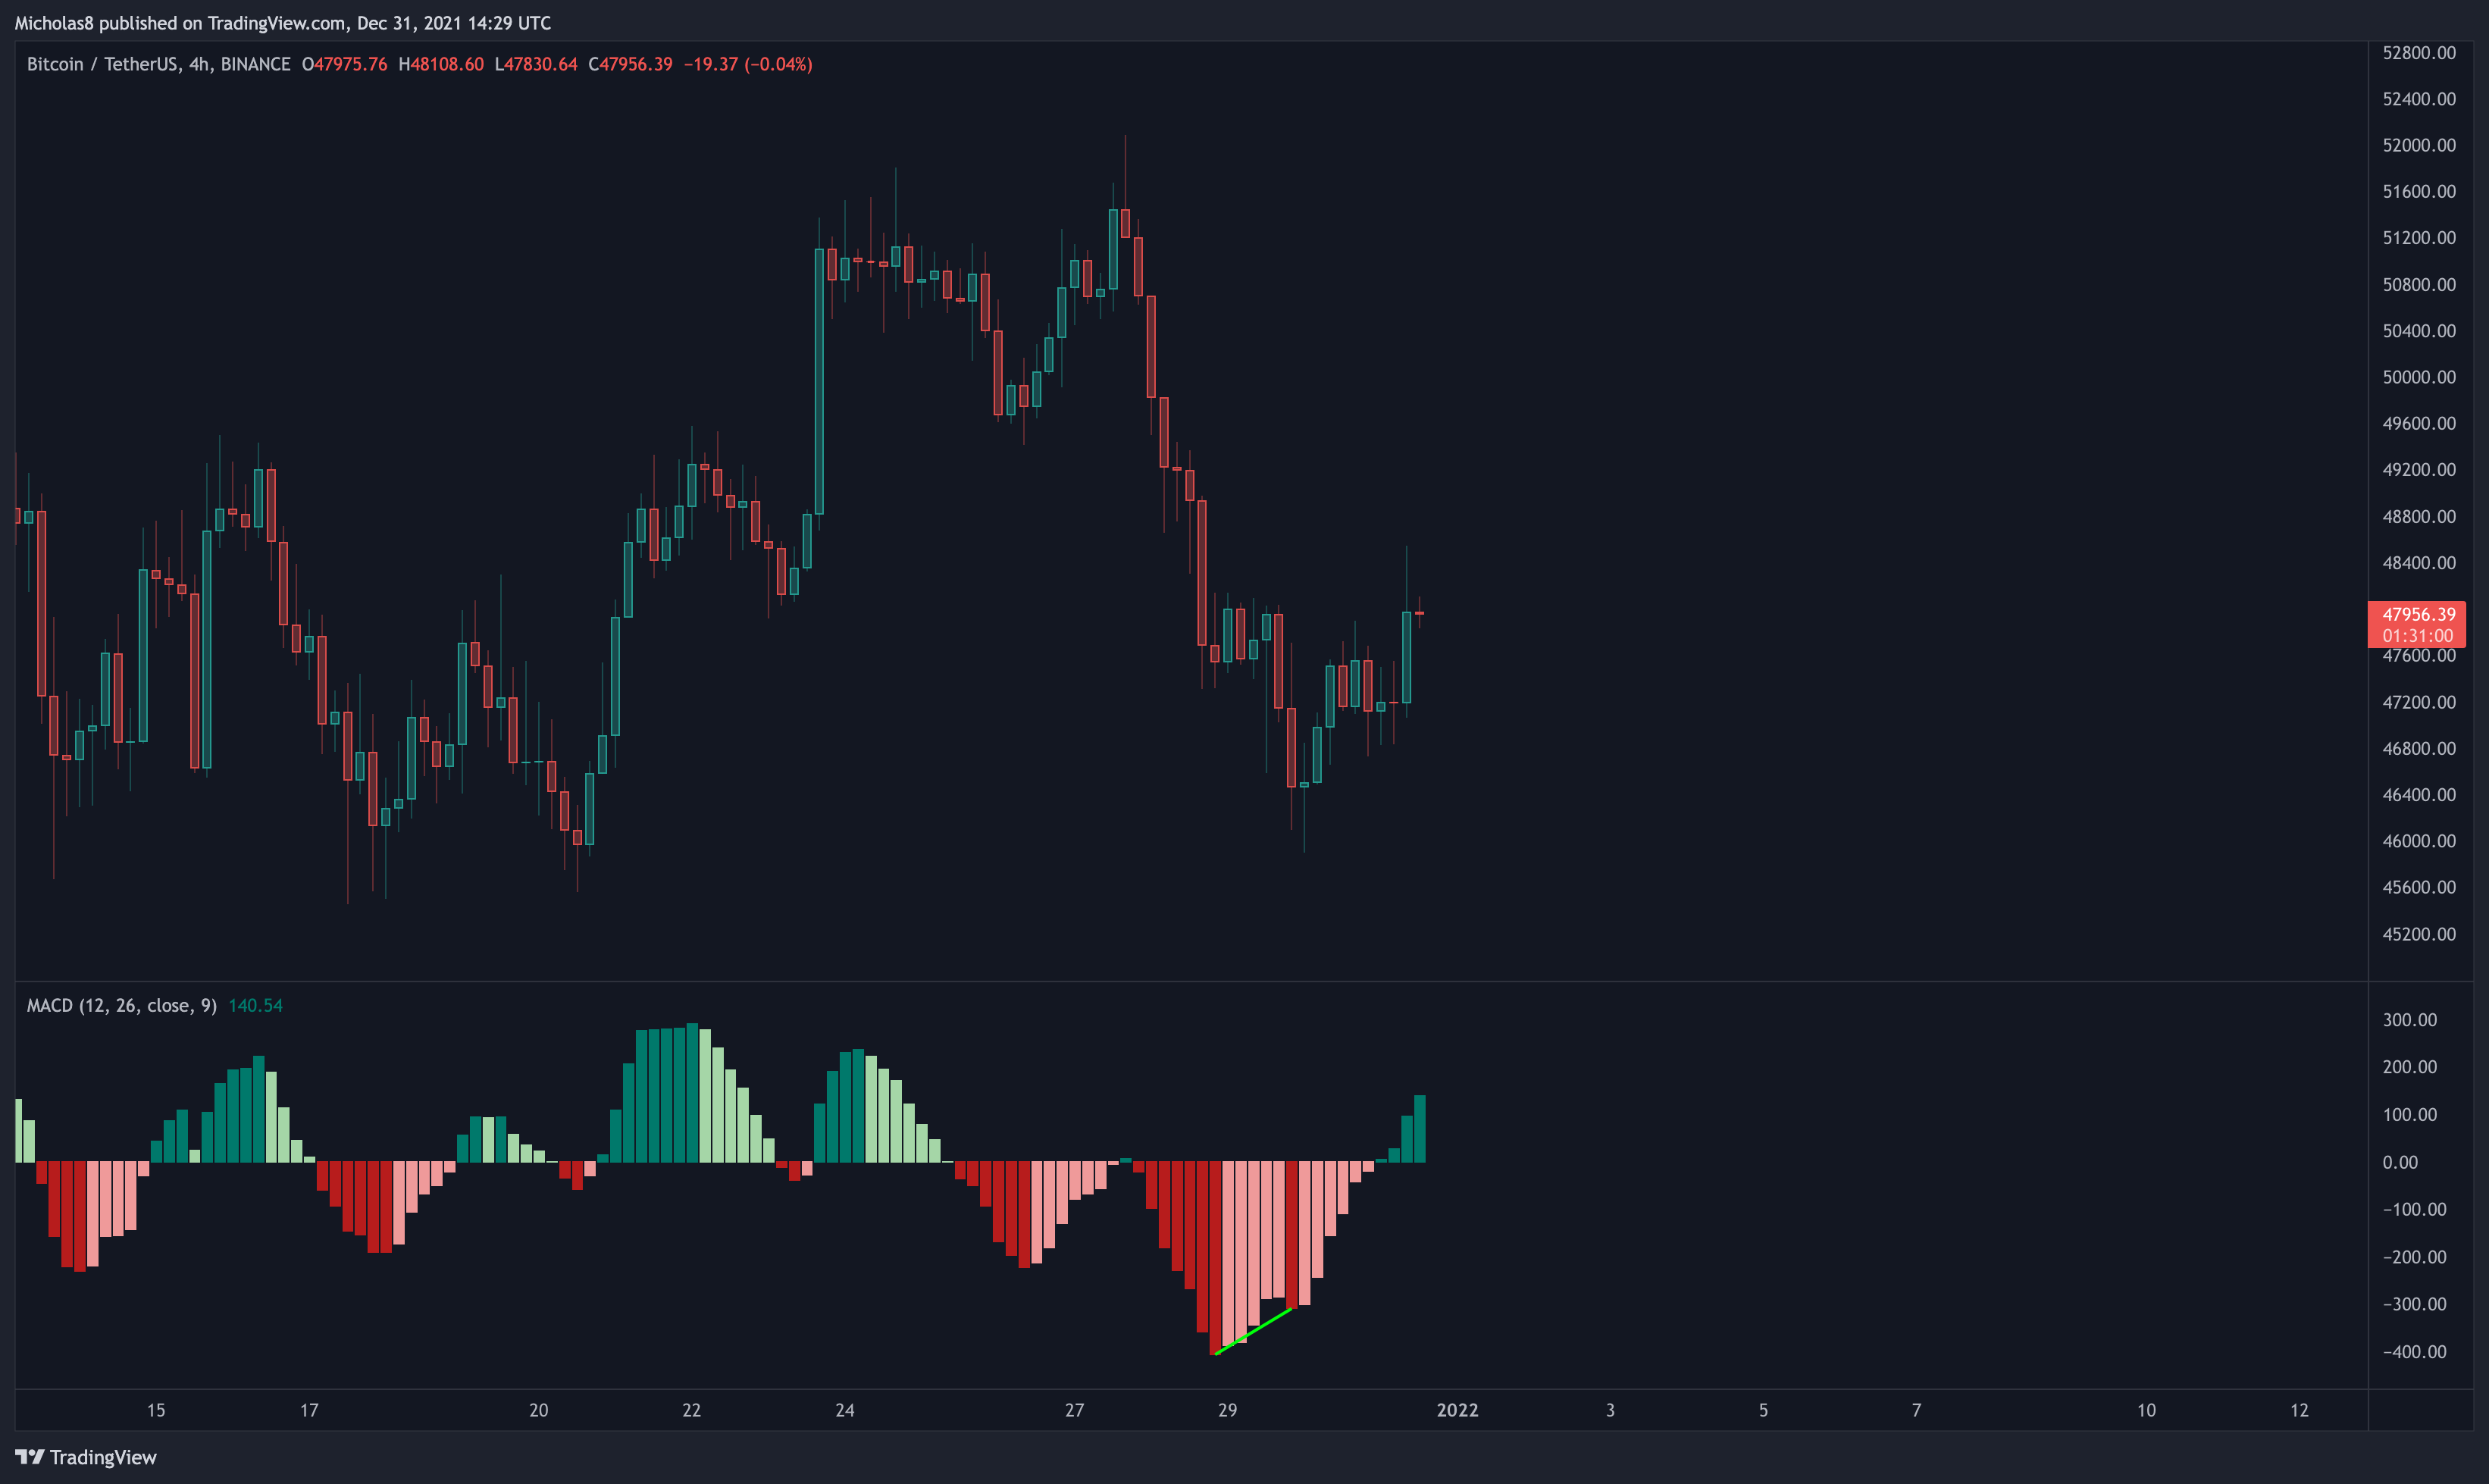
Bitcoin has a lower low in price, with a higher low in the MACD. This is a bullish divergence, which signals a possible trend reversal up.
Invalidation: Lower low in price and in the MACD.
1H Timeframe
EMA Ribbon
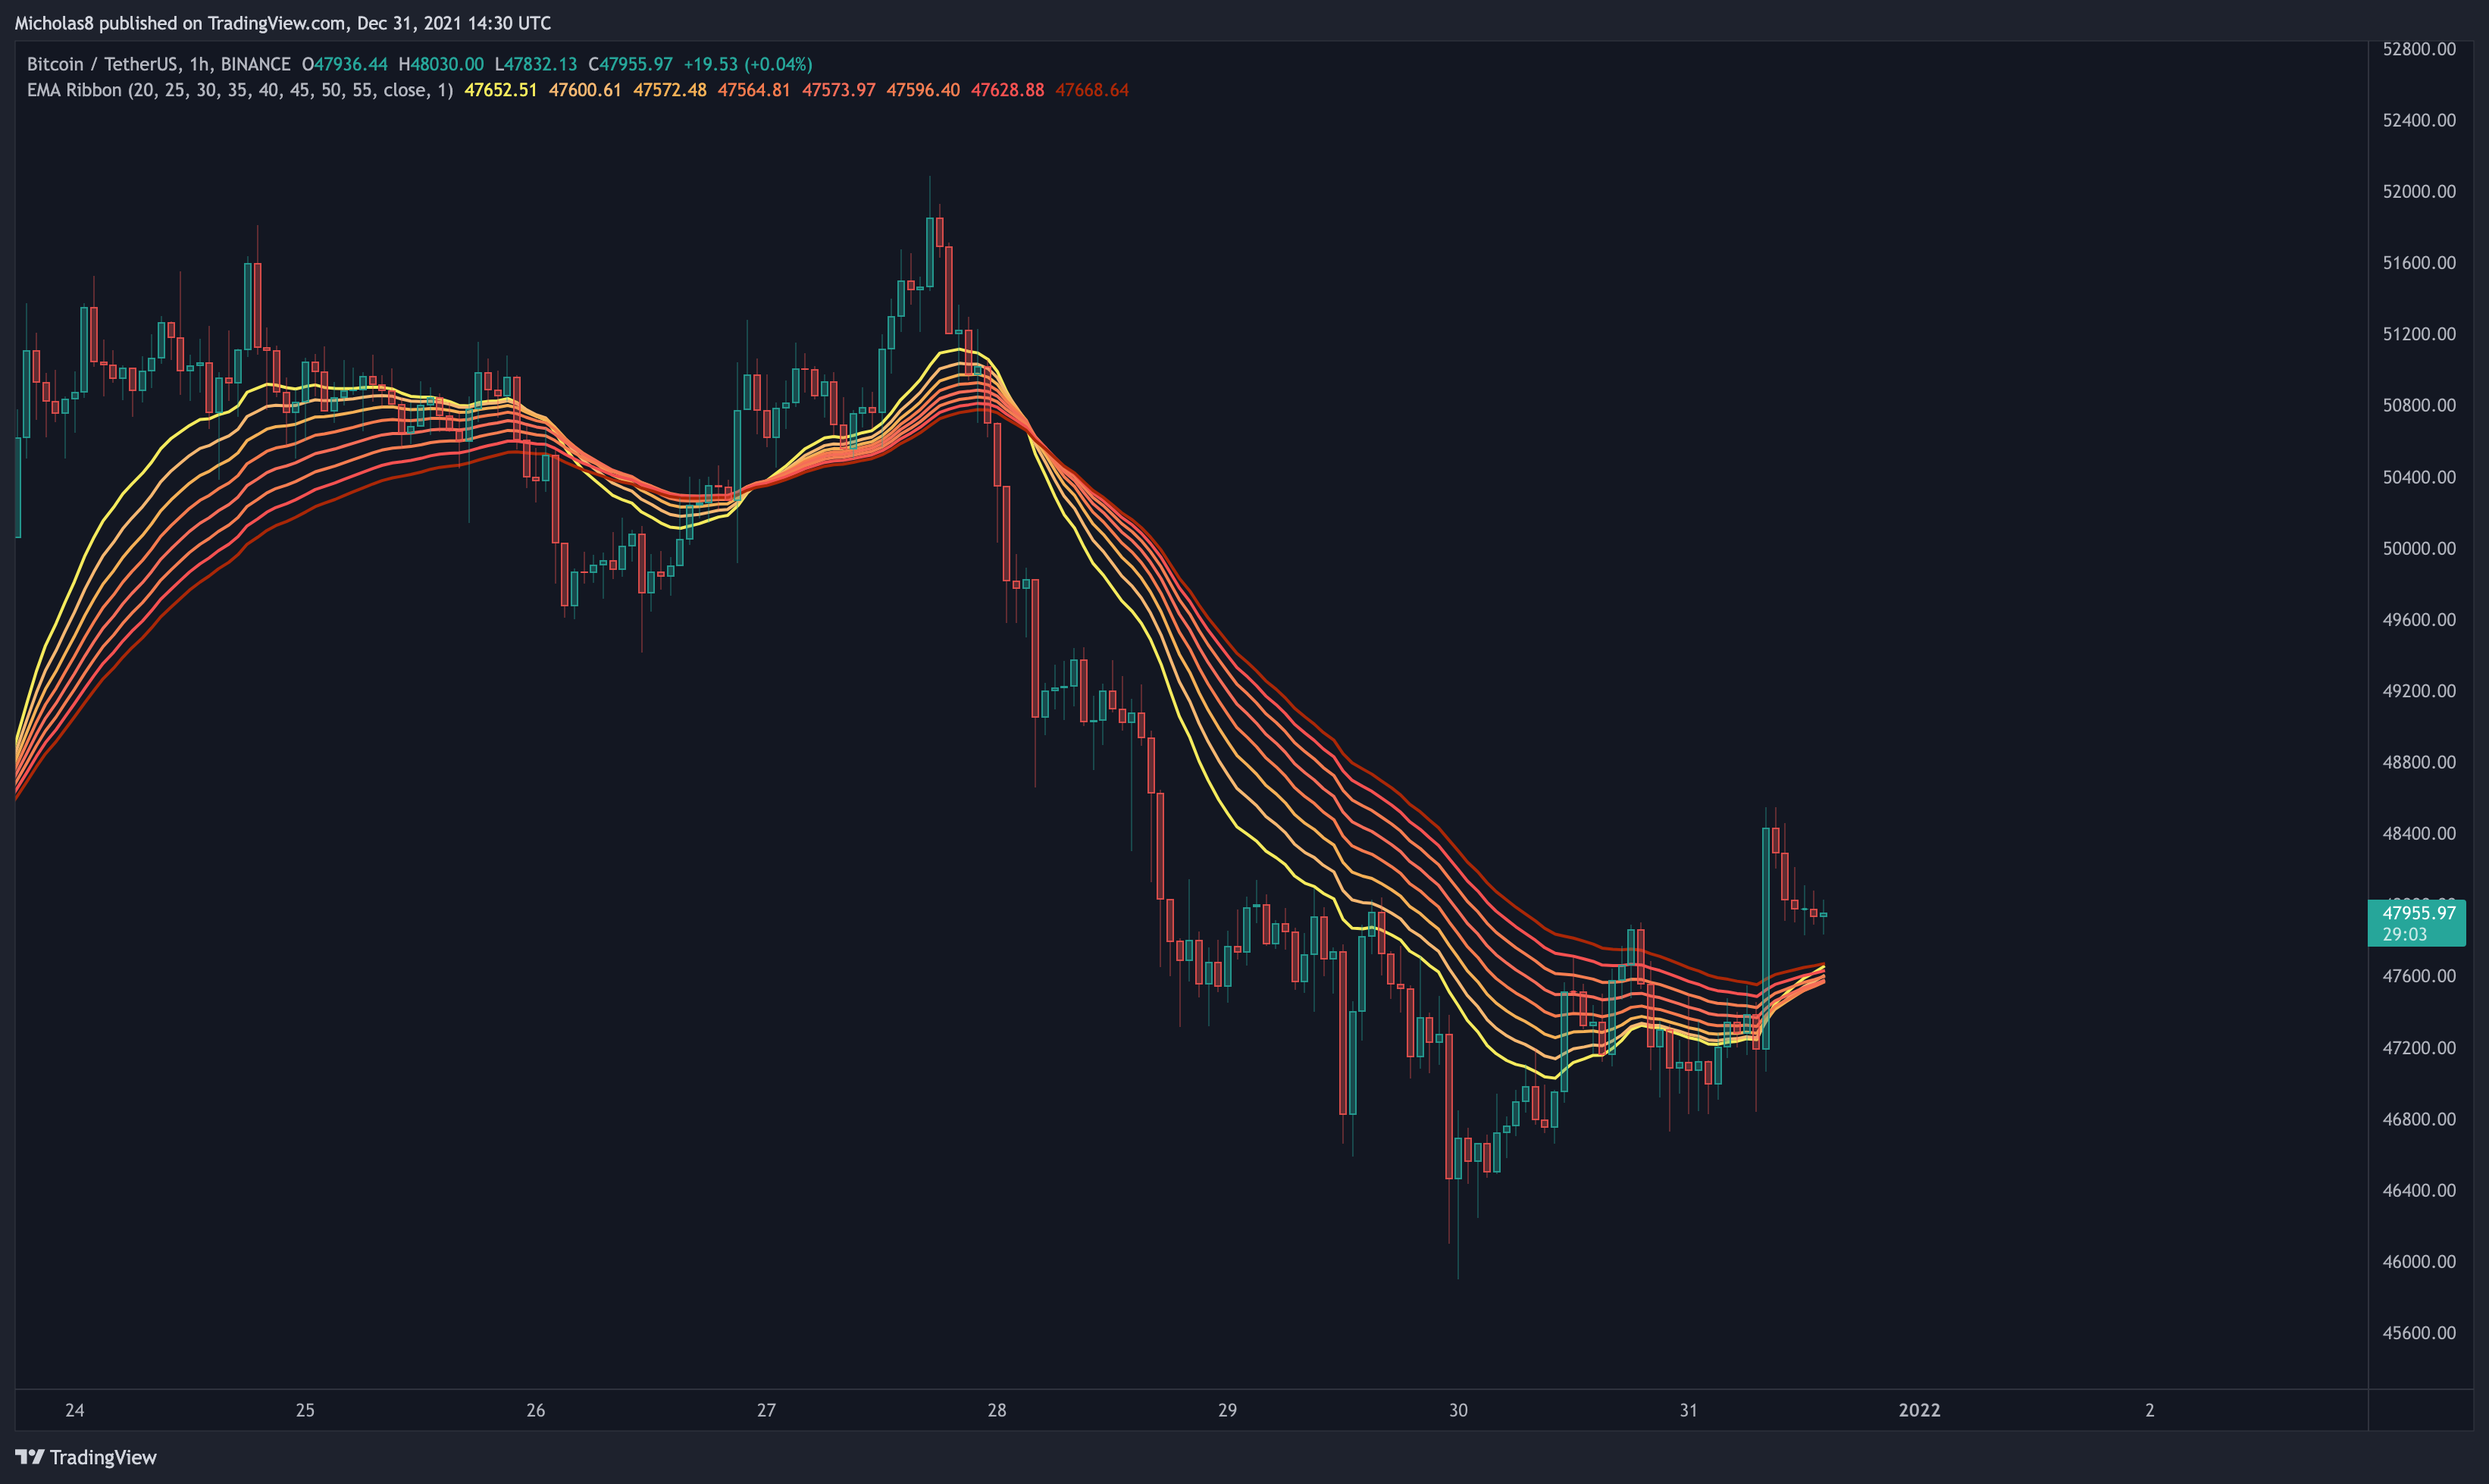
Bitcoin has risen above the ribbon.
Implication: Ideally, this serves as a level of support moving forward.
THE BAD
4H Timeframe
Bearish Market Structure

Bitcoin has created a new higher high for the first time since November 10th. As long as this this continues and turns into a trend, we can expect higher levels for Bitcoin. But as of now, the market structure on this timeframe remains bearish.
Key Liquidity Zones
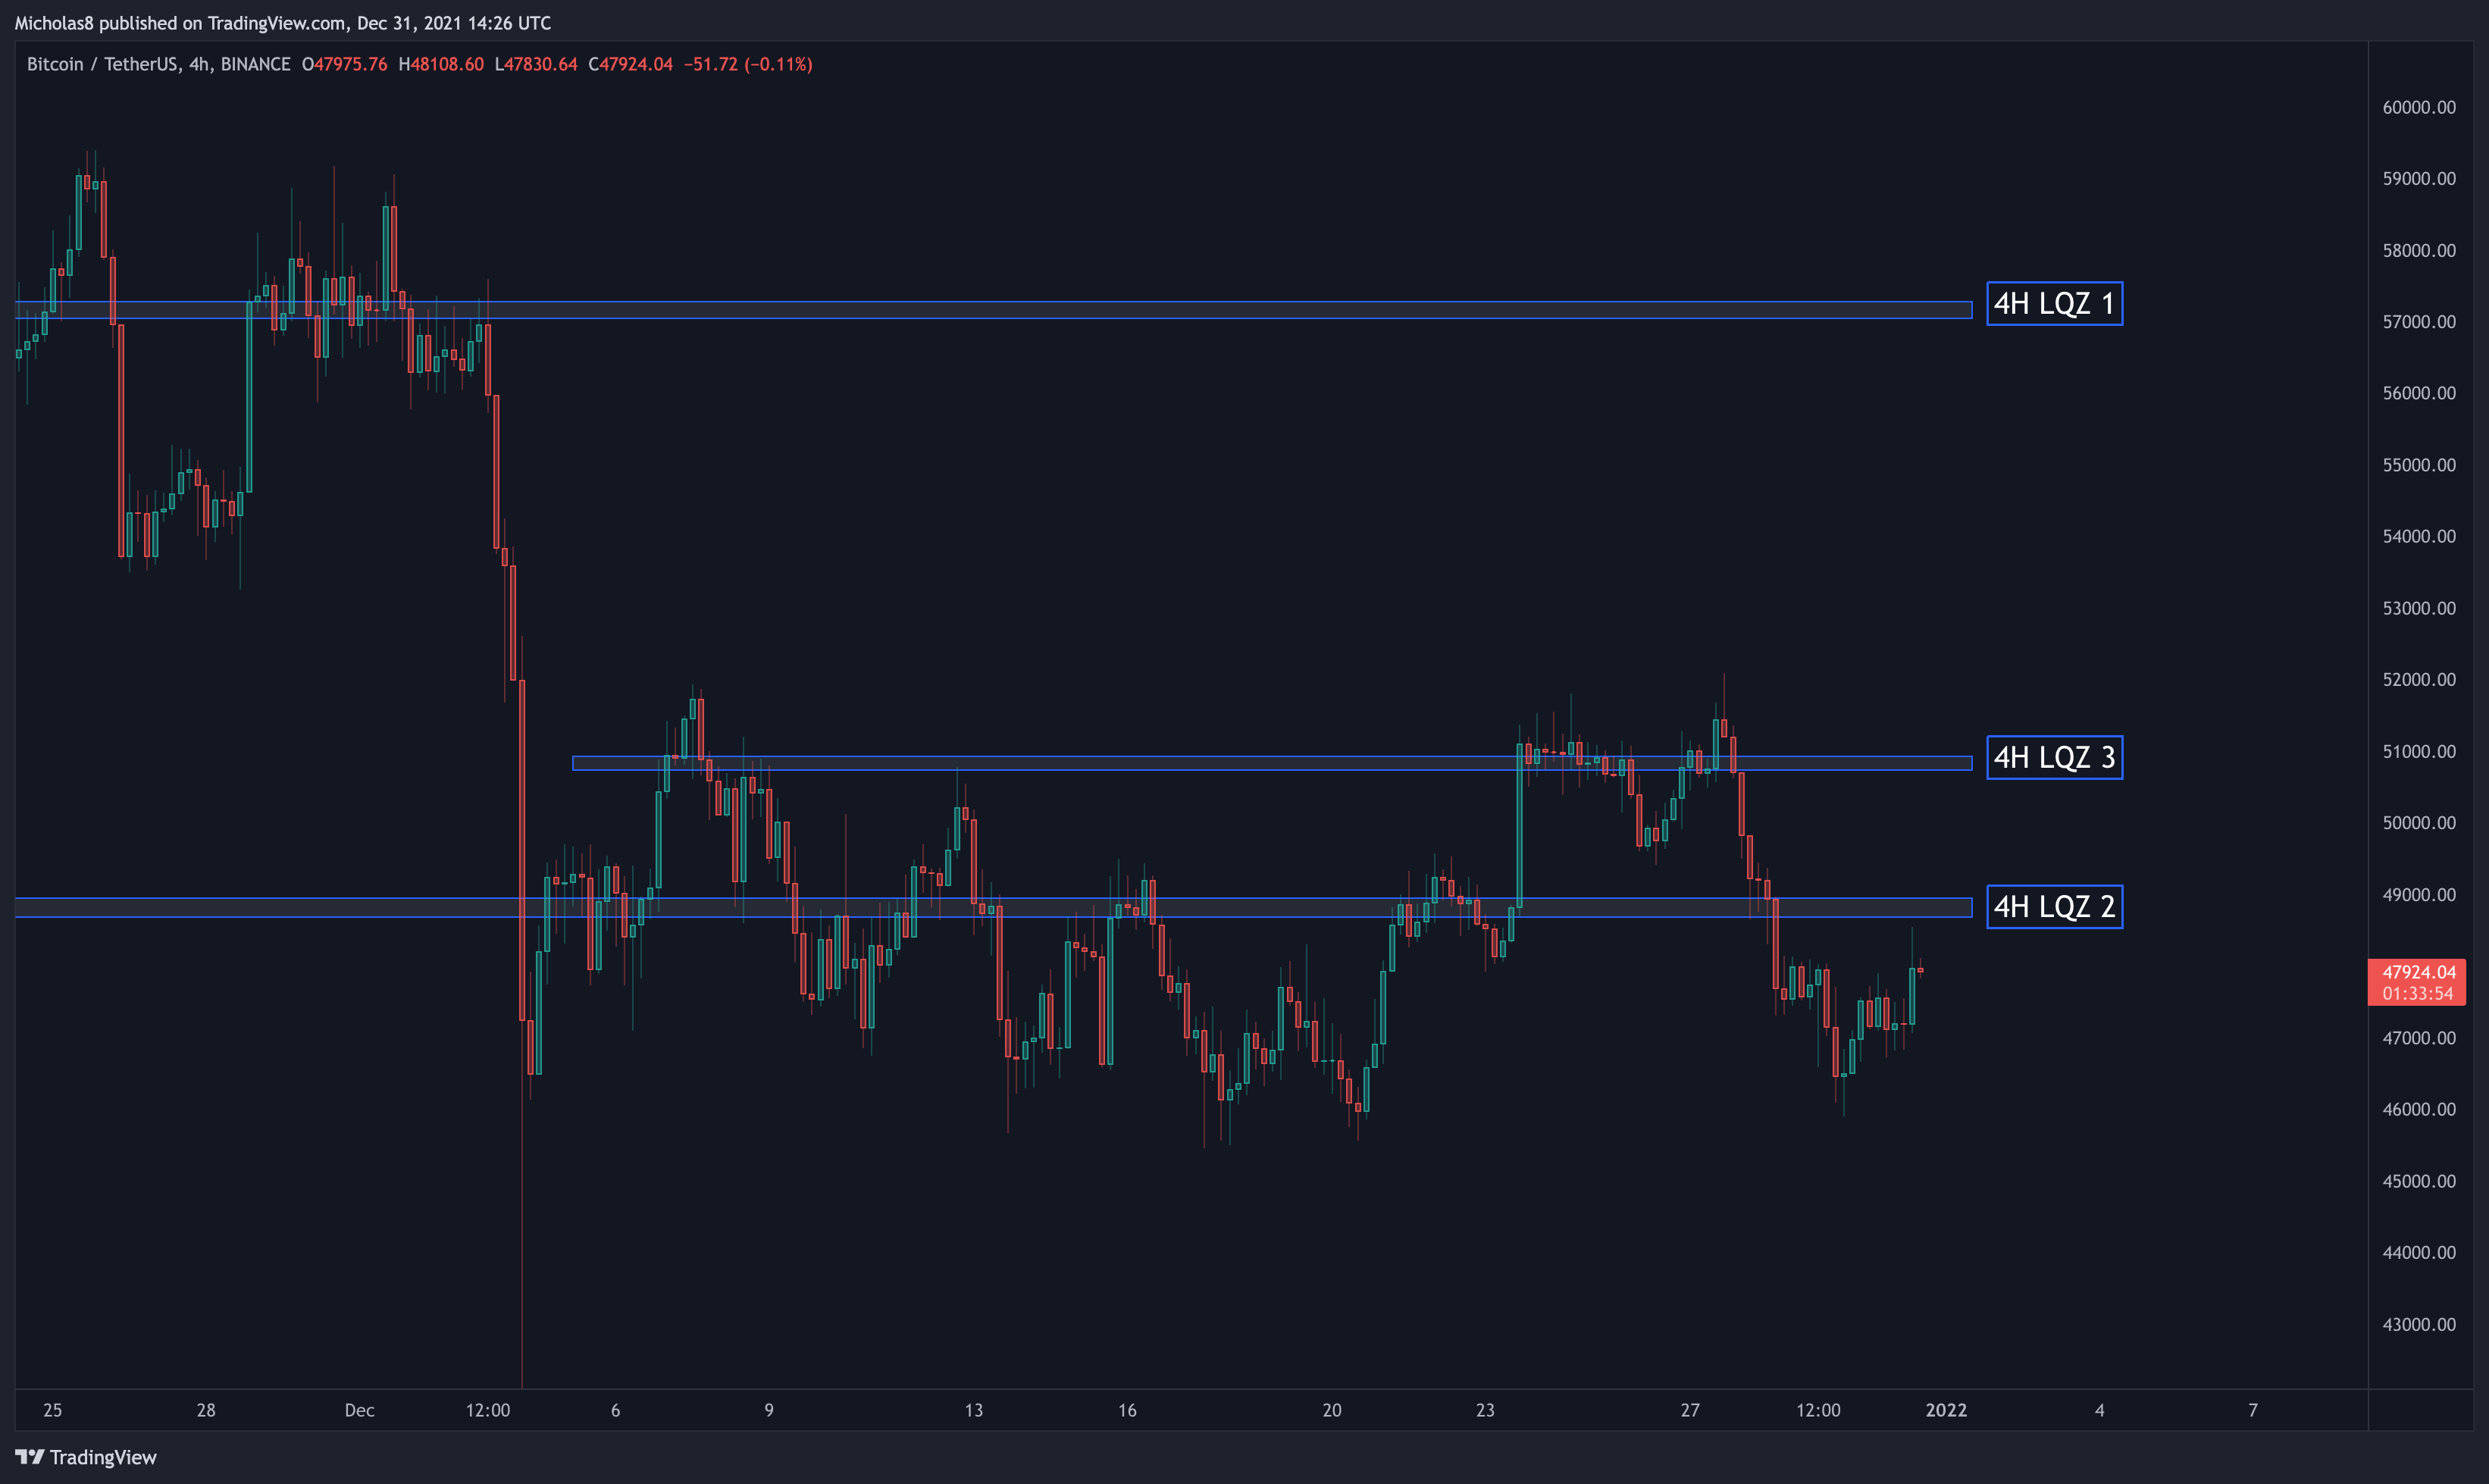
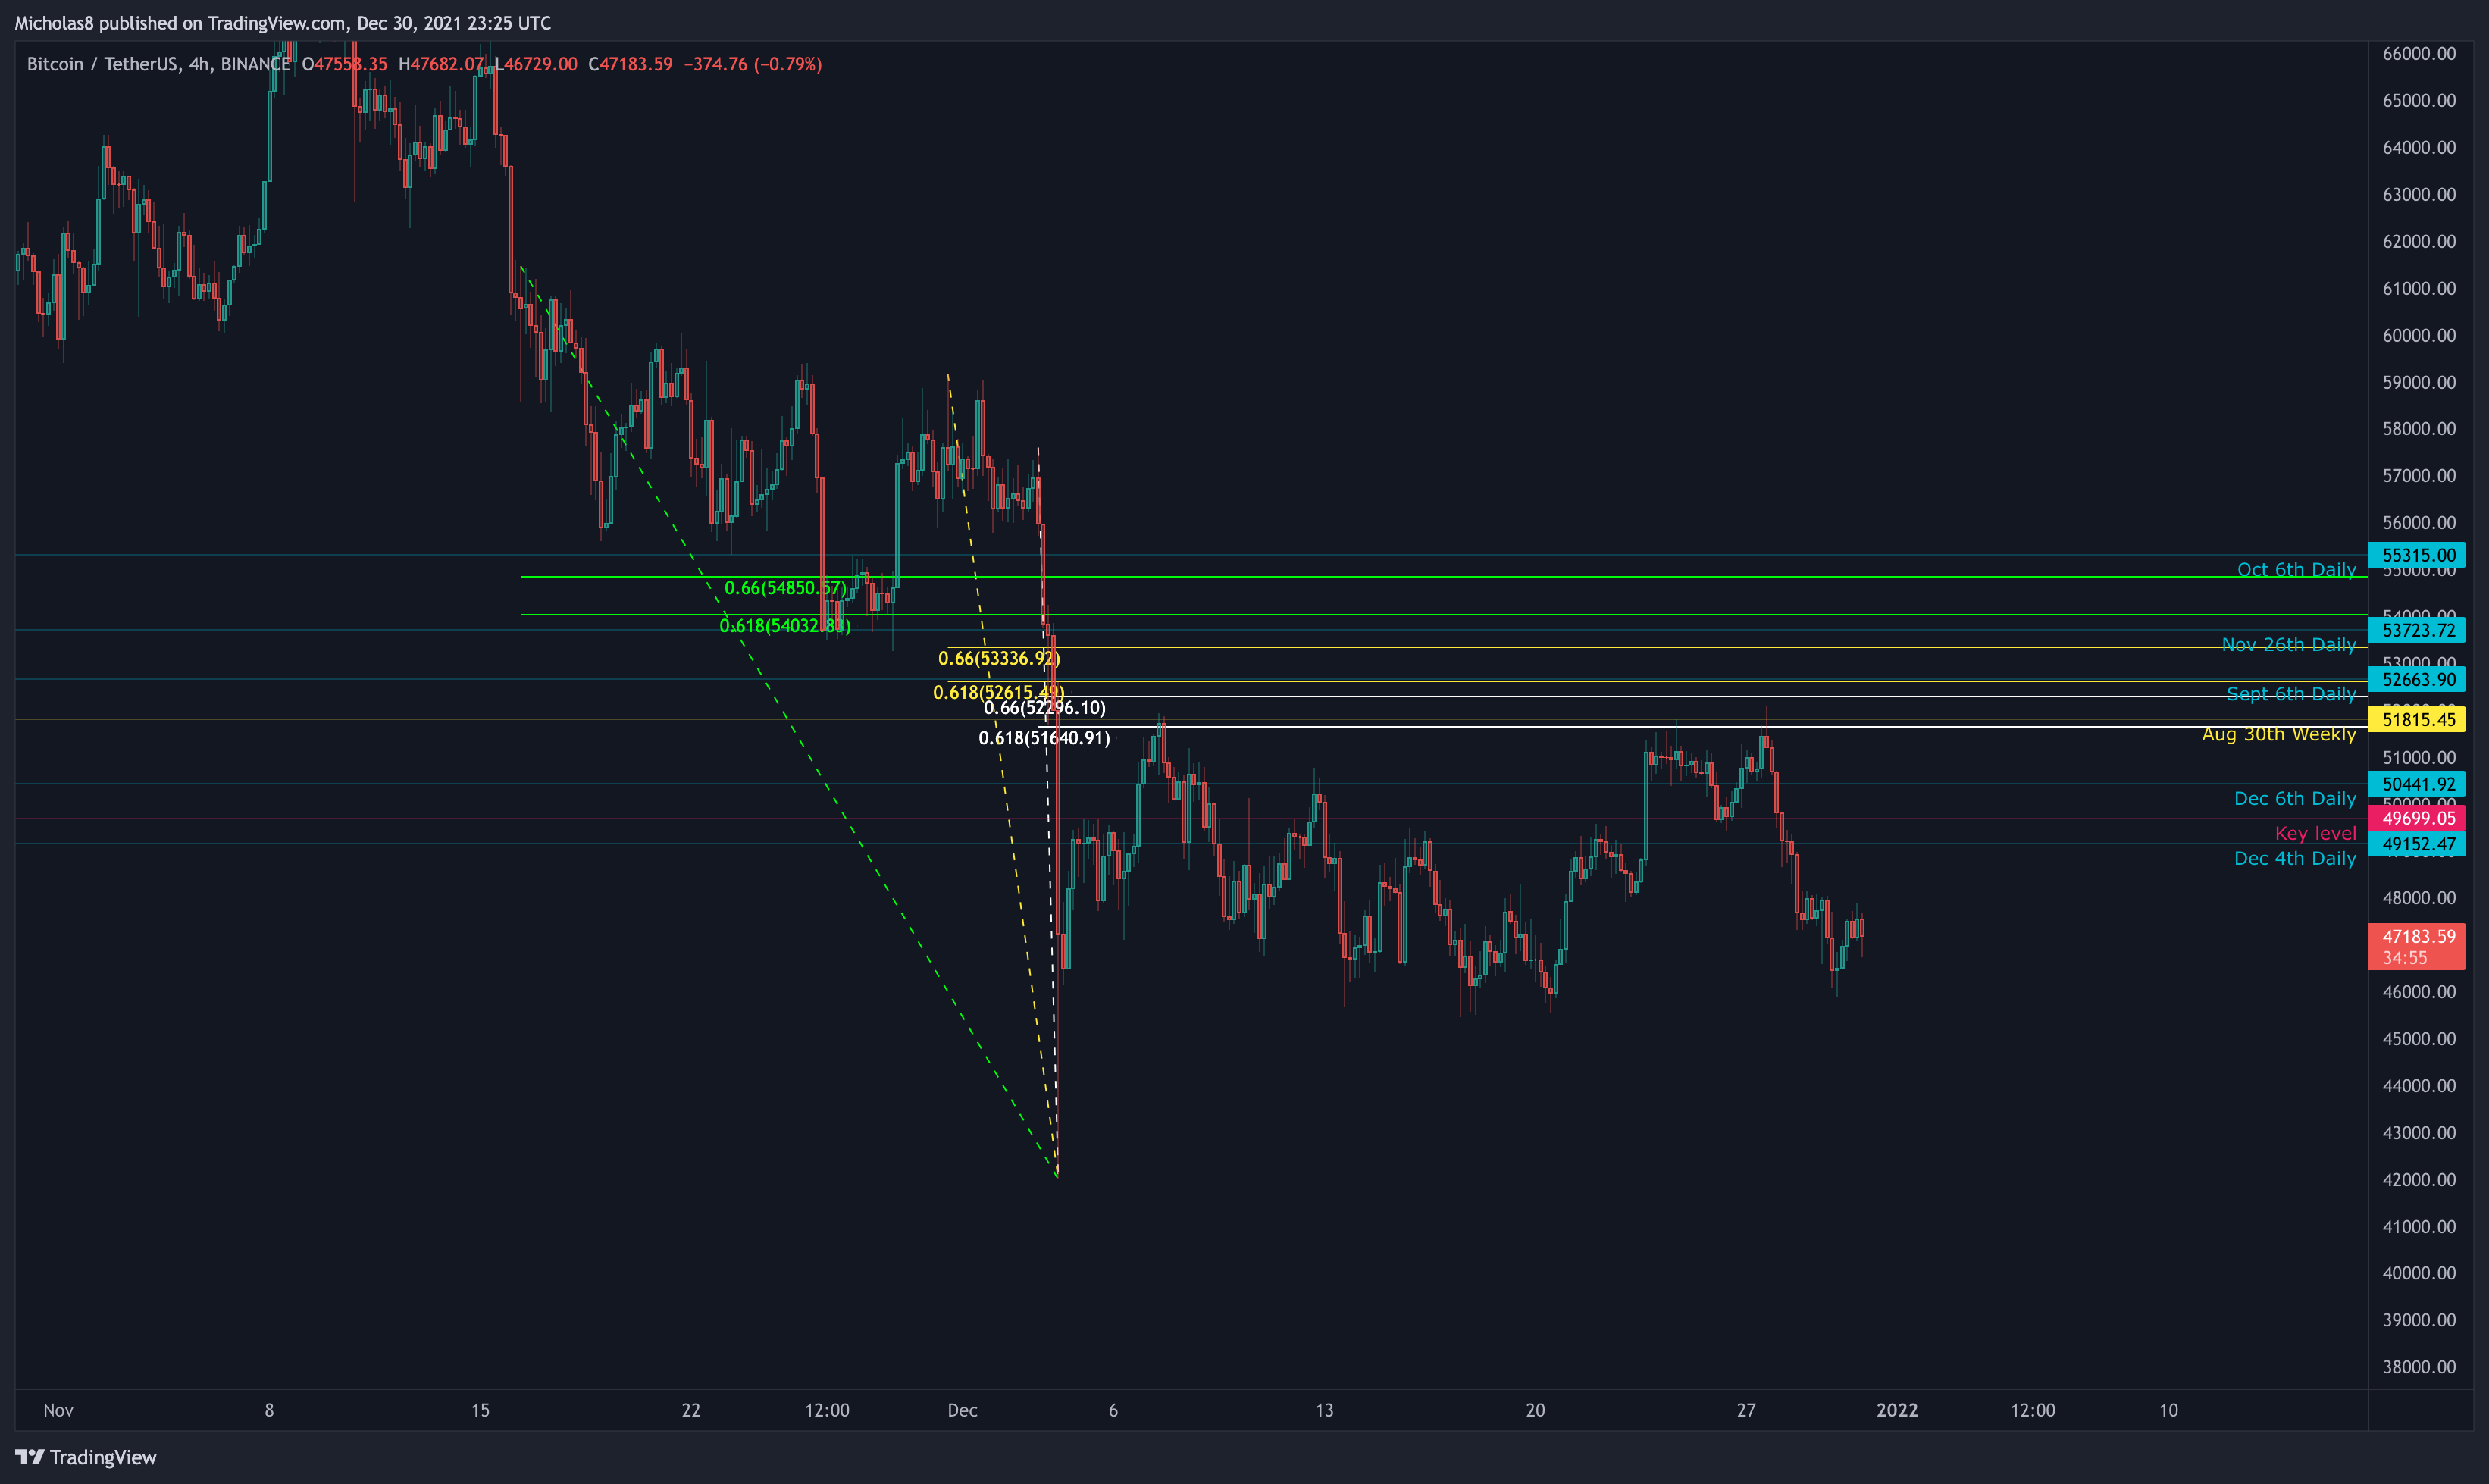
Zone 1: Bitcoin has lost this LQZ as support, which sits at 57k - 57.3k.
Zone 2: The LQZ at 48.7k - 49k
Zone 3: There is a new LQZ sitting at 50.7k-50.9l. Bitcoin has lost this as support.
Implications: We may see these serve as resistance moving forward.
EMA Ribbon
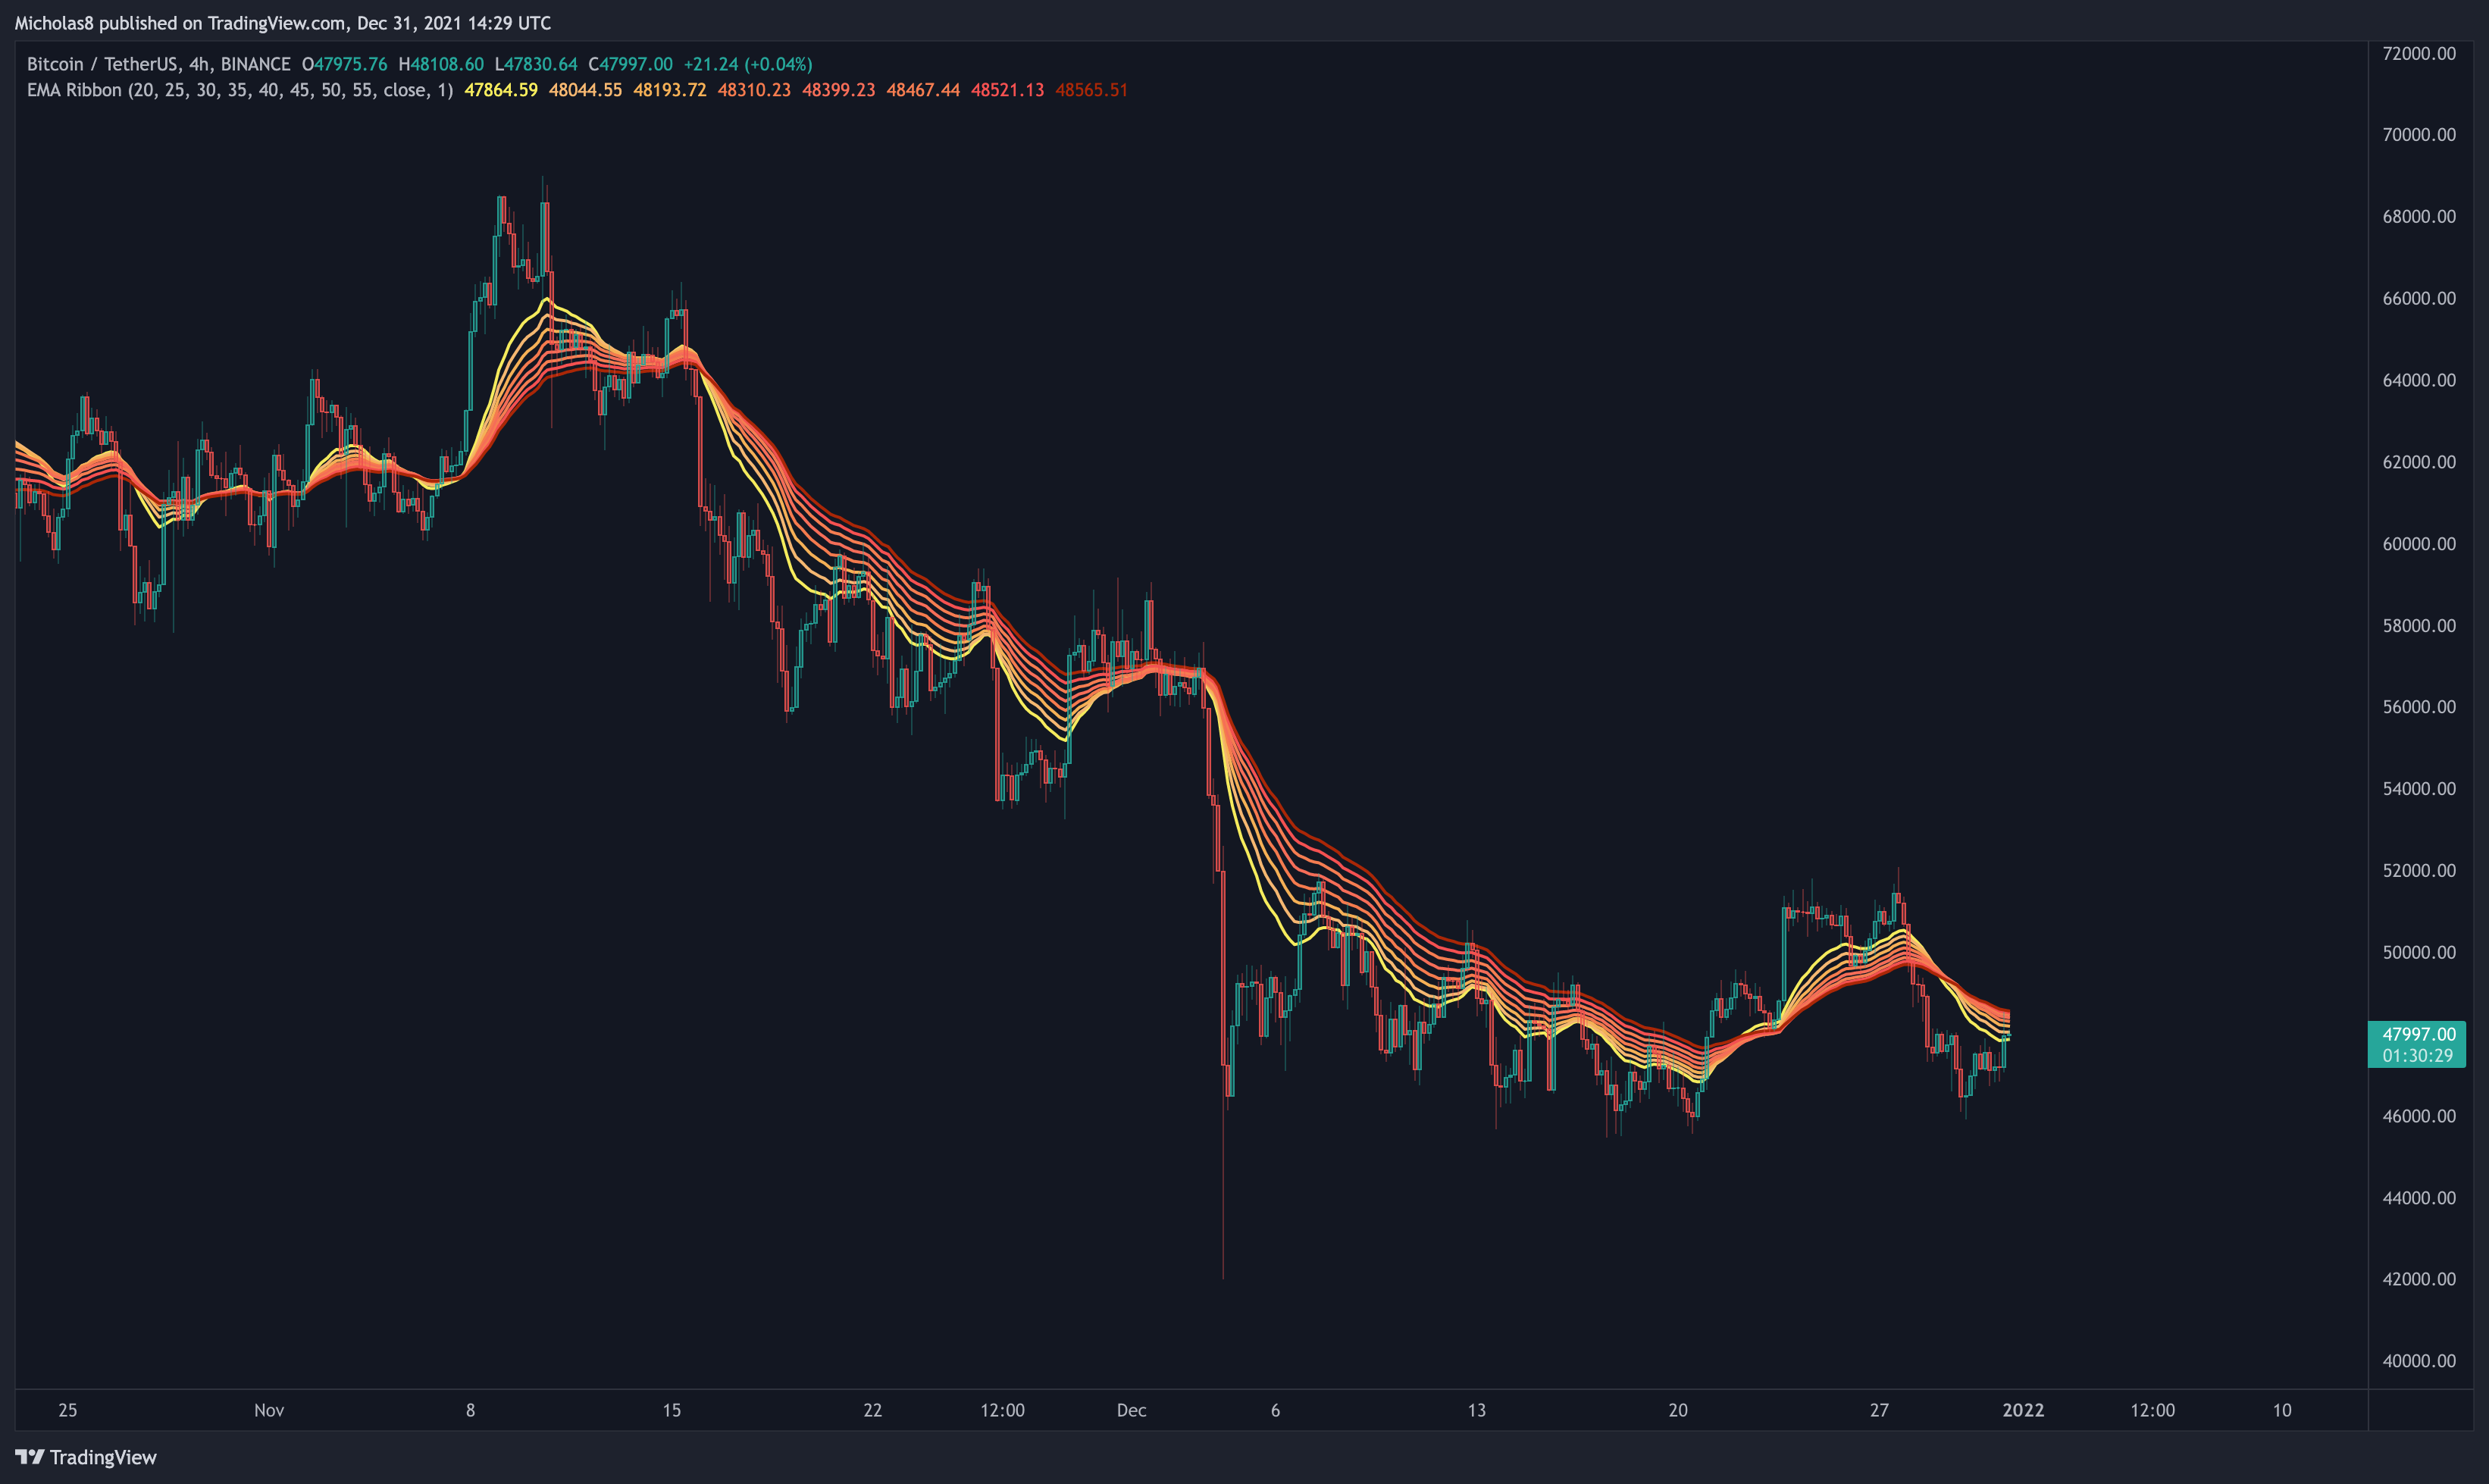
Bitcoin has lost the ribbon as support.
Implication: This may serve as a level of resistance moving forward.
Simple Moving Averages (SMA): 50 and 200
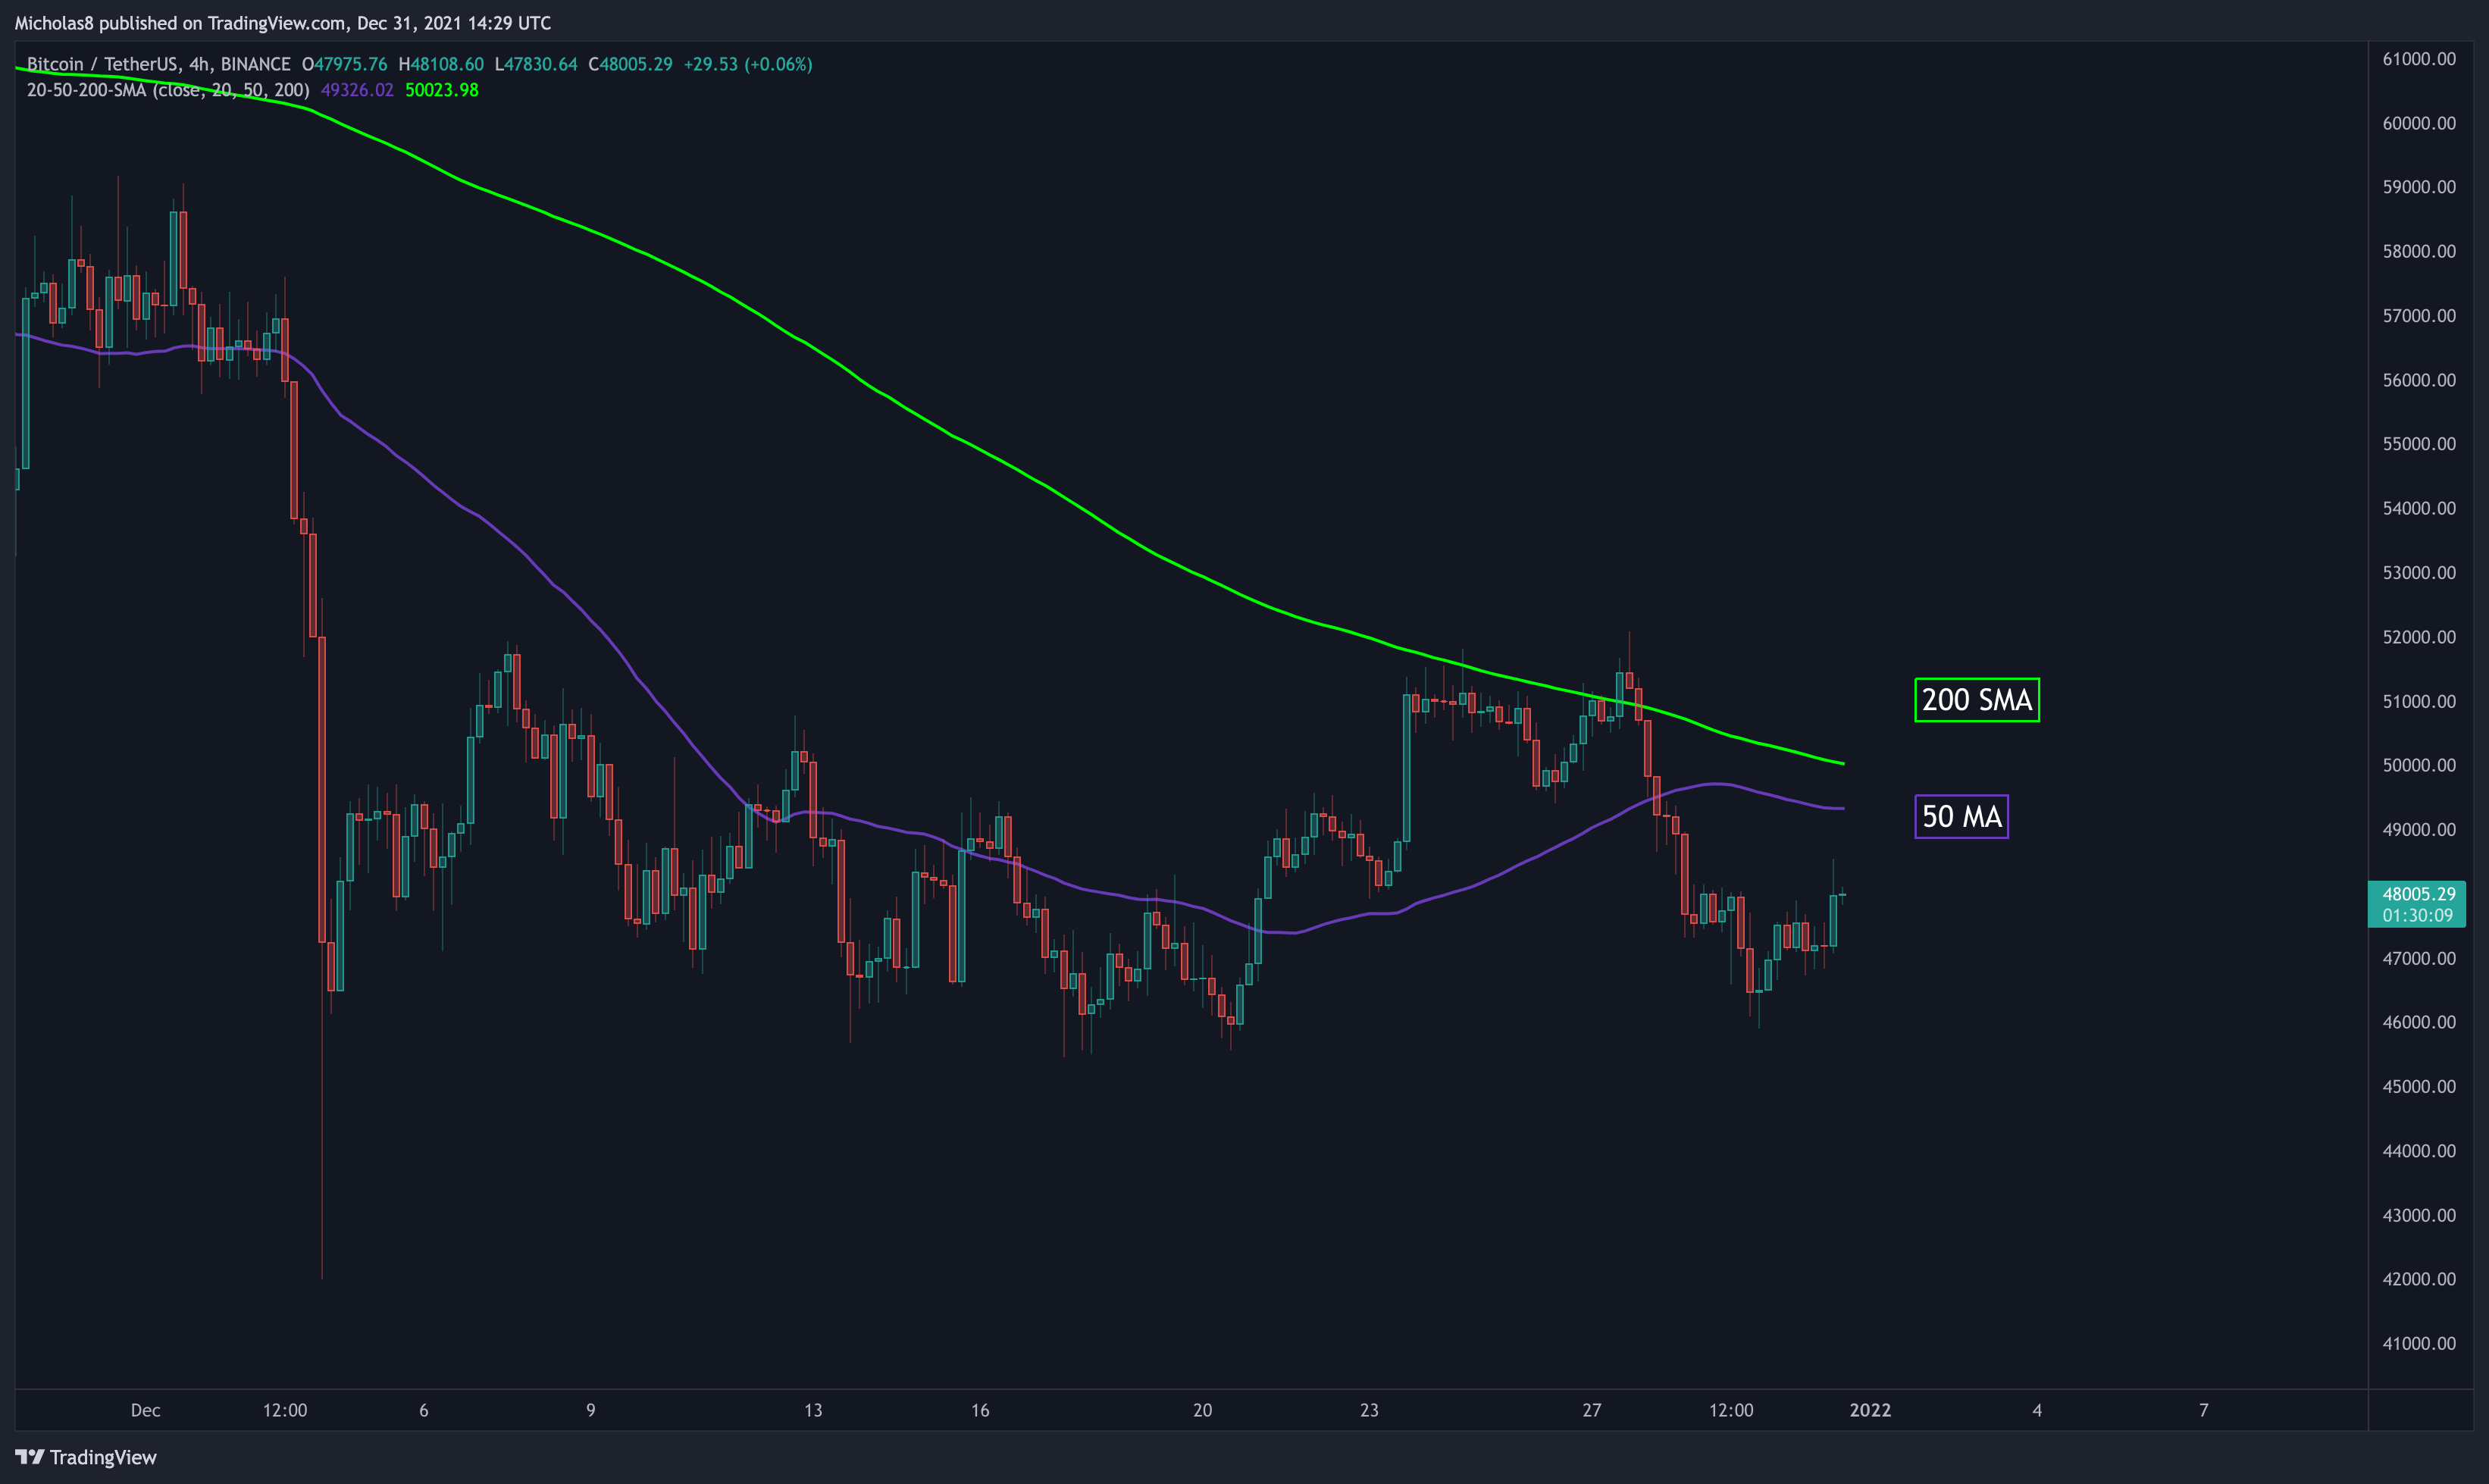
Bitcoin has fallen below these SMAs.
Implication: They may serve as resistance moving forward.
Divergences
Hidden Bearish Divergence
Bitcoin has a lower high in price, with a higher high in the MACD. This is a hidden bearish divergence, which signals a possible trend continuation down.
Invalidation: Higher high in price and in the MACD.
1H Timeframe
Divergences
Bearish Divergence
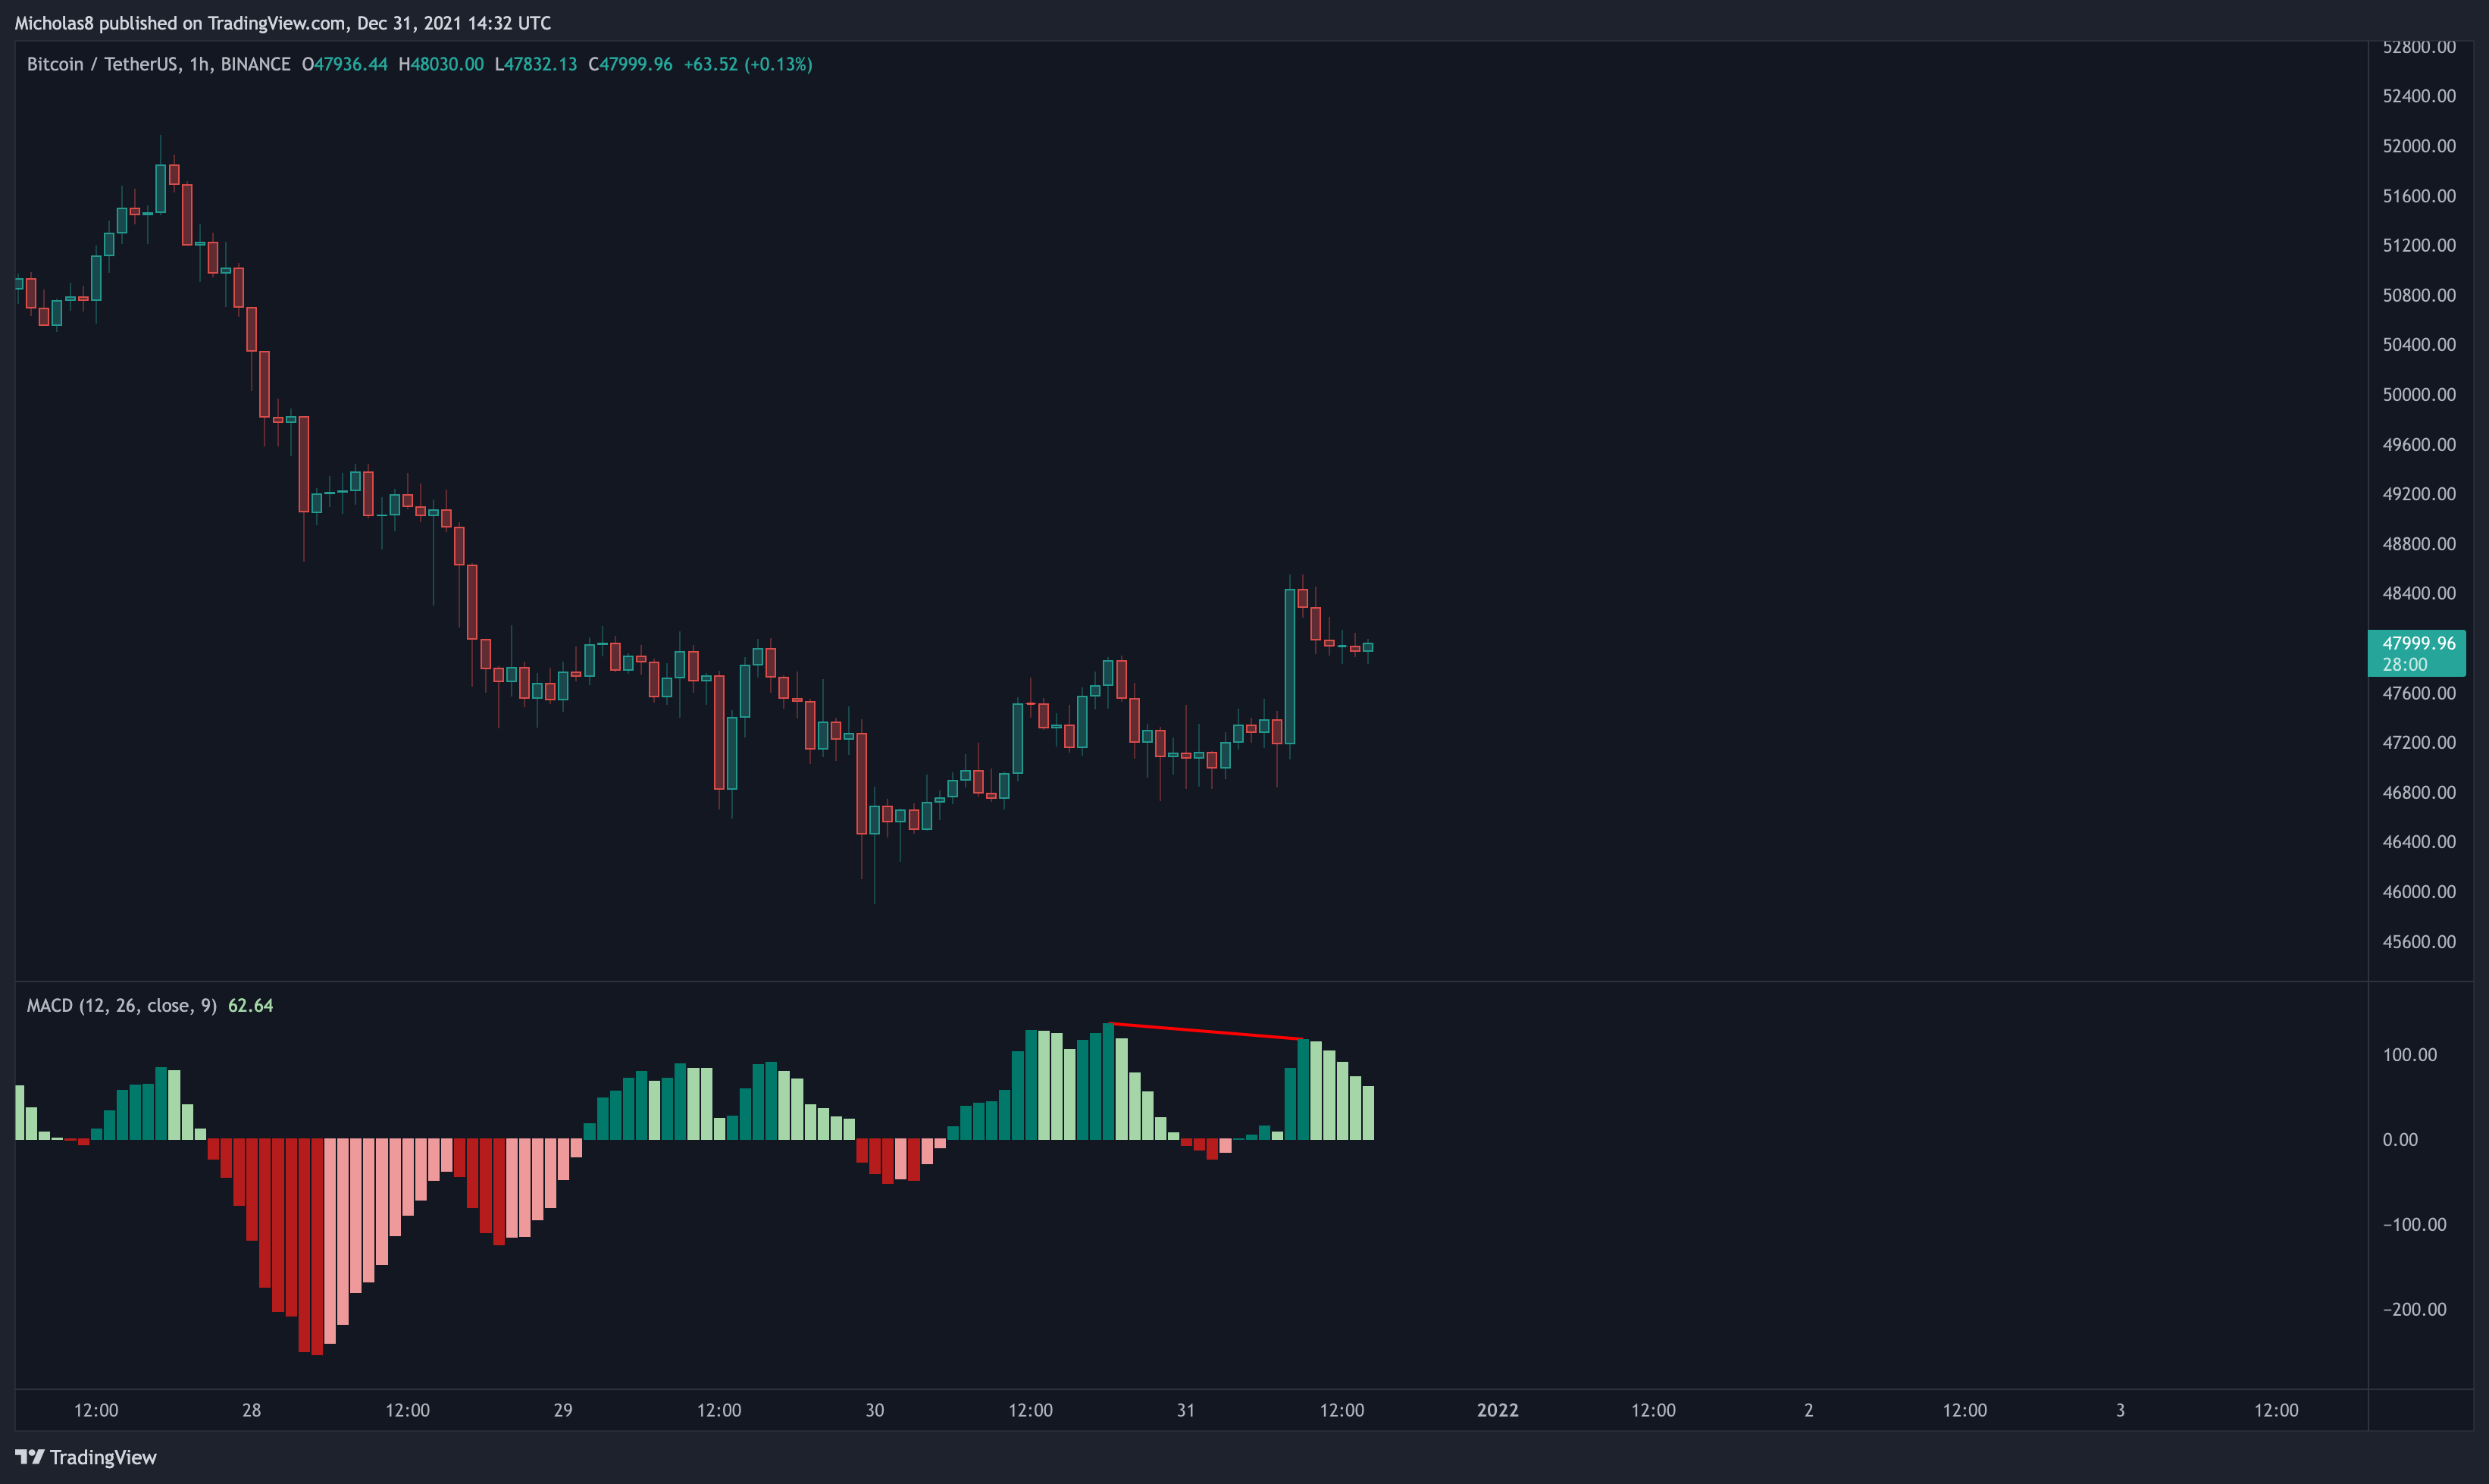
Bitcoin has a higher high in price, with a lower high in the MACD. This is a bearish divergence, which signals a possible trend reversal down.
Invalidation: Higher high in price and in the MACD.
KEY LEVELS
*recycled images as these levels haven't changed.
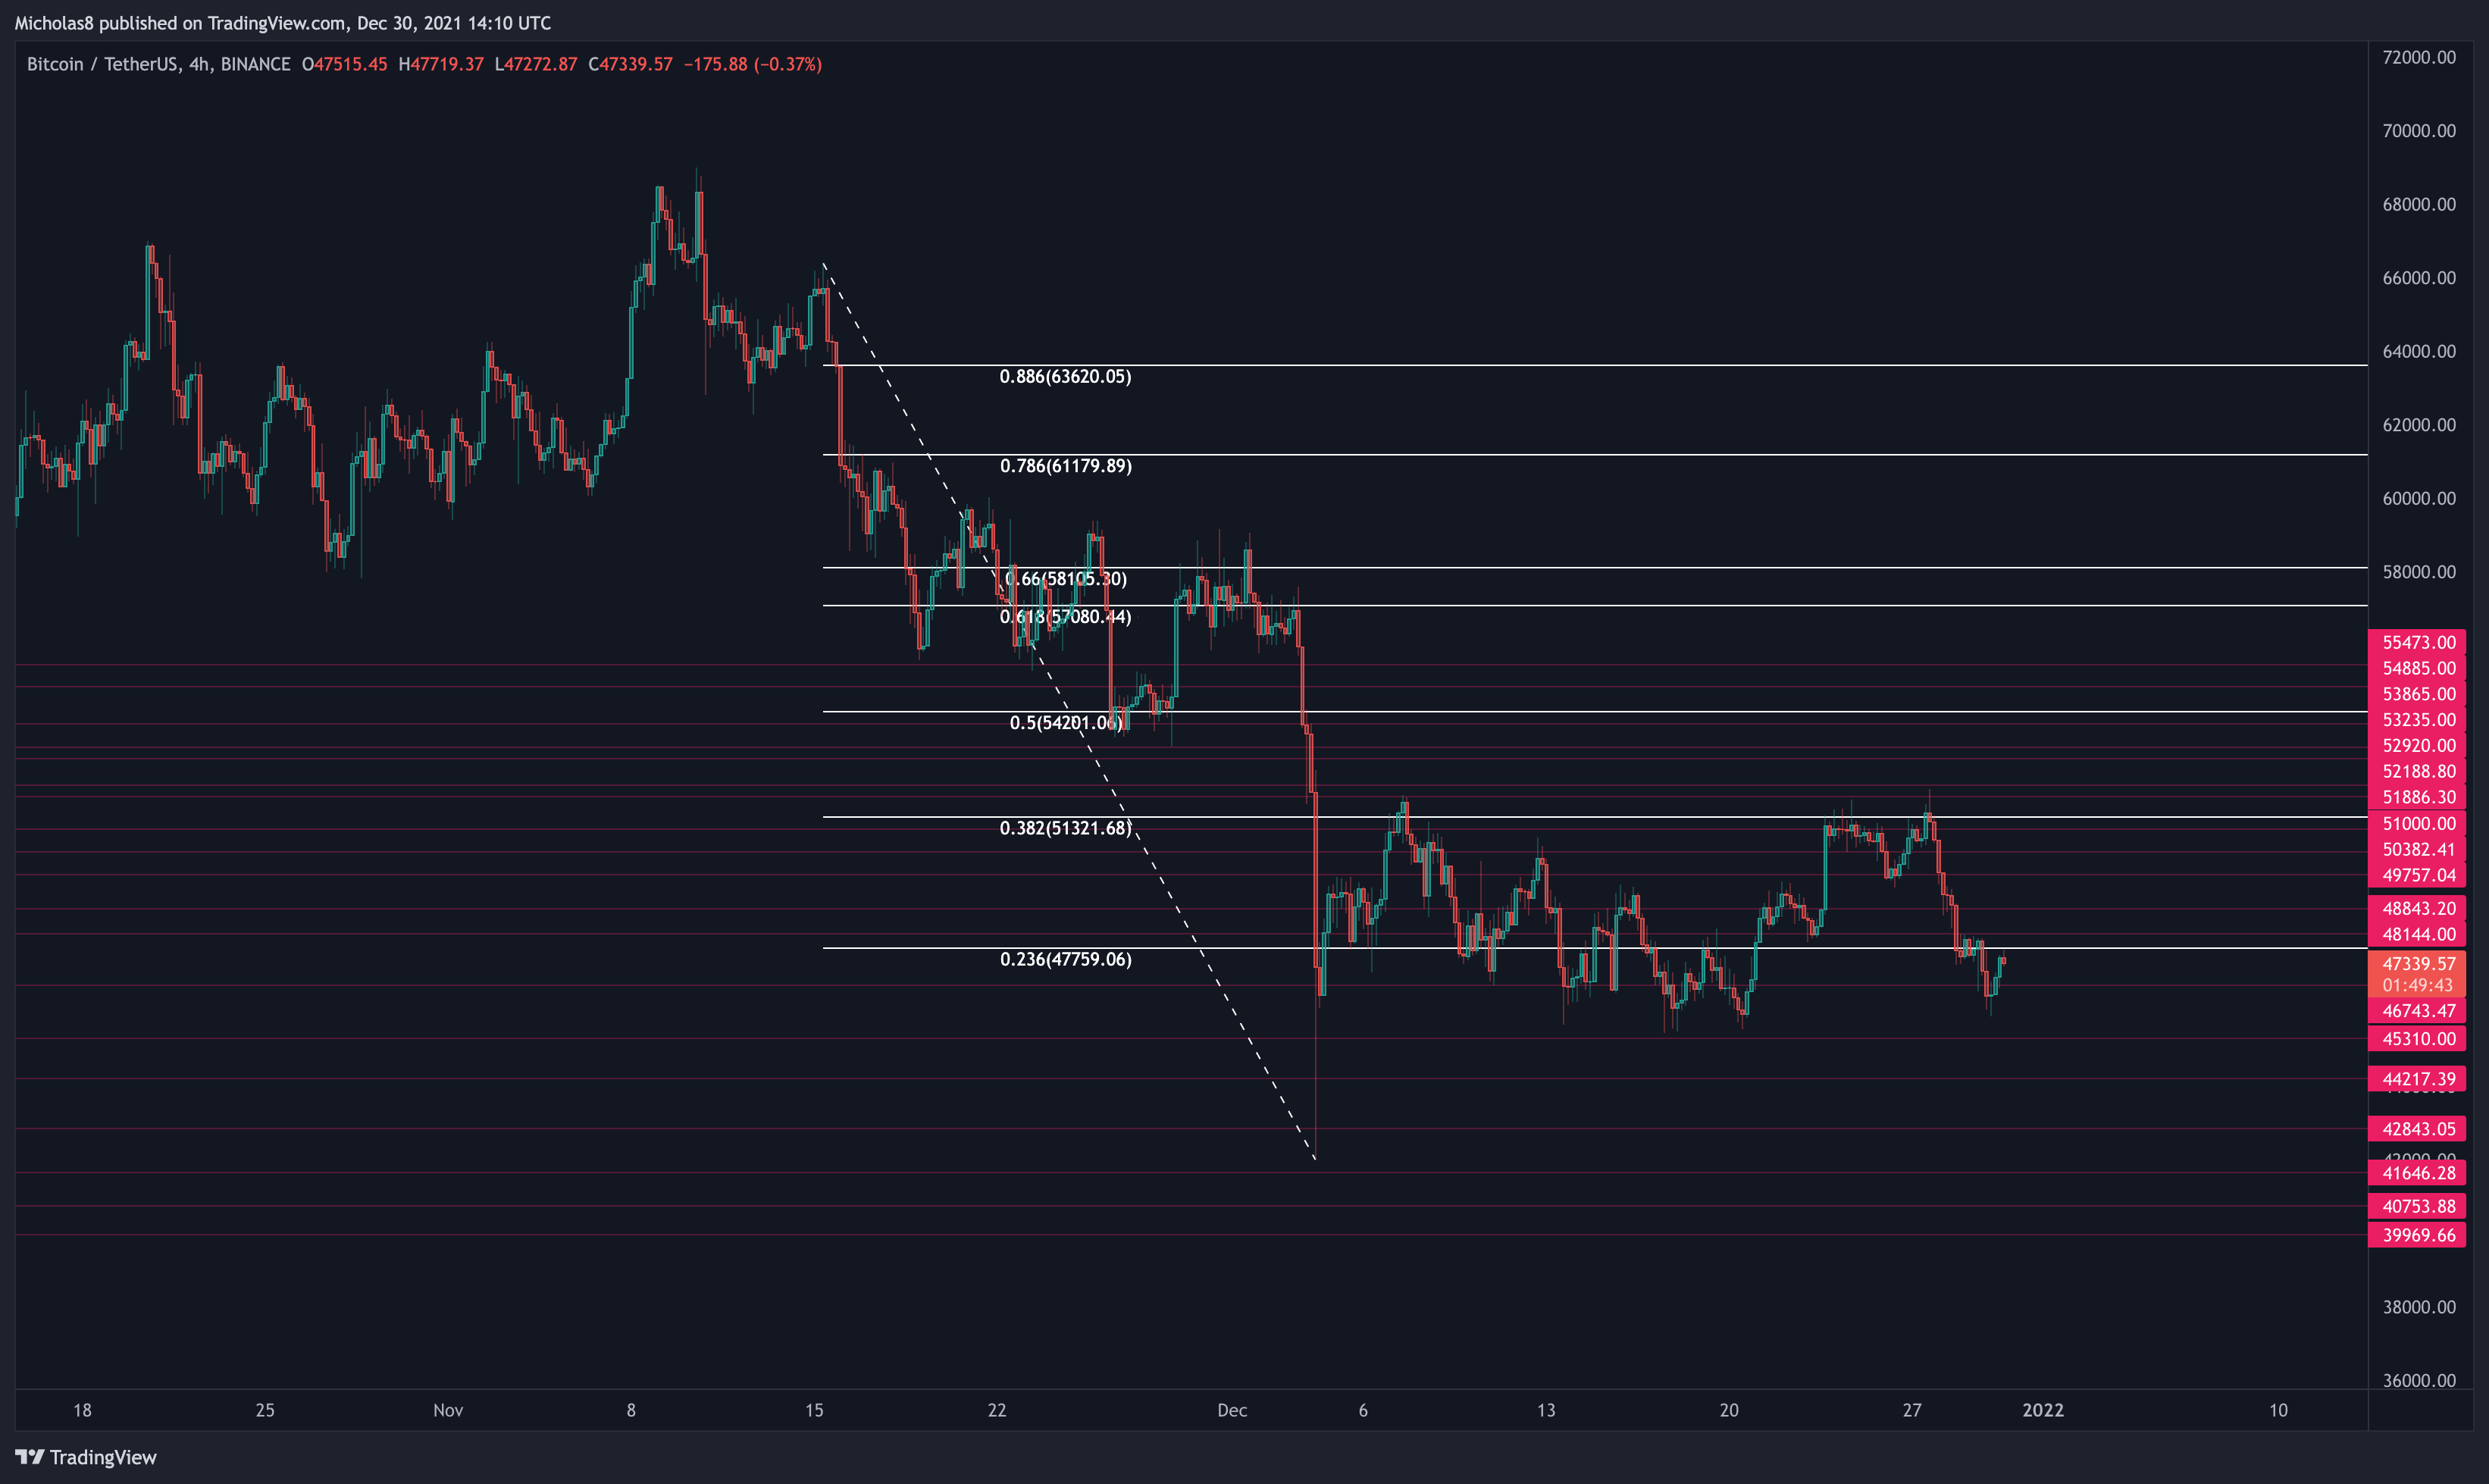
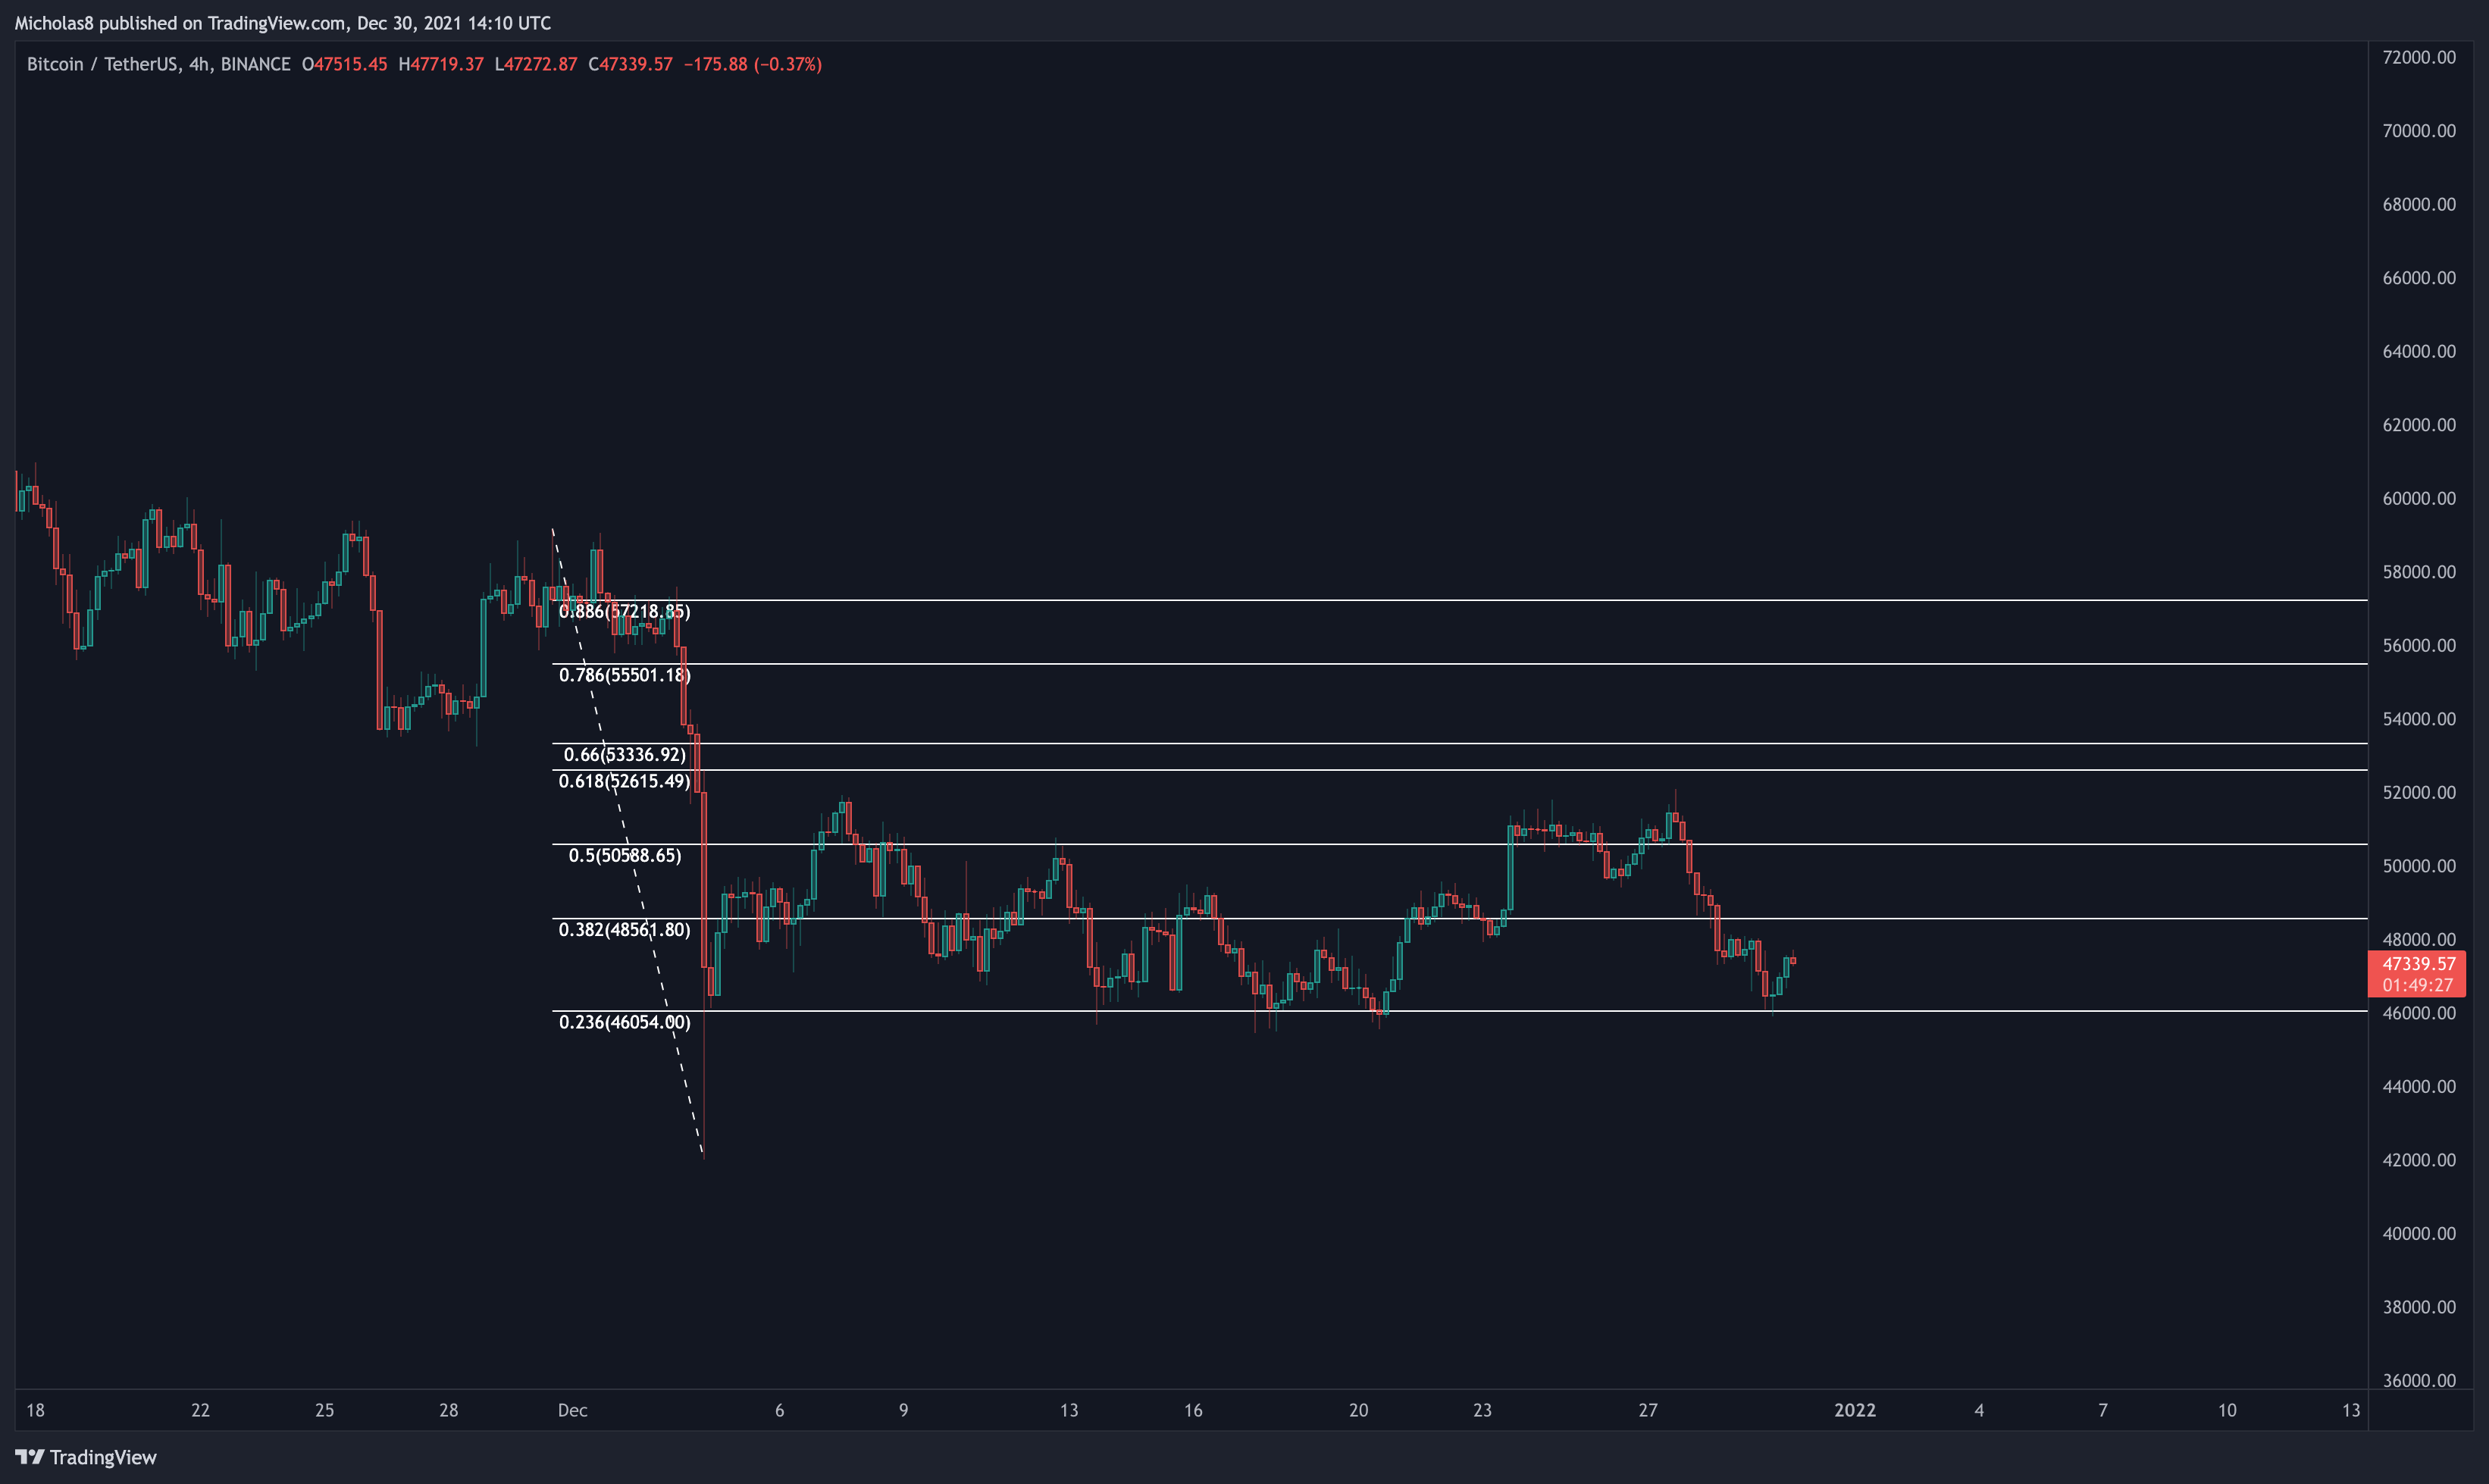
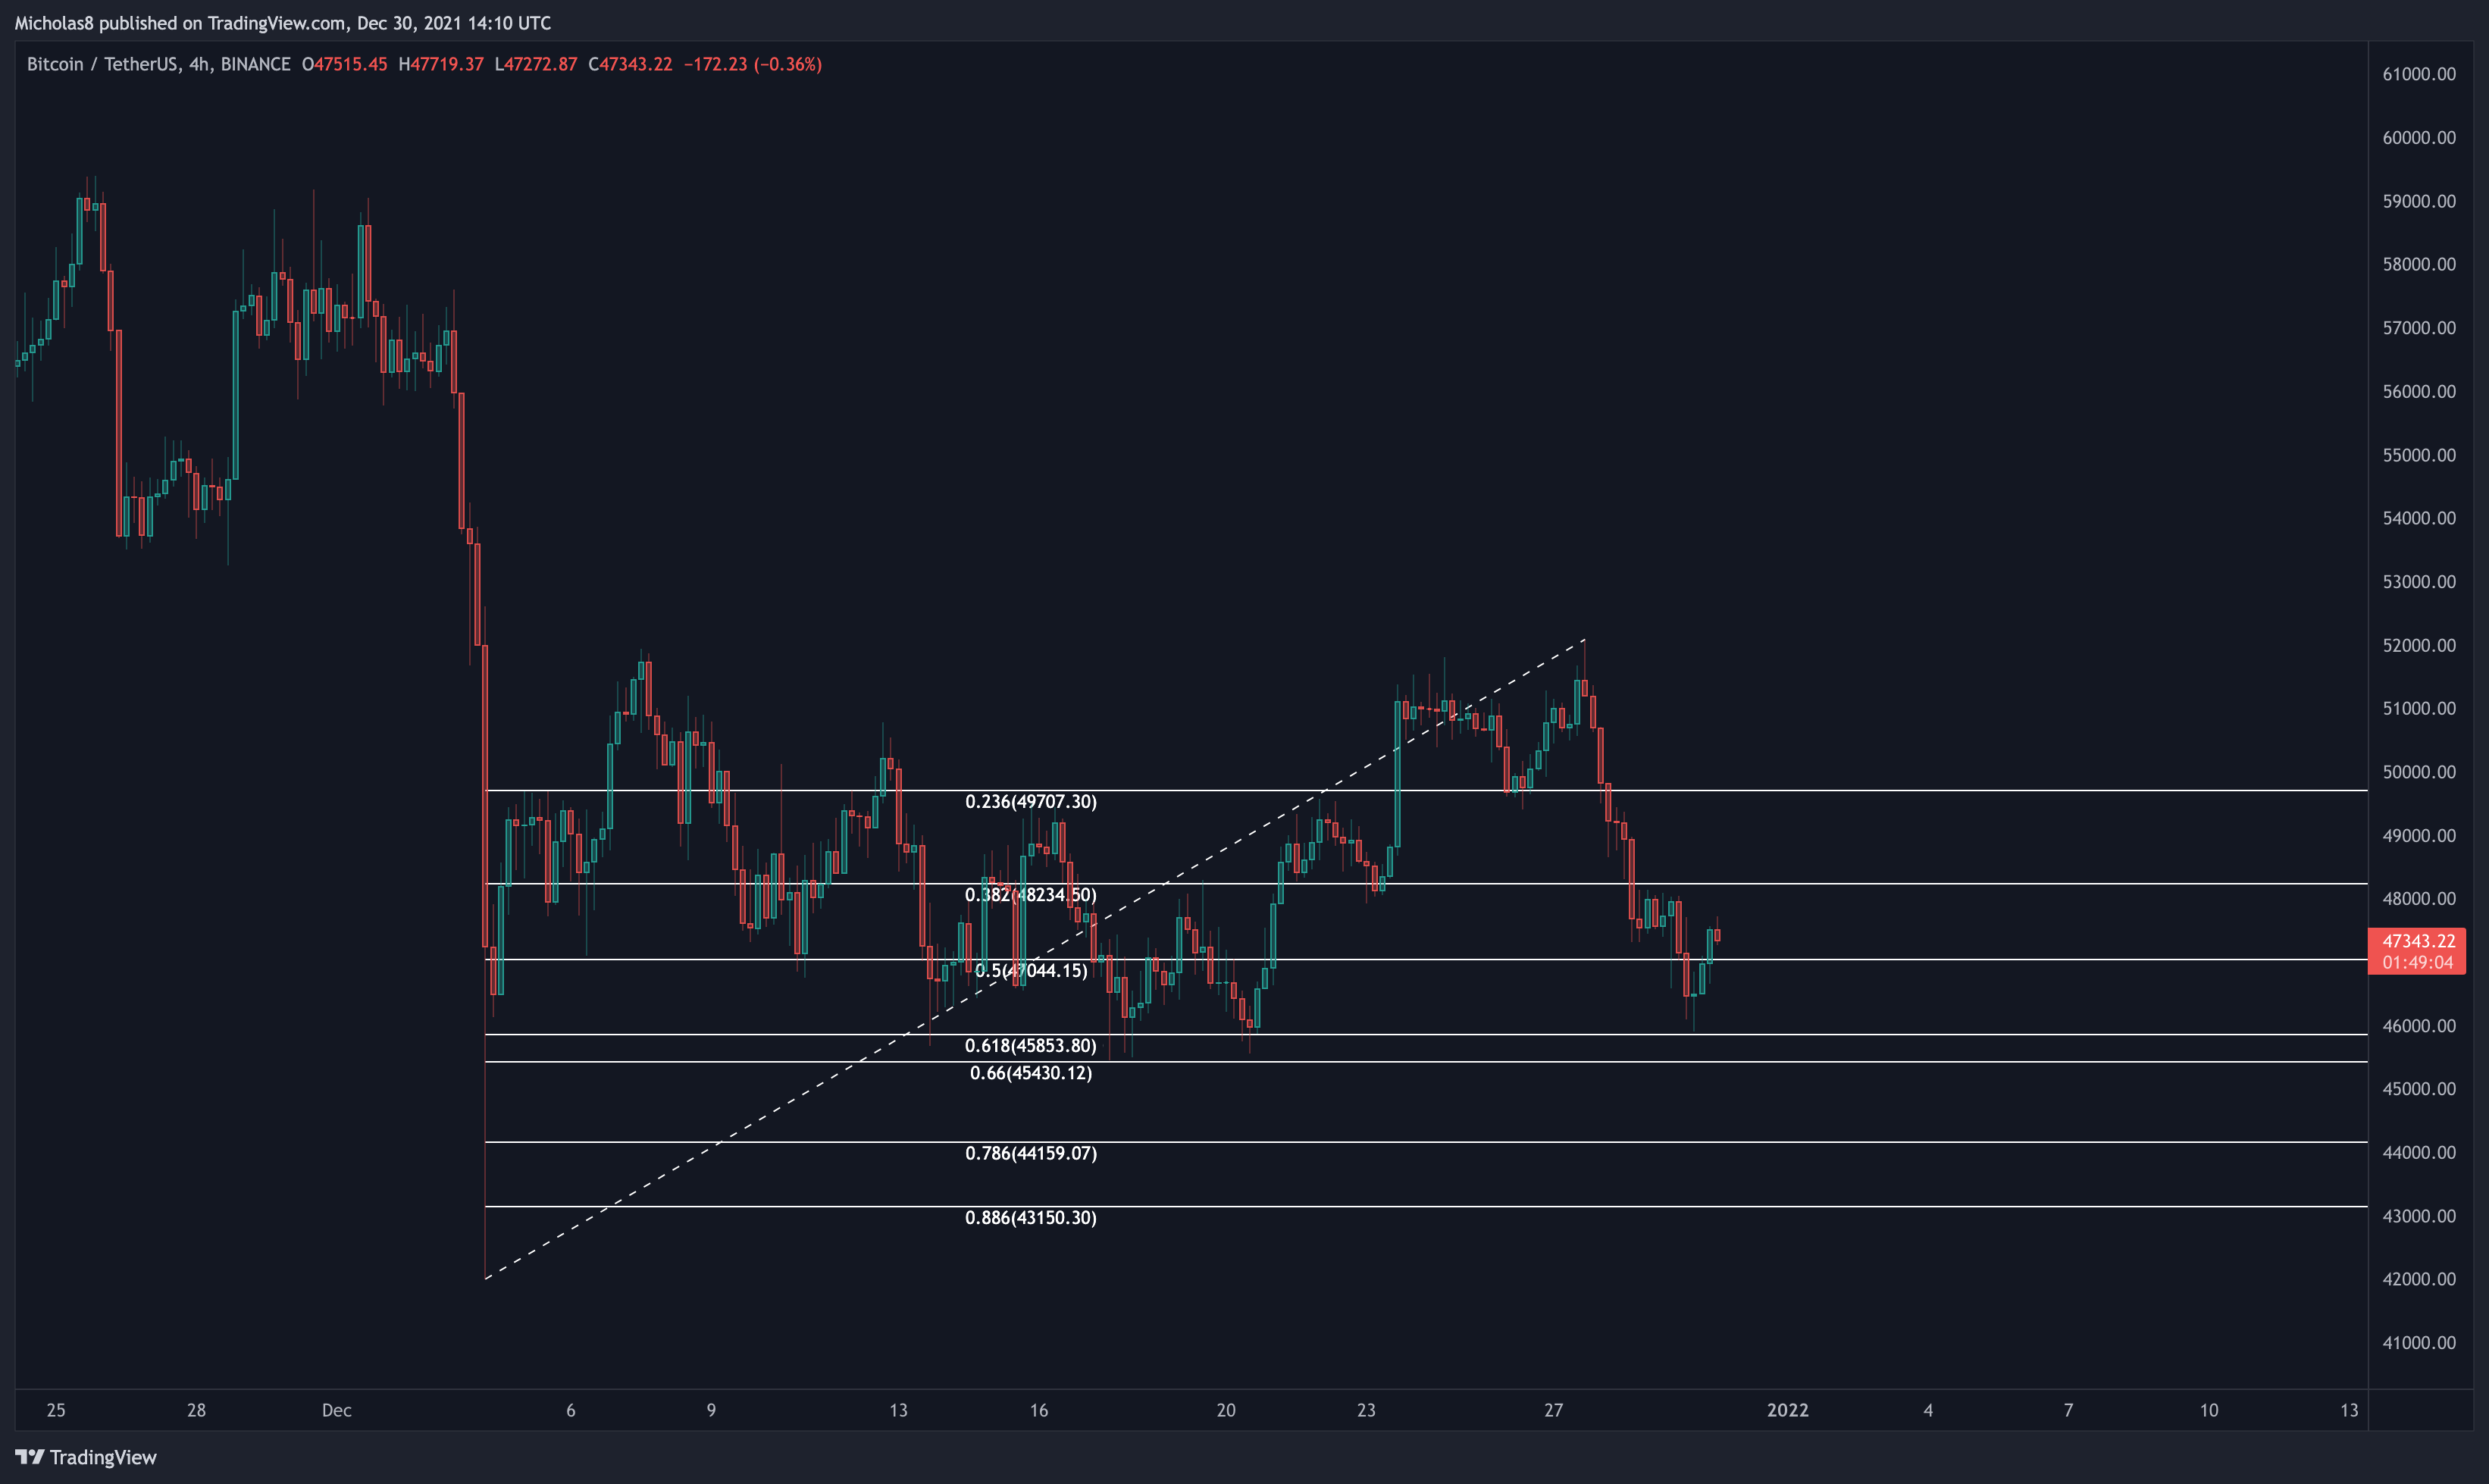
4H Timeframe
39970
40755
41645
42845
44215
45310
46745
48145
48845
49755
50380
51000
51885
52190
52829
53235
53865
54885
55473
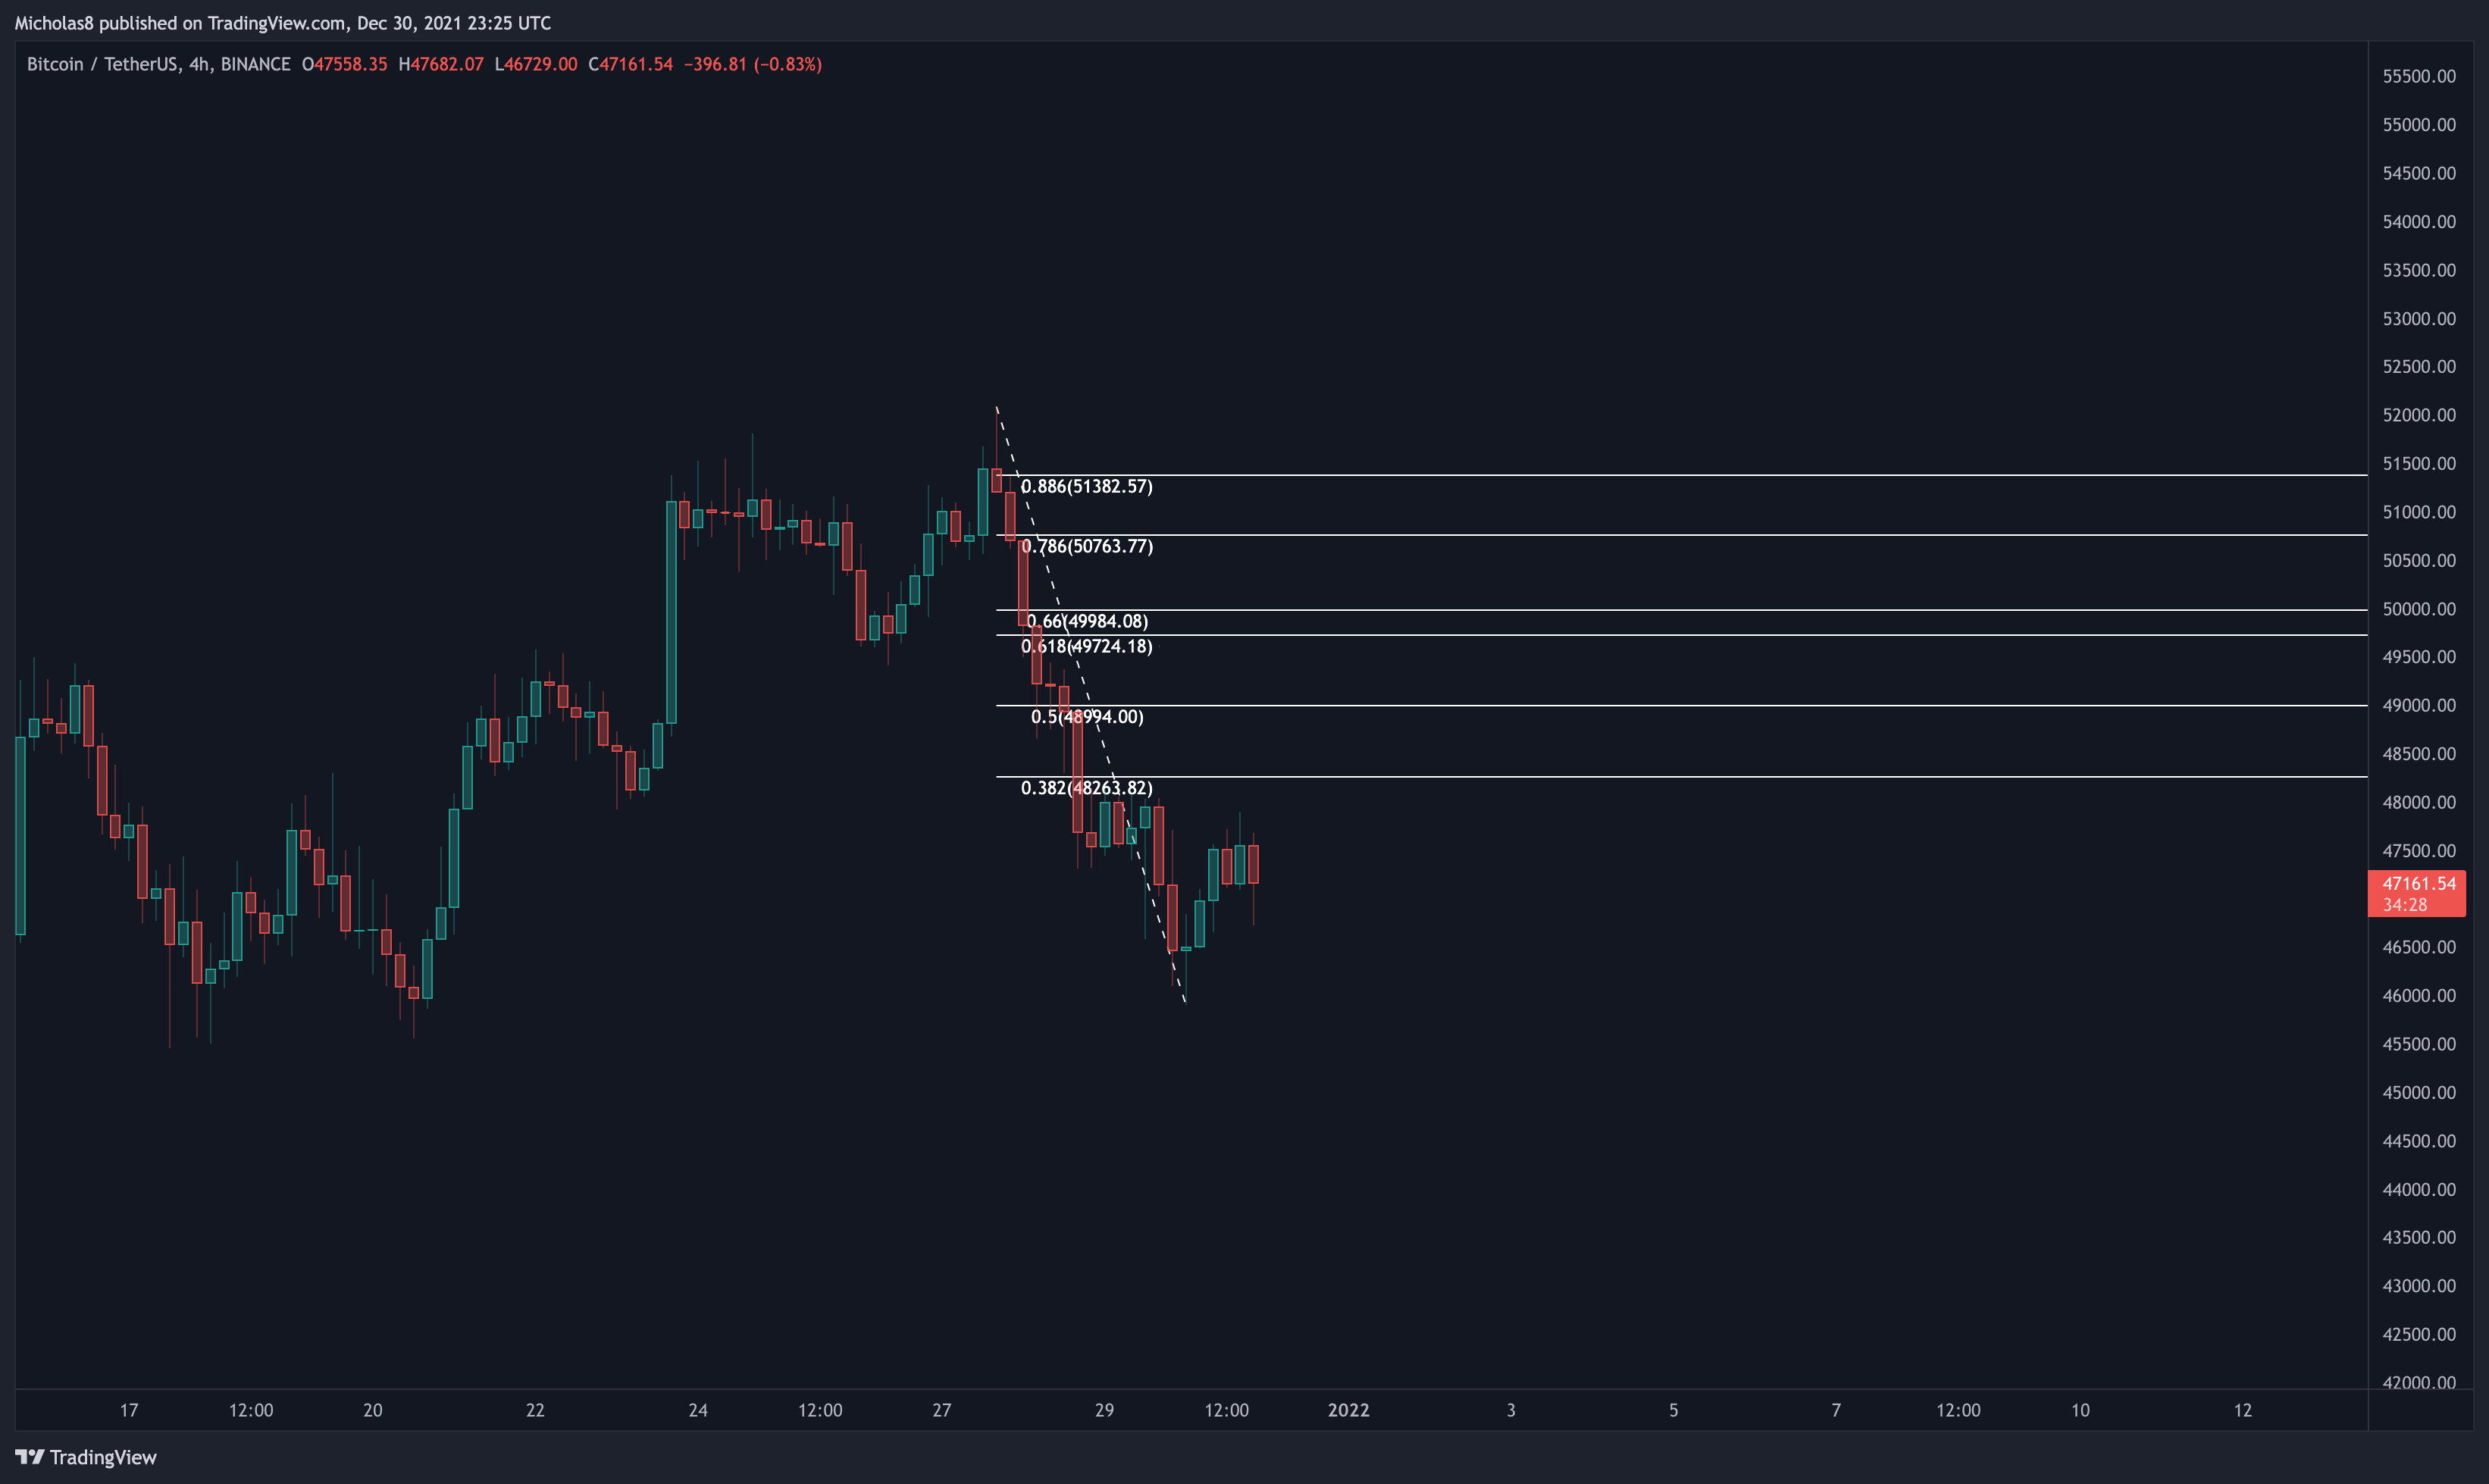
Fibonacci levels
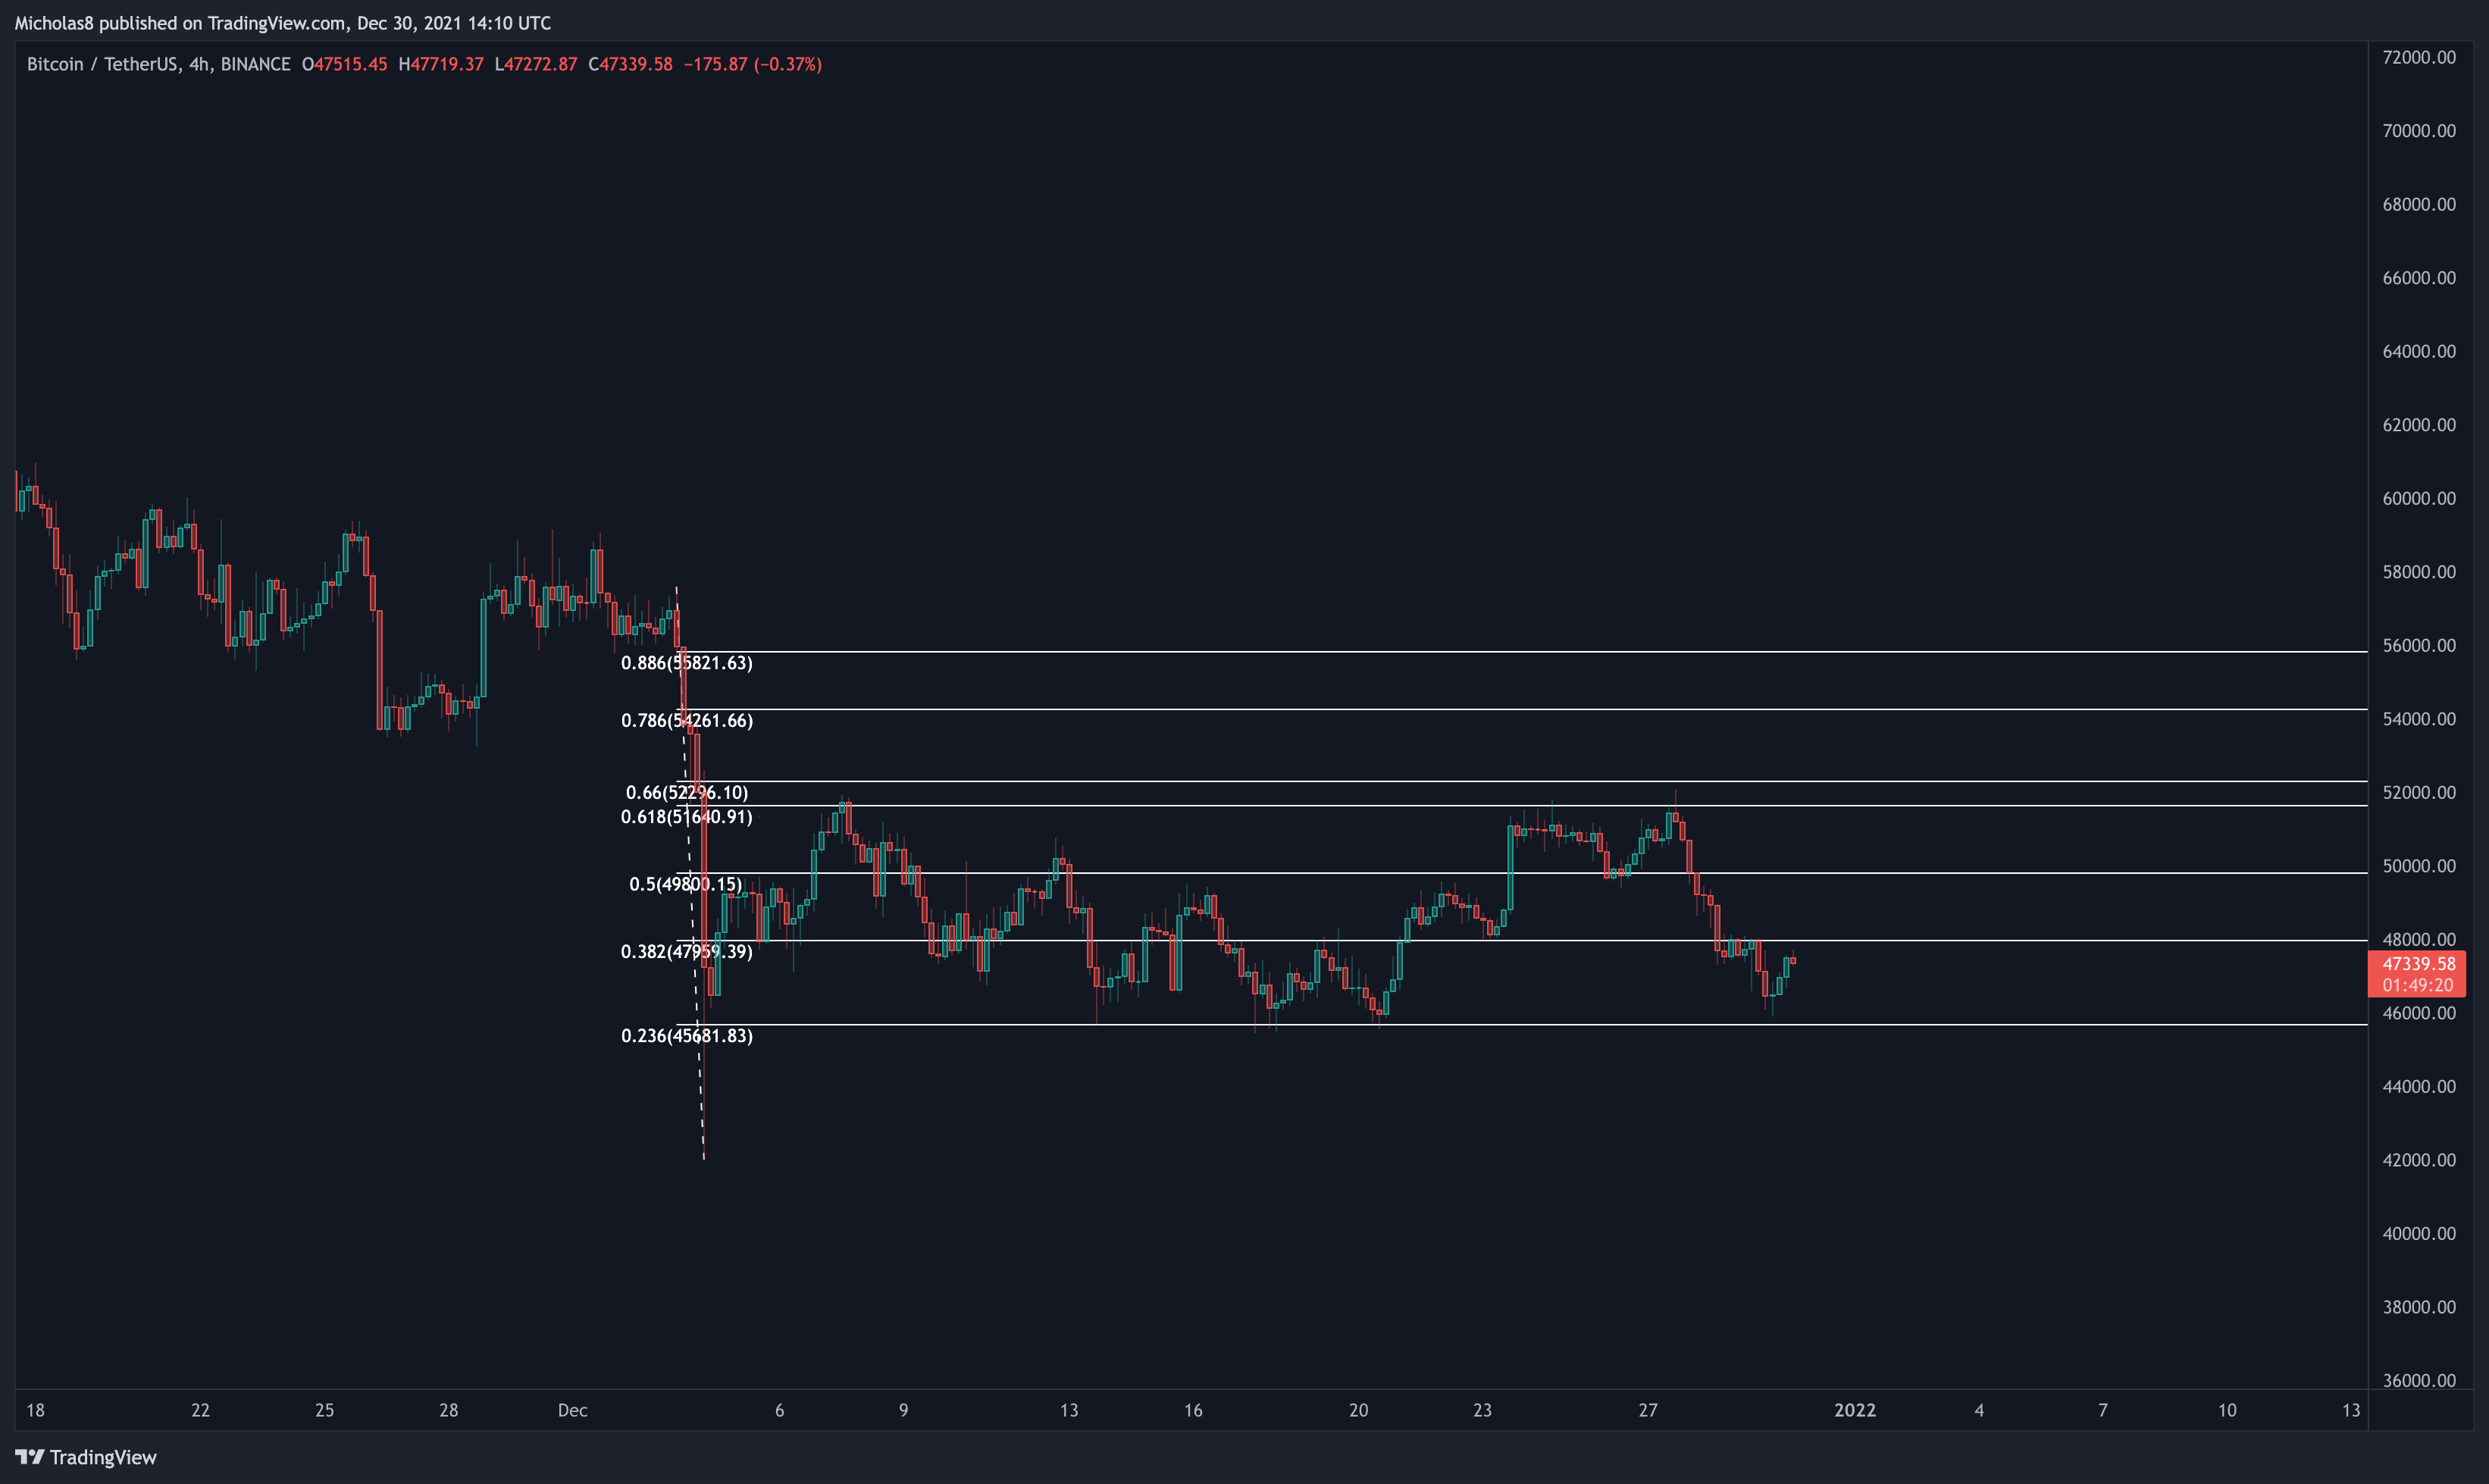
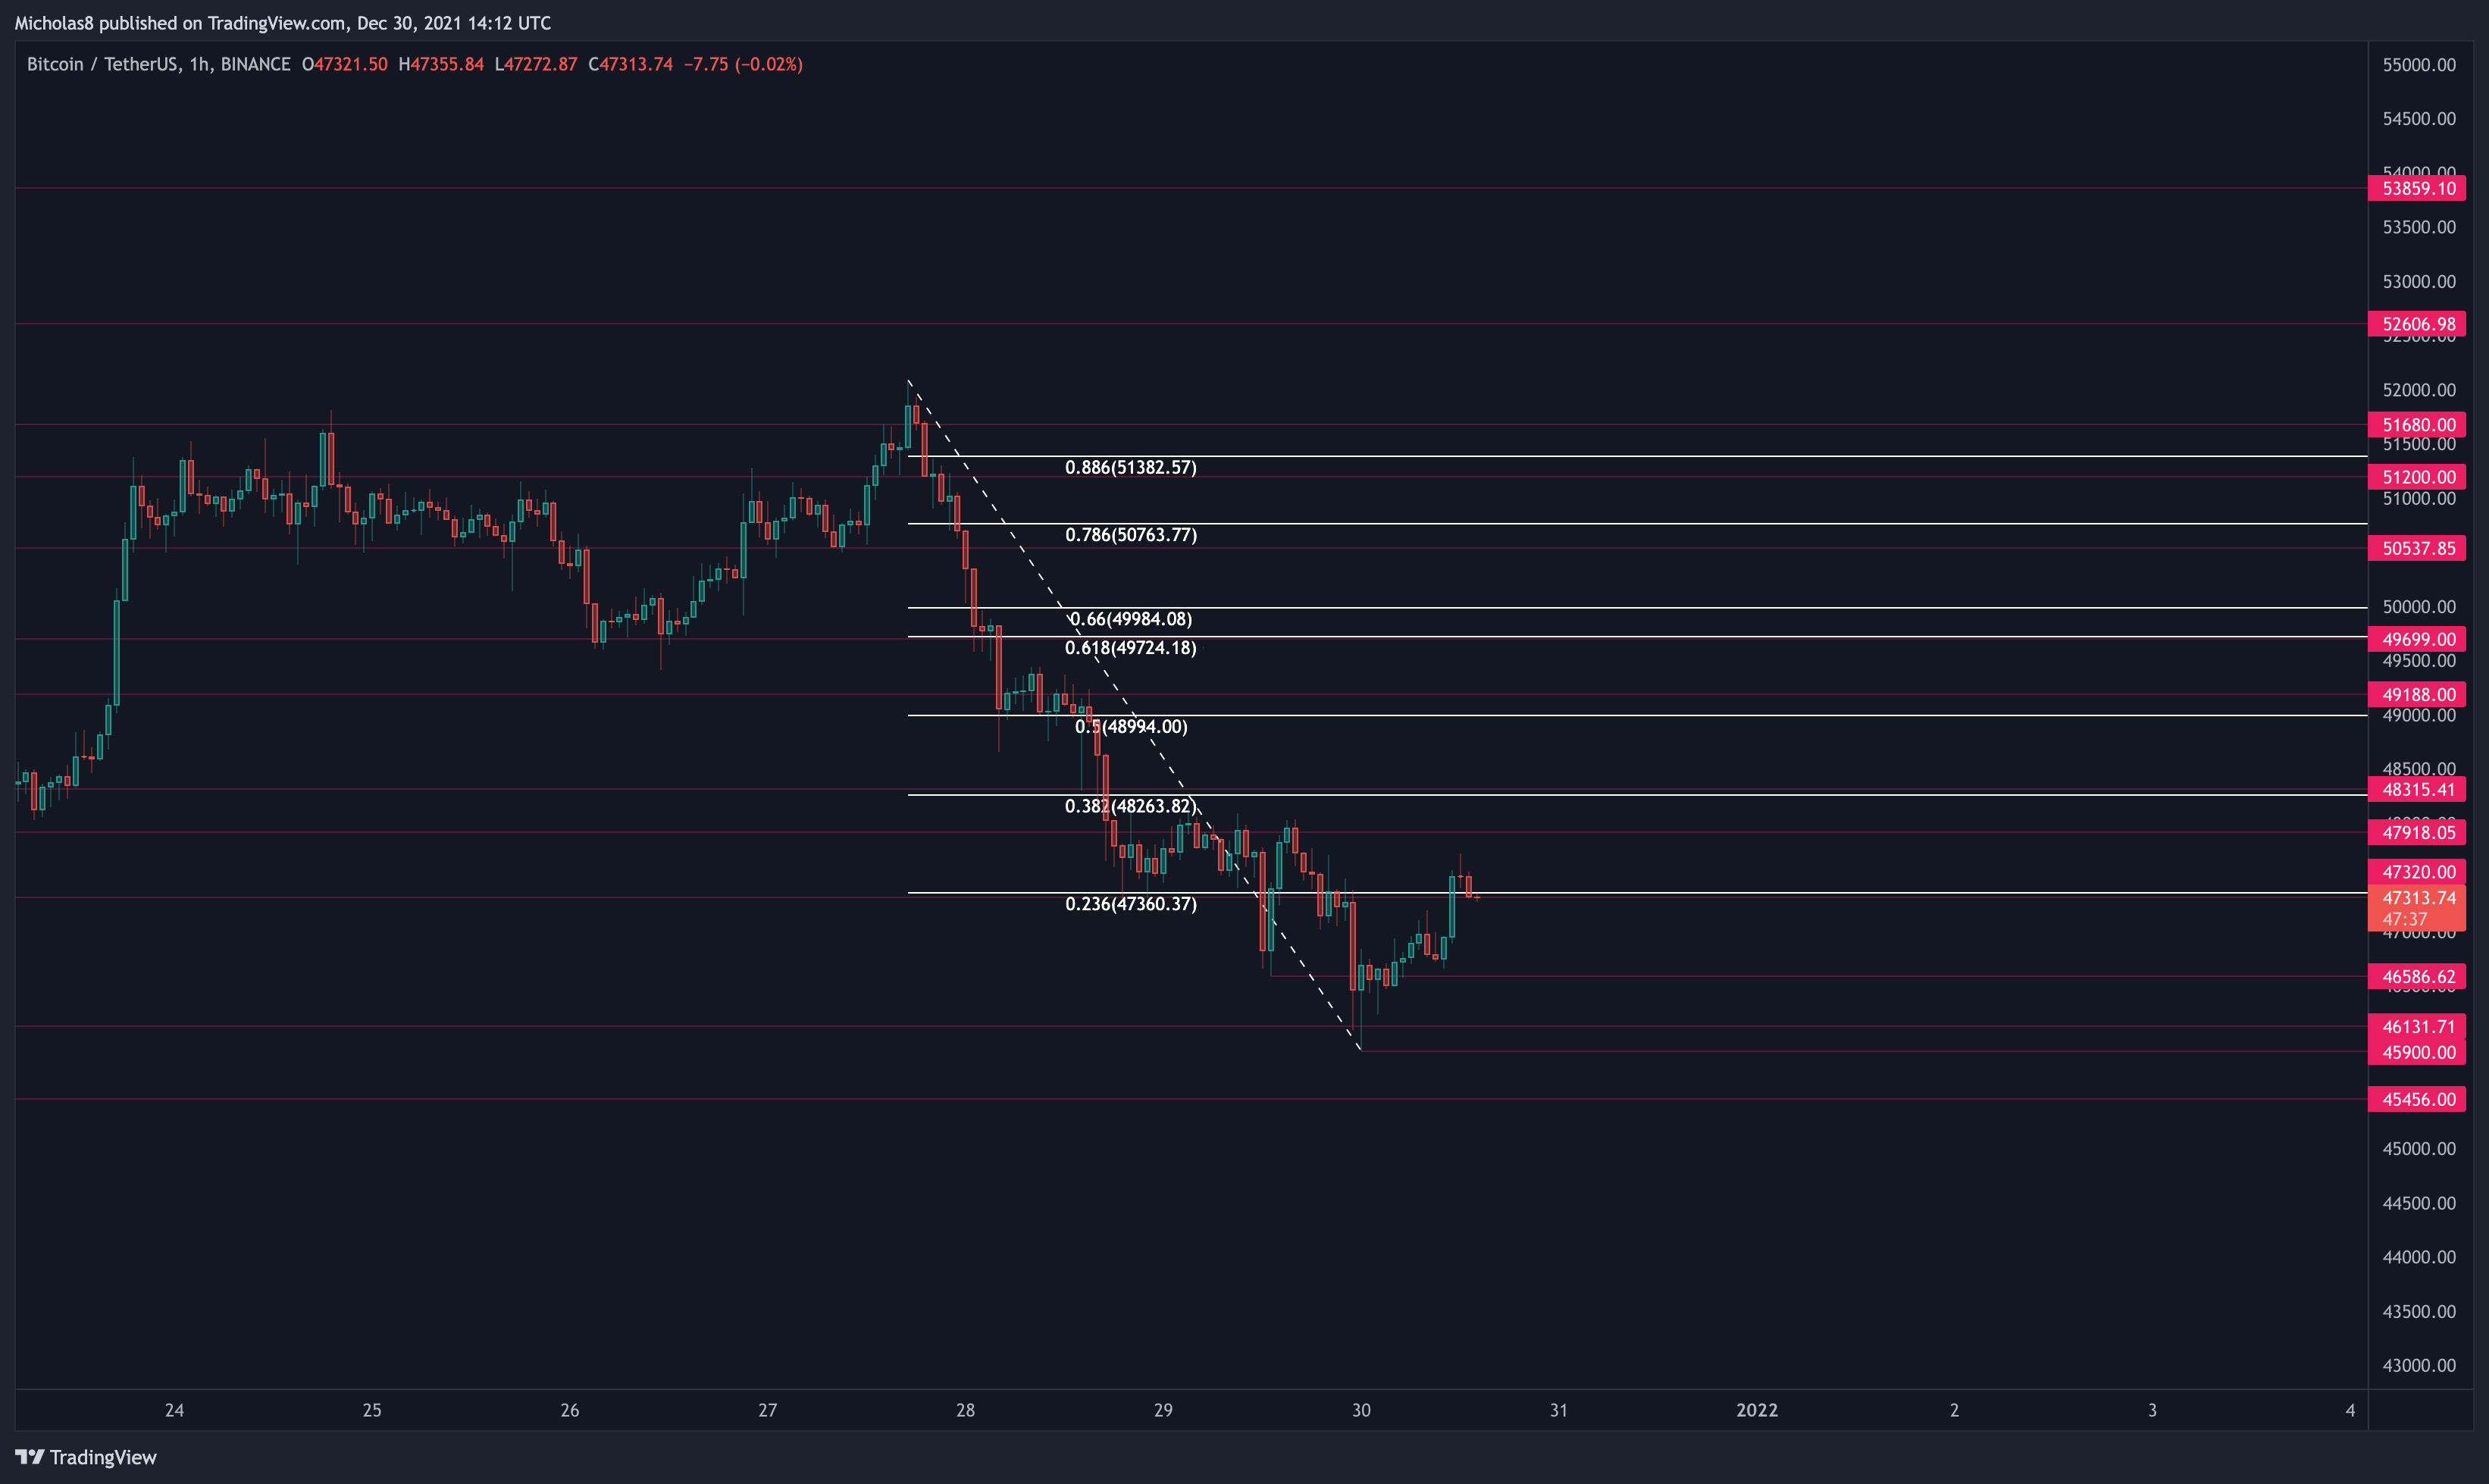
1-hour Timeframe
42000
45455
45900
46130
46585
47320
47920
48315
49190
49700
50545
51680
52605
53860
56040
57375
Fibonacci levels
FINAL THOUGHTS
RECAP FROM LAST NIGHT
Bitcoin remains range bound.
And also still has a bearish market structure on the LTFs. Alongside this technical, the bearish divergences are still in play. Until we can create a meaningful higher high or convincing higher low, it's reasonable to expect this trend to continue.
The levels below we discussed over the last few days/weeks are still in play.
And the same for the levels above.
All in all, Bitcoin remains in the same position as it's been on a macro level. As we've been saying over the last few weeks, this period of consolidation/correction will likely take weeks if not months before a concrete decision is made by the market. Whether that's to the upside or downside remains to be seen. But, ranges are areas where many, many traders get chopped up by overtrading. In these conditions, it's best to either stay out, or brush up on your TA and learn how to trade with a high degree of certainty. This is not the time to take your eyes off the market! There are tons of profitable trades to be had.
Friendly reminder to remain level-headed! Even if we do see a meaningful move to the upside sooner rather than later, there's still the possibility that it may be a dead cat bounce. Weekly/Monthly divergences are very significant for the macro outlook of an asset if they aren't invalidated.
THIS MORNING
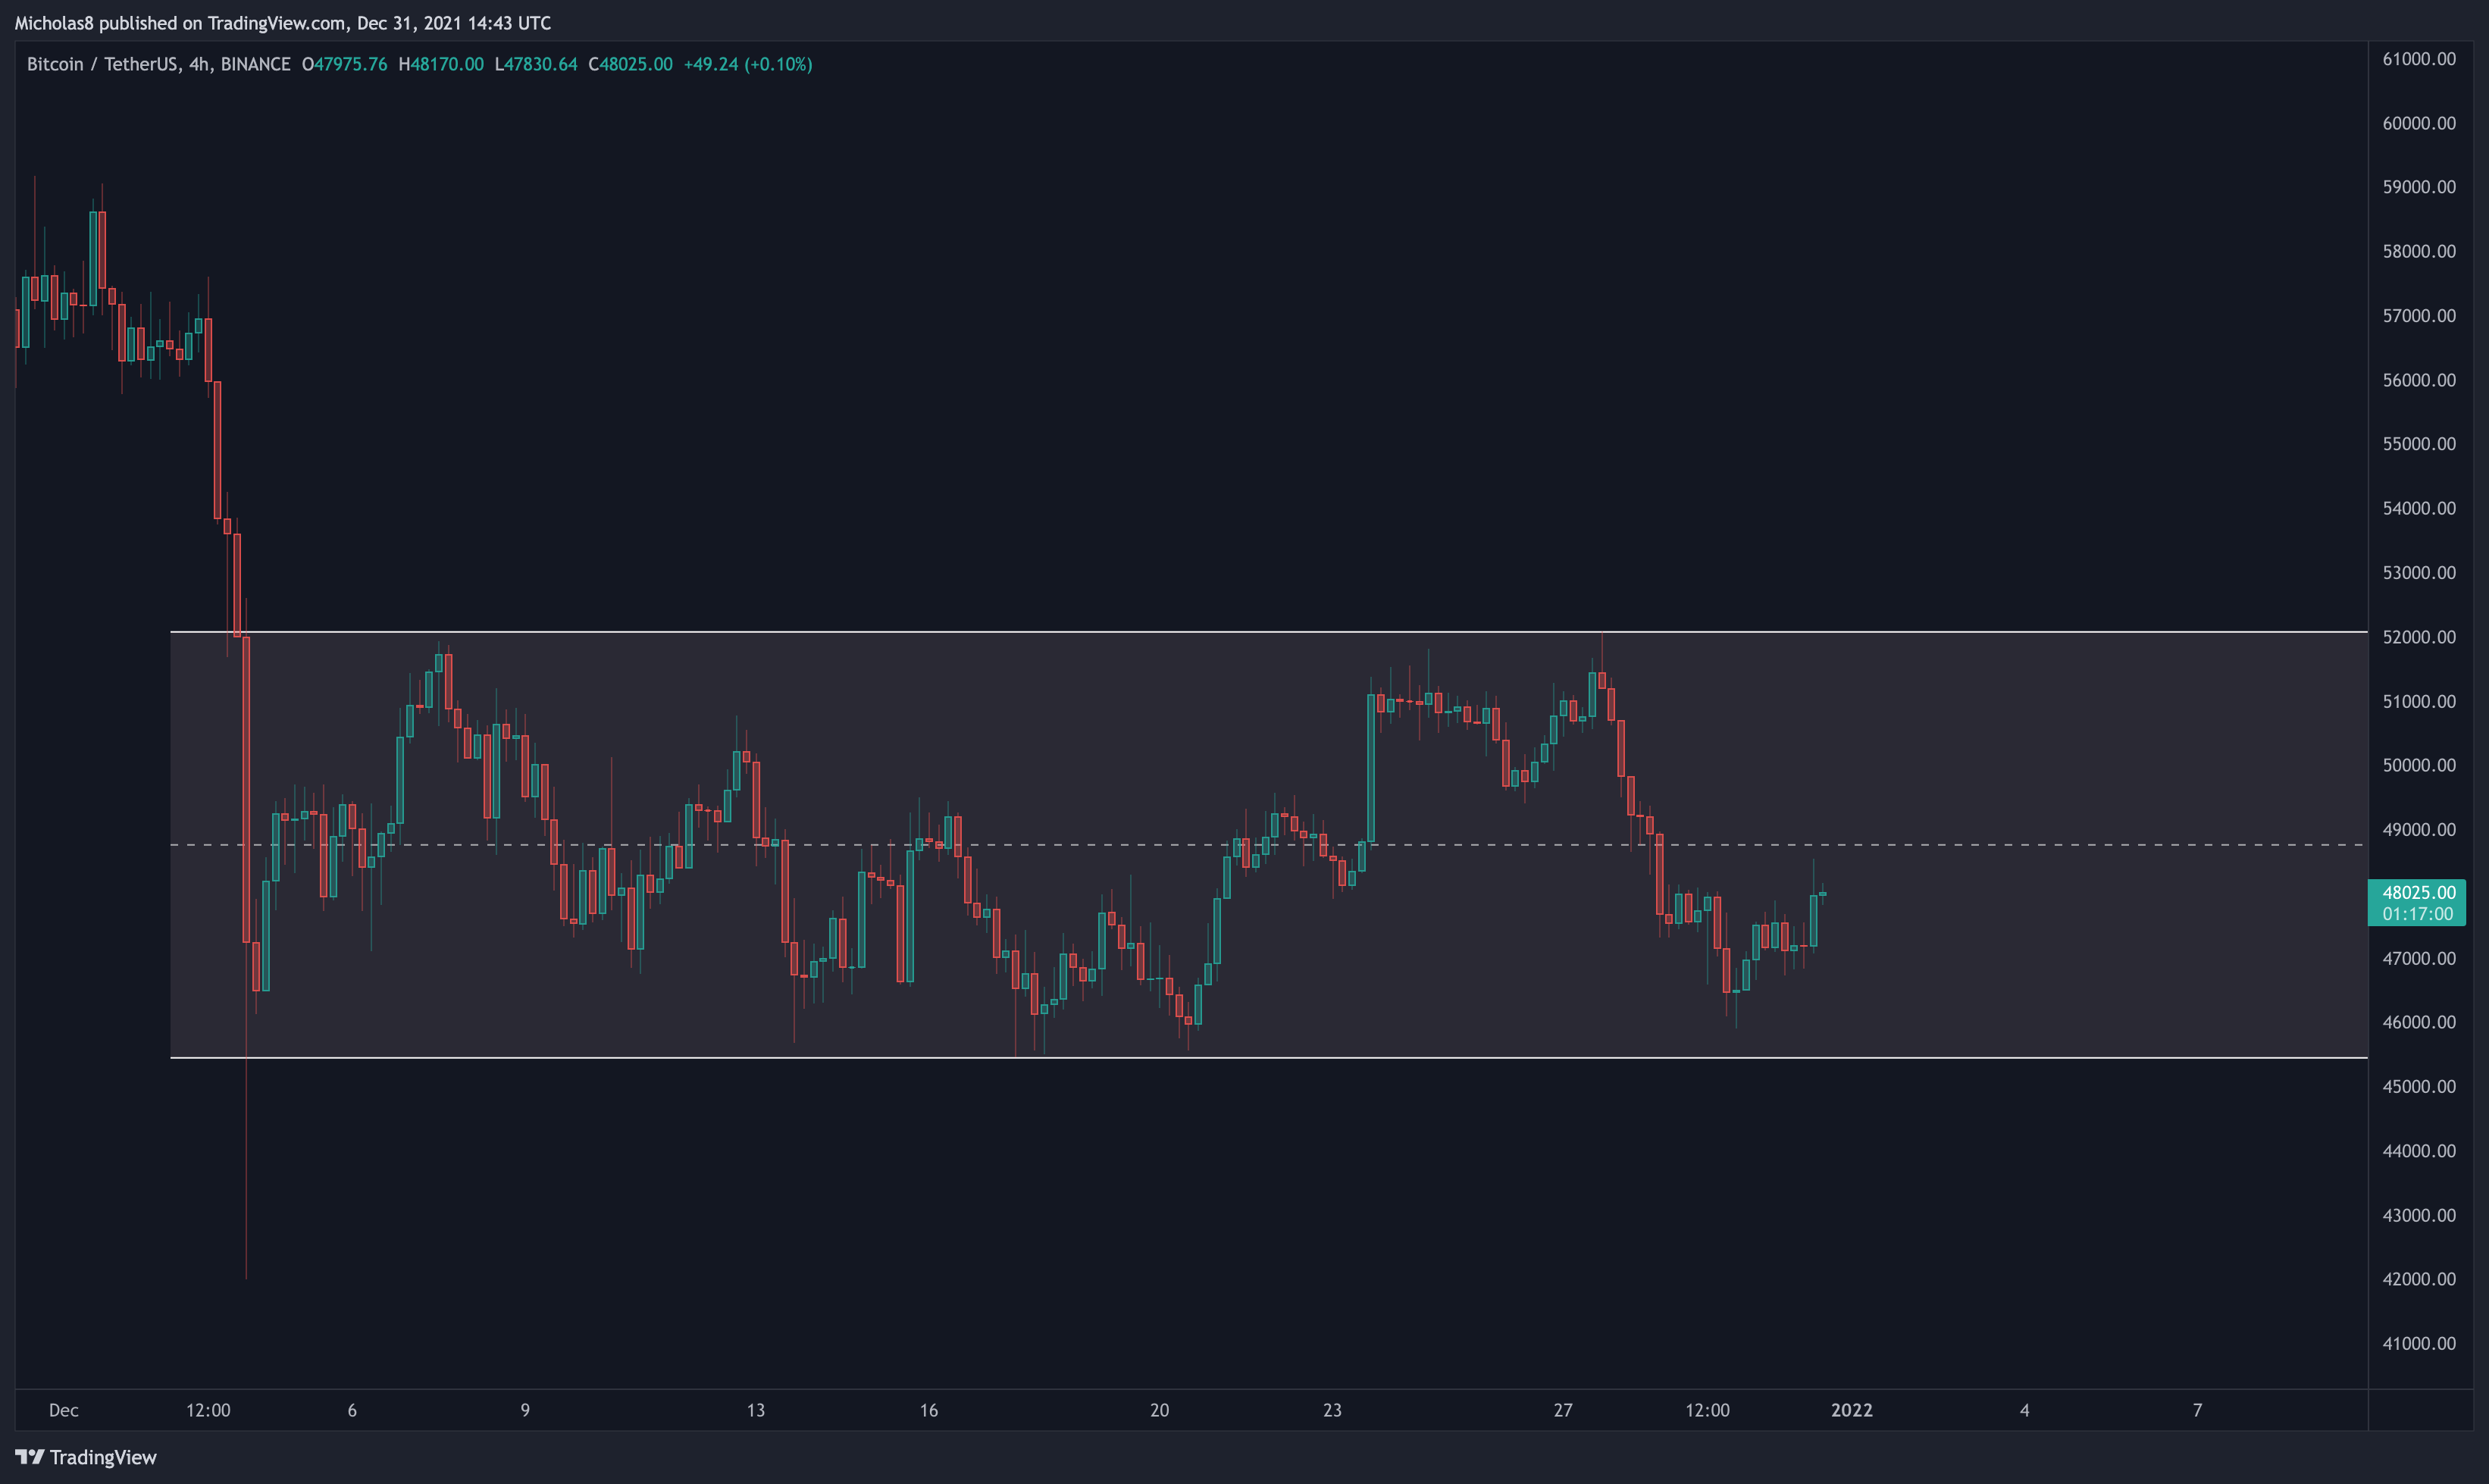
Bitcoin continues to trade within our sideways range. As we know, assets tend to range much longer than most expect. This unfortunately leads to inexperienced traders being chopped left and right as they long the highs, and short the lows.
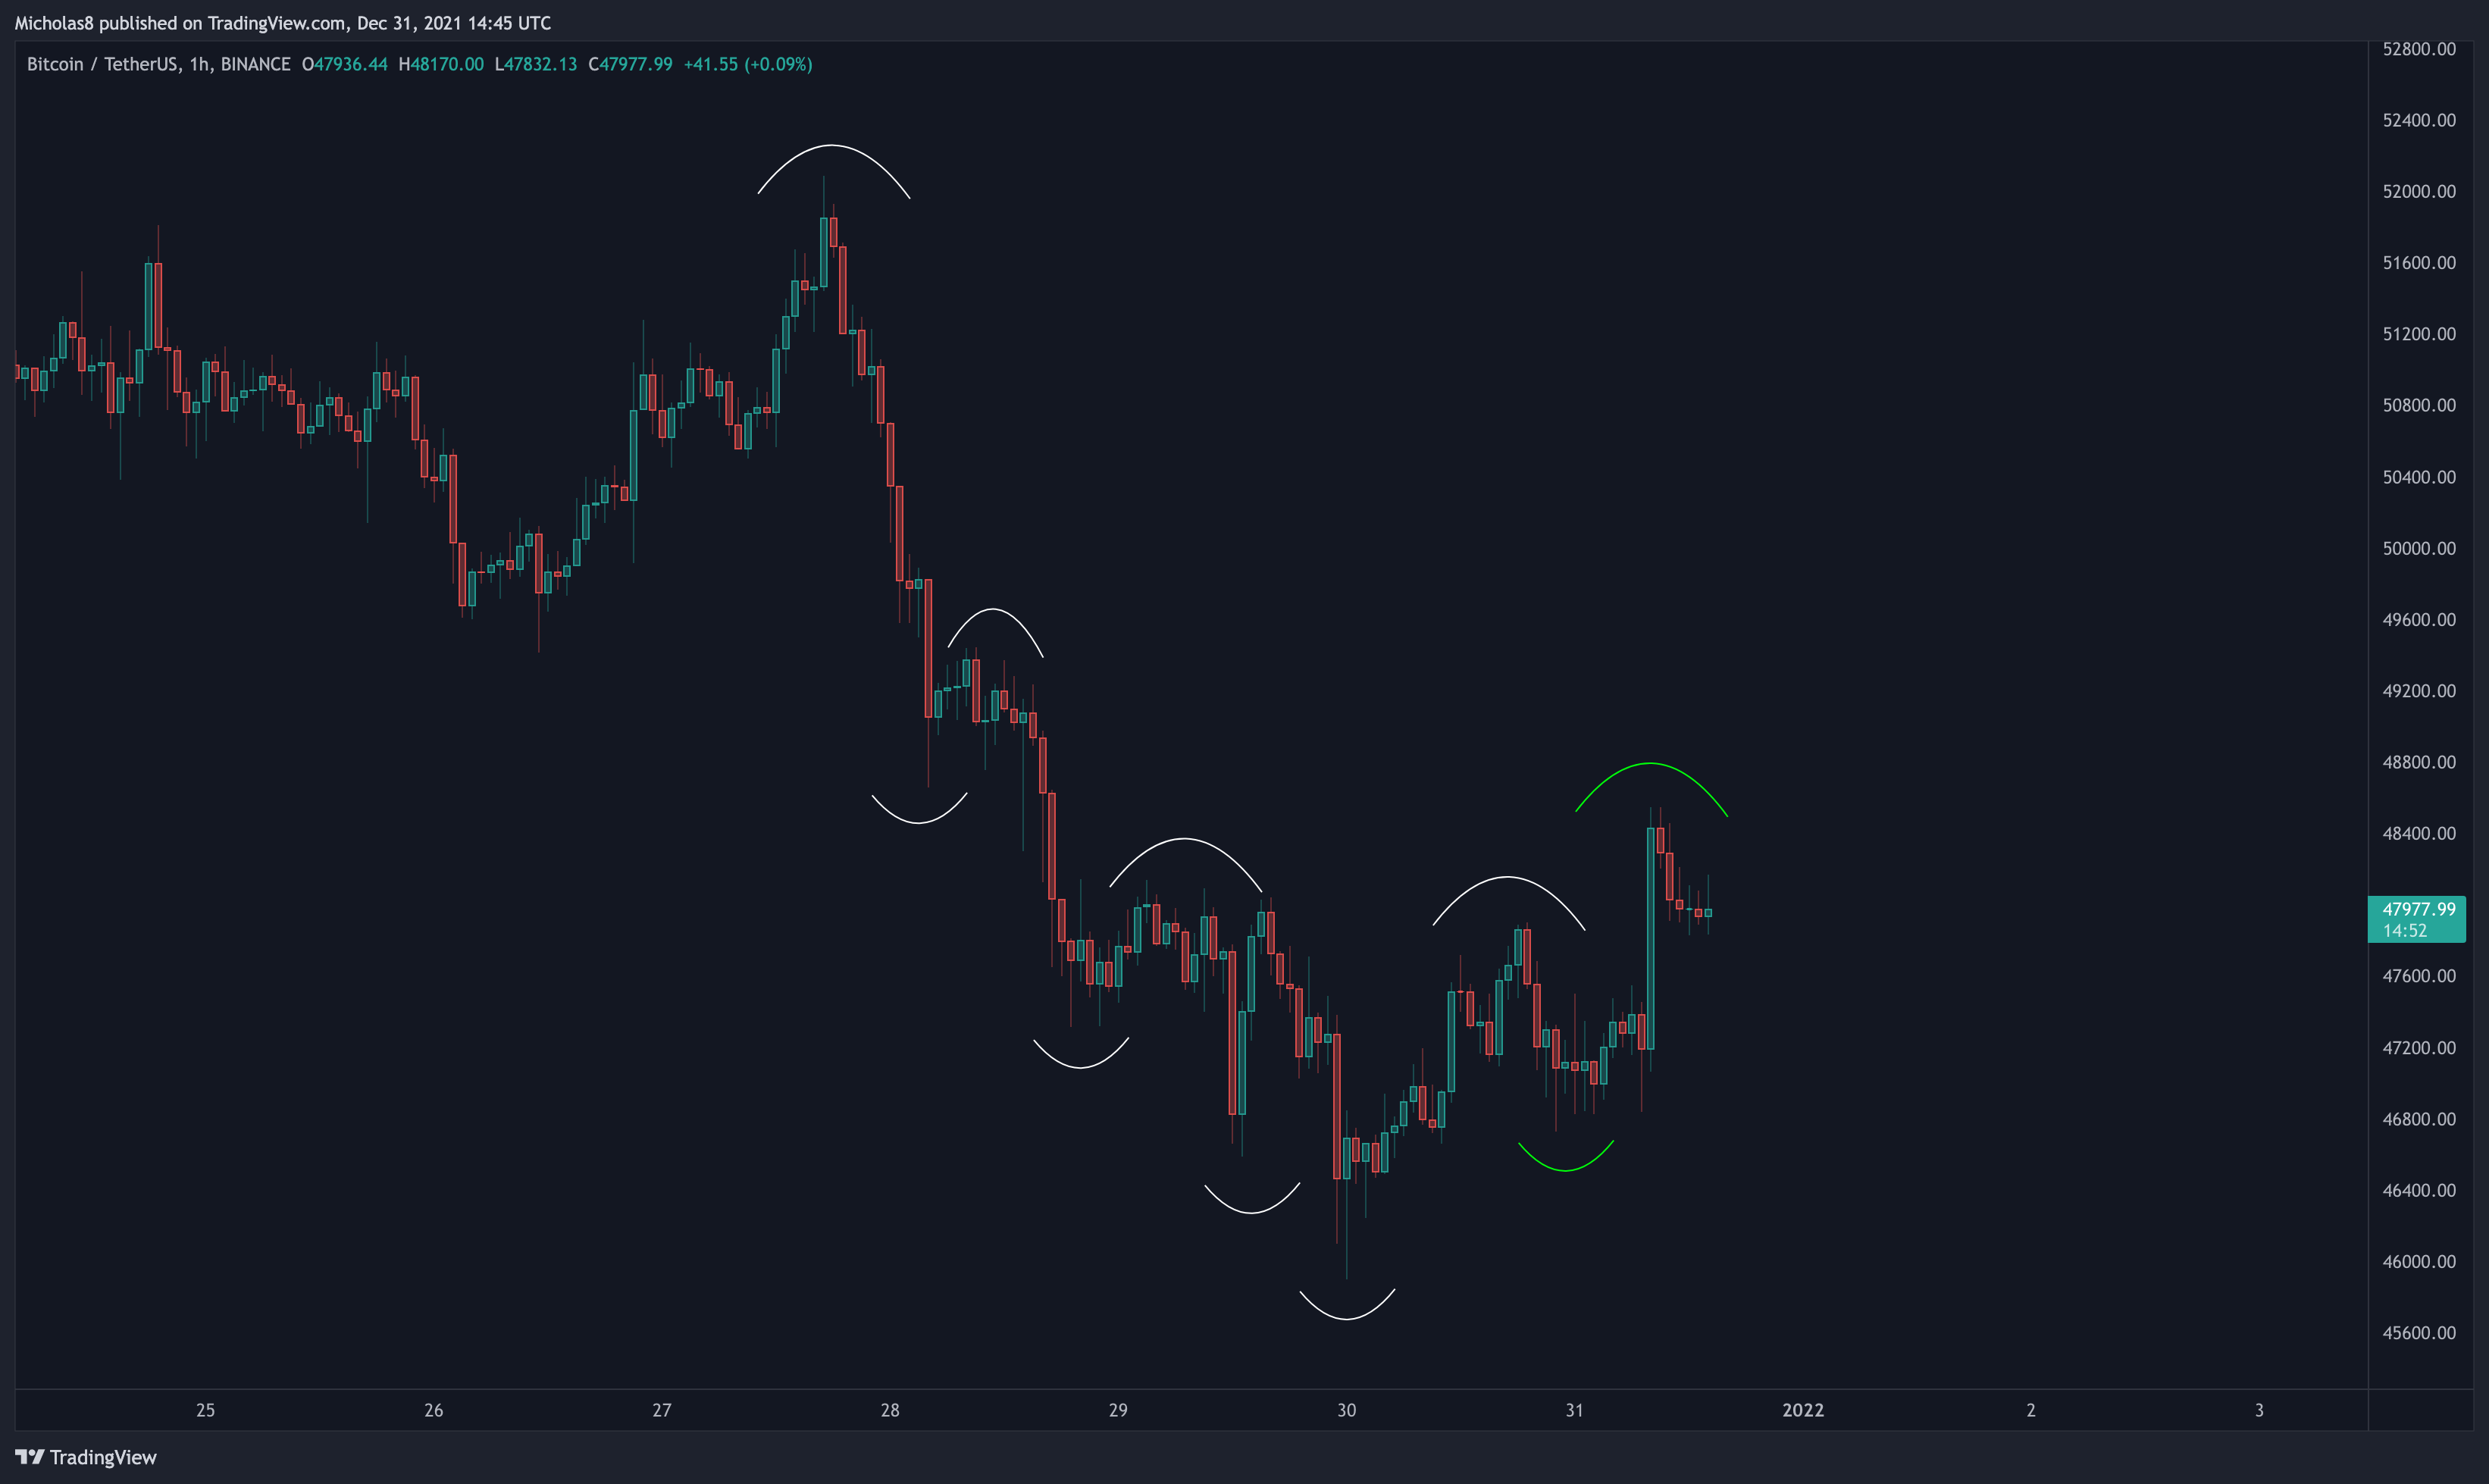
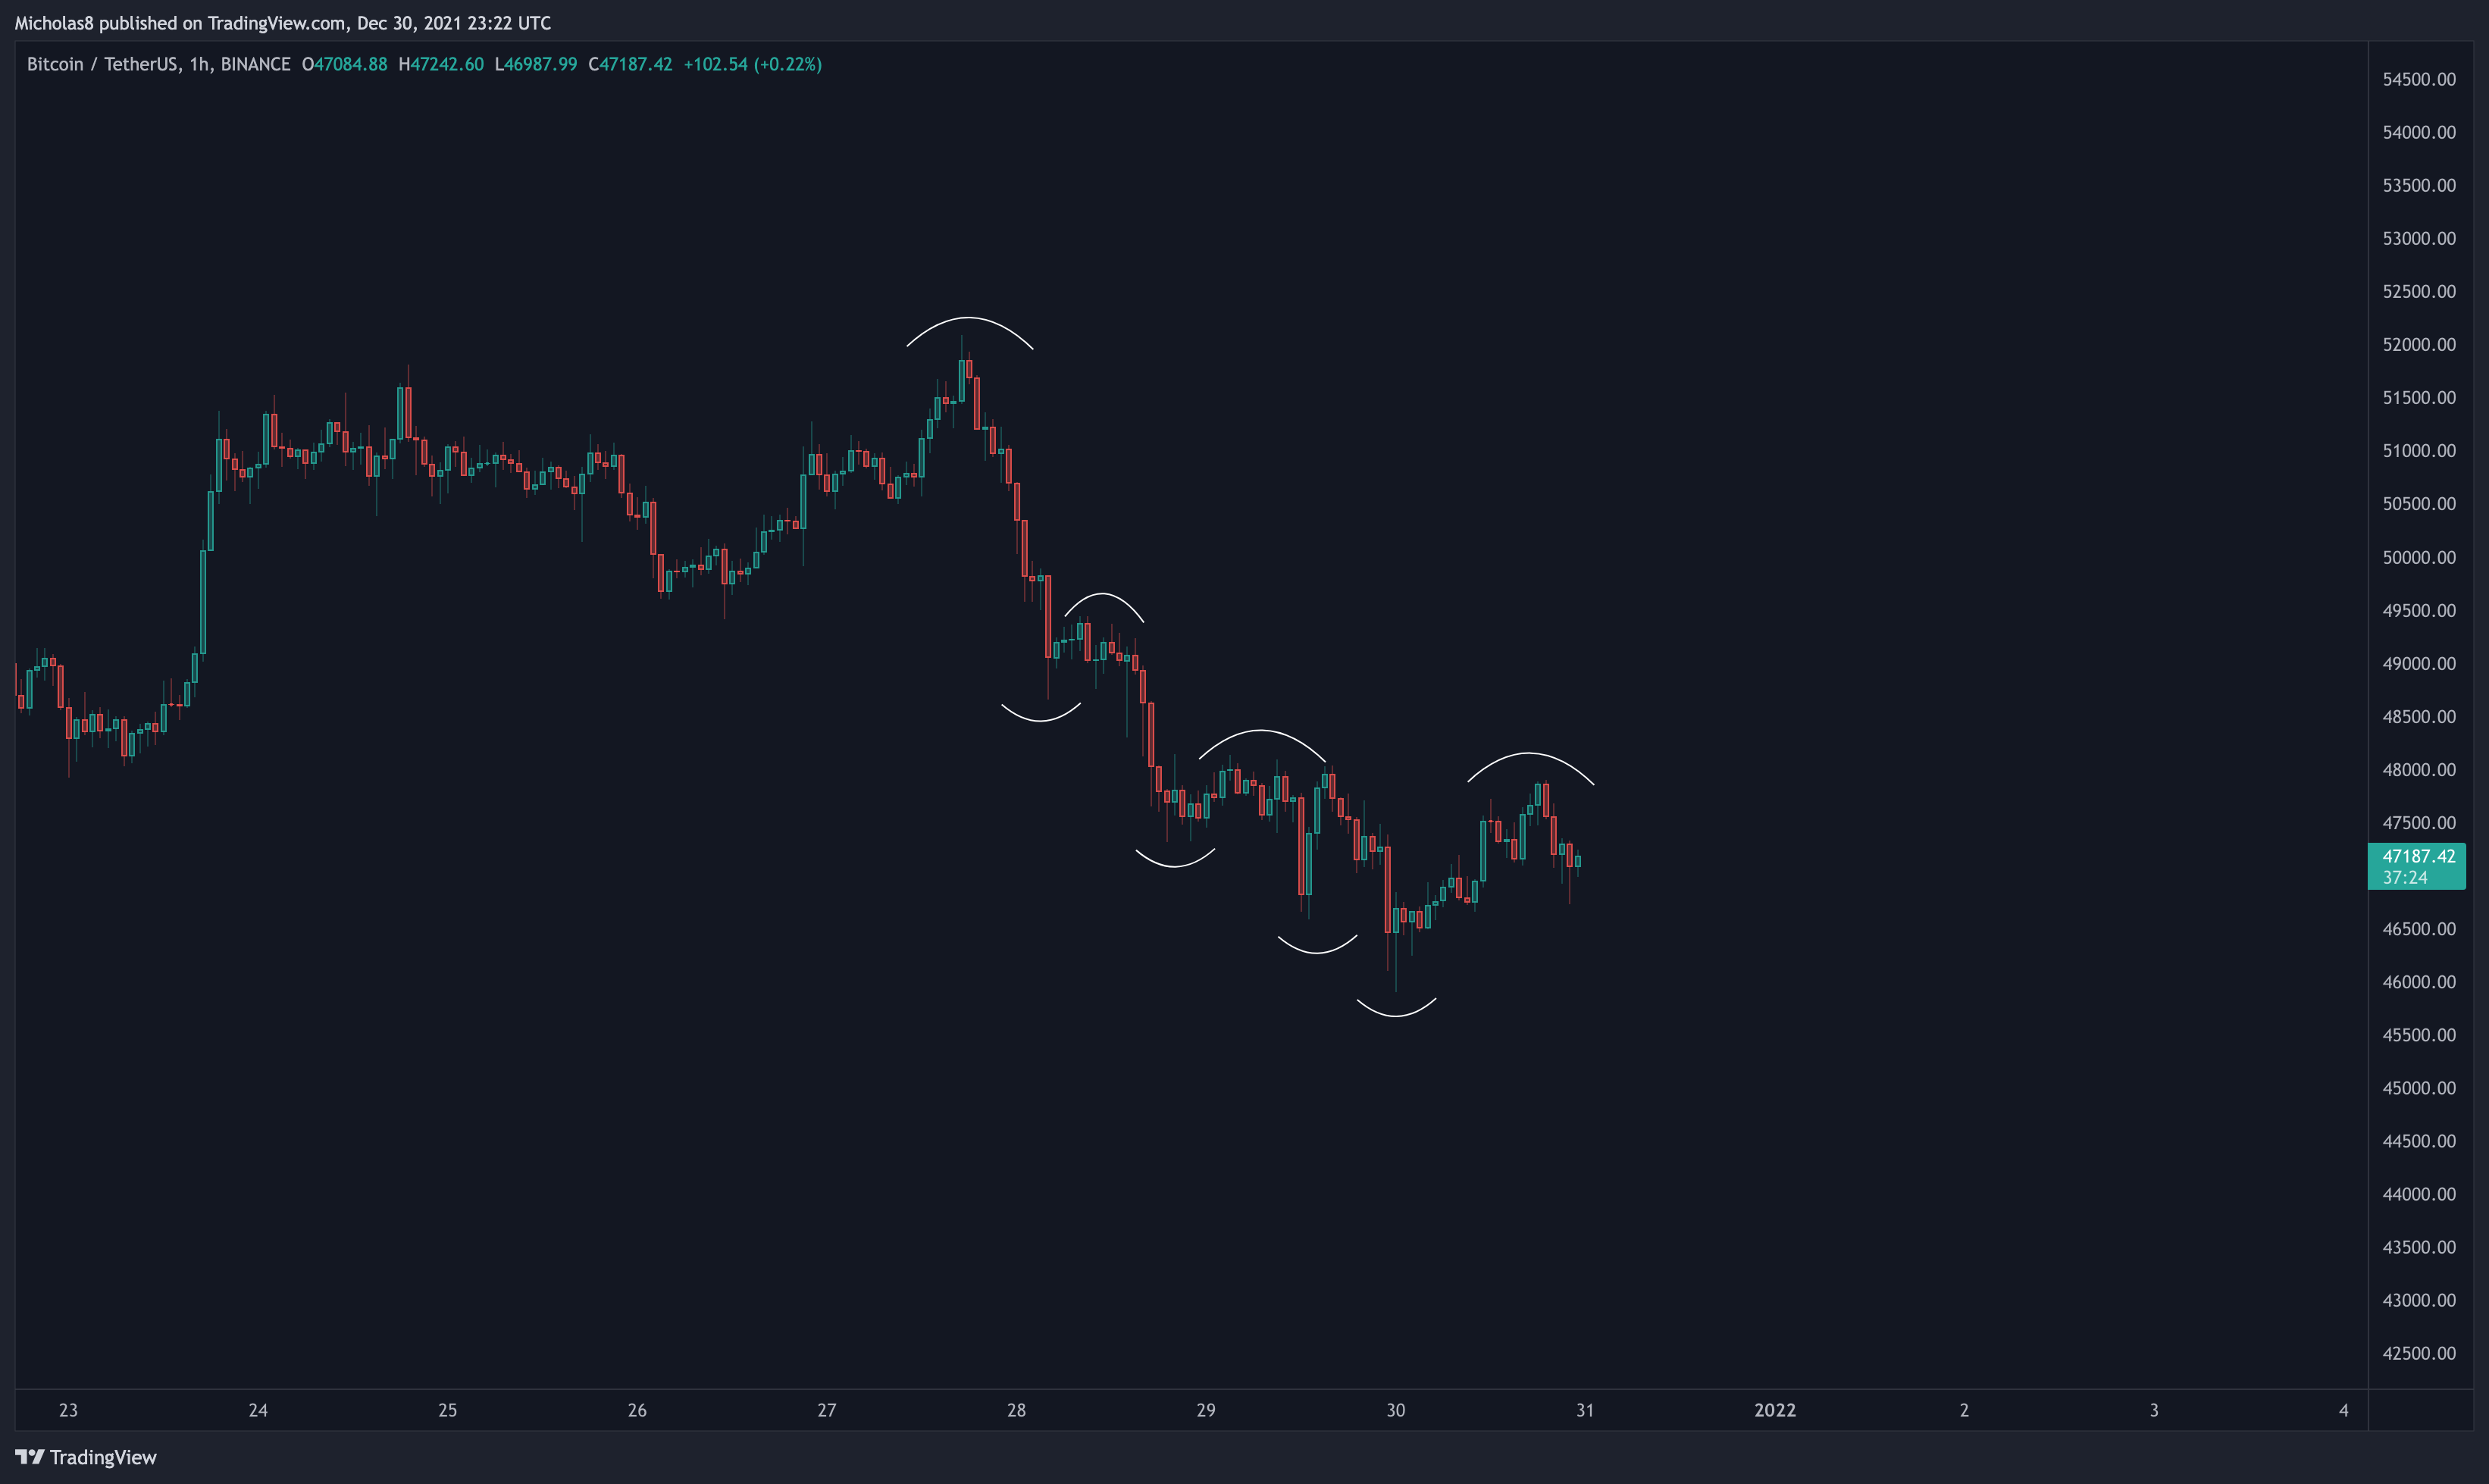
Bitcoin is finally attempting to transition into a bullish market structure on the LTF – created its first higher high and higher low. This is exactly what we need to see in order to have confidence in the local bottom being in.
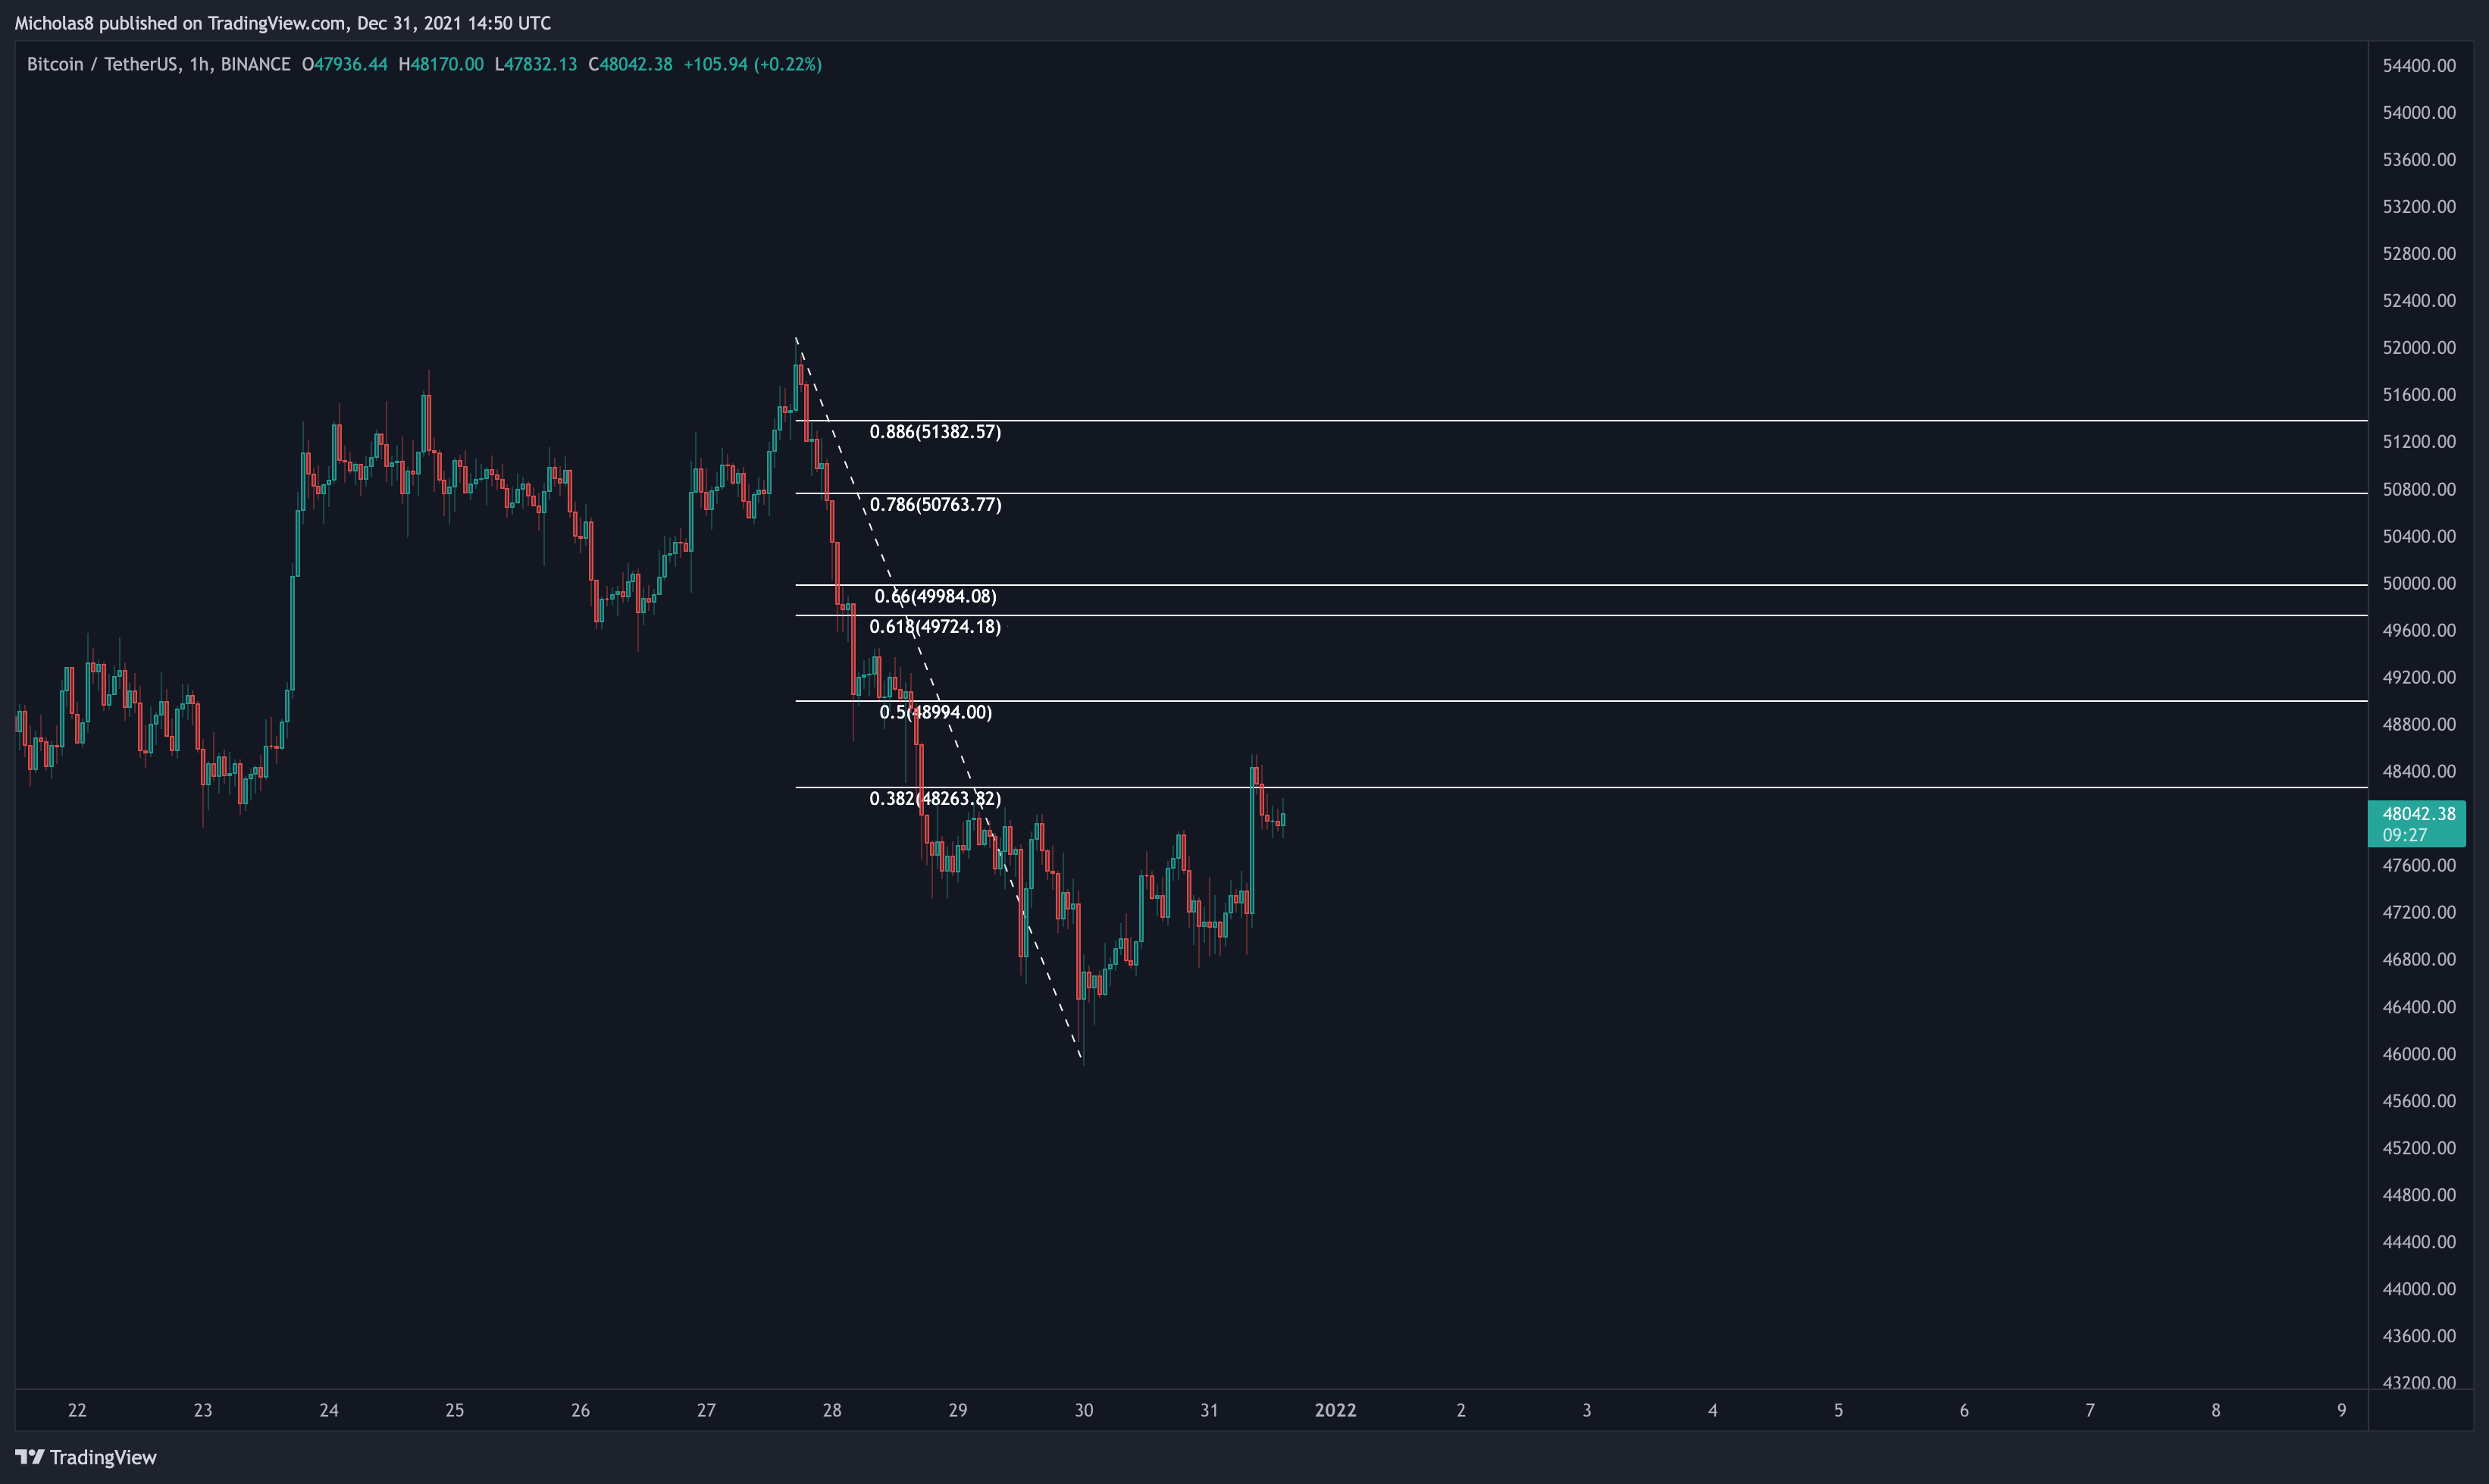
If Bitcoin continues up from here, these are the immediate levels I'm looking out for.
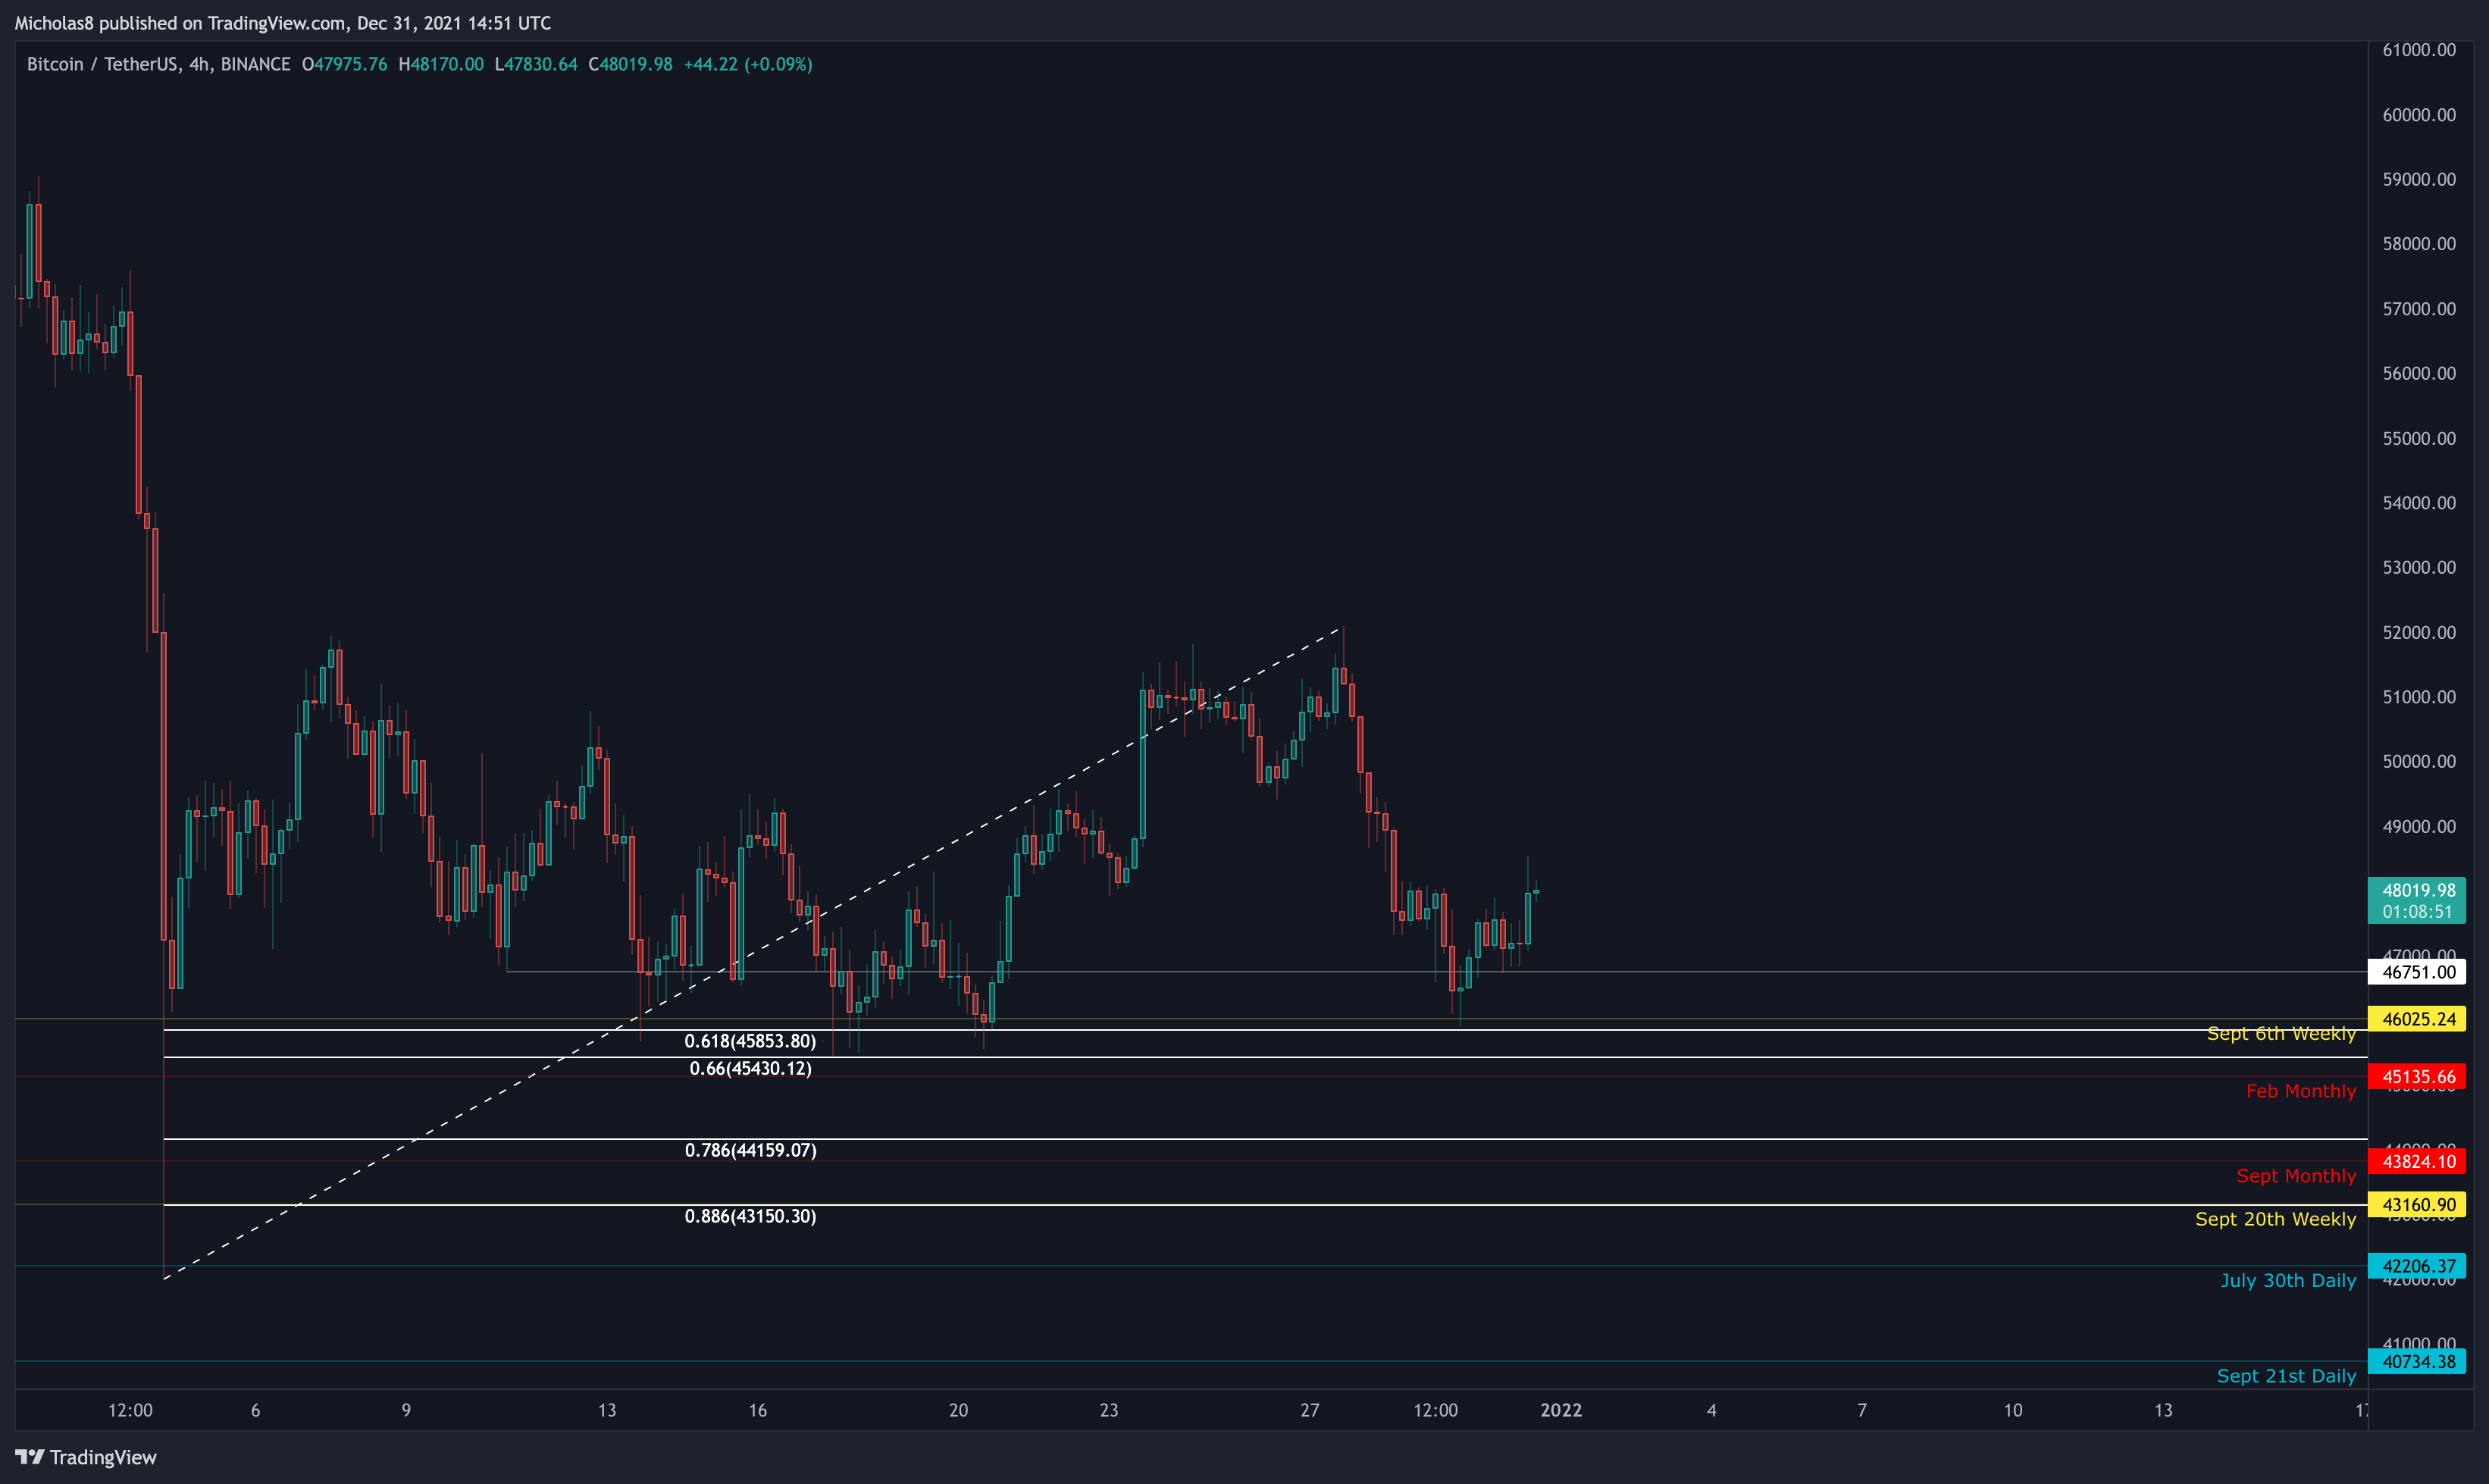
Given that we do still have 1H/4H bearish divergences, it's important to be aware of the levels below us as well that will likely act as support.
All in all, Bitcoin remains in the same position as it's been in on a macro level. On a short to medium term level, I do think it's possible we've found a short-term bottom. Or, if this isn't the bottom, it would be nice to see another 4H bullish divergence form. (If that happens, it would more than likely offer many high probability altcoin long entries.)
If you found value from this report, don't forget to like+RT the original post on Twitter. It's very much appreciated :)
Thank you for your continued support and I hope you have a great rest of your week!
Keep an eye out for tonight's monthly market report in about 8 hours.
Stay safe. Trade safe.
Cheers!